Liquid water on Mars Ron L. Levin *a , John L. Weatherwax *b a 46 Washington Avenue, Burlington, MA USA 01803 b 28B Bigelow Street, Cambridge, MA 02139 ABSTRACT Key to the possibility of Martian biology is the availability of liquid water. The issue hinges on the physics of water under an atmosphere whose total pressure is only slightly higher than the triple point of water. The general consensus, that liquid water cannot exist on the Martian surface, was first challenged 1 in 1998. This paper offers a more detailed analysis. While orbital images from Mariner 9 onward have shown evidence of ancient water flows, recent Global Surveyor and Odyssey orbiters have produced images of apparently active erosion. The 1997 Pathfinder Lander measured surface atmospheric temperatures well above freezing, while temperatures one meter higher were as low as -40° C. The low vapor capacity of the atmosphere just above the surface acts as a lid, or barrier, to evaporation. This could allow ice to melt into liquid water instead of subliming to vapor. In 2000, in a demonstration 2 made in a simulated Martian environment, water ice melted and remained liquid. However, many questions have been raised about the physics of this experiment. In this paper, numerical simulation provides values for the thermodynamic quantities controlling the phase of water. The binary diffusion coefficient of water vapor in CO 2 , and the law of binary gas diffusion are applied. Fluxes of water vapor under Martian conditions, including wind speeds, are calculated for various distances from surface ice sources. Evaporative heat loss is compared to the heat available from the sun. The paper provides the theoretical, if counterintuitive, basis for the existence of liquid water on the present Martian surface. Keywords: water on Mars, liquid water on Mars, surface water on Mars, life on Mars, Mars environment 1. INTRODUCTION Since the Viking Mission, the search for extinct and extant life on Mars has largely centered around the availability of liquid water on the surface of Mars at present and in the past. It is commonly believed that liquid water is a requirement for the existence of microbial life on Mars 3 . The discovery of microbial life on Mars would contribute significantly to the understanding of life’s origin, variability, and the capability of its propagation through space. Over the last several years, various findings have indicated the presence of water on or near the surface of Mars. Each of the two currently operating Mars orbiters has shown evidence for water in some form on the surface of Mars. In 1998 4 , the Mars Global Surveyor satellite showed images of erosion gullies along the sides of steep cliffs on Mars that, according to geologists, are no older than a million years. This is evidence of very recent, if not current, water on the surface of Mars, perhaps in liquid form. Some scientists 5 have suggested alternative explanations for these gullies such as flows of dry ice or slurries not involving liquid water. Another recent indication of water on the surface of Mars comes from the Mars Odyssey orbiting spacecraft, which carried onboard a detector (GRS) capable of counting the flux of epithermal neutrons from the surface 6 . Epithermal neutrons result from cosmic rays striking the surface. The high energy cosmic rays give rise to high energy neutrons, which are thermalized to epithermal neutrons of more moderate energies if hydrogen is present. The GRS shows large percentages of hydrogen, assumed to be water, within the top meter of the soil, the limit of its sensitivity. As much as 30% water by mass was detected. Some of this water could be at the surface because the GRS experiment is not sensitive to the depth profile of the water within the top meter. The phase of the water would be subject to the temperature at any specific site. * Currently working at MIT Lincoln Laboratory: e-mail [email protected]; phone781-272-1497; fax 781-272-1497.
Transcript
Liquid water on Mars
Ron L. Levin*a, John L. Weatherwax*b
a46 Washington Avenue, Burlington, MA USA 01803b28B Bigelow Street, Cambridge, MA 02139
ABSTRACT
Key to the possibility of Martian biology is the availability of liquid water. The issue hinges on the physics of waterunder an atmosphere whose total pressure is only slightly higher than the triple point of water. The general consensus,that liquid water cannot exist on the Martian surface, was first challenged1 in 1998. This paper offers a more detailedanalysis.
While orbital images from Mariner 9 onward have shown evidence of ancient water flows, recent Global Surveyor andOdyssey orbiters have produced images of apparently active erosion. The 1997 Pathfinder Lander measured surfaceatmospheric temperatures well above freezing, while temperatures one meter higher were as low as -40° C. The lowvapor capacity of the atmosphere just above the surface acts as a lid, or barrier, to evaporation. This could allow ice tomelt into liquid water instead of subliming to vapor. In 2000, in a demonstration2 made in a simulated Martianenvironment, water ice melted and remained liquid. However, many questions have been raised about the physics of thisexperiment. In this paper, numerical simulation provides values for the thermodynamic quantities controlling the phaseof water. The binary diffusion coefficient of water vapor in CO2, and the law of binary gas diffusion are applied. Fluxesof water vapor under Martian conditions, including wind speeds, are calculated for various distances from surface icesources. Evaporative heat loss is compared to the heat available from the sun. The paper provides the theoretical, ifcounterintuitive, basis for the existence of liquid water on the present Martian surface.
Keywords: water on Mars, liquid water on Mars, surface water on Mars, life on Mars, Mars environment
1. INTRODUCTION
Since the Viking Mission, the search for extinct and extant life on Mars has largely centered around the availability ofliquid water on the surface of Mars at present and in the past. It is commonly believed that liquid water is a requirementfor the existence of microbial life on Mars3. The discovery of microbial life on Mars would contribute significantly tothe understanding of life’s origin, variability, and the capability of its propagation through space.
Over the last several years, various findings have indicated the presence of water on or near the surface of Mars. Each ofthe two currently operating Mars orbiters has shown evidence for water in some form on the surface of Mars.
In 19984, the Mars Global Surveyor satellite showed images of erosion gullies along the sides of steep cliffs on Marsthat, according to geologists, are no older than a million years. This is evidence of very recent, if not current, water onthe surface of Mars, perhaps in liquid form. Some scientists5 have suggested alternative explanations for these gulliessuch as flows of dry ice or slurries not involving liquid water.
Another recent indication of water on the surface of Mars comes from the Mars Odyssey orbiting spacecraft, whichcarried onboard a detector (GRS) capable of counting the flux of epithermal neutrons from the surface6. Epithermalneutrons result from cosmic rays striking the surface. The high energy cosmic rays give rise to high energy neutrons,which are thermalized to epithermal neutrons of more moderate energies if hydrogen is present. The GRS shows largepercentages of hydrogen, assumed to be water, within the top meter of the soil, the limit of its sensitivity. As much as30% water by mass was detected. Some of this water could be at the surface because the GRS experiment is notsensitive to the depth profile of the water within the top meter. The phase of the water would be subject to thetemperature at any specific site.
*Currently working at MIT Lincoln Laboratory: e-mail [email protected]; phone781-272-1497; fax 781-272-1497.
The Mars Odyssey also carried an infrared experiment, THEMIS, that could measure temperatures at the surface7. Thesetemperature measurements show that, at the more moderate latitudes, daytime temperatures exceed 0°C. It has beenshown8 that, by overlaying the GRS map with the infrared map of temperature from THEMIS, there is a great deal ofhydrogen, presumed as water, even in latitudes near the equator, areas that at times exceed 0°C. These experimentalresults support the possibility of liquid water being available at the surface. However, to many, the possibility of liquidwater existing under an atmosphere only 40% greater than the triple point pressure of water seems counter-intuitive.
In this paper, computer simulation of ice, liquid water, and water vapor on the surface of Mars under an atmosphere of10 mb total pressure provides a complete, in-depth understanding of the thermodynamic balance. Quantities that can beextracted from the simulation include the rate of evaporation, the heat loss caused by this evaporation, the partialpressure of water at all locations, and the rate at which water vapor is being evolved from any ice or liquid water present.
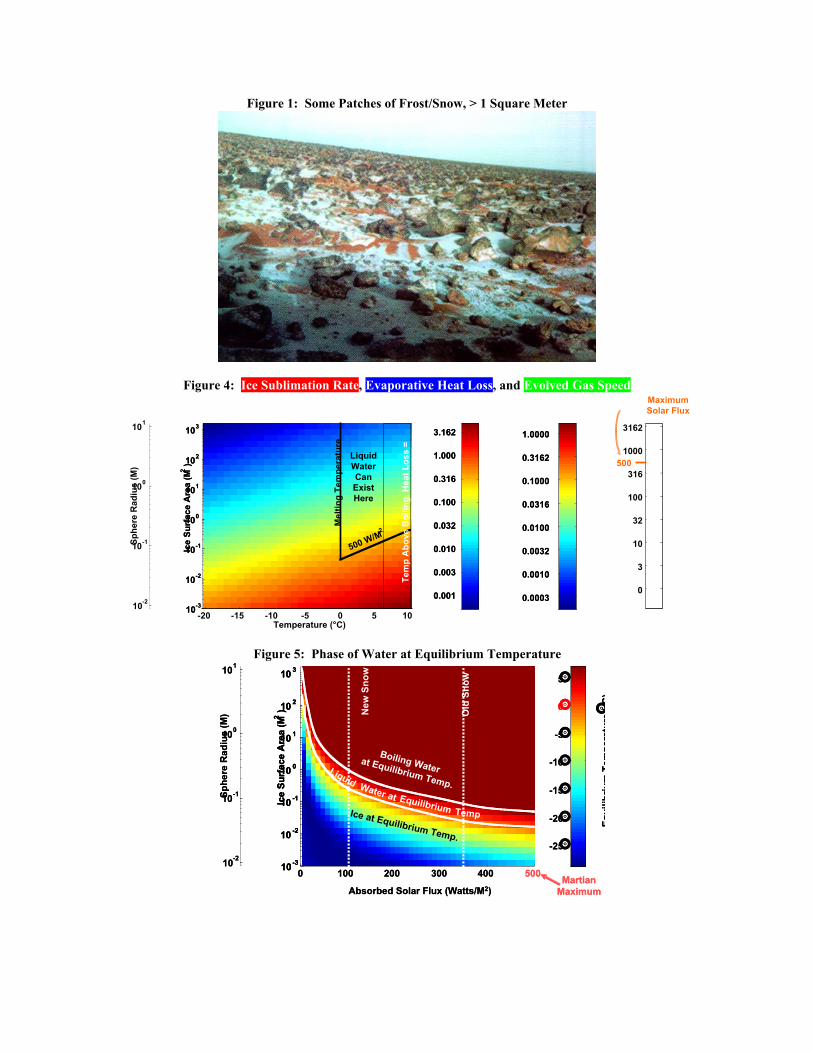
This simulation was first motivated by an observation of a sustained 273°C soil temperature made by the Viking Lander2 in 19769. Near the lander, a large amount of snow or frost was seen lasting up to 200 days (Figure 1). Visualinspection of this image indicates at least 1-2 mm of snow or frost depth. The image also shows patches of this ice thatare at least a square meter in area. This observation forms an important input to the simulation.
2. SPHERICAL MODEL
The simplest model places the ice or water on the surface of a sphere. The sphere of ice or water is suspended in aninfinite, uniform atmosphere, with Martian sunlight impinging equally at all points of the sphere at the flux and intensitymeasured on Mars. This model reduces the problem to a single dimension, that of the distance away from the center ofthe sphere. Since wind breaks the spherical symmetry and reduces the cylindrical symmetry, its effects will be omittedhere, but discussed later in the paper.
The other assumptions are shown in Figure 2. The partial pressure of water immediately surrounding the sphere isdetermined by the temperature of the sphere. A fast, thermodynamic equilibrium occurs between the ice or liquid phaseand the vapor immediately adjacent. The rest of the model is based on the rate at which water vapor diffuses away fromthe sphere. This depends on binary diffusion, the diffusion of one gas through another. For purposes of this model, thetwo gases are water vapor and carbon dioxide. As fast as the water diffuses away from the immediate surroundings ofthe sphere, it is replaced by new water vapor evaporating from the ice or water. The rate of evaporation is thuscontrolled by the speed at which water vapor diffuses away from this spherical surface.
Figure 2: Spherical Model for Evaporation of Ice or Water
Sun
Iceor
Water
• Suspended Sphere of Ice (or Water)– Uniform radius
– Uniform temperature
• Atmosphere– Infinite and uniform
– Pure CO2
– No other sources of humidity
– 10 mb total pressure
– No wind
• Solar Illumination– Uniform around ice (or water) sphere
– Constant in time
– <= 500 w/m2
With spherical symmetry the problem has one dimension: R
Assumptions:
R
Because this model has been greatly simplified and exists in only one dimension, it is possible to solve for theevaporation rate and to model all properties of this process with analytical equations. Equation 1 is Fick’s First Law ofDiffusion for steady state processes.
Eq. 1
This law states that the Laplacian of the distribution of water vapor must be 0 everywhere, except at the surface, wherethere is a boundary condition. Equation 2 shows the same equation where spherical symmetry is assumed.
Eq. 2
Equation 3 shows the solution to this differential equation.
Eq. 3
The concentration of water vapor is subject to a 1/r distribution that decreases with increasing distance from the sphere.The boundary condition at the surface of the sphere requires that, when the radial distance is equal to the radius of thesphere (R), the concentration of water vapor must equal that required by the evaporation equilibrium.
The flux of water vapor diffusion can now be written in closed form, and this current of water vapor is shown inEquation 4. The current has a 1/r2 distribution.
Eq. 4
Equation 5 shows the integrated total outward flux of water vapor, which is the integral over any Gaussian surfaceenclosing the sphere.
Eq. 5
The surface shape does not matter as long as the sphere is completely contained within this closed surface. The resultshows that the total flux depends on the concentration of water at the surface of the sphere, which depends on thetemperature, the diffusion coefficient, and the radius of the sphere.
Equation 6 shows the total flux per unit area at the surface of the sphere. The outward loss of water per unit area isproportional to 1/R, where R is the radius of the sphere.
Eq. 6
The larger the radius of the sphere, the more slowly water will evaporate. This is because, in a large sphere, a great dealof evaporating water vapor is competing for the same atmosphere in the immediate vicinity. This inhibits the escape ofthe vapor. The value10 for the heat of sublimation, in which ice passes directly to water vapor, is 2596 Joules per gram.This value is very close to that of the heat of vaporization. The flux per unit area can be turned into heat loss per unitarea by multiplying the flux by the heat of sublimation.
To complete the model, it is necessary to look up the steam table data11 on the partial pressure of water immediately inthe vicinity of ice or water as a function of temperature. The relevant portion of this curve is shown in Figure 3.
This curve shows the vapor pressures for temperatures from -20°C to +7°C. Across this range of temperatures, the vaporpressure of water rises from 1_ millibars to 10 millibars. The boiling point for water on the surface of Mars is 7°C. Theconcentration of water vapor in the atmosphere is directly proportional to partial pressure of water and may be calculated
02 =— WaterC
02 =˜¯
ˆÁË
ÊWaterC
drd
rdrd
r
RRCrC WaterWater )()( =
rr
RRDCCDj WaterWater ˆ)(
2=—-=
)(4 RRDCWaterp
R
RDCWater )(
Figure 3: Water Vapor Pressure at the Surface of the Ice or Water
from the ideal gas law. The concentration of water vapor rises quite rapidly as a function of temperature. This meansthat the rate of evaporation increases strongly with the temperature. At the melting point 0°C, the partial pressure ofwater vapor is 6.1 millibars, the so-called triple point pressure (compared to 10 millibars total pressure).
Immediately adjacent to any liquid water or ice melting into liquid water, the atmosphere must be at least 6.1/10, orapproximately 60% water vapor and only 40% CO2. Water at a temperature greater than 0°C has an even higherconcentration of vapor immediately adjacent to it. The transport of water vapor away from the immediate vicinity of thesphere is controlled by the binary diffusion coefficient for the gases carbon dioxide and water vapor. AlthoughBerezhnoi and Semenov12 provide a large number of binary diffusion coefficients between CO2 and a variety of gases,the binary diffusion coefficient for water with carbon dioxide is not listed. It was, therefore, calculated.
Table 1 provides a matrix of values surrounding the desired value for water and carbon dioxide. A least squares fit in thedimensions shown provides the best value for the binary diffusion coefficient between water and carbon dioxide: 1.53times 10-5 m2/sec, at room temperature and pressure. The book lists a correction formula that permits converting thebinary diffusion coefficient from room temperature and pressure to that of Martian temperature and pressure. The mostimportant correction is that for atmospheric pressure, 100 times lower on Mars than on Earth, raising the binary diffusioncoefficient by a factor of 100. The temperature change provides a minor correction. The net result is a binary diffusioncoefficient of 1.33 x 10⁻³. This formula is shown in Equation 7.
Table 1: Binary Diffusion Coefficients
H2 He N2 CO2
Water 88.5 84.5 25.3 15.3Methyl Alcohol 61 16.9 10.4Ethyl Alcohol 46.5 49.9 13.6 8.2 x 10⁻⁶
With all constants determined, this analytical model can now generate numeric results. Figure 4 (using the left-handscale) shows the rate of sublimation in mm/hr. This is calculated at different temperatures for the ice or water if thetemperature is above 0°C, and for differing surface areas. The larger the surface area of the ice, the more slowly it
3
5.11
6
5.1
0
1
0
0 1033.115.300
273
1000
10103.15),( ?
?
?
?
????
????
????
????
????
?
????
????
????
?? x
K
K
mb
mbx
T
T
P
PDTPD
sublimes. The higher the temperature, the more rapidly ice sublimes. For 10-3 m2 ice surfaces at 0°C, ice can sublime atthe rate of a millimeter of depth per hour. For a one square meter patch of ice at 0°C, the sublimation rate isapproximately 0.1 mm/hr. This sublimation rate can be converted into a flux of evolved gas at the surface of the sphereas can be seen on the center scale in Figure 4. For ice surfaces as small as 10 cm2, the velocity of the flux can be as highas 1 cm/sec.
More important than these calculations are the ones for evaporative heat loss also shown in Figure 4 on the right-handscale. The color indicates the evaporative heat loss per unit area under each condition. These calculated values rangefrom approximately 1/3 of a watt per square meter to 3,000 w/m2. At 0°C, for a surface area of ice of one m2, theevaporative heat loss is approximately 60 w/m2. This is much less than the maximum solar flux that could be receivedon Mars of 500 w/m2 13. A line is drawn on this figure at 0°C, the melting temperature of ice and along the contour of500 watts per square meter. The upper right hand portion of this plot shows conditions under which liquid water exists.Anywhere in this region it is possible for the energy provided by the sun to equal or exceed the energy lost byevaporation and, thus, be able to maintain the water at a temperature above 0°C.
This observation shows that for larger areas of ice, underneath bright sunlight, the temperature can be raised above 0°Csince the Sun’s heat input can exceed heat lost due to evaporation. Another way of showing this is by plotting theequilibrium temperature of the ice or liquid water under varying amounts of solar illumination. This equilibriumtemperature is defined as the temperature at which heat loss from evaporation would equal heat gain from solarillumination. This result is shown in Figure 5. The solar flux in w/m2 starts at 0 and goes up to 500, the maximumpossible on Mars. The color indicates the equilibrium temperature. Dark blue is -25°C and bright red is 7°C, themaximum possible equilibrium temperature.
At 7°C, water boils on Mars and, therefore, the evaporative heat loss will be whatever is necessary to remove all thesolar input if the temperature tries to exceed 7°C. Almost half of this plot shows an equilibrium temperature at theboiling point. The equilibrium temperatures for all solar fluxes are calculated.
The lower white contour line is for 0°C. Equilibrium temperatures above this 0° contour indicate liquid water. Theupper contour line is for 7°C. All conditions above this contour indicate boiling water, a mixture of liquid with steamarising. Eventually all water would boil away. In other locations on this plot, all water or ice would eventuallyevaporate, but that equilibrium would take hours to achieve. In the meantime, the equilibrium condition is divided intothree results: solid ice, liquid water, and boiling water.
Two dotted vertical lines are shown on this plot. They represent the amount of sunlight that would be absorbed if therewere no atmospheric absorption and the incident surface directly faced the sun. The line at 100 w/m2 is for new snow,which has an absorption of 20%14. The vertical line at 350 w/m2 is for old snow. It is important to remember that theseabsorption figures could be lower if the atmosphere absorbs to an appreciable extent, or if the incident angle of sun is notperpendicular.
Important limits on the solar absorption in the atmosphere can be determined by examining experimental data from thepower output of the Mars Pathfinder solar cells. The efficiency of these solar cells is well known, as is the angle ofsunlight incident upon them. The data for their power production can be used to estimate the absorption by theatmosphere. Figure 6 shows the boiling rate for water at Martian pressure of 7°C. When water is boiling, the rate ofwater dissipation will the amount necessary to dissipate the heat provided. The absorbed solar flux divided by the heatof vaporization provides the depth of water that would boil away from a surface. This is independent of the size or thesurface area of the water.
Liquid water on the surface of Mars receiving the maximum possible sunlight would boil away at the rate of 0.8 mm/hr.The spherical model indicates that, for the size of snow patches seen in the Viking Lander 2, an illumination of only 100w/m2 is probably sufficient to cause melting into liquid if no wind were present. This spherical model is conservativebecause it is the most favorable geometry for evaporation. If the ice surface were distributed on a flat plain instead, therewould be a slightly reduced volume of atmosphere adjacent or in the near vicinity to absorb the water vapor, andevaporation would be reduced, increasing the prospects for liquid water.
Figure 6: Water Boiling Rate at 7°C
4. CYLINDRICAL MODEL WITH SIMULATED UNIFORM WIND
A more realistic simulation of evaporating ice on the surface of Mars is shown with a cylindrical model. This permitsintroduction of the effect of wind. Wind increases evaporation by transporting water vapor away from the area ofevaporation, causing the ice or liquid to replace the vapor more rapidly. In effect, the wind is a mechanism fordistributing the water vapor to a larger volume of air more rapidly. The concept behind this simulation is shown inFigure 7.
Figure 7: Cylindrical Numeric Model for Evaporation of Ice or Water
An infinitely long impervious cylinder of radius R is envisioned, in which a small, segment has been replaced by ice orwater. A constant uniform wind is blowing in the direction of the length of the cylinder. This provides a smooth,laminar flow, moving at constant velocity along the cylinder. Calculations can then be made at a variety of simulatedwind speeds. All other assumptions are listed in this figure.
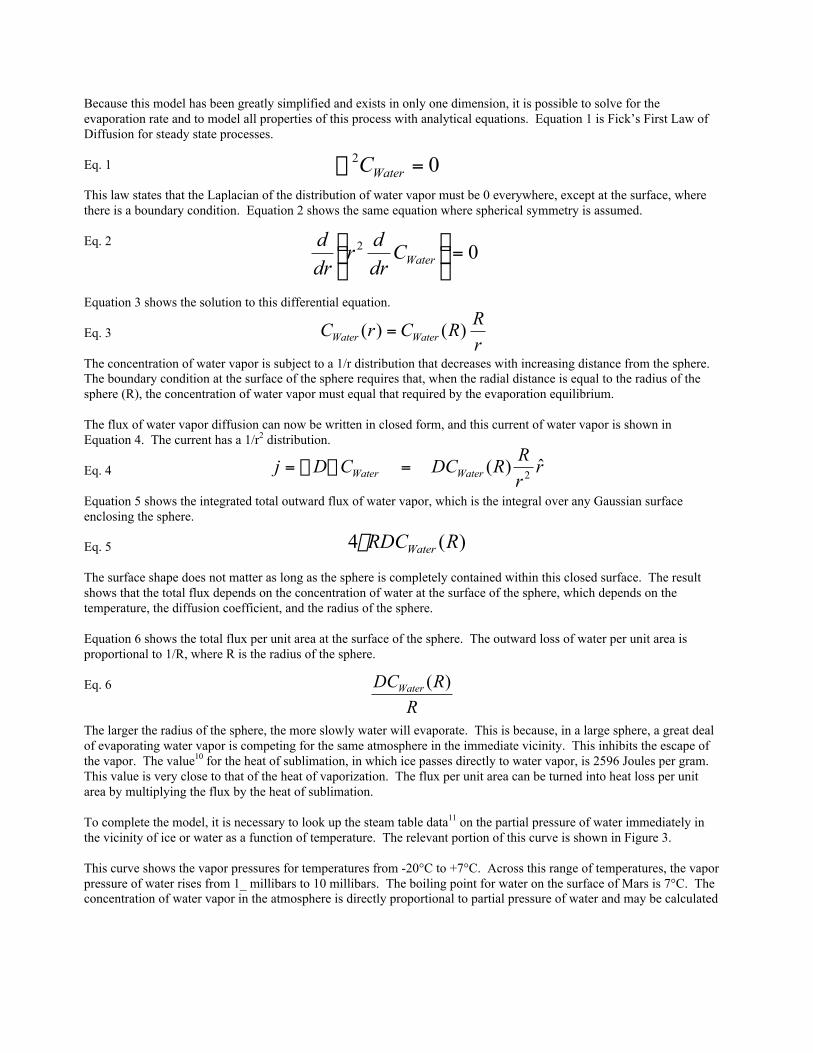
This problem now becomes a two-dimensional one, with both a radial dimension, R, away from the cylinder and a Zdimension along the cylinder in, or against, the direction of the wind. Equation 8 shows the steady state law of diffusionin the cylindrical geometry with the two variables R and Z.
Eq. 8
Because under the boundary conditions, this equation cannot be readily solved in closed form, this partial differentialequation will be solved numerically on a discretized grid above the cylinder. The current of water vapor in thiscylindrical geometry is shown in Equation 9.
Eq. 9
This permits conversion of the solution for the concentration of water vapor from the numeric model into a numericmodel for the flux of water vapor. Equation 10 shows the total output of water vapor numerically integrated over aGaussian surface completely enclosing the water or ice.
Eq. 10
Equation 11 shows this total flux divided by the total surface area of the ice or water.
Eq. 11
This total calculated flux of water vapor is multiplied by the “heat of sublimation” (2596 J/g) to produce the simulatedheat loss.
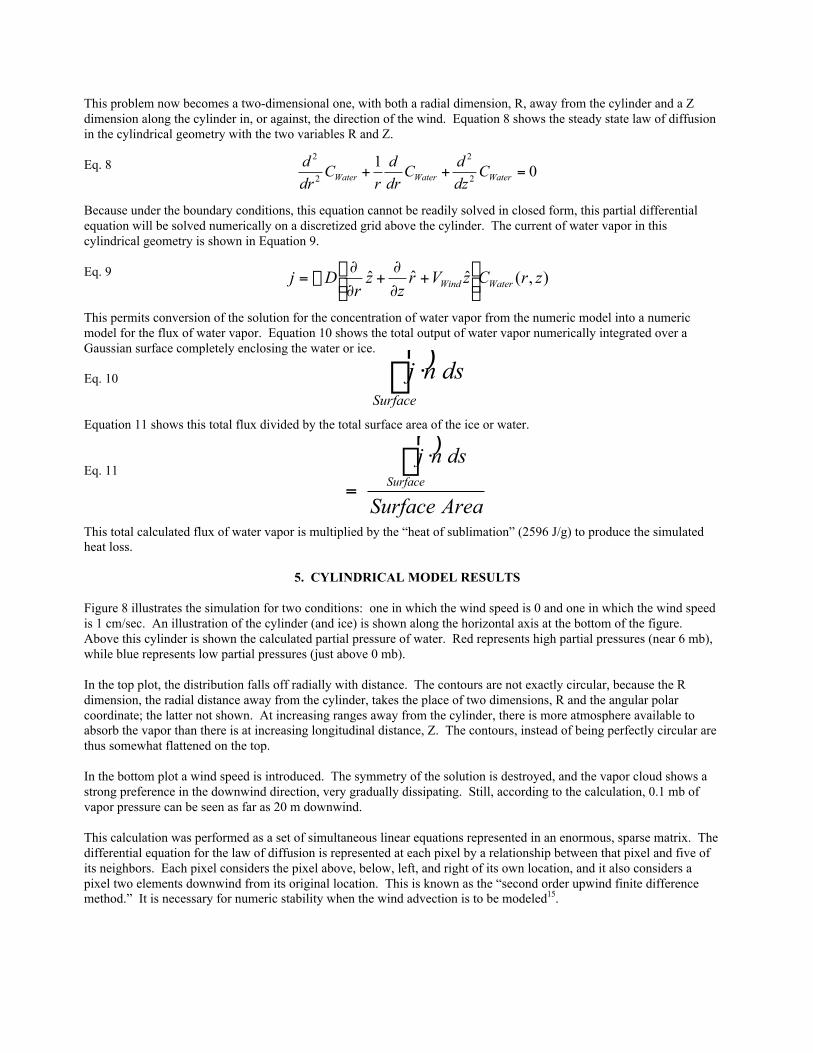
5. CYLINDRICAL MODEL RESULTS
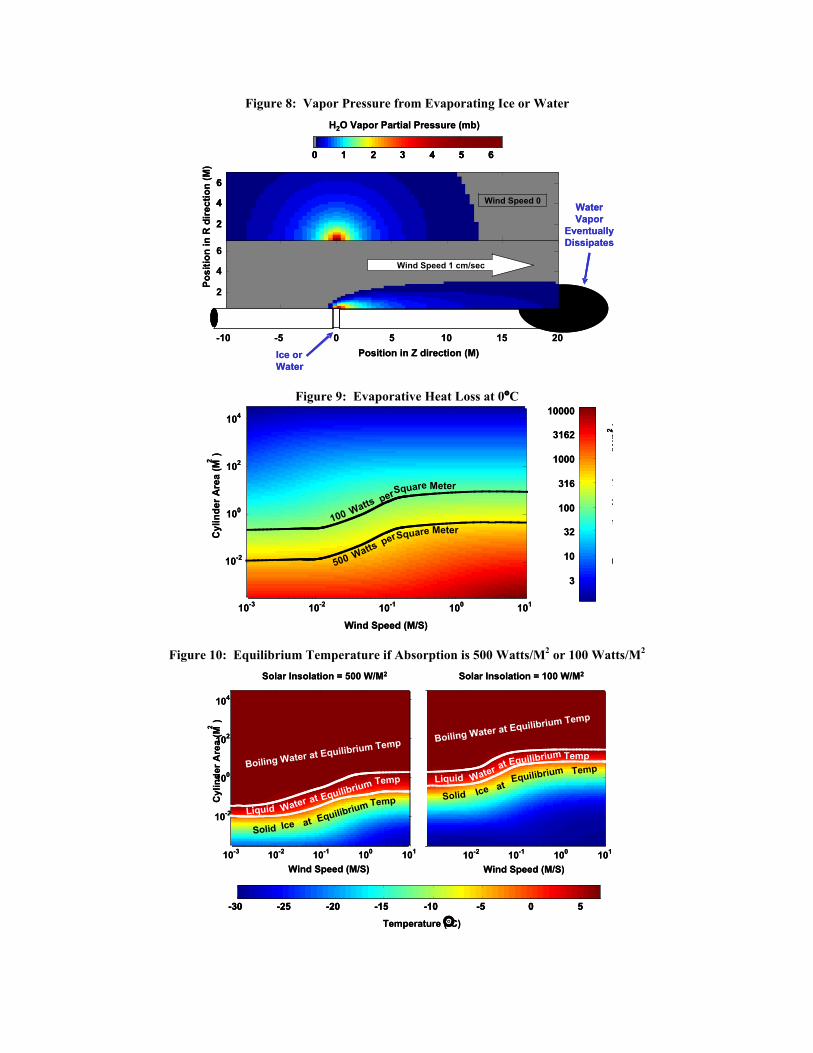
Figure 8 illustrates the simulation for two conditions: one in which the wind speed is 0 and one in which the wind speedis 1 cm/sec. An illustration of the cylinder (and ice) is shown along the horizontal axis at the bottom of the figure.Above this cylinder is shown the calculated partial pressure of water. Red represents high partial pressures (near 6 mb),while blue represents low partial pressures (just above 0 mb).
In the top plot, the distribution falls off radially with distance. The contours are not exactly circular, because the Rdimension, the radial distance away from the cylinder, takes the place of two dimensions, R and the angular polarcoordinate; the latter not shown. At increasing ranges away from the cylinder, there is more atmosphere available toabsorb the vapor than there is at increasing longitudinal distance, Z. The contours, instead of being perfectly circular arethus somewhat flattened on the top.
In the bottom plot a wind speed is introduced. The symmetry of the solution is destroyed, and the vapor cloud shows astrong preference in the downwind direction, very gradually dissipating. Still, according to the calculation, 0.1 mb ofvapor pressure can be seen as far as 20 m downwind.
This calculation was performed as a set of simultaneous linear equations represented in an enormous, sparse matrix. Thedifferential equation for the law of diffusion is represented at each pixel by a relationship between that pixel and five ofits neighbors. Each pixel considers the pixel above, below, left, and right of its own location, and it also considers apixel two elements downwind from its original location. This is known as the “second order upwind finite differencemethod.” It is necessary for numeric stability when the wind advection is to be modeled15.
AreaSurface
dsnjSurface
)rÚ ⋅
=
01
2
2
2
2
=++ WaterWaterWater Cdz
dC
dr
d
rC
dr
d
dsnjSurface
)rÚ ⋅
),(ˆˆˆ zrCzVrz
zr
Dj WaterWind ˙̊˘
ÍÎ
È +∂
∂+
∂
∂-=
In the general volume of the calculation, the differential calculation previously discussed is reduced to a linear equationamong these six pixels, the central pixel and its five neighbors. Each pixel in the simulation provides an additional linearequation tying together itself and its five neighbors. Therefore, a linear equation exists for each pixel in the simulation.These linear equations are arranged in a square, sparse matrix where the horizontal and vertical dimensions are each thesize of the number of pixels in the entire simulation. For example, if this two dimensional simulation included a volumeof 256 longitudinal pixels and 256 radial pixels, the entire simulation would consist of 65,000 pixels. This would requirea matrix that was 65,000 by 65,000 elements or 4.3 billion matrix elements. Fortunately, only about 400,000 elementsare non-zero.
The differential equation at the edges of the simulation is modified to take into account the boundary conditions. Alongthe top, and the left and right edges, the boundary condition is that the vapor pressure should be equal to the averagevapor pressure on Mars, which for this calculation was taken to be 0. Therefore, the differential equation solution will be0 on the left, right, and top of this simulation. On the bottom of the simulation, over the portion where the ice or waterexists, the partial pressure of water is set to the value derived from the steam table based on the surface temperature ofthat ice or water.
Along the rest of the cylinder, the boundary condition states that water vapor will neither be diffusing into, or out of, thecylinder, which means that the component of the gradient of water vapor normal to the surface of the cylinder must be 0.With that boundary condition and the others just discussed, the complete set of linear equations for all pixels is defined.Their coupled linear equations represented in the matrix are solved by Gaussian Elimination. The result is a partialpressure of water vapor for each pixel, as shown in the Figure 8.
Both Viking and Pathfinder landers measured wind speed16,17, showing that wind speeds were generally only a fewkm/hr. Wind speeds during the day were generally below 10 km/sec. The numeric model was run for wind speedsbetween 0 and 10 m/sec. The results in terms of evaporative heat loss are shown in Figure 9.
In this figure, the horizontal axis shows the wind speed, and the vertical axis shows the area of the cylindrical surface ofthe ice or snow. The color indicates the heat loss in terms of w/m2 if the surface of ice were at 0°C. This plot showsevaporative heat losses between 1 and 10,000 w/m2. Two black contours show the evaporative heat losses for 500 w/m2
and 100 w/m2. As can be seen, areas of ice of only a few m2 have evaporative heat losses less than 100 w/m2, even at awind speed of 10 m/sec.
Another way of looking at this is to assume a value for the solar flux absorbed and ask what would the equilibriumtemperature be for this ice/water mixture (when the evaporative heat loss exactly equals the insolation gain). The resultis shown in Figure 10 for insolation values of 500 and 100 w/m2. On each plot, contours are shown in white for 0°C and7°C. These contours divide the plots into three regions, one in which the phase at the equilibrium is solid ice, one inwhich it is liquid water, and one in which it is boiling water. In the final analysis, the phase of water at the equilibriumtemperature depends on the surface area, wind speed and solar insolation. In general, there are many regions in whichthe equilibrium temperature would result in liquid water.
6. THE MARTIAN COLD TRAP
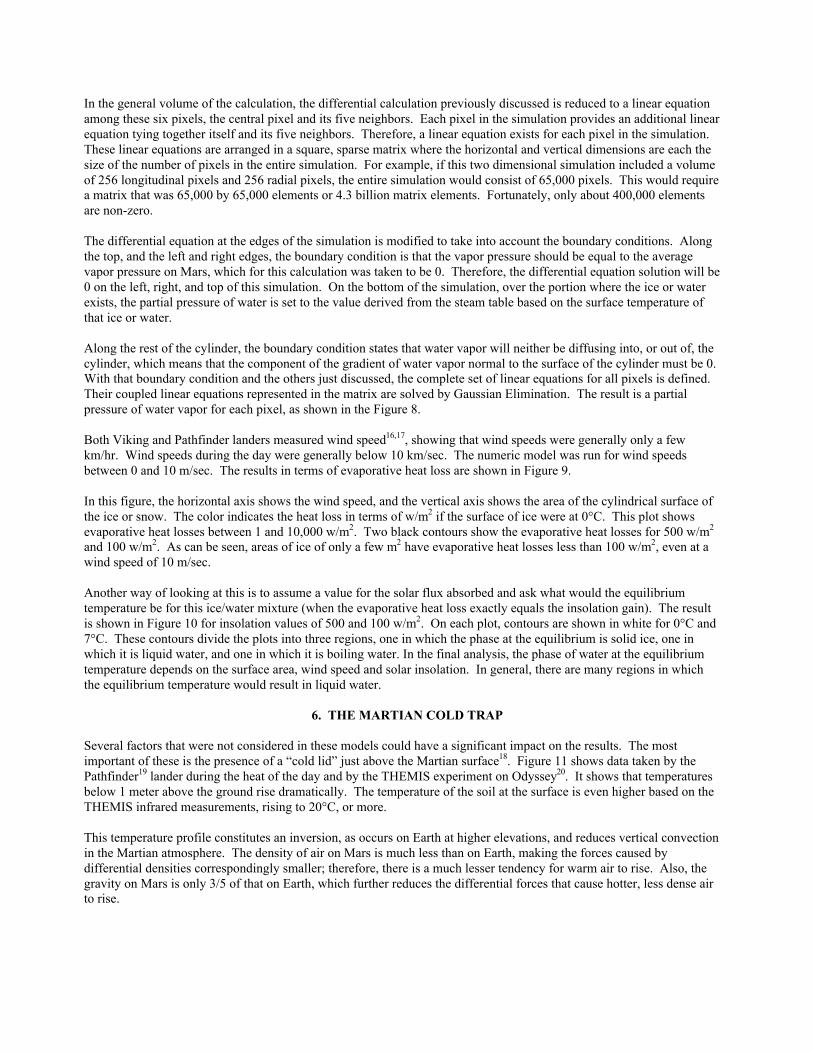
Several factors that were not considered in these models could have a significant impact on the results. The mostimportant of these is the presence of a “cold lid” just above the Martian surface18. Figure 11 shows data taken by thePathfinder19 lander during the heat of the day and by the THEMIS experiment on Odyssey20. It shows that temperaturesbelow 1 meter above the ground rise dramatically. The temperature of the soil at the surface is even higher based on theTHEMIS infrared measurements, rising to 20°C, or more.
This temperature profile constitutes an inversion, as occurs on Earth at higher elevations, and reduces vertical convectionin the Martian atmosphere. The density of air on Mars is much less than on Earth, making the forces caused bydifferential densities correspondingly smaller; therefore, there is a much lesser tendency for warm air to rise. Also, thegravity on Mars is only 3/5 of that on Earth, which further reduces the differential forces that cause hotter, less dense airto rise.
Figure 11: Evaporation Limited by a Cold Lid (Mars Pathfinder and Odyssey THEMIS Temperature Data)
-20 -15 -10 -5 0 5 200.0
0.1
0.2
0.3
0.4
0.5
0.6
0.7
0.8
0.9
1.0
Temperature (°C)
Hei
gh
t A
bo
ve G
rou
nd
(m
)
VeryLimitedVapor
CarryingCapability
Fog May Form Here
Fog May Form Here
Pathfinder
Odyssey
-20 -15 -10 -5 0 5 200.0
0.1
0.2
0.3
0.4
0.5
0.6
0.7
0.8
0.9
1.0
Temperature (°C)
Hei
gh
t A
bo
ve G
rou
nd
(m
)
VeryLimitedVapor
CarryingCapability
Fog May Form Here
Fog May Form Here
-20 -15 -10 -5 0 5 200.0
0.1
0.2
0.3
0.4
0.5
0.6
0.7
0.8
0.9
1.0
Temperature (°C)
Hei
gh
t A
bo
ve G
rou
nd
(m
)
VeryLimitedVapor
CarryingCapability
Fog May Form Here
Fog May Form Here
Pathfinder
Odyssey
Because convection is so much weaker on Mars than on Earth, the drop off in temperature with altitude is much moresevere. Although the temperature at the surface can reach 20°C, the temperature at 1 m altitude may be -15°C. Above1 m is probably always sub-freezing.
According to the steam tables21, at -15°C, the atmosphere can hold no more than 2 mb partial pressure of water vapor.This means that water evaporating from the surface or ice subliming can send water vapor sideways or even downwind,but cannot send water vapor in the vertical direction. This especially retards evaporation from liquid water or ice on thesurface. Since nearly all geographic locations appear rich in near-surface ice, the horizontal dimension is effectivelyhomogeneous, and the vertical becomes more important.
The Pathfinder data show that the ability to transport water vapor in the vertical direction is greatly limited and that mostof the water vapor on Mars would have to exist within the 1 meter of atmosphere closest to the surface. This indicatesthat, if liquid water did form on Mars, or if areas of ice approached 0°C and began evaporating rapidly, that there is agreat chance of fog forming at an altitude above the evaporation. This fog is often seen in pictures of the surface of Marstaken from Mars orbit22. Fog is especially prevalent in low valleys or depressions on Mars. Fog layers are regions inwhich the atmosphere is completely saturated with water vapor, where no further evaporation is possible. Ice (or water)under these conditions would not have any evaporative heat loss. Because of this, liquid water would exist if and whenthe ground temperature exceeds 0°C.
These findings support the experimental evidence for the existence of liquid water under simulated Martian conditions asdemonstrated in a bell jar experiment, and in space suit porous plate backpack tests, both reported in 200023.
7. SUMMARY
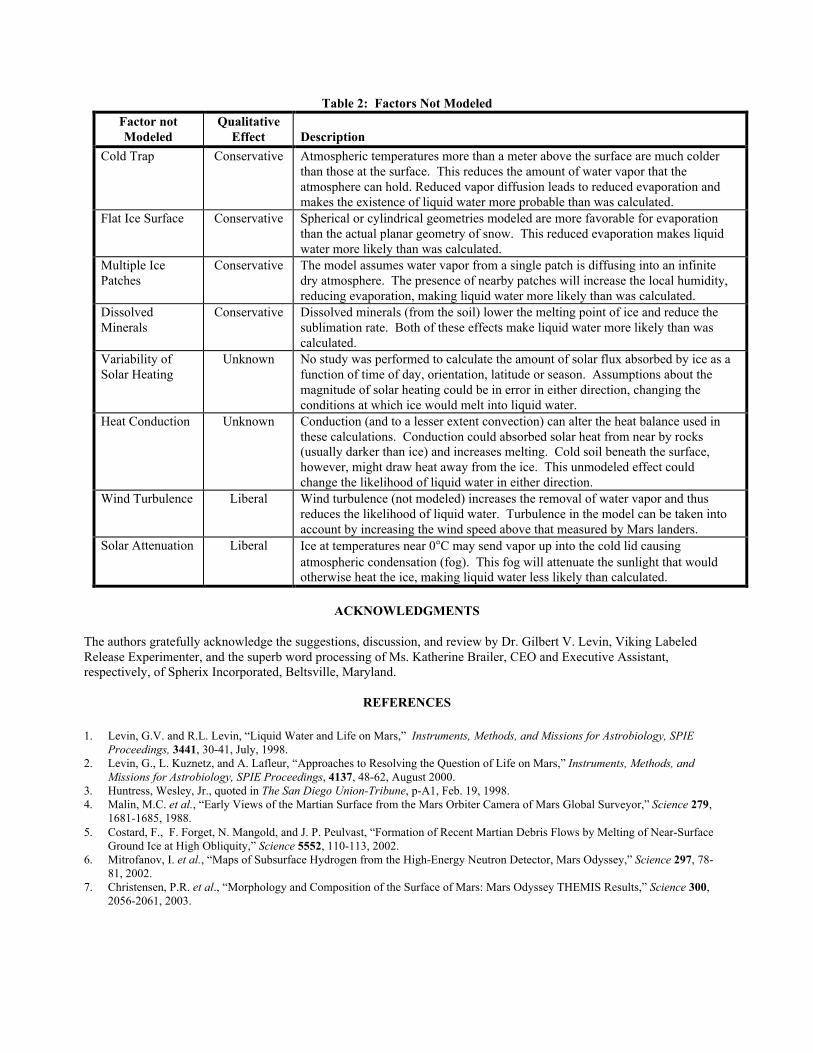
In summary, numeric calculations show that ice on the surface of Mars may melt into liquid water under Martian solarillumination. Wind increases the rate of evaporation, but it is not as significant a factor as it might seem intuitively. Thismodel allows examination of all the parameters surrounding a hypothesized area of evaporating ice or water. This studyof the physics of evaporating water at 10 mb total pressure leaves some uncertainties as listed in Table 2. However, thecombined effects seem likely to increase the probability for liquid water.
The ultimate conclusion is that there are no physical reasons prohibiting the availability of liquid water on the surface ofMars. This thermodynamic analysis provides evidence that biologically significant amounts of liquid water can currentlyexist on the surface of Mars. The previously presumed unavailability of liquid water is not a reason to rule out theexistence of microbial life on current day Mars.
Table 2: Factors Not ModeledFactor notModeled
QualitativeEffect Description
Cold Trap Conservative Atmospheric temperatures more than a meter above the surface are much colderthan those at the surface. This reduces the amount of water vapor that theatmosphere can hold. Reduced vapor diffusion leads to reduced evaporation andmakes the existence of liquid water more probable than was calculated.
Flat Ice Surface Conservative Spherical or cylindrical geometries modeled are more favorable for evaporationthan the actual planar geometry of snow. This reduced evaporation makes liquidwater more likely than was calculated.
Multiple IcePatches
Conservative The model assumes water vapor from a single patch is diffusing into an infinitedry atmosphere. The presence of nearby patches will increase the local humidity,reducing evaporation, making liquid water more likely than was calculated.
DissolvedMinerals
Conservative Dissolved minerals (from the soil) lower the melting point of ice and reduce thesublimation rate. Both of these effects make liquid water more likely than wascalculated.
Variability ofSolar Heating
Unknown No study was performed to calculate the amount of solar flux absorbed by ice as afunction of time of day, orientation, latitude or season. Assumptions about themagnitude of solar heating could be in error in either direction, changing theconditions at which ice would melt into liquid water.
Heat Conduction Unknown Conduction (and to a lesser extent convection) can alter the heat balance used inthese calculations. Conduction could absorbed solar heat from near by rocks(usually darker than ice) and increases melting. Cold soil beneath the surface,however, might draw heat away from the ice. This unmodeled effect couldchange the likelihood of liquid water in either direction.
Wind Turbulence Liberal Wind turbulence (not modeled) increases the removal of water vapor and thusreduces the likelihood of liquid water. Turbulence in the model can be taken intoaccount by increasing the wind speed above that measured by Mars landers.
Solar Attenuation Liberal Ice at temperatures near 0°C may send vapor up into the cold lid causingatmospheric condensation (fog). This fog will attenuate the sunlight that wouldotherwise heat the ice, making liquid water less likely than calculated.
ACKNOWLEDGMENTS
The authors gratefully acknowledge the suggestions, discussion, and review by Dr. Gilbert V. Levin, Viking LabeledRelease Experimenter, and the superb word processing of Ms. Katherine Brailer, CEO and Executive Assistant,respectively, of Spherix Incorporated, Beltsville, Maryland.
REFERENCES
1. Levin, G.V. and R.L. Levin, “Liquid Water and Life on Mars,” Instruments, Methods, and Missions for Astrobiology, SPIEProceedings, 3441, 30-41, July, 1998.
2. Levin, G., L. Kuznetz, and A. Lafleur, “Approaches to Resolving the Question of Life on Mars,” Instruments, Methods, andMissions for Astrobiology, SPIE Proceedings, 4137, 48-62, August 2000.
3. Huntress, Wesley, Jr., quoted in The San Diego Union-Tribune, p-A1, Feb. 19, 1998.4. Malin, M.C. et al., “Early Views of the Martian Surface from the Mars Orbiter Camera of Mars Global Surveyor,” Science 279,
1681-1685, 1988.5. Costard, F., F. Forget, N. Mangold, and J. P. Peulvast, “Formation of Recent Martian Debris Flows by Melting of Near-Surface
Ground Ice at High Obliquity,” Science 5552, 110-113, 2002.6. Mitrofanov, I. et al., “Maps of Subsurface Hydrogen from the High-Energy Neutron Detector, Mars Odyssey,” Science 297, 78-
81, 2002.7. Christensen, P.R. et al., “Morphology and Composition of the Surface of Mars: Mars Odyssey THEMIS Results,” Science 300,
2056-2061, 2003.
8. Levin, G.V., “Odyssey gives evidence for liquid water on Mars,” Instruments, Methods, and Missions for Astrobiology VII, SPIEProceedings, in press.
9. Op Cit 1.10. Handbook of Chemistry and Physics, 55th edition, pgs. B-244 and D-58, 1974-1975.11. Op Cit 10, pg. D-159, 1974-1975.12. Berezhnoi, A.N. and A.V. Semenov, “Binary Diffusion Coefficients of Liquid Vapors in Gases,” Begell House, 1997.13. Schuerger, A.C., R.L. Mancinelli, R.G. Kern, L.J. Rothschild, and C.P. McKay, “Survival of Endospores of Bacillus subtilis on
Spacecraft Surfaces under Simulated Martian Environments: Implications for the Forward Contamination of Mars,” Icarus, inpress.
14. “Observations of Snow Cover from the Ground and Space,” from the NASA Goddard Space Flight Center website,http://snowcover.gsfc.nasa.gov/proc.albedo.html.
15. Hirsch, C., “Numerical Computation of Internal and External Flows, Fundamentals of Numerical Discretization,” John Wiley &Sons, 1990.
16. “Mars Pathfinder Preliminary Results,” from the NASA Goddard Space Flight Center website,http://nssdc.gsfc.nasa.gov/planetary/marspath_results.html.
17. “Mars Pathfinder Windsocks,” from the NASA Goddard Space Flight Center website, http://mars.jpl.nasa.gov/MPF/ops/PR-windsocks.html.
18. Op Cit 1.19. Mars Pathfinder Mission Status, Jet Propulsion Laboratory, NASA, daily website reports, July 9 – August 1, 1997.20. Brumby, S.P., D.T. Vaniman, and D. Bish, “Emissivity Spectrum of a Large “Dark Streak” from THEMIS Infrared Imagery,”
Sixth International Conference on Mars, 2003.21. Op Cit 11.22. Kiefer, W.S., A.H. Treiman, and S.M. Clifford, „The Red Planet: A Survey of Mars,” The Lunar and Planetary Institute, a
Universities Space Research Association publication, 1997.23. Op Cit 2.
Figure 1: Some Patches of Frost/Snow, > 1 Square Meter
Figure 4: Ice Sublimation Rate, Evaporative Heat Loss, and Evolved Gas Speed
-20 -15 -10 -5 0 5 10Temperature (°C)
-3
10-2
10-1
100
101
102
103
Ice
Su
rfac
e A
rea
(M2
)
10-3
10-2
10-1
100
101
102
103
Ice
Su
rfac
e A
rea
(M2
)
10-2
10-1
100
101
Sp
her
e R
adiu
s (M
)
10
Mel
tin
g T
emp
erat
ure
500 W/M2
LiquidWaterCanExistHere
Eva
po
rati
ve H
eat
Lo
ss (
W/M
2)
0
3
10
32
100
316
1000
3162
500
MaximumSolar Flux
Tem
p A
bo
ve B
oili
ng
, Hea
t L
oss
= •
0.001
0.003
0.010
0.032
0.100
0.316
1.000
3.162
Ice
Su
blim
ing
(M
M/H
R)
0.001
0.003
0.010
0.032
0.100
0.316
1.000
3.162
Ice
Su
blim
ing
(M
M/H
R)
Evo
lved
Gas
Sp
eed
(C
M/S
EC
0.0003
0.0010
0.0032
0.0100
0.0316
0.1000
0.3162
1.0000
0.0003
0.0010
0.0032
0.0100
0.0316
0.1000
0.3162
1.0000
Figure 5: Phase of Water at Equilibrium Temperature
-2
10-1
100
101
Sp
her
e R
adiu
s (M
)
10
Eq
uili
bri
um
Tem
per
atu
re (°
C)
0 100 200 300 400 500-3
10-2
10-1
10 0
101
102
103
Ice
Su
rfac
e A
rea
(M2
)
10
Absorbed Solar Flux (Watts/M2)
-25°
-20°
-15°
-10°
-5°
0°
5°
Old
Sn
ow
New
Sn
ow
Liquid
MartianMaximum
Boiling Waterat Equilibrium Temp.
Ice at Equilibrium Temp.
Water at Equilibrium Temp
-2
10-1
100
101
Sp
her
e R
adiu
s (M
)
10
Eq
uili
bri
um
Tem
per
atu
re (°
C)
0 100 200 300 400 500-3
10-2
10-1
10 0
101
102
103
Ice
Su
rfac
e A
rea
(M2
)
10-3
10-2
10-1
10 0
101
102
103
Ice
Su
rfac
e A
rea
(M2
)
10
Absorbed Solar Flux (Watts/M2)
-25°
-20°
-15°
-10°
-5°
0°
5°
Old
Sn
ow
New
Sn
ow
Liquid
MartianMaximum
Boiling Waterat Equilibrium Temp.
Ice at Equilibrium Temp.
Water at Equilibrium Temp
Figure 8: Vapor Pressure from Evaporating Ice or Water
Position in Z direction (M)
Po
siti
on
in R
dir
ecti
on
(M
)
Ice orWater
H2O Vapor Partial Pressure (mb)
-10 -5 0 5 10 15 20
2
4
6
2
4
6
0 1 2 3 4 5 6
Wind Speed 1 cm/sec
Wind Speed 0WaterVapor
EventuallyDissipates
Position in Z direction (M)
Po
siti
on
in R
dir
ecti
on
(M
)
Ice orWater
H2O Vapor Partial Pressure (mb)
-10 -5 0 5 10 15 20
2
4
6
2
4
6
2
4
6
0 1 2 3 4 5 60 1 2 3 4 5 6
Wind Speed 1 cm/sec
Wind Speed 0WaterVapor
EventuallyDissipates
Figure 9: Evaporative Heat Loss at 0°C
Wind Speed (M/S)
Cyl
ind
er A
rea
(M2
)
3
10
32
100
316
1000
3162
10000
Eva
po
rati
ve H
eat
Lo
ss (
W/M
2)
102
104
100
10-2
10-3 10-2 10-1 100 101
Watts
100
perSquare Meter
Watts
500
perSquare Meter
Wind Speed (M/S)
Cyl
ind
er A
rea
(M2
)
3
10
32
100
316
1000
3162
10000
Eva
po
rati
ve H
eat
Lo
ss (
W/M
2)
102
104
100
10-2
10-3 10-2 10-1 100 101
Watts
100
perSquare Meter
Watts
500
perSquare Meter
Figure 10: Equilibrium Temperature if Absorption is 500 Watts/M2 or 100 Watts/M2
Wind Speed (M/S)
Cyl
ind
er A
rea
(M2
)
102
104
100
10-2
10-3 10-2 10-1 100 101
Liquid Water at Equilibrium Temp
Solid Ice at Equilibrium Temp
Wind Speed (M/S)
10-2 10-1 100 101
Liquid Water at Equilibrium Temp
Solid Ice atEquilibrium Temp
-30 -25 -20 -15 -10 -5 0 5
Temperature (°C)
Solar Insolation = 100 W/M2Solar Insolation = 500 W/M2
Boiling Water at Equilibrium Temp Boiling Water at Equilibrium Temp