Liquidity Risk Premia and Breakeven Inflation Rates By Pu Shen I n recent years, monetary policymakers have monitored several meas- ures of market expectations of future inflation. One of these measures is based on the yield differential between nominal and inflation indexed Treasury securities. This yield spread is also called the “breakeven inflation rate.” An increase in the breakeven rate is some- times viewed as a sign that market inflation expectations may be on the rise. For example, the FOMC frequently refers to the yield spread as a measure of “inflation compensation” and considers the yield spread an indicator of inflation expectations in policy deliberations. 1 Accurately inferring market expectations of inflation from yield spreads is difficult. The difficulty lies in the differences in market liquid- ity conditions between nominal and inflation indexed Treasury securities. This article presents evidence that liquidity differences between nominal and inflation indexed Treasuries have been nontrivial. Consequently, simply attributing changes in yield spreads to changes in market inflation expectations and ignoring the liquidity risk premium could lead to overstated inflation expectations. Pu Shen is a senior economist at the Federal Reserve Bank of Kansas City. Jonathan Corning, an associate economist at the bank, helped prepare the article. The article is on the bank’s website at www.KansasCityFed.org. 29
In recent years, monetary policymakers have monitored several meas-ures of market expectations of future inflation. One of thesemeasures is based on the yield differential between nominal and
inflation indexed Treasury securities. This yield spread is also called the“breakeven inflation rate.” An increase in the breakeven rate is some-times viewed as a sign that market inflation expectations may be on therise. For example, the FOMC frequently refers to the yield spread as ameasure of “inflation compensation” and considers the yield spread anindicator of inflation expectations in policy deliberations.1
Accurately inferring market expectations of inflation from yieldspreads is difficult. The difficulty lies in the differences in market liquid-ity conditions between nominal and inflation indexed Treasurysecurities. This article presents evidence that liquidity differencesbetween nominal and inflation indexed Treasuries have been nontrivial.Consequently, simply attributing changes in yield spreads to changes inmarket inflation expectations and ignoring the liquidity risk premiumcould lead to overstated inflation expectations.
Pu Shen is a senior economist at the Federal Reserve Bank of Kansas City. JonathanCorning, an associate economist at the bank, helped prepare the article. The article ison the bank’s website at www.KansasCityFed.org.
29
The first section of the article gives a brief overview of inflationindexed Treasury securities, the components of the yields of bothnominal and indexed Treasuries, and their yield spreads. The secondsection examines the behavior of the yield spreads over the past fewyears and explains why changes of the liquidity risk premium havelikely played an important role in the changes of the yield spreads. Thissection also provides some estimates of the changes in the liquidity riskpremia during the past seven years and argues that ignoring suchchanges may lead to erroneous inferences of inflation expectations.
I. INFLATION INDEXED TREASURY SECURITIESAND COMPONENTS OF THE YIELD SPREADS
This section discusses the main features of inflation indexed Trea-sury securities, which are commonly referred to as TIPS. Next, itexamines the components of the yields of nominal securities and TIPS.Finally, it identifies the conditions needed to obtain useful informationabout market inflation expectations directly from the yield spreads.
TIPS and their markets
The U.S. Treasury began issuing TIPS in 1997. Initially called Trea-sury Inflation Protected Securities, their official name was later changedto Treasury Inflation Indexed Securities (TIIS). Market participantshave continued to call the instruments TIPS.
The first TIPS had a maturity of ten years. Every year since 1997,Treasury has issued additional 10-year TIPS. TIPS with 5-year, 20-year,and 30-year maturities have also been issued intermittently. In Decem-ber 2005, a total of $329 billion TIPS were outstanding, accounting forabout 7.9 percent of the $4.2 trillion in outstanding marketable Trea-sury securities. Of Treasuries issued with at least two years’ maturity,TIPS account for 10.3 percent.2
The main advantage of TIPS over conventional nominal securities isthat TIPS investors are not exposed to inflation risk.3 The coupon rate ofa TIPS is fixed in real terms at auction, and the dollar value of the prin-cipal grows with inflation over the life of the TIPS. The real return,which is measured by purchasing power, does not vary with inflation.
30 FEDERAL RESERVE BANK OF KANSAS CITY
ECONOMIC REVIEW • SECOND QUARTER 2006 31
In contrast, the coupon payments and the principal of a nominalTreasury security are fixed in dollar terms. Thus, the purchasing power,or real return, of a nominal Treasury declines as inflation rises.4
Components of nominal Treasury yields
To investors, the real rate of return, or real yield, of an investment isimportant because it measures the result of the investment in terms ofpurchasing power.5 The yield of a nominal Treasury contains three maincomponents: the real yield, the yield that is equal to the expected rate ofaverage inflation for the remaining life of the Treasury, and the inflationrisk premium (which compensates investors for the risk that the actualinflation rate over the life of the Treasury may be higher than expected).6
For example, in the following equation, ytn,10 denotes the yield of a
nominal Treasury with ten years to maturity at time t:(1) yt
n,10 = rt10 + πt
e,10 + RPt10(π) ,
where rt10 is the average real yield investors require to lend to the U.S.
Treasury for ten years at time t, πte,10 is the expected average inflation
rate for the next ten years, and RPt10(π) is the inflation risk premium for
the nominal Treasury with ten years to maturity.7
If investors did not mind inflation risk, then the yield of a 10-yearnominal Treasury would simply be the sum of the required real rate forlending to the Treasury for ten years and the expected average inflationrate for the next ten years:
(2) ytn,10 = rt
10 + πte,10 .
Because inflation erodes the purchasing power of nominal pay-ments, the relevant yield to investors is not the nominal yield, but thereal yield. For example, assume investors decide that 2 percent real yieldis a reasonable return for lending to the U.S. Treasury for the next tenyears. If they collectively forecast that the average inflation rate for thenext ten years will be about 2.5 percent, then equation (2) suggests thatthe nominal yield on a conventional 10-year Treasury would be 4.5percent. If, instead, most investors believed that average inflation wouldbe 3 percent for the next ten years, then the nominal yield of the 10-year Treasury would have to rise to 5 percent to attract investors.
32 FEDERAL RESERVE BANK OF KANSAS CITY
In reality, most investors would rather avoid the risk of inflation.Therefore, the yield of a nominal Treasury must be a bit higher than thesimple sum of the required real yield and the expected inflation rate.The additional yield, RPt
10(π), is to compensate investors for bearingthe inflation risk.
Components of TIPS yields
The yield of an inflation indexed security usually consists of twocomponents: a real yield and a liquidity risk premium to compensateinvestors for the risk of having to pay more (than in the case of nominalTreasuries) to liquidate the TIPS before its maturity.8 Thus, if yt
i,10 is theyield on a TIPS with ten years to maturity, then:
(3) yti,10 = rt
10 + RPt10(l ) ,
where rt10 is the real yield required by investors to lend to the Trea-
sury at t, and RPt10(l ) is the liquidity risk premium included in the
TIPS yield.Generally speaking, the liquidity risk of a security is that investors
may incur large costs to buy or sell the security in a secondary market. InTreasury markets, an investor may need to make portfolio adjustmentsafter the initial auction or before the maturity of a Treasury security, andthus is forced to buy or sell the security in the secondary market. As aresult, investors need to consider the likely costs associated with suchtrading. Some of the costs are similar for both nominal Treasuries andTIPS, such as brokerage fees and commissions, and thus are not impor-tant to the current discussion. Other costs relate to the ease andconvenience of trading, which are more uncertain in nature and usuallyrelate inversely to the liquidity of the market. For example, a seller of alarge amount of nominal Treasury securities, say $2 billion, may be ableto find a buyer and complete the transaction in minutes. Selling $2billion worth of TIPS may require a lot more time to search for a buyeror selling at somewhat lower prices to complete the sale in a timelyfashion. As most investors need to adjust their portfolios at some pointdue to unforeseen events, the risk of having to pay a cost for the liquid-ity is ever present. Since the probability of incurring large liquidity costs
ECONOMIC REVIEW • SECOND QUARTER 2006 33
is inversely related to the liquidity of the security, the less liquid securitycarries higher liquidity risk, and thus must carry a higher yield to attractinvestors. This additional yield is the liquidity risk premium.
The liquidity risk premium generally tends to increase during finan-cial market crises because investors’ needs to quickly adjust their portfoliostend to increase during crises, making investors’ tolerance for liquidity riskdecline. In a financial market crisis, investors typically exhibit a pattern of“flight to quality” and stay away from less liquid assets.
The market for nominal U.S. Treasuries is the most liquid debtmarket and thus is usually considered the benchmark for market liquid-ity. Relative to nominal Treasuries, almost all other financialinstruments are likely to carry some liquidity risk and liquidity riskpremia because their markets are not as liquid. In particular, TIPS arerelatively new in the United States, and their market liquidity was ini-tially quite low. Consequently, early TIPS likely carried a sizableliquidity risk premium. As the market expanded and liquidityimproved, the liquidity risk premium has undoubtedly declined.Nonetheless, it may still be too soon to believe that the liquidity riskpremium has disappeared or even stabilized.
Yield spreads and inflation expectations
Many market participants and policymakers are interested in theyield spreads between nominal Treasuries and TIPS because the spreadscontain information about market expected future inflation rates. Theyield spread between a nominal Treasury and a TIPS can be calculatedfrom equations (1) and (3). From the earlier discussion, it is straightfor-ward to see that the yield spread should be equal to the market expectedrate of inflation, plus an inflation risk premium, and minus a liquidityrisk premium.9 For example, using St
10 to indicate the yield spreadbetween 10-year nominal and 10-year indexed Treasuries, then
(4) St10=yt
n,10– yti,10= rt
10+ πte,10+ RPt
10(π) – [rt10+ RPt
10(l )]=πte,10 + RPt
10(π)–RPt10(l ) ,
where πte,10 is the expected average annual inflation rate for the next
ten years, RPt10(π) is the inflation risk premium for the 10-year
nominal Treasury, and RPt10(l ) is the liquidity risk premium for the 10-
year TIPS.10
34 FEDERAL RESERVE BANK OF KANSAS CITY
Similarly, the yield spread between 5-year nominal Treasuries andTIPS can be calculated by the same method. Using similar notation:
(5) St5 =πt
e,5 + RPt5(π) =RPt
5(l ) ,where πt
e,5 is the market expected average inflation rate for the nextfive years, and RPt
5(π) and RPt5(l ) are the inflation and liquidity risk
premium for the respective Treasuries.In each of the two yield spreads shown in equations (4) and (5),
there is a term for expected inflation over the life of the security. Thatis, πt
e,10 represents average inflation expected by investors for the nextten years, while πt
e,5 represents average inflation expected for the nextfive years.
For some purposes, it is useful to obtain a measure of longer-terminflation expectations. For example, policymakers may be interested inthe average inflation rate expected by investors over a longer-termhorizon. One such measure is the average inflation rate for the five-year period five years ahead (πt
e,5f ). This measure, unlike the five-yearand ten-year expected inflation discussed above, removes the effect ofnear term inflation expectation and thus gives policymakers a betterpicture of where inflation is likely to be in the more distant future. Avalue for πt
e,5f can be easily derived from the 5-year and 10-yearexpected inflation rates:
(6) πte,5f = 2*πt
e,10 – πte,5.
Using the two yield spreads St5 and St
10, one can construct a St5f, rep-
resenting a five-year spread five years ahead, to contain informationabout πt
e,5f: (7) St
5f = 2*St10 – St
5 .The result:
St5f = πt
e,5f + 2*[RPt10(π)–RPt
10(l )] – [RPt5(π)–RPt
5(l )],or,
(8) St5f = πt
e,5f + [2*RPt10(π)–RPt
5(π)] – [2*RPt10(l ) –RPt
5(l )].In equation (8), the first component of St
5f is the expected averageinflation rate for the five-year period five years ahead, the secondcomponent is the inflation risk premium differential between the 10-year and 5-year nominal Treasury securities, and the third componentis the liquidity risk premium differential between the 10-year and 5-year TIPS.11
ECONOMIC REVIEW • SECOND QUARTER 2006 35
Information about expected future inflation rates in yield spreads
Most market analysts have focused on the component of expectedinflation in the yield spread. In particular, if one is willing to assumethat inflation and liquidity risk premia are constant over a particularperiod, then changes in the yield spreads for the period mostly reflectchanges in the inflation expectation of market participants.12 Further,under the same assumption that both inflation and liquidity risk premiaare constant, then changes in St
5f will solely reflect changes in theexpected average inflation rate for the 5-year period five years ahead.
For policymakers and some market participants, the separation ofthe expected future inflation rate and inflation risk premium may be ofsecondary importance, especially regarding long-term inflation expec-tations, such as πt
e,5f and πte,10. The average inflation rates for the long
term should be most closely related to monetary policymakers’ view ofthe desirable level of inflation and their credibility. Therefore, somemarket commentators also use them as proxies for the FOMC infla-tion-fighting credibility. In this context, separating the long-termexpected inflation rate from the inflation risk premium is unimpor-tant. In fact, the sum of the expected inflation rate and inflation riskpremium better represents market participants’ view of inflationarypressure. For example, if the sum for the next ten years has declined0.5 percentage point, then the decline could be due to a 0.5-percent-age-point decline in the expected average inflation rate by marketparticipants, to a 0.5-percentage-point decline in the inflation riskpremium, or to a combined total decline of 0.5 percentage point inboth the expected inflation rate and the inflation risk premium. What-ever the precise cause, it would represent an improvement of FOMCinflation-fighting credibility.
In summary, changes in the yield spreads over a particular periodcan be useful proxies for changes in market inflation expectations,under the crucial assumption that the liquidity risk premia in TIPS areconstant for the period. The next section examines the liquidity riskpremium in detail to assess the likelihood of this assumption.
36 FEDERAL RESERVE BANK OF KANSAS CITY
II. THE LIQUIDITY RISK PREMIUM
A closer look at the liquidity risk premium in TIPS suggests that itis relatively large and has changed considerably in recent years. Conse-quently, taking account of the liquidity risk premium greatlycomplicates the task of extracting information from the yield spreadsabout market inflation expectations.
Large and variable liquidity risk premium
Comparing actual yield spreads with other measures of inflationexpectations for the sample period of 1999 to early 2006 suggests thatliquidity risk premia have been large for most of the sample period.13
Further, they were sometimes quite variable and have likely declinedover time.
Chart 1 shows the yield spreads between 5-year nominal andindexed Treasuries, as well as the Blue Chip Consensus forecast for theaverage inflation rate for the next five years from January 1999 to Feb-ruary 2006. It also shows the actual average inflation rates for thefive-year periods ahead from January 1999 to March 2001 (the latestmonth such calculation is feasible).
Chart 2 shows the yield spreads between 10-year nominal andindexed Treasuries, as well as the forecasts of the average inflation ratesfor the next ten years based on the Blue Chip Consensus forecast, andon the Survey of Professional Forecasters (SPF).14
Three observations are immediate from these two charts. First, theliquidity risk premia were likely sizable for most of the sample period.During the first five years of the sample, the yield spreads were mostlywell below the expected inflation rate based on Blue Chip Consensus orSPF. In the case of five-year spreads, it is also clear that, for the three yearperiod that data are available, the Blue Chip Consensus was very close tothe actual five-year average inflation, while the yield spreads were mostlywell below actual inflation rates for the respective periods. There is noreason to suspect that the expected inflation rate in the yield spread wouldbe systematically lower than survey-based measures or would consistently
ECONOMIC REVIEW • SECOND QUARTER 2006 37
Chart 1YIELD SPREAD (5-YEAR) COMPARED TO ACTUAL INFLATION AND A SURVEY-BASEDINFLATION FORECAST
Sources: Federal Reserve System, Board of Governors; Blue Chip Consensus; Survey of Professional Forecasters
38 FEDERAL RESERVE BANK OF KANSAS CITY
underpredict actual inflation. The most likely explanation is that the liq-uidity risk premia in the yields of the TIPS were larger than the inflationrisk premia in nominal Treasuries during this period.15
Subtracting the expected inflation rate of the Blue Chip Consensusforecasts from the 10-year yield spreads reveals that the average differ-ence was negative 0.55 percentage point for the first five years of thesample period. In other words, from 1999 to 2003, the liquidity riskpremium in 10-year TIPS was, on average, 0.55-percentage-pointhigher than the inflation risk premium in 10-year nominal Treasuries.This observation may not surprise active market participants, whousually consider market liquidity conditions an important factor inmaking buying and selling decisions. It may surprise other marketobservers, however, who tend to consider the liquidity risk premium tobe of secondary importance to the inflation risk premium.16
The second observation is that liquidity risk premia are likely to bequite variable. Unlike survey-based inflation expectations that are onlyupdated quarterly or semiannually, yield spreads are derived fromtrading prices and thus available whenever bond markets are open.Consequently, it is natural that inflation expectations reflected in theyield spread may vary more frequently. Nevertheless, it is highlyimprobable that the observed magnitudes of the variations are mostlydue to changes in market inflation expectations. For example, for theentire sample period, the survey-based expected inflation rate variedwithin a narrow range of 0.4 percentage point, while for 10-year Trea-suries the total variation of the yield spread was within a range of about1.5 percentage points and for 5-year Treasuries almost two percentagepoints. Such large magnitudes of changes in the yield spread areunlikely to be mainly due to large swings in the expected future infla-tion rate and inflation risk premium, given the very subduedmovements in the survey-based forecasts of future inflation. Largechanges in liquidity risk premia have likely contributed to these sizablemovements in the yield spreads.
Third, liquidity risk premia in TIPS have likely declined in recentyears. In both Charts 1 and 2, the yield spreads were mostly below thesurvey forecasts of future inflation rate before 2004 (and the realizedaverage inflation rate in the 5-year case), but mostly above the surveyforecasts after 2004. Both yield spreads started the sample period more
ECONOMIC REVIEW • SECOND QUARTER 2006 39
than one percentage point below the corresponding survey forecasts offuture inflation. In other words, the liquidity premia in TIPS were atleast one whole percentage point larger than the inflation risk premia innominal Treasuries. Since early 2004, neither spread has been morethan 0.15 percentage point below the survey forecasts of inflation, indi-cating that the liquidity risk premia were close to the size of inflationpremia. It is possible that such movements can be due entirely to largeincreases in inflation risk premia. But this scenario is highly improbablegiven the fact that survey forecasts of future inflation rates barely movedfor the entire sample period. A more plausible explanation is that atleast part of the changes was caused by decreases in the liquidity riskpremia in TIPS.
The likely decline of liquidity risk premium in TIPS
One reason that the liquidity risk premium in TIPS is likely tohave declined during the sample period is that the market for TIPSdeepened considerably during this time. Chart 3 shows the issuanceof TIPS relative to nominal Treasuries with similar maturities foreach fiscal year since 1997. The gray bars in the chart are the ratiosof newly issued TIPS to nominal Treasuries with maturities of fiveor ten years. The black bars are the ratios of TIPS to nominal Trea-suries with maturities of ten to 30 years.17 By fiscal year 2005, theissuance volume of TIPS with maturities of at least ten years wasmore than 50 percent of the total issuance volume of nominal Trea-suries with maturities of at least ten years. Clearly, the newly issuedTIPS markets have become more comparable to the nominal Trea-sury markets.
Market interest and TIPS trading have also grown considerably.TIPS have gained the interest of pension funds, insurance companies,direct individual investors, and, since late 2003, the interest ofexchange-traded funds. In 1999, only a handful of mutual fundsfocused on TIPS. Today, there are many more such funds. Chart 4shows the transaction volumes of TIPS through primary dealers whoregularly participate in Treasury security auctions.18 Trends in overalltrading volumes in TIPS should be closely related to the trading volumethat goes through primary dealers, which has gradually increased.
40 FEDERAL RESERVE BANK OF KANSAS CITY
Chart 4TIPS TRANSACTION VOLUME THROUGH PRIMARY DEALERS(3-Month Moving Average)
Source: Federal Reserve System, Board of Governors
Chart 3ISSUANCE OF TIPS RELATIVE TO NOMINAL TREASURIES(Fiscal Year)
Percent
0
10
20
30
40
50
60
0
10
20
30
40
50
60
1997 1998 1999 2000 2001 2002 2003 2004 2005
5- and 10-year maturities
10- to 30-year maturities
Source: U.S. Treasury
ECONOMIC REVIEW • SECOND QUARTER 2006 41
The deepening market for TIPS is likely to be associated with adecline of the liquidity risk premium for TIPS for two reasons. One,as the market deepens, it is easier for investors to find a counter-party to buy a TIPS after its initial auction or to sell a TIPS beforeits maturity. That is, the deeper market has improved the marketliquidity for TIPS and reduced liquidity risk. Less liquidity risk, inturn, has led investors to require a smaller liquidity risk premiumfor TIPS.
The other reason that a deepening market may lead to lower liq-uidity risk premium is that it reduces the uncertainty regardingfuture market liquidity. When TIPS were new to the U.S. market,participants were uncertain about whether or not the Treasurywould remain committed to the program. Earlier in the sampleperiod, some investors might have worried that the Treasury woulddecide to stop issuing TIPS, which would have quickly dried uptrading in existing TIPS, leading to deteriorated market liquidity.But as the TIPS market continues to deepen, the risk of a suddendisappearance of the market declines, which in turn should lessenthe liquidity risk premium.
Growth of the TIPS markets has not occurred uniformly. In fact,it is possible that 10-year TIPS may have become more liquid than 5-year TIPS because of Treasury’s differing commitment to the twosecurities. Treasury has issued 10-year TIPS every year since the TIPSprogram began in 1997. The 5-year TIPS, in contrast, were issued in1997 and 1998, but then not again until 2005. This changing patternof issuance was related partly to overall changes in the Treasurymarket: The federal government ran a budget surplus from 1998 to2001, which reduced its need to borrow and allowed suspension ofthe 5-year and 30-year TIPS programs. Since 2002, the budget deficithas come back decisively. In response, Treasury has steadily increasedtotal TIPS issuance, reissuing the 5-year TIPS and introducing a 20-year TIPS (Chart 5).
In addition to improving market liquidity, another general develop-ment may have also helped lower the TIPS liquidity risk premium.Over the sample period, investors in general may have become lessworried about liquidity risk. Liquidity risk premia should generally belower if investors become more tolerant to liquidity risk, even if the
42 FEDERAL RESERVE BANK OF KANSAS CITY
magnitudes of the risk are unchanged.19 The sample period began in1999, shortly after the financial market crisis in the fall of 1998. Thatparticular crisis was partly characterized by heightened demand for themost liquid assets—nominal Treasuries. The liquidity risk premia onmany other assets increased. Thus, the financial crisis likely had a lin-gering effect on the new TIPS markets by leaving investors deeplyconcerned about liquidity risk.
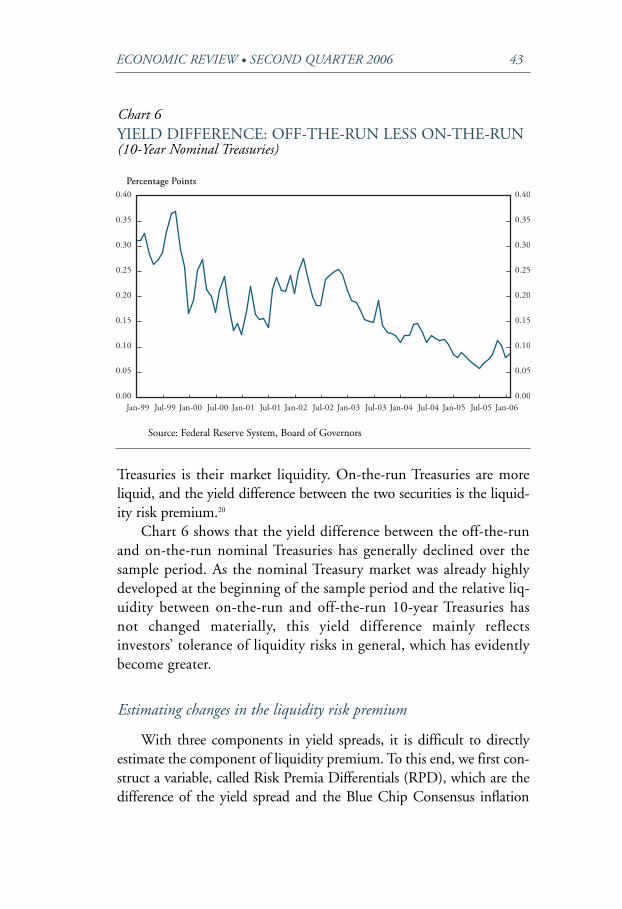
With the passing of time, various risk management measures havebeen adopted gradually, both in market structures and in many invest-ment firms. It also appears that over the years investors have becomemore tolerant of liquidity risks. Chart 6 shows the yield differencebetween off-the-run and on-the-run 10-year nominal Treasuries. On-the-run Treasuries are the most recently auctioned Treasuries and thusare typically traded more frequently. Off-the-run Treasuries are thosethat were auctioned one or more auctions earlier, and thus most ofthem are already settled in investors’ portfolios and traded less fre-quently. Therefore, the main difference between these nominal
Chart 5TIPS ISSUANCE BY MATURITY(Fiscal Year)
0
10
20
30
40
50
60
70
80
0
10
20
30
40
50
60
70
80
5-year10-year20-year30-year
1997 1998 1999 2000 2001 2002 2003 2004 2005
$ Billion
Source: U.S. Treasury
ECONOMIC REVIEW • SECOND QUARTER 2006 43
Treasuries is their market liquidity. On-the-run Treasuries are moreliquid, and the yield difference between the two securities is the liquid-ity risk premium.20
Chart 6 shows that the yield difference between the off-the-runand on-the-run nominal Treasuries has generally declined over thesample period. As the nominal Treasury market was already highlydeveloped at the beginning of the sample period and the relative liq-uidity between on-the-run and off-the-run 10-year Treasuries hasnot changed materially, this yield difference mainly reflectsinvestors’ tolerance of liquidity risks in general, which has evidentlybecome greater.
Estimating changes in the liquidity risk premium
With three components in yield spreads, it is difficult to directlyestimate the component of liquidity premium. To this end, we first con-struct a variable, called Risk Premia Differentials (RPD), which are thedifference of the yield spread and the Blue Chip Consensus inflation
Chart 6YIELD DIFFERENCE: OFF-THE-RUN LESS ON-THE-RUN(10-Year Nominal Treasuries)
Source: Federal Reserve System, Board of Governors
44 FEDERAL RESERVE BANK OF KANSAS CITY
forecast for the respective horizon. Under the assumption that the con-sensus forecast follows the same process generating expected inflationrates in the yield spreads, then RPD is the difference between the infla-tion risk premium and the liquidity risk premium. Implicitly, thisassumes that the expected inflation rates built into the yields of Trea-suries are essentially the same as the Blue Chip Consensus forecasts.While this may be true on average, long-term Blue Chip Consensusforecasts are only updated semiannually, and therefore some of thechanges in the expected rates of inflation may have been left in theRPDs and grouped with the inflation risk premium.
As RPDs have two risk premia, neither of which is directly observ-able, it remains a difficult task to ascertain changes to each individualcomponent from changes of RPDs. It may be possible to estimatechanges in the liquidity risk premium, however, by recognizing that thedeterminants of the liquidity risk premium and the inflation riskpremium are very different. As discussed above, the depth of the TIPSmarket and investors’ general tolerance of liquidity risks are closelyrelated to the liquidity risk premium in TIPS, but are unlikely to bedirectly linked with the inflation risk premium in nominal Treasuries.Therefore, these variables can be used to estimate the contribution ofchanges in liquidity risk premium to the changes in the RPDs.
Specifically, we assume that the following statistical model is areasonable approximation of the changes in the 10-year riskpremium differentials:
(9) ∆RPDt10 = a1
10∆ratiot + a210∆volumet + a3
10∆ spreadt + ut10
where ∆ indicates changes of the variables;21 RPDt10 is the risk
premium differential for 10-year Treasuries at time t; ratiot is the ratioof total outstanding TIPS issued at a maturity of five or ten years tonominal Treasuries issued at maturities of two to ten years;22 volumet isthe logarithm of the transaction volume of all TIPS with primarydealers;23 spreadt is the yield spread between off-the-run and on-the-run nominal 10-year Treasuries; and ut
10 is the residual, whichincludes both changes in the inflation risk premium in the 10-yearnominal Treasury (could be different by a constant) and errors that aredue to other factors.24
ECONOMIC REVIEW • SECOND QUARTER 2006 45
Equation (9) provides a base for regression analysis as long as factorsinfluencing changes in the inflation risk premium are unrelated tofactors influencing the liquidity risk premium, which seems reasonable,as ratiot is determined by the Treasury and thus can be viewed as exoge-nous to the inflation process. The variables spreadt and volumet are notas clearly exogenous as ratiot, as it is possible that views about futureinflation risk may lead investors to change their trading patterns regard-ing nominal and inflation indexed Treasuries. Yet, it seems reasonable toconjecture that such consideration would be secondary.
Chart 7 shows the estimated changes of liquidity risk premia for the5-year TIPS (dashed line) and 10-year TIPS (solid line). For example,the solid line in Chart 7 is the accumulation of the fitted modela1
10∆ratiot + a210∆volumet + a3
10∆ spreadt , where a110, a2
10, and a310 are the
estimated coefficients. That is, the solid line in Chart 7 is the cumulativeof the estimated changes of liquidity risk premium for the sampleperiod. The dashed line in Chart 7 is obtained similarly, with the regres-sion on corresponding five-year RPDs.
Chart 7CUMULATIVE CHANGES IN THE ESTIMATEDLIQUIDITY RISK PREMIA
For the solid line in Chart 7, the value of each point represents therelative changes in the liquidity risk premium in the 10-year TIPS rela-tive to January 1999, and the difference of the values of any two pointsreflects changes in the liquidity risk premium between these two dates.For example, at May 2004, the solid line has a value of -0.14, meaningthat the liquidity premium in 10-year TIPS at that time was 0.14 per-centage point smaller than the liquidity premium in 10-year TIPS inJanuary 1999. By February 2006, the solid line has a value of -0.24,implying that the liquidity premium in 10-year TIPS then was 0.24 per-centage point smaller than that at January 1999. Consequently, fromMay 2004 to February 2006, the liquidity risk premium in 10-year TIPSdeclined by 0.1 percentage point (-0.24 minus -0.14 equals -0.10).
The estimates suggest that the liquidity risk premium in TIPS hasindeed declined, but the degree of the decline is smaller for 5-year TIPSthan for 10-year TIPS. Compared with the beginning of 1999, the liq-uidity premium in 10-year TIPS has declined about 0.24 percentagepoint, while the liquidity risk premium in the 5-year TIPS has declinedonly 0.08 percentage point.25 Both liquidity premia declined earlier inthe sample, until the end of 2000. Then they diverged. The liquiditypremium in 5-year TIPS gradually drifted upward for the next twoyears and peaked in the fall of 2002. It then declined slightly and hasbeen relatively stable for the past three years. The liquidity premium ofthe 10-year TIPS, in contrast, continued its downward drift until thespring of 2002, then moved up and stabilized for two years beforeresuming its downward trend in the fall of 2004.
The differing patterns of the two liquidity premia are not surprisingconsidering the differing patterns of issuance for 5-year and 10-yearTIPS, as discussed earlier (Chart 5). However, both the changes in theliquidity premia and the differing patterns of changes in the liquiditypremia for 5-year and 10-year TIPS have important implications. Theysuggest that ignoring the liquidity risk premium and equating changesin the yield spread to changes in inflation expectation and inflation riskpremium may lead to erroneous conclusions.
Let us look at an illustrative example. Table 1 shows how the esti-mated changes in the sum of expected inflation rate and inflation riskpremium (denoted as the inflation compensation in the table) fromJuly 2003 to February 2006 vary depending on whether the liquidity
ECONOMIC REVIEW • SECOND QUARTER 2006 47
risk premium is taken into account. In the table, column (1) isobtained directly from Charts 1 and 7 and equation (5), and column(2) is obtained from Charts 2 and 7 and equation (4). Column (3) isderived from columns (1) and (2) based on equations (7) and (8):column (3)=2*column (2)–column (1). For example, the firstnumber, 0.06, in column (3) is calculated according to equation (7)(2*0.58 - 1.10 = 0.06).
As the liquidity risk premium generally declined during the period,accounting for changes in the liquidity risk premium leads to smallerincreases in inflation compensation. In particular, while the five-yearbreakeven inflation rate five years ahead appears to have drifted upslightly (0.06 percentage point) during this period, once the changes inthe liquidity risk premium have been taken into account, the sum ofexpected inflation rate and inflation risk premium actually edged downslightly (0.14 percentage point).
Looking forward, the liquidity risk premium may continue todecline as the markets for TIPS continue to deepen. The above exampleshows that ignoring such changes in the liquidity risk premium can leadto erroneous inferences from yield spreads, as a decline in the liquidityrisk premium may be interpreted as an increase in the market expectedinflation rate or an increase in the inflation risk premium. Further, if 5-year TIPS are issued more regularly, the liquidity risk premium in their
Table 1INFERENCE OF INFLATION OUTLOOK DIFFERS WHENLIQUIDITY PREMIUM IS TAKEN INTO ACCOUNT
Change for the Change for the Change for the 5-yearnext five years next ten years period five years ahead
(1) (2) (3)
Changes in 1.10 0.58 0.06yield spreads
Changes in estimated -0.04 -0.12 -0.20liquidity premia
Changes in inflation 1.06 0.46 -0.14compensation when liquidity premia are accounted for
48 FEDERAL RESERVE BANK OF KANSAS CITY
yield may decline faster than the liquidity premium in 10-year TIPS,making it necessary to adjust the derived spread, S t
5f, to accuratelyreflect changes in the “longer-term inflation expectations.”
Other factors that may affect yield spreads
In addition to the three fundamental components in yield spreads,other factors that temporarily influence the demand for and supply ofnominal Treasuries and TIPS may also affect the yield spreads in theshort term, suggesting additional cautions may be called for in inter-preting changes in the yield spread. In particular, changes in thedemand for and supply of the Treasury debt can lead to changes inprices, and therefore yields, of the Treasury securities.
Relative changes in the supply of longer-term nominal Treasuries. Allelse being equal, a relative reduction of the supply of longer-termnominal Treasuries to longer-term TIPS will lead to relatively higherprices for nominal Treasuries. As yields and prices are inversely related,this leads to lower yields for nominal Treasuries and therefore to asmaller yield spread. Similarly, all else being equal, when such a changeis stopped or reversed, the opposite is likely to happen and the yieldspread may increase. This, in fact, is likely to happen in the near future.
In the past five years, Treasury has decreased the average maturityof outstanding nominal Treasuries significantly, from its recent peakin 2001 of about 67 months, to about 48 months in the beginning of2006–a steep drop of about 30 percent.26 In the meantime, the rela-tively new supply of TIPS to nominal Treasuries on the longer endhave increased from about 30 percent from 1998 to 2003 to morethan 50 percent in fiscal year 2005 (Chart 3). If such a shift in supplyhad not been accompanied by a similar shift in demand, then itshould have led to a somewhat narrower yield spread as nominallonger-term Treasuries became more scarce. In contrast, goingforward, the average maturity of nominal Treasuries as well as the rel-ative supply of TIPS are likely either to stabilize or reverse; thus, thepast downward pressure on the yield spreads will dissipate or reverseas well, leading to somewhat higher yield spreads. This event shouldnot be interpreted as an increase in expected inflation rates in themarket or as a higher inflation risk premium.
ECONOMIC REVIEW • SECOND QUARTER 2006 49
Possible impact from future pension fund reform. Many marketcommentators have discussed the potential impact to Treasurysecurities markets from possible pension fund reforms. One con-ceivable change in the regulations regarding pension funds isrelated to the matches between assets and liabilities of definedbenefit pension plans. Defined benefit pension plans typically havelong and steady liabilities, which are promised payments to retirees.In contrast, many of the pension fund investments are either inassets with shorter durations, such as mortgage-backed securities,or assets with volatile returns, such as stocks. Therefore, an impor-tant issue for pension fund regulators is how closely a pensionfund’s assets are matched in cashflow and duration of its liabilities.But any changes in this regard can potentially alter the demand forlong-term Treasuries, both nominal and inflation indexed. In par-ticular, it is possible that regulatory changes may affect demand fornominal and inflation indexed Treasuries differently, leading tochanges in the yield spreads that are unrelated to expected inflationrates or inflation risk premia.27
Recent experience in the United Kingdom suggests that thepotential magnitude of the impact to Treasury demand frompension fund reform can be sizable. In the months after lastOctober’s release of proposed new regulations regarding UK pensionsystems, yields on the nominal 50-year UK government debt securi-ties declined about 0.4 percentage point, while the yields on theinflation indexed 50-year UK government debt declined about 0.7percentage point, widening the yield spread 0.3 percentage point.Many market commentators suggest that the proposed new regula-tions, which require closer matches between pension fund assets andliabilities, have likely contributed to the movements in yields andyield spreads.
III. SUMMARY AND CONCLUSION
The liquidity risk premium in TIPS is an important component ofthe yield spread between nominal Treasuries and TIPS. In all likelihood,from 1999 to 2003 the liquidity risk premium was consistently largerthan the inflation risk premium. As the TIPS market has deepened, the
50 FEDERAL RESERVE BANK OF KANSAS CITY
liquidity risk premium has generally declined—and is likely to continueto decline for a while, at least for 5-year TIPS. Consequently, whenevaluating market-expected future inflation rates and inflation risksfrom the yield spreads, it is important to consider the impact of possiblechanges in the liquidity risk premium.
ECONOMIC REVIEW • SECOND QUARTER 2006 51
ENDNOTES
1FOMC minutes, March 22, 2005.2The U.S. Treasury Department maintains a website with much information
regarding TIPS, as well as other Treasury securities. For slightly more theoreticaldepiction of the benefits and risks of TIPS, Shen (1998) may be useful.
3Investors in TIPS are free from inflation risk only if they do not have topay income tax on the investment income, such as investment made in tax shieldaccounts. Otherwise, income tax brings back a portion of the inflation risk(Shen 1998).
4An example can illustrate the point that TIPS shield investors from inflationrisk, while nominal Treasuries do not. In January 2006, the Treasury auctioned10-year TIPS with a coupon rate of about 2 percent, and in February, a 10-yearnominal Treasury security with a coupon rate of about 4.5 percent. If an investorbought the January TIPS at the auction and holds it to maturity, the real returnto the investment will be 2 percent, but the nominal yield will depend on theactual Consumer Price Index (CPI) inflation rate for the next ten years. If CPIinflation turns out to average 2.5 percent in the next ten years, the average nom-inal yield on the TIPS will be 4.5 percent. If instead, inflation turns out to aver-age 3.5 percent, the investor’s nominal yield will be 5.5 percent. In contrast, thereal return to an investor who bought the February nominal Treasury at auctionwill be 2 percent in the first scenario, but only 1 percent in the second scenario.
5As investors may not purchase a Treasury at par and hold it to maturity, theyield of a Treasury is usually different from its return. Nevertheless, for narrativesimplicity, “yield” and “return” are used interchangeably in this article.
6As the U.S. Treasury Department has never reneged its debt obligations andis considered by most investors as highly unlikely to do so in the future, the creditrisk and credit risk premium associated with Treasury securities are generallyassumed to be zero.
7The potential existence of a premium for the risk associated with real inter-est rates is ignored. Theoretically, the risk of real interest rate fluctuation may beused by investors to hedge other risks that they are exposed to, and thus the riskpremium may be negligible, if not a discount (Den Haan). Empirically, real yieldcurves tend to be much closer to flat, suggesting negligible risk premia associatedwith real rate fluctuations.
8Again, the potential risk premium or discount associated with fluctuationsof the market prevailing real rate of interest is ignored. Some other factors thatmay influence TIPS’ yields are also ignored in the current discussion. For exam-ple, as the dollar payments of TIPS are indexed to the non seasonally adjustedoverall CPI index with a three-month lag, past inflation may affect yields of TIPSthrough its impact to the dollar prices of existing TIPS. Another factor that mayinfluence TIPS’ yields is the probability of deflation. As investors are promised toreceive at least par values of TIPS at maturity, real returns of TIPS are only fixedif inflation is positive. Under deflation, real returns of TIPS increase. Therefore,TIPS can be viewed as true “real bonds” combined with an option, the value ofwhich goes up when the risk of deflation increases.
52 FEDERAL RESERVE BANK OF KANSAS CITY
9In both charts and statistical analysis presented later, the actual data used areusually called “breakeven inflation rate (BEI).”Conceptually, these are basically thesame as yield spreads. Technically, they are constructed by finding a future infla-tion rate that will make the cashflow of a nominal Treasury identical to that of anindexed Treasury of similar maturity (Sack).
10As the real yields in both nominal and inflation indexed Treasuries reflectthe required rate of return for investors to lend to the federal government, theyought to be the same for Treasuries with similar maturity. Therefore, the realyields in the nominal and indexed Treasuries with similar maturity cancel eachother out in the yield spread.
11If the inflation (liquidity) risk premia in the 5-year and 10-year nominalTreasuries (TIPS) are identical, then the risk differential in the sizes of these twodifferential terms in the 5-year spread five years ahead will be identical to these inthe spread between 5-year nominal and inflation indexed Treasuries.
12Alternatively, if changes in the inflation and liquidity risk premia are of thesame direction and magnitude for the period, then they will cancel each other outexactly, leaving the changes in the yield spread equal to changes in expected infla-tion rates. In reality, however, this assumption is hard to justify as factors affectingthe inflation risk premium tend to be very different from factors affecting the liq-uidity risk premium.
13Although the TIPS program started in 1997, the first two years of its exis-tence were characterized by sparse TIPS and thin trading activity. The yieldspread data used in this article are, therefore, not available until the beginning of1999, as these are based on the estimated smoothed TIPS yield curve whichrequires a decent amount of data about both trading activity and around variousmaturity points (Sack).
14Both Blue Chip Consensus and SPF forecasts are the median forecasts ofgroups of professional forecasters. Blue Chip Consensus asks forecasters for theirprojections of inflation rate for each of the next ten years, from which the authorcalculates the average inflation rate for the next five or ten years. SPF directly asksthe group of forecasters their projections of the average rate of inflation for thenext ten years. Both these forecasts are considered reasonably good summaries ofsensible forecasts of future inflation. Studies suggest that most forecasters tend tobe slow in adjusting their expectations when the inflation process turns directions.But this should not be a serious issue for our sample period (Kozicki and Tinsley).
15Campbell and Shiller provide some estimates of the sizes of inflation riskpremia in nominal Treasuries.
16For example, this author speculated before the inception of TIPS that “evenif there is some difference in (market) liquidity, the difference may not be greatenough to warrant a sizable liquidity premium” (Shen, 1995).
17The bars in the chart are created by combining two or three maturitiestogether partly because the next longer-term TIPS contribute to the expectedfuture market liquidity. For example, 10-year TIPS issued in 1997 became 5-yearTIPS in 2002.
18As there are large month-to-month variations, the volume in Chart 4 is the3-month moving average of the monthly volume.
ECONOMIC REVIEW • SECOND QUARTER 2006 53
19A liquidity risk premium is roughly the product of a liquidity risk and theprice of such a risk. If investors have become more tolerant to the liquidity risk,its price falls, thus leading to a smaller liquidity risk premium even if the liquid-ity risk per se is unchanged.
20Of course, off-the-run Treasuries will mature one or two auction cycles ear-lier than on-the-run Treasuries with the same maturity, but the yield spreads usedhere have already been adjusted for this slight difference in maturity.
21For statistical reasons, the regression of changes of these variables is betterthan of levels, as it avoids possible spurious correlations between the levels of thevariables. The actual regression also allows a constant term.
22This is due to data restrictions: The Treasury Department provides disag-gregate data on outstanding volumes of bills (debt instruments with maturity lessthan one year), notes (debt with maturity between two to ten years), and bonds(debt with maturity longer than ten years).
23As the author cannot find separate data on transaction volumes on 5-year and 10-year TIPS through primary dealers, the total transaction volume isused for both 5-year and 10-year regressions even though separate volumeswould be preferable.
24The data are monthly, and a 12-lag autocorrelation is allowed for the residuals. 25Compared with some other estimates, the estimated sizes of the decline of
liquidity risk premia appear to be small, and should probably be viewed as con-servative. For example, Carlstrom and Fuerst estimated that the liquidity risk pre-mium in the 10-year TIPS declined about 85 basis points between the beginningof 2002 and late 2004 (compared to no more than 10 basis points here).
26Some market analysts have suggested that this relative decrease in the sup-ply of longer-term to shorter-term nominal Treasuries may also explain part ofthe flattening of the nominal yield curve.
27Some market analysts even speculate that many investors, including pen-sion funds and insurance companies, may have increased their purchases oflonger-term Treasuries, either in an attempt to meet the future reforms preemp-tively, or in anticipation of the price improvements when such reform proposalsbecomes law. If this is indeed the case, then some of the effect may have already,at least partially, been reflected in the current yield spreads.
54 FEDERAL RESERVE BANK OF KANSAS CITY
REFERENCES
Campbell, John Y., and Robert J. Shiller. 1996. “A Scoreboard for IndexedGovernment Debt,” NBER Macroeconomics Annual.
Carlstrom, Charles T., and Timothy S. Fuerst. 2004. “Expected Inflation andTIPS,” Federal Reserve Bank of Cleveland, Economic Commentary, November.
Den Hann, W. J. 1995. “The Term Structure of Interest Rates in Real andMonetary Economies,” Journal of Economic Dynamics and Control, vol. 19,issues 5-7, pp. 909-40.
Kozicki, S., and P. A. Tinsley. 2001. “Shifting Endpoints in the Term Structure ofInterest Rates,” Journal of Monetary Economics, vol. 47, no. 3, pp. 613-52.
Sack, Brian. 2000. “Deriving Inflation Expectations from Nominal and Inflation-Indexed Treasury Yields,” The Journal of Fixed Income, vol. 10, no. 2, pp. 6-17.
Shen, Pu. 1998. “How Important Is the Inflation Risk Premium?” Federal ReserveBank of Kansas City, Economic Review, Fourth Quarter.
________. 1995. “Benefits and Limitations of Inflation Indexed Treasury Bonds,”Federal Reserve Bank of Kansas City, Economic Review, Third Quarter.