Lisa McDermott, Alison J Wright, Victoria Cornelius, Caroline Burgess, Alice S Forster, Mark Ashworth, Bernadette Khoshaba, Philippa Clery, Frances Fuller, Jane Miller, Hiten Dodhia, Caroline Rudisill, Mark T Conner and Martin C Gulliford
Enhanced invitation methods and uptake of health checks in primary care. Rapid randomised controlled trial using electronic health records Article (Published version) (Refereed)
HEALTH TECHNOLOGY ASSESSMENTVOLUME 20 ISSUE 84 NOVEMBER 2016
ISSN 1366-5278
DOI 10.3310/hta20840
Enhanced invitation methods and uptake of health checks in primary care: randomised controlled trial and cohort study using electronic health records
Lisa McDermott, Alison J Wright, Victoria Cornelius, Caroline Burgess, Alice S Forster, Mark Ashworth, Bernadette Khoshaba, Philippa Clery, Frances Fuller, Jane Miller, Hiten Dodhia, Caroline Rudisill, Mark T Conner and Martin C Gulliford
Enhanced invitation methods and uptakeof health checks in primary care:randomised controlled trial and cohortstudy using electronic health records
Lisa McDermott,1 Alison J Wright,1* Victoria Cornelius,1
Caroline Burgess,1 Alice S Forster,1 Mark Ashworth,1
1Department of Primary Care and Public Health Sciences, King’s College London,London, UK
2Public Health Directorate, Lewisham Borough Council, London, UK3Public Health Directorate, Lambeth Borough Council, London, UK4Department of Social Policy, London School of Economics and Political Science,London, UK
5School of Psychology, University of Leeds, Leeds, UK6NIHR Biomedical Research Centre at Guy’s and St Thomas’ Hospitals,Guy’s Hospital, London, UK
*Corresponding author
Declared competing interests of authors: none
Published November 2016DOI: 10.3310/hta20840
This report should be referenced as follows:
McDermott L, Wright AJ, Cornelius V, Burgess C, Forster AS, Ashworth M, et al. Enhancedinvitation methods and uptake of health checks in primary care: randomised controlled trial and
cohort study using electronic health records. Health Technol Assess 2016;20(84).
Health Technology Assessment is indexed and abstracted in Index Medicus/MEDLINE, ExcerptaMedica/EMBASE, Science Citation Index Expanded (SciSearch®) and Current Contents®/Clinical Medicine.
Health Technology Assessment HTA/HTA TAR
ISSN 1366-5278 (Print)
ISSN 2046-4924 (Online)
Impact factor: 4.058
Health Technology Assessment is indexed in MEDLINE, CINAHL, EMBASE, The Cochrane Library and the ISI Science Citation Index.
This journal is a member of and subscribes to the principles of the Committee on Publication Ethics (COPE) (www.publicationethics.org/).
The full HTA archive is freely available to view online at www.journalslibrary.nihr.ac.uk/hta. Print-on-demand copies can be purchased from thereport pages of the NIHR Journals Library website: www.journalslibrary.nihr.ac.uk
Criteria for inclusion in the Health Technology Assessment journalReports are published in Health Technology Assessment (HTA) if (1) they have resulted from work for the HTA programme, and (2) theyare of a sufficiently high scientific quality as assessed by the reviewers and editors.
Reviews in Health Technology Assessment are termed ‘systematic’ when the account of the search appraisal and synthesis methods (tominimise biases and random errors) would, in theory, permit the replication of the review by others.
HTA programmeThe HTA programme, part of the National Institute for Health Research (NIHR), was set up in 1993. It produces high-quality researchinformation on the effectiveness, costs and broader impact of health technologies for those who use, manage and provide care in the NHS.‘Health technologies’ are broadly defined as all interventions used to promote health, prevent and treat disease, and improve rehabilitationand long-term care.
The journal is indexed in NHS Evidence via its abstracts included in MEDLINE and its Technology Assessment Reports inform National Institutefor Health and Care Excellence (NICE) guidance. HTA research is also an important source of evidence for National Screening Committee (NSC)policy decisions.
For more information about the HTA programme please visit the website: http://www.nets.nihr.ac.uk/programmes/hta
This reportThe research reported in this issue of the journal was funded by the HTA programme as project number 11/129/61. The contractual start datewas in May 2013. The draft report began editorial review in January 2016 and was accepted for publication in June 2016. The authors havebeen wholly responsible for all data collection, analysis and interpretation, and for writing up their work. The HTA editors and publisher havetried to ensure the accuracy of the authors’ report and would like to thank the reviewers for their constructive comments on the draftdocument. However, they do not accept liability for damages or losses arising from material published in this report.
This report presents independent research funded by the National Institute for Health Research (NIHR). The views and opinions expressed byauthors in this publication are those of the authors and do not necessarily reflect those of the NHS, the NIHR, NETSCC, the HTA programmeor the Department of Health. If there are verbatim quotations included in this publication the views and opinions expressed by theinterviewees are those of the interviewees and do not necessarily reflect those of the authors, those of the NHS, the NIHR, NETSCC, the HTAprogramme or the Department of Health.
Published by the NIHR Journals Library (www.journalslibrary.nihr.ac.uk), produced by Prepress Projects Ltd, Perth, Scotland(www.prepress-projects.co.uk).
Editor-in-Chief
Health Technology Assessment
NIHR Journals Library
Professor Tom Walley Director, NIHR Evaluation, Trials and Studies and Director of the EME Programme, UK
NIHR Journals Library Editors
Professor Ken Stein Chair of HTA Editorial Board and Professor of Public Health, University of Exeter Medical School, UK
Professor Andree Le May Chair of NIHR Journals Library Editorial Group (EME, HS&DR, PGfAR, PHR journals)
Dr Martin Ashton-Key Consultant in Public Health Medicine/Consultant Advisor, NETSCC, UK
Professor Matthias Beck Chair in Public Sector Management and Subject Leader (Management Group), Queen’s University Management School, Queen’s University Belfast, UK
Professor Aileen Clarke Professor of Public Health and Health Services Research, Warwick Medical School, University of Warwick, UK
Dr Tessa Crilly Director, Crystal Blue Consulting Ltd, UK
Ms Tara Lamont Scientific Advisor, NETSCC, UK
Professor William McGuire Professor of Child Health, Hull York Medical School, University of York, UK
Professor John Norrie Chair in Medical Statistics, University of Edinburgh, UK
Professor John Powell Consultant Clinical Adviser, National Institute for Health and Care Excellence (NICE), UK
Professor James Raftery Professor of Health Technology Assessment, Wessex Institute, Faculty of Medicine, University of Southampton, UK
Dr Rob Riemsma Reviews Manager, Kleijnen Systematic Reviews Ltd, UK
Professor Helen Roberts Professor of Child Health Research, UCL Institute of Child Health, UK
Professor Helen Snooks Professor of Health Services Research, Institute of Life Science, College of Medicine, Swansea University, UK
Professor Jim Thornton Professor of Obstetrics and Gynaecology, Faculty of Medicine and Health Sciences, University of Nottingham, UK
Please visit the website for a list of members of the NIHR Journals Library Board: www.journalslibrary.nihr.ac.uk/about/editors
Professor Geoffrey Meads Professor of Health Sciences Research, Health and Wellbeing Research andDevelopment Group, University of Winchester, UK
Editor-in-Chief
Professor Hywel Williams Director, HTA Programme, UK and Foundation Professor and Co-Director of theCentre of Evidence-Based Dermatology, University of Nottingham, UK
Professor Jonathan Ross Professor of Sexual Health and HIV, University Hospital Birmingham, UK
Dr Eugenia Cronin Senior Scientific Advisor, Wessex Institute, UK
Professor Martin Underwood Director, Warwick Clinical Trials Unit, Warwick Medical School,University of Warwick, UK
Enhanced invitation methods and uptake of health checks inprimary care: randomised controlled trial and cohort studyusing electronic health records
Lisa McDermott,1 Alison J Wright,1* Victoria Cornelius,1
Caroline Burgess,1 Alice S Forster,1 Mark Ashworth,1
Bernadette Khoshaba,1 Philippa Clery,1 Frances Fuller,2 Jane Miller,2
Hiten Dodhia,3 Caroline Rudisill,4 Mark T Conner5
and Martin C Gulliford1,6
1Department of Primary Care and Public Health Sciences, King’s College London, London, UK2Public Health Directorate, Lewisham Borough Council, London, UK3Public Health Directorate, Lambeth Borough Council, London, UK4Department of Social Policy, London School of Economics and Political Science, London, UK5School of Psychology, University of Leeds, Leeds, UK6NIHR Biomedical Research Centre at Guy’s and St Thomas’ Hospitals, Guy’s Hospital, London, UK
Background: A national programme of health checks to identify risk of cardiovascular disease (CVD) isbeing rolled out but is encountering difficulties because of low uptake.
Objective: To evaluate the effectiveness of an enhanced invitation method using the question–behavioureffect (QBE), with or without the offer of a financial incentive to return the QBE questionnaire, atincreasing the uptake of health checks. The research went on to evaluate the reasons for the low uptakeof invitations and compare the case mix for invited and opportunistic health checks.
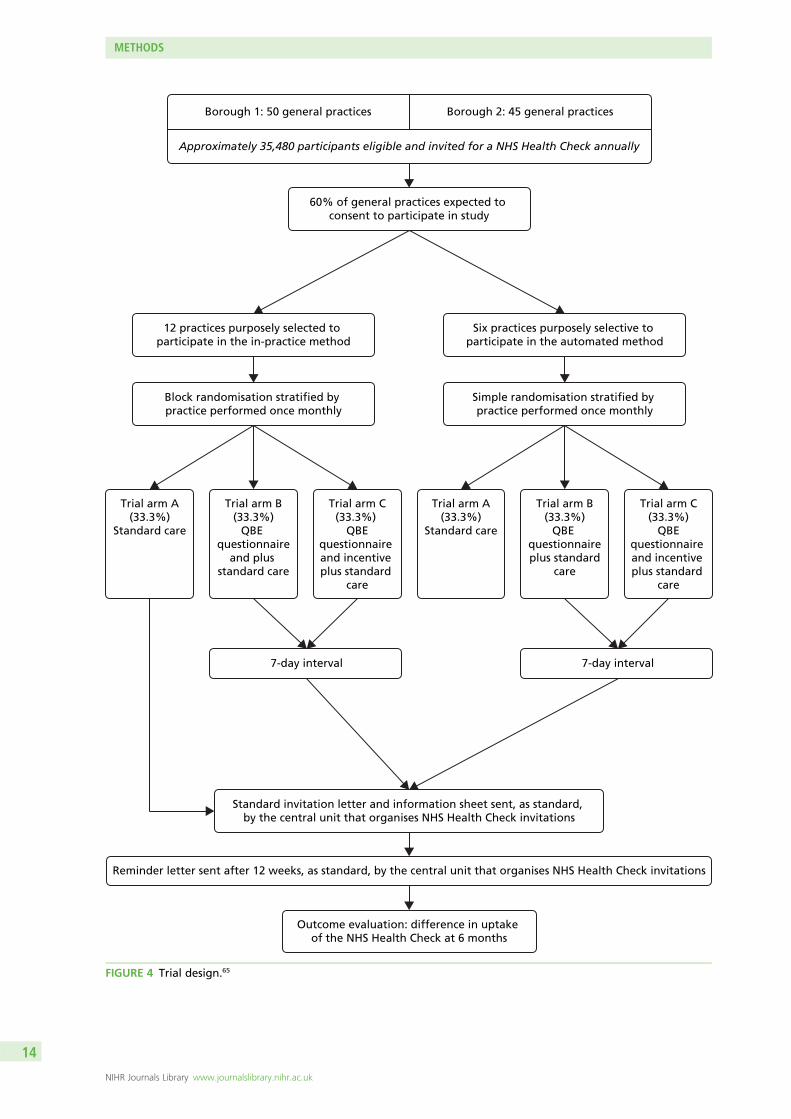
Design: Three-arm randomised trial and cohort study.
Participants: All participants invited for a health check from 18 general practices. Individual participantswere randomised.
Interventions: (1) Standard health check invitation only; (2) QBE questionnaire followed by a standardinvitation; and (3) QBE questionnaire with offer of a financial incentive to return the questionnaire,followed by a standard invitation.
Main outcome measures: The primary outcome was completion of the health check within 6 monthsof invitation. A p-value of 0.0167 was used for significance. In the cohort study of all health checkscompleted during the study period, the case mix was compared for participants responding to invitationsand those receiving ‘opportunistic’ health checks. Participants were not aware that several types ofinvitation were in use. The research team were blind to trial arm allocation at outcome data extraction.
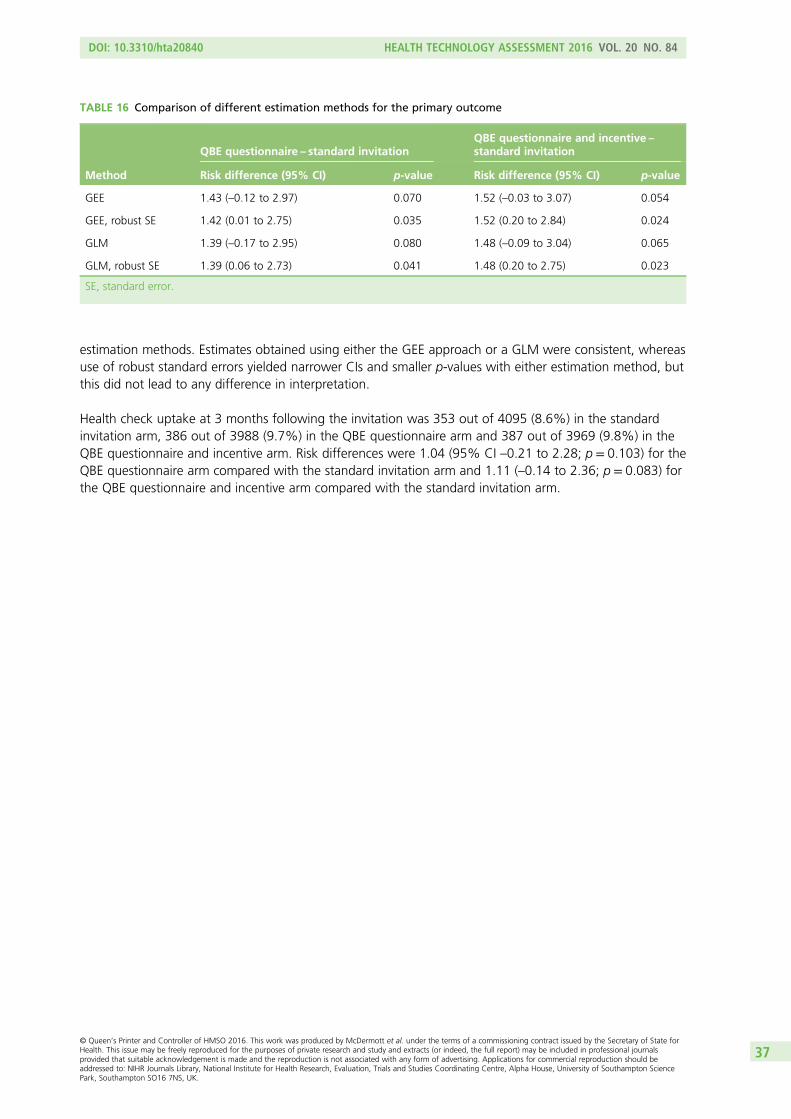
Results: In total, 12,459 participants were included in the trial and health check uptake was evaluated for12,052 participants for whom outcome data were collected. Health check uptake was as follows: standardinvitation, 590 out of 4095 (14.41%); QBE questionnaire, 630 out of 3988 (15.80%); QBE questionnaireand financial incentive, 629 out of 3969 (15.85%). The increase in uptake associated with the QBEquestionnaire was 1.43% [95% confidence interval (CI) –0.12% to 2.97%; p = 0.070] and the increase in
DOI: 10.3310/hta20840 HEALTH TECHNOLOGY ASSESSMENT 2016 VOL. 20 NO. 84
uptake associated with the QBE questionnaire and offer of financial incentive was 1.52% (95% CI –0.03%to 3.07%; p = 0.054). The difference in uptake associated with the offer of an incentive to return the QBEquestionnaire was –0.01% (95% CI –1.59% to 1.58%; p = 0.995). During the study period, 58% ofhealth check cardiovascular risk assessments did not follow a trial invitation. People who received an‘opportunistic’ health check had greater odds of a ≥ 10% CVD risk than those who received an invitedhealth check (adjusted odds ratio 1.70, 95% CI 1.45 to 1.99; p < 0.001).
Conclusions: Uptake of a health check following an invitation letter is low and is not increased throughan enhanced invitation method using the QBE. The offer of a £5 incentive did not increase the rate ofreturn of the QBE questionnaire. A high proportion of all health checks are performed opportunisticallyand not in response to a standard invitation letter. Participants receiving opportunistic checks are at higherrisk of CVD than those responding to standard invitations. Future research should aim to increase theaccessibility of preventative medical interventions to increase uptake. Research should also explore thewider use of electronic health records in delivering efficient trials.
Trial registration: Current Controlled Trials ISRCTN42856343.
Funding: This project was funded by the NIHR Health Technology Assessment programme and will bepublished in full in Health Technology Assessment; Vol. 20, No. 84. See the NIHR Journals Library websitefor further project information.
Chapter 1 Introduction 1Burden of disease 1Inequalities and cardiovascular risk 1The NHS Health Check programme 1Programme implementation 1Eligibility for the NHS Health Check programme 2Health check process 2Evidence of effectiveness 2Economic modelling for cost-effectiveness estimates 4Uptake of the NHS Health Check programme 4Evaluations of the roll-out of health checks 4Evidence regarding effective interventions to increase the uptake of health checksor screening 5How does the question–behaviour effect work? 7Recent systematic review and other evidence regarding the question–behaviour effect 7Financial incentives to increase questionnaire return rates 8What is the potential impact of the question–behaviour effect on socioeconomicinequalities in uptake? 9How might offering an incentive for questionnaire return affect the social patterning ofresponses to the question–behaviour effect? 9Will informed choice be evaluated? 10Uptake patterns 10Research objectives 10Context 11
Chapter 2 Methods 13Trial design 13Setting 13General practice recruitment 13Individual participant recruitment 13Recruitment and randomisation 15
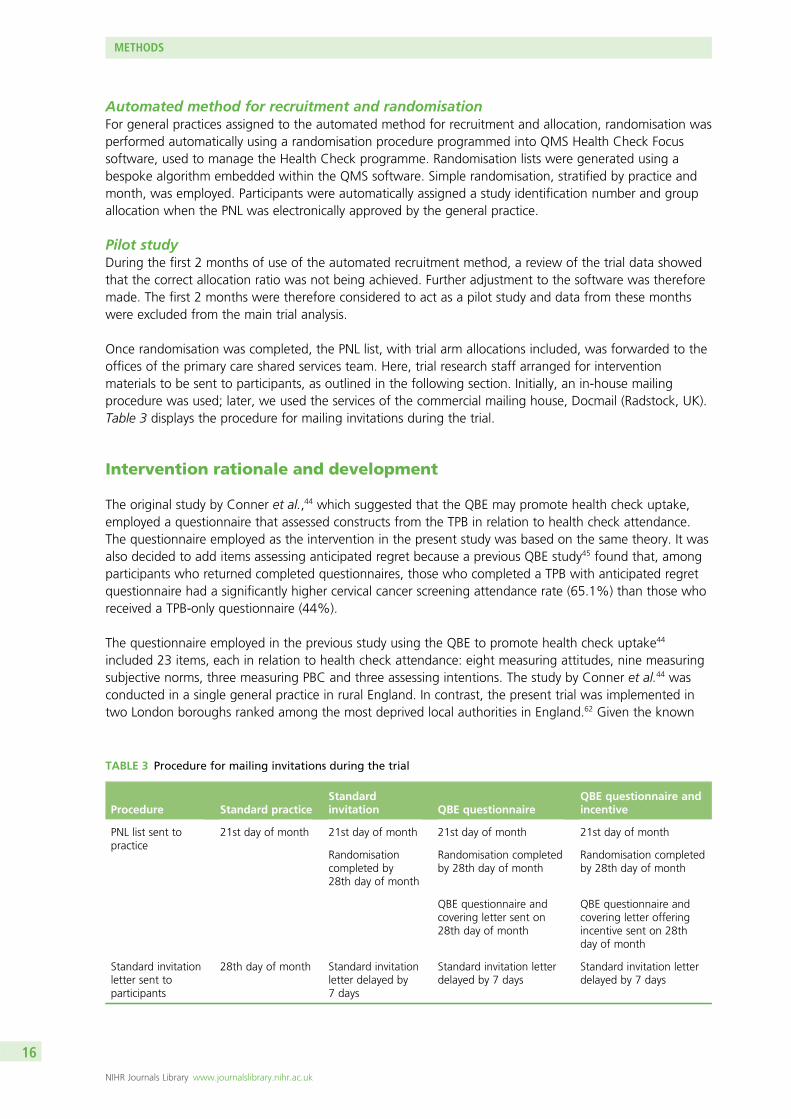
In-practice method for recruitment and randomisation 15Automated method for recruitment and randomisation 16Pilot study 16
DOI: 10.3310/hta20840 HEALTH TECHNOLOGY ASSESSMENT 2016 VOL. 20 NO. 84
Intervention rationale and development 16Patient and public involvement 18Justification of the incentive 18Details of the interventions received in each trial arm 18
Languages other than English 18Sample size 19Blinding 19Duration of the treatment period 20Outcome data collection 20Reliability and data checking 21Data analysis plan: data description 21
Baseline comparability of randomised groups 21Data analysis plan: inferential analysis 22
Analysis of the primary outcome 22Sensitivity analysis of the primary outcome 23Analysis of secondary outcomes 23
Evaluation of the study as a rapid trial and analysis of the randomisation methods 24Statistical considerations 24
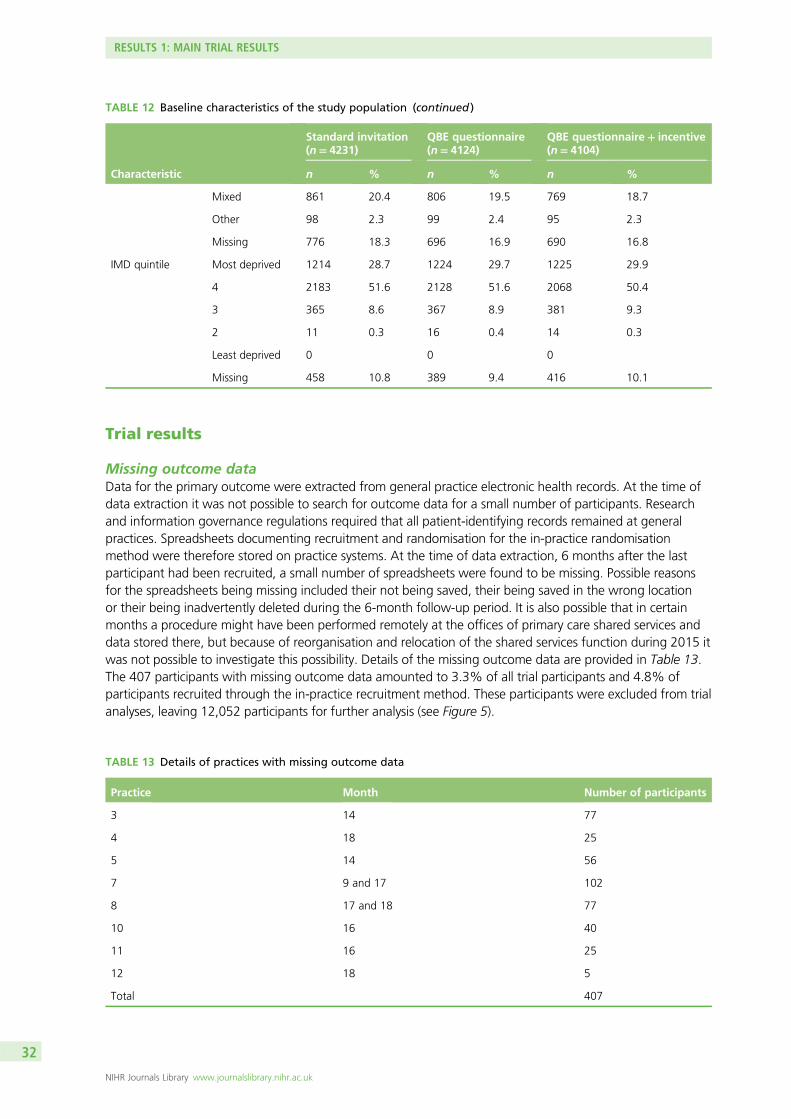
Missing outcome data 24Software for statistical analysis 24Economic evaluation 24Cohort study 25Process evaluation and qualitative study 25
Themes and objectives 25Delivery of the NHS Health Check programme: practice staff and programmelead perspectives 25Interviews with general practice and Health Check programme staff 25Content analysis of participant free-text responses 26Patient interview study 26
Ethical arrangements 26Research governance 26
Chapter 3 Results 1: main trial results 27Recruitment of general practices and participants 27
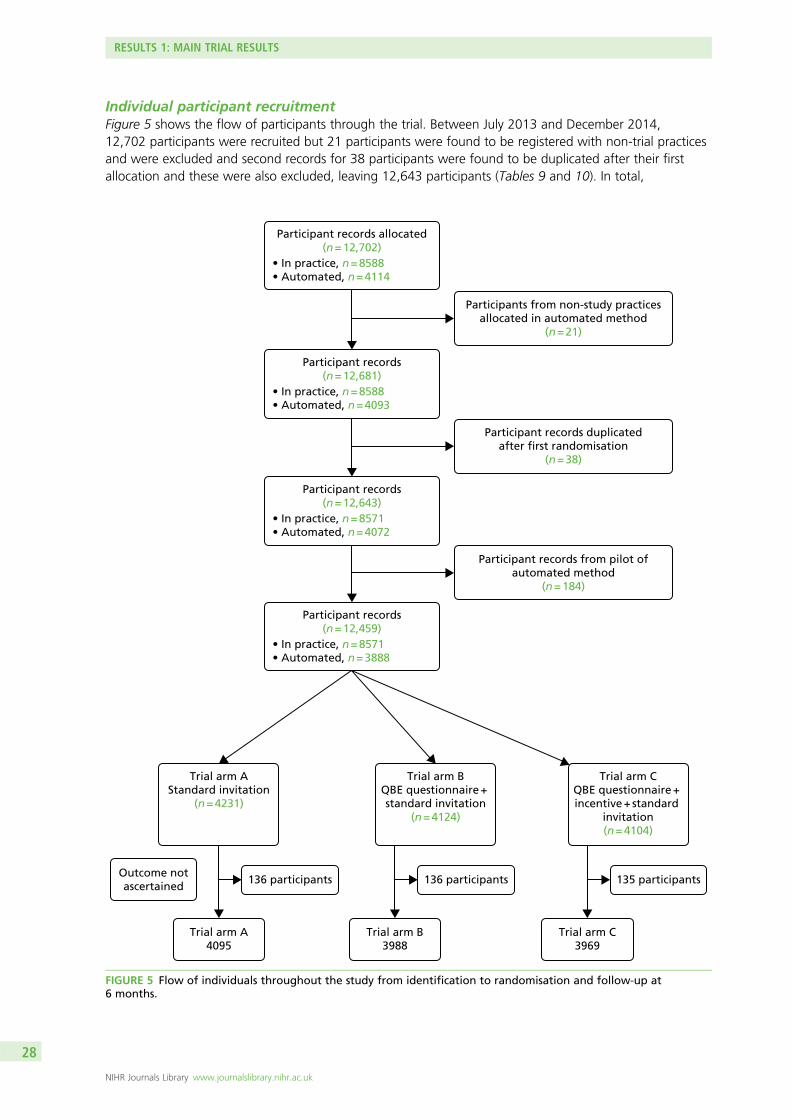
General practice recruitment 27Individual participant recruitment 28
Trial results 32Missing outcome data 32Primary and subgroup analyses 33Secondary analyses 34
Chapter 7 Results 5: process evaluation and qualitative study 55Interviews with general practice staff 55
Attitudes towards health checks 55Attitudes towards service delivery of the health checks 56Attitudes towards the randomised controlled trial 57Conclusions 58
Content analysis of participant responses 58Views about the health check 58Views about the question–behaviour effect intervention (questionnaire) 59Conclusions 60
Patient interview study 60Conclusions 62
Chapter 8 Discussion 63Invitation methods for health checks and the question–behaviour effect 64How do the results compare with those of other studies of the question–behavioureffect? 64The nature of the question–behaviour effect intervention used in this trial 65How did offering a financial incentive affect the impact of the question–behaviour effectintervention? 66Cost-effectiveness 68Rapid trials using electronic health records 68Uptake of health checks 68Conclusions from qualitative studies 69Opportunistic compared with invited health checks 70Strengths and limitations of this research 70Research recommendations 71
NHS Health Check programme 71The question–behaviour effect 71Methods for conducting rapid trials using electronic health records 72
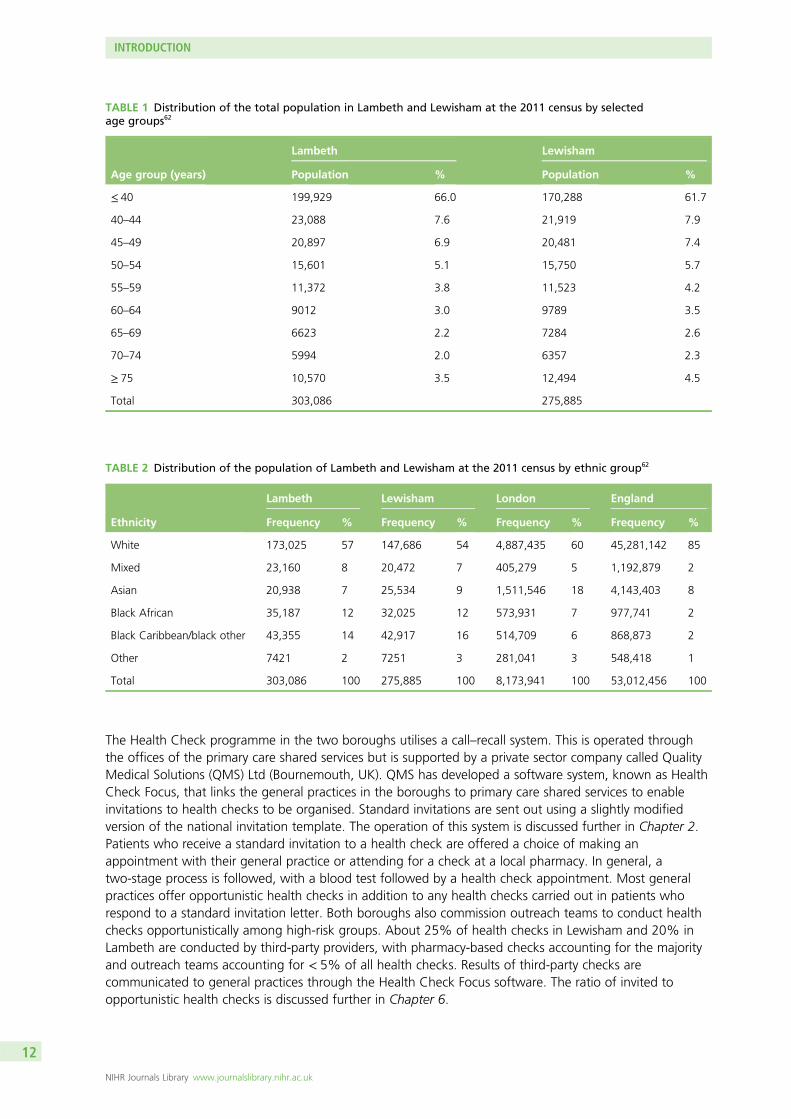
TABLE 1 Distribution of the total population in Lambeth and Lewisham at the2011 census by selected age groups 12
TABLE 2 Distribution of the population of Lambeth and Lewisham at the 2011census by ethnic group 12
TABLE 3 Procedure for mailing invitations during the trial 16
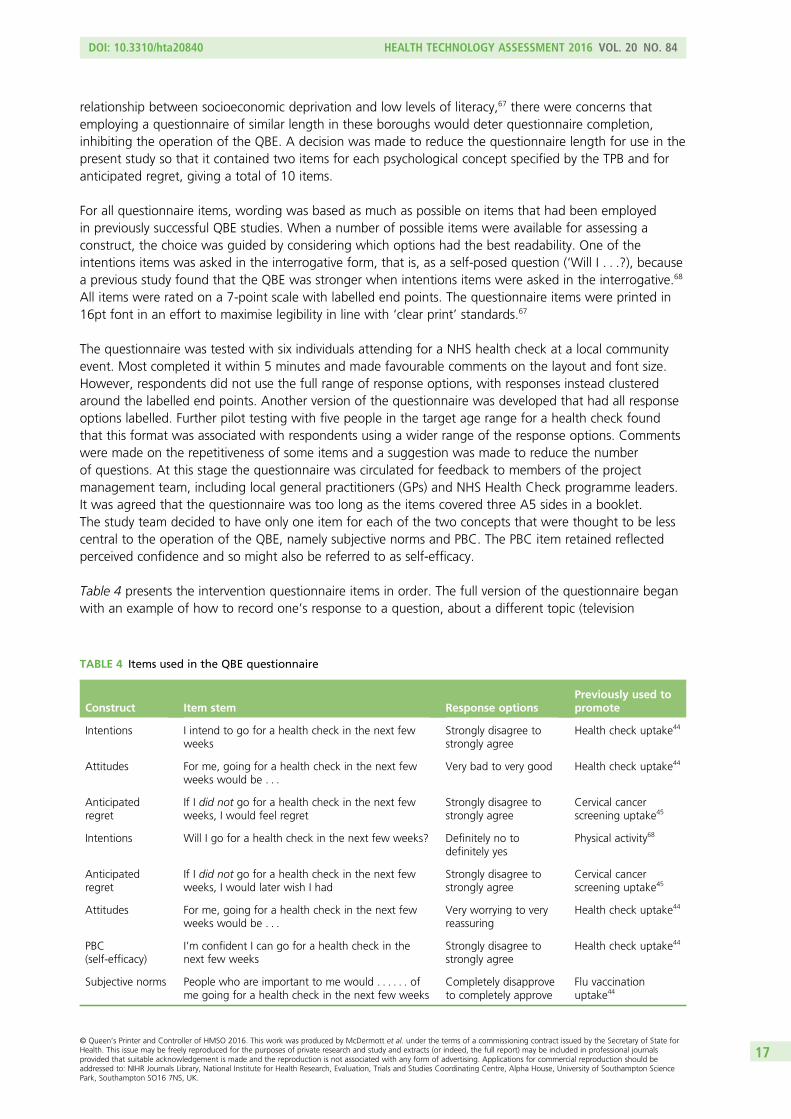
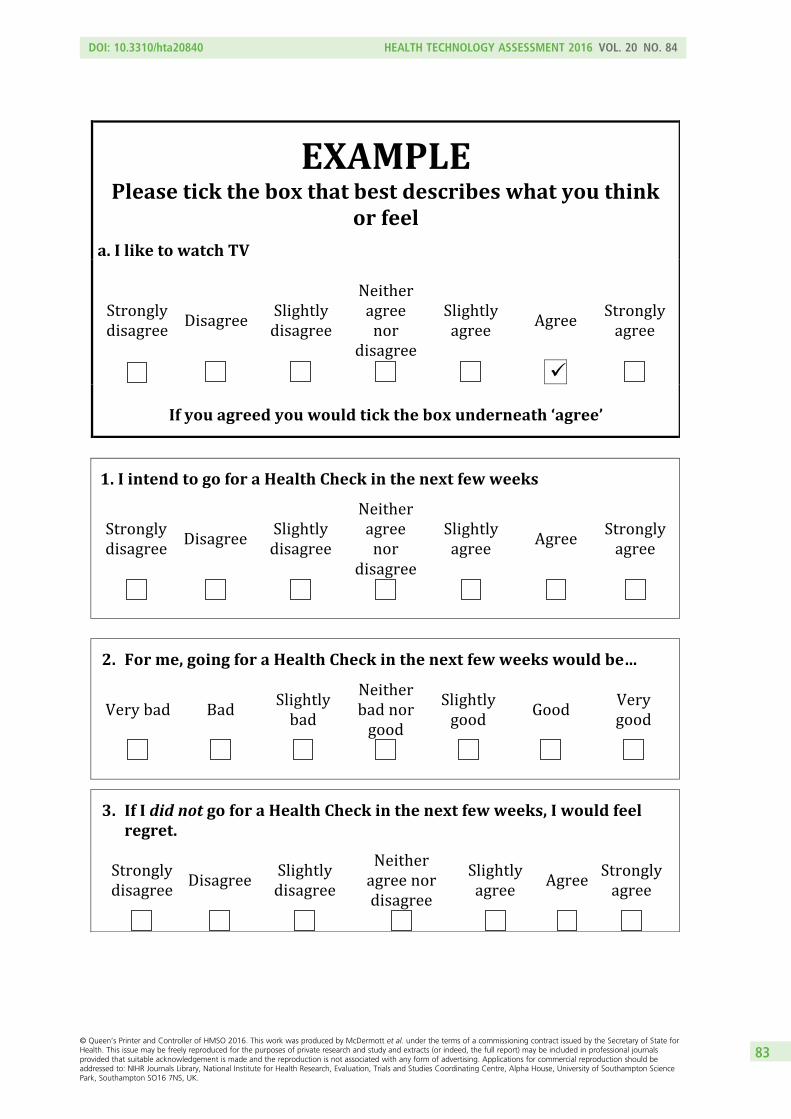
TABLE 4 Items used in the QBE questionnaire 17
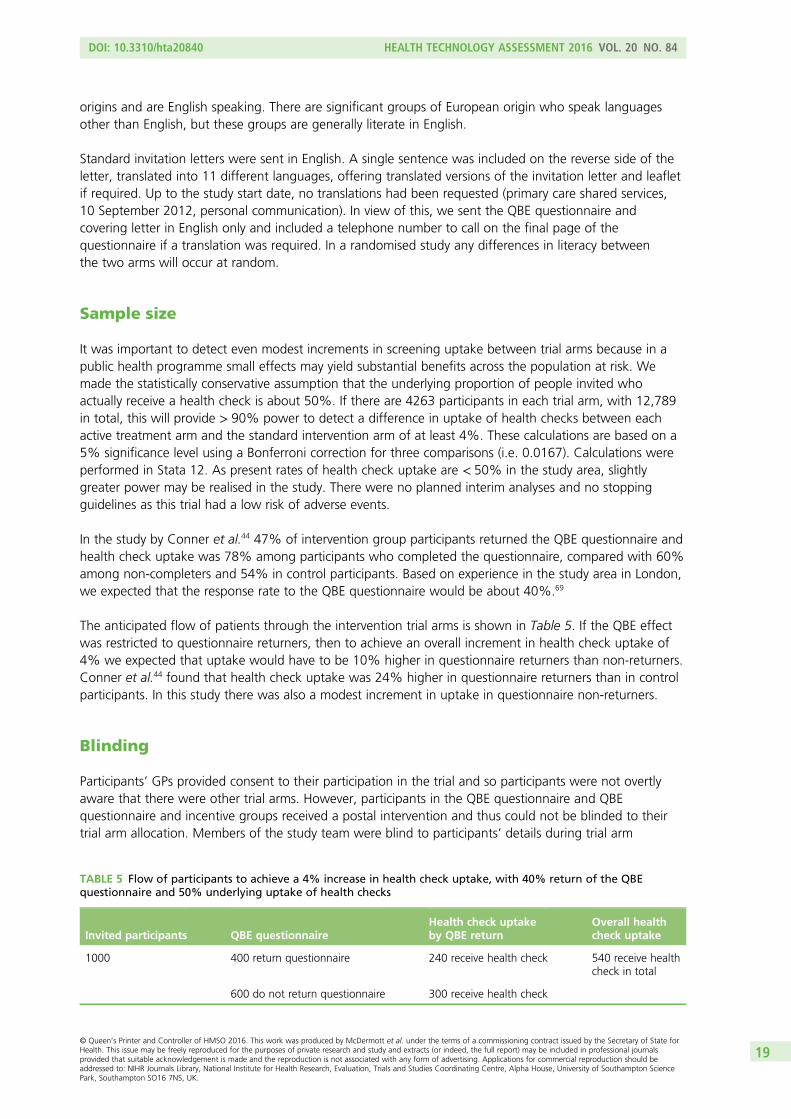
TABLE 5 Flow of participants to achieve a 4% increase in health check uptake,with 40% return of the QBE questionnaire and 50% underlying uptake ofhealth checks 19
TABLE 6 Codes for completion of the NHS health check and CVD risk scores 20
TABLE 7 Coding of ethnicity for study 22
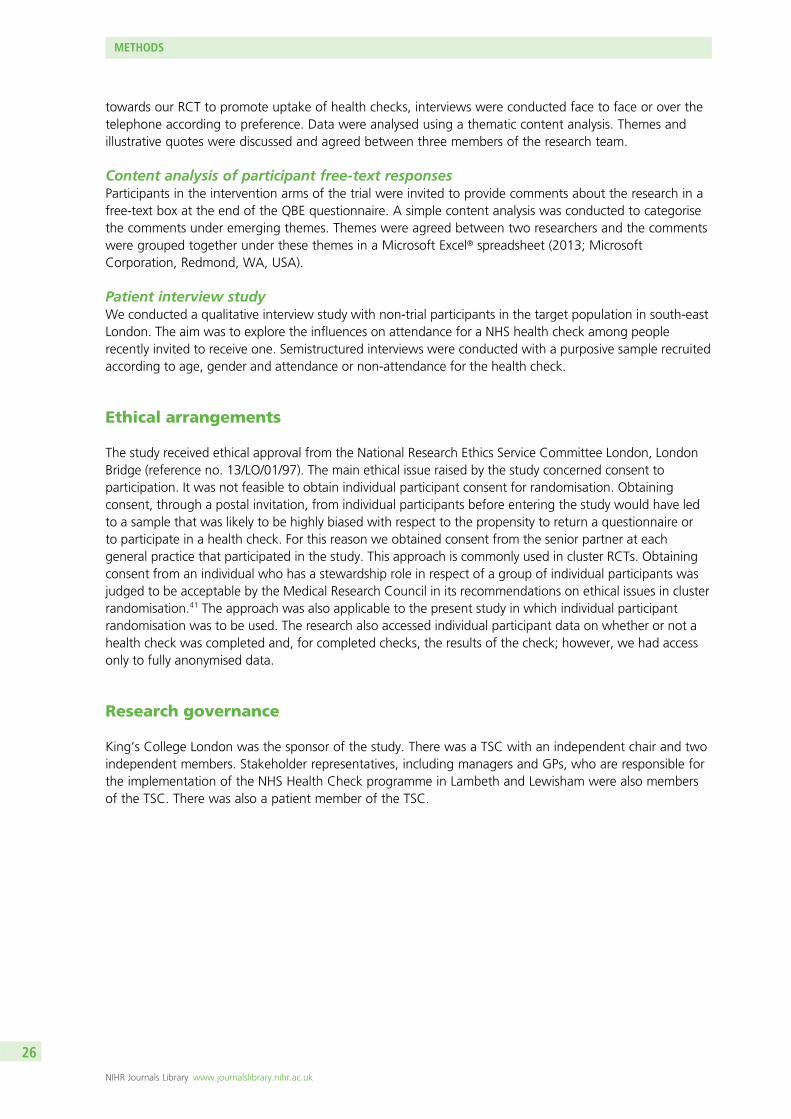
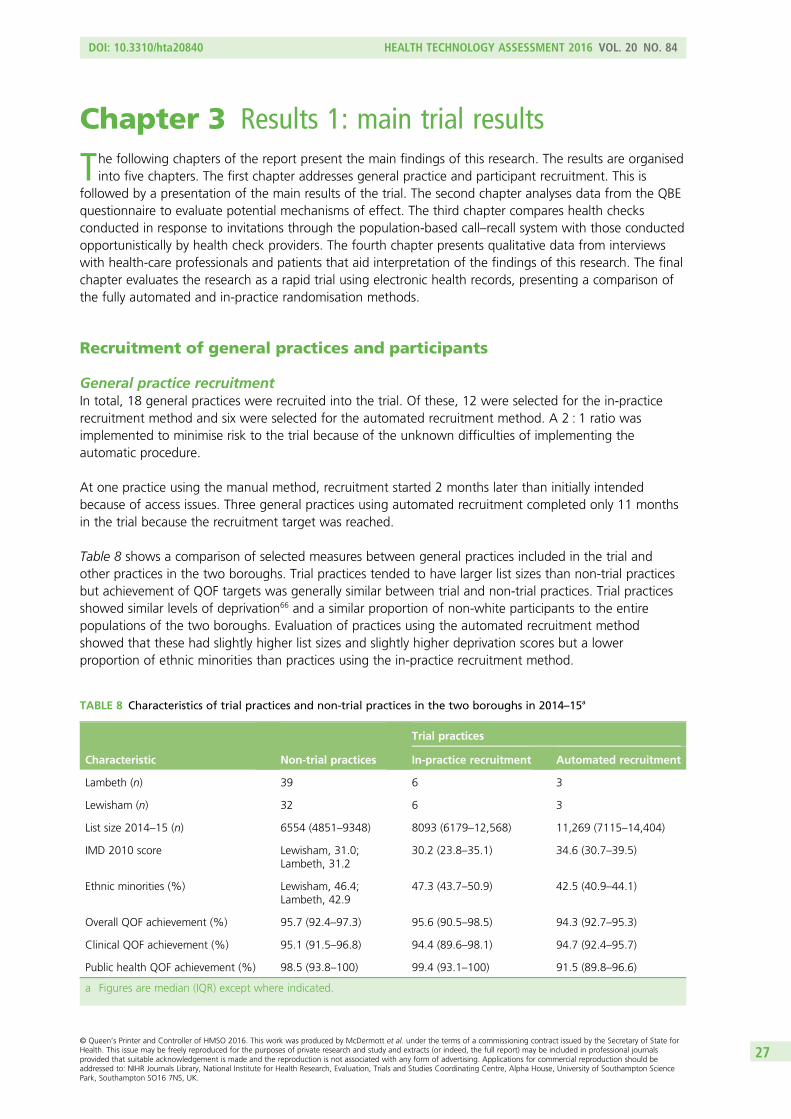
TABLE 8 Characteristics of trial practices and non-trial practices in the twoboroughs in 2014–15 27
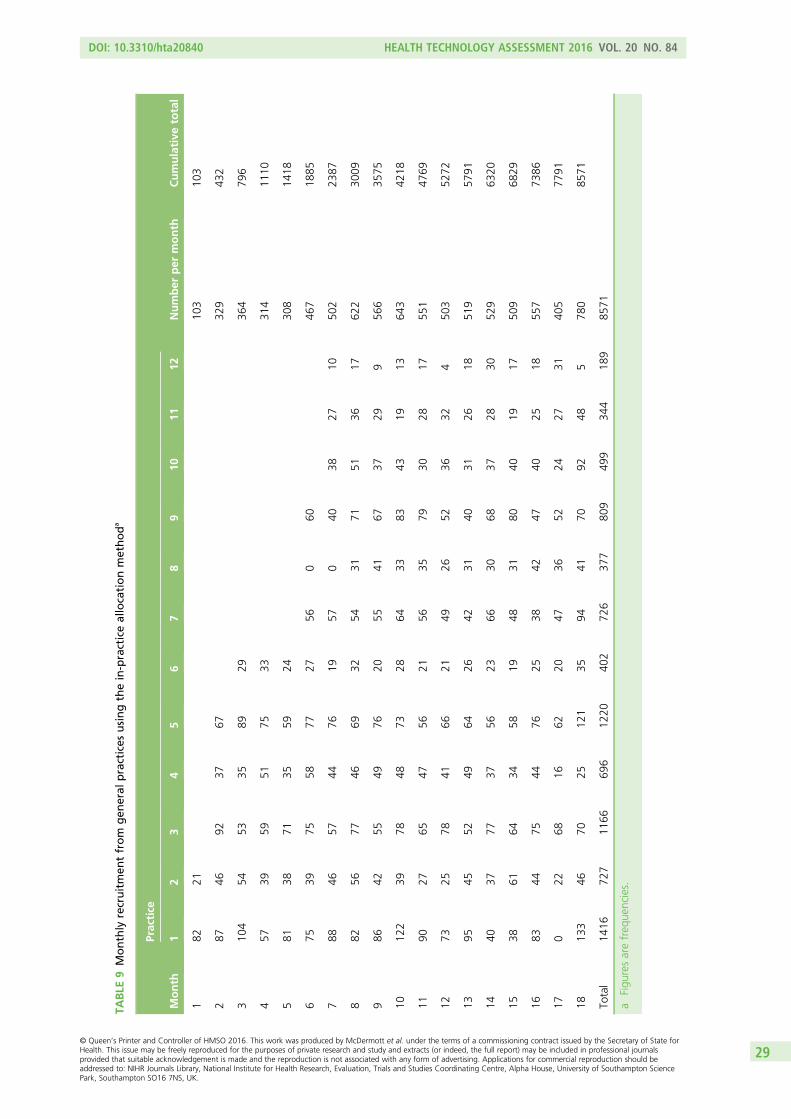
TABLE 9 Monthly recruitment from general practices using the in-practiceallocation method 29
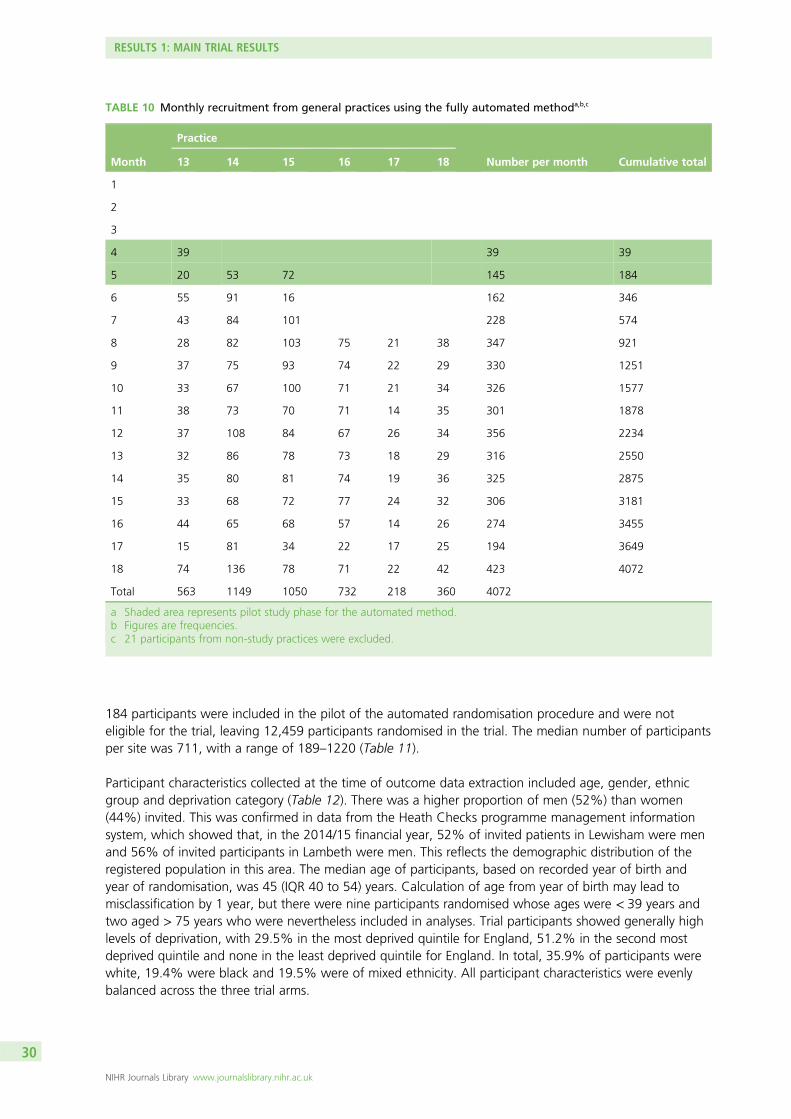
TABLE 10 Monthly recruitment from general practices using the fullyautomated method 30
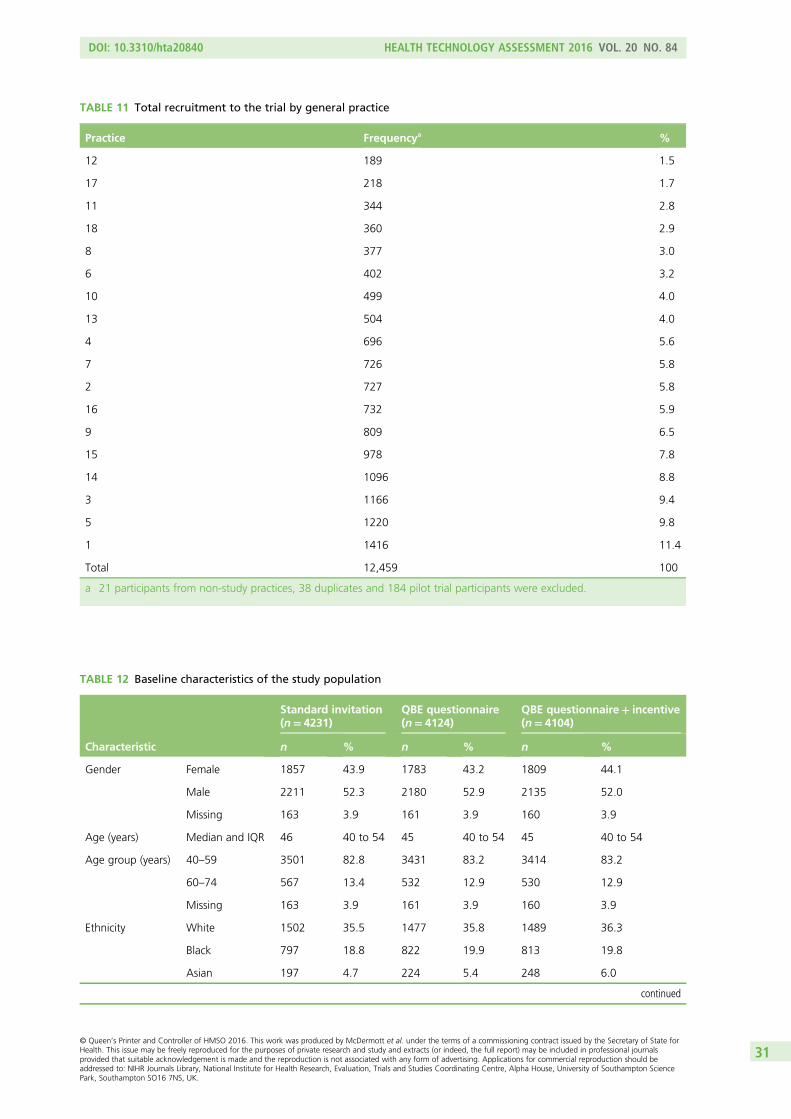
TABLE 11 Total recruitment to the trial by general practice 31
TABLE 12 Baseline characteristics of the study population 31
TABLE 13 Details of practices with missing outcome data 32
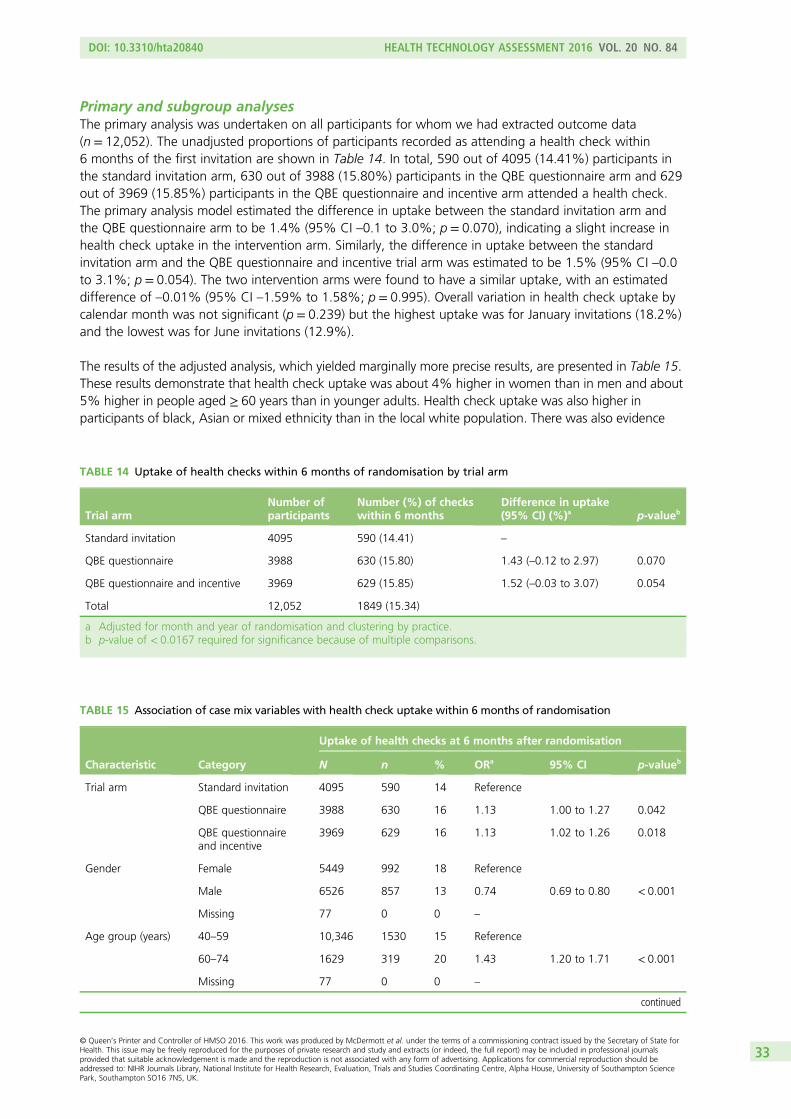
TABLE 14 Uptake of health checks within 6 months of randomisation by trial arm 33
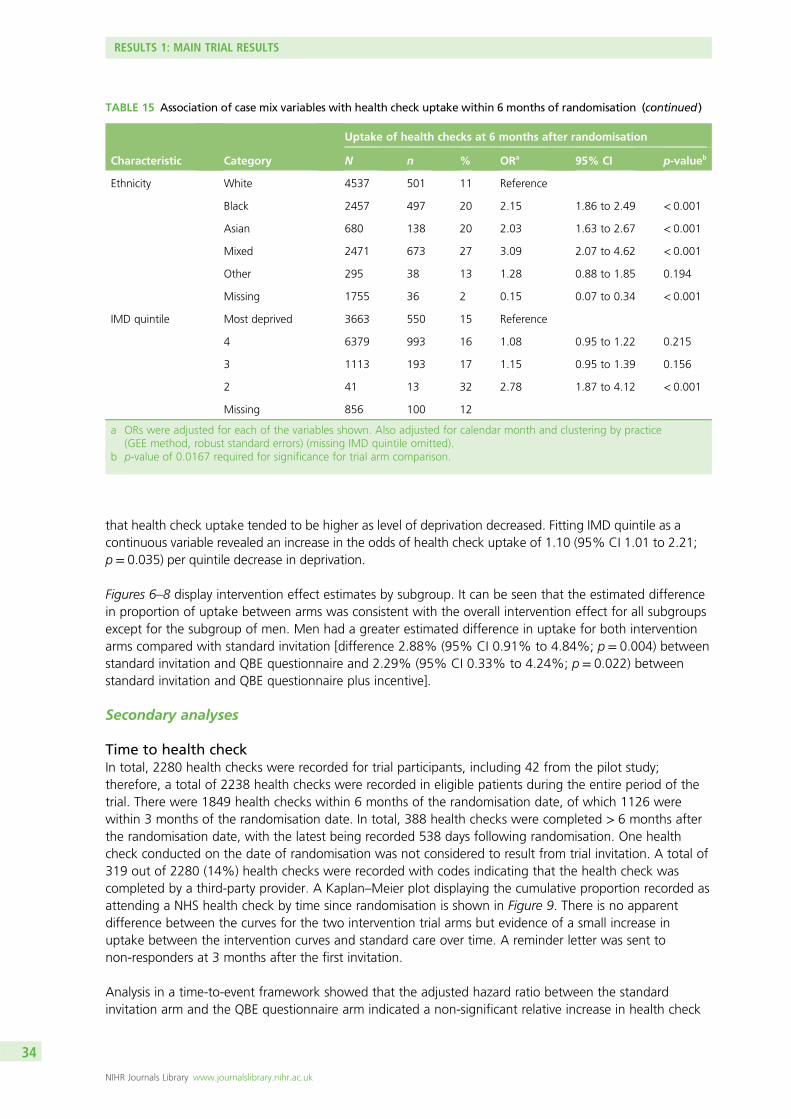
TABLE 15 Association of case mix variables with health check uptake within6 months of randomisation 33
TABLE 16 Comparison of different estimation methods for the primary outcome 37
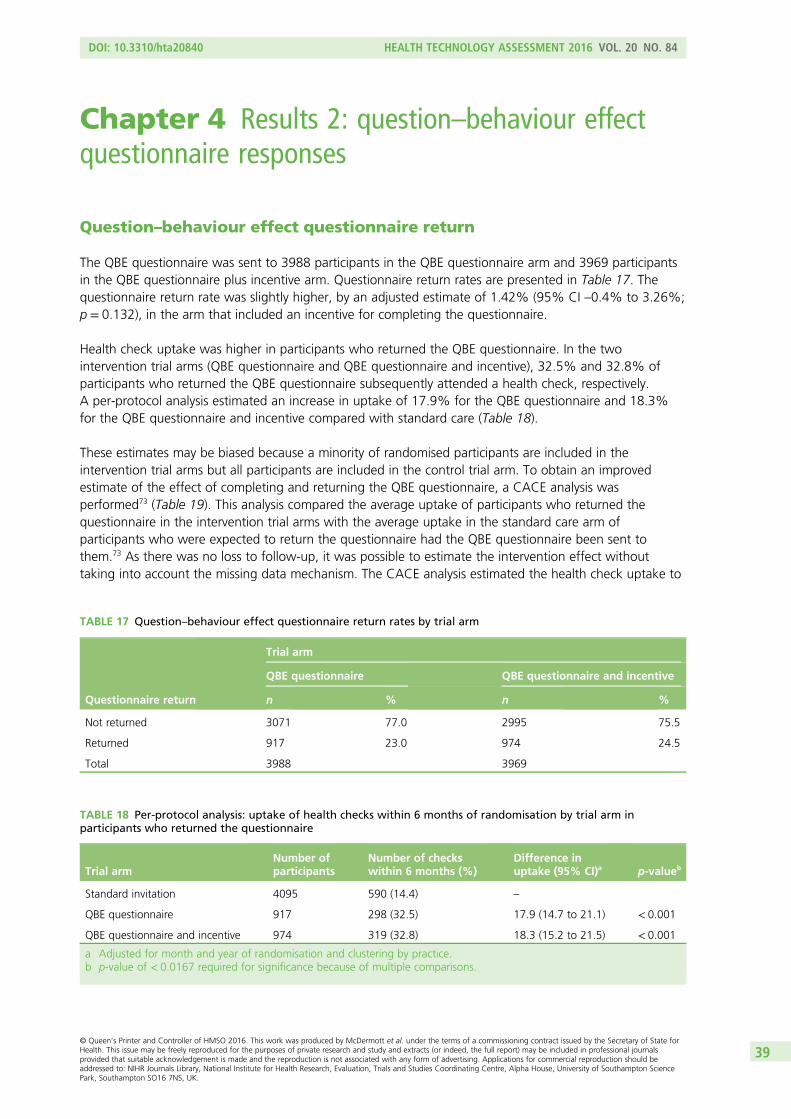
TABLE 17 Question–behaviour effect questionnaire return rates by trial arm 39
TABLE 18 Per-protocol analysis: uptake of health checks within 6 months ofrandomisation by trial arm in participants who returned the questionnaire 39
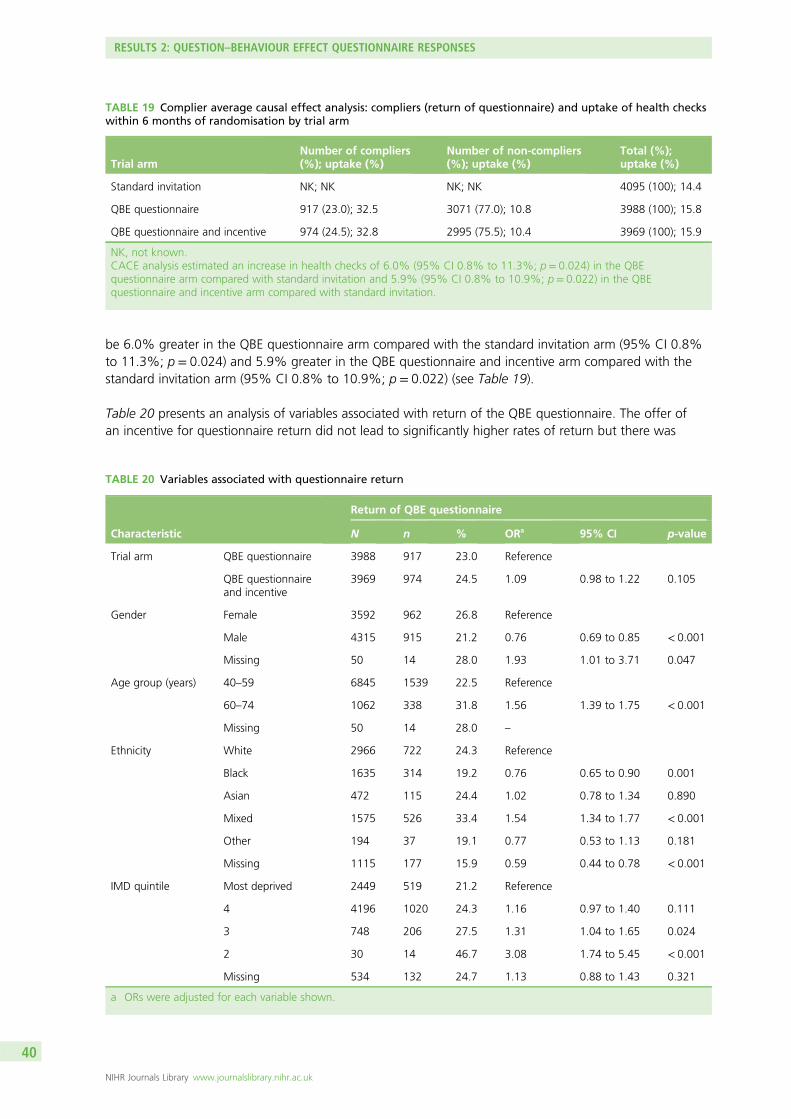
TABLE 19 Complier average causal effect analysis: compliers (return ofquestionnaire) and uptake of health checks within 6 months of randomisationby trial arm 40
DOI: 10.3310/hta20840 HEALTH TECHNOLOGY ASSESSMENT 2016 VOL. 20 NO. 84
TABLE 20 Variables associated with questionnaire return 40
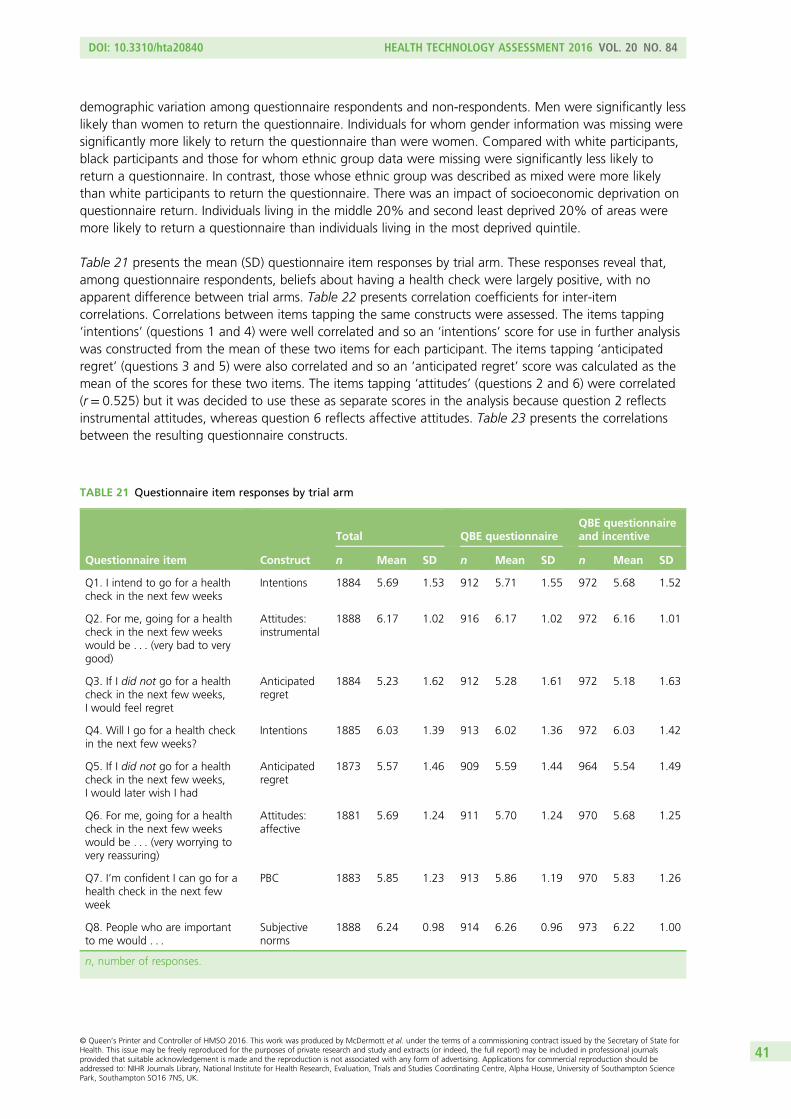
TABLE 21 Questionnaire item responses by trial arm 41
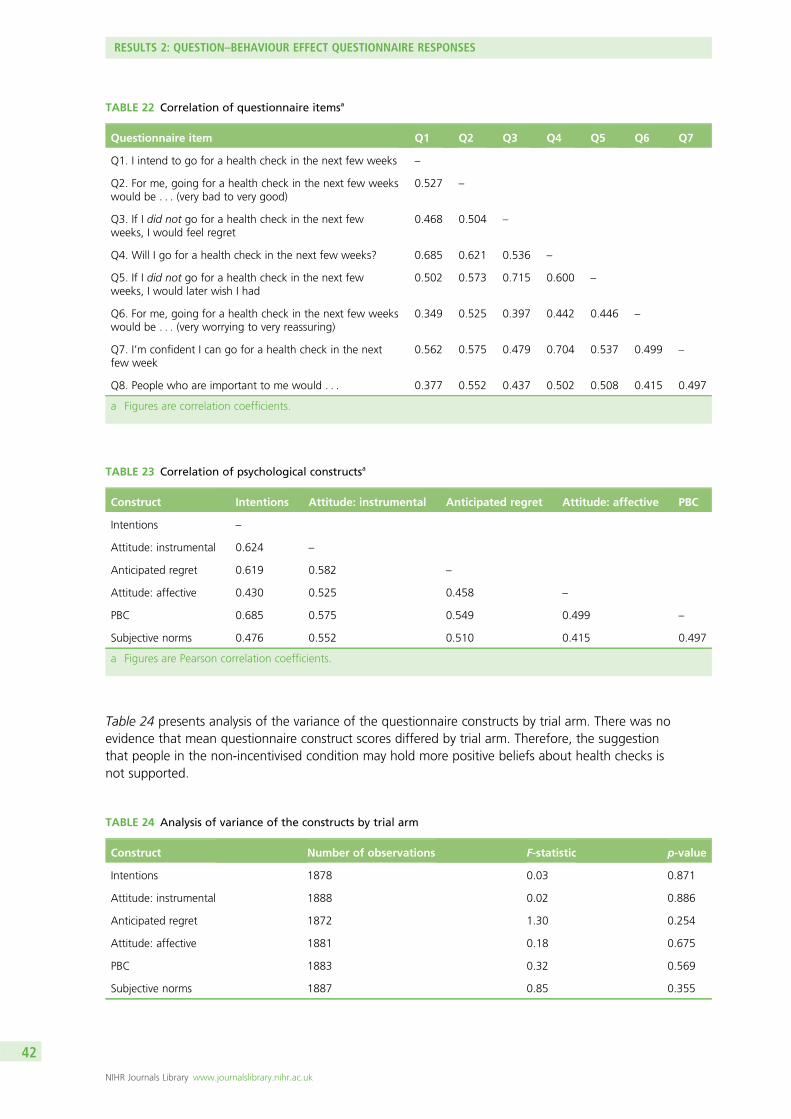
TABLE 22 Correlation of questionnaire items 42
TABLE 23 Correlation of psychological constructs 42
TABLE 24 Analysis of variance of the constructs by trial arm 42
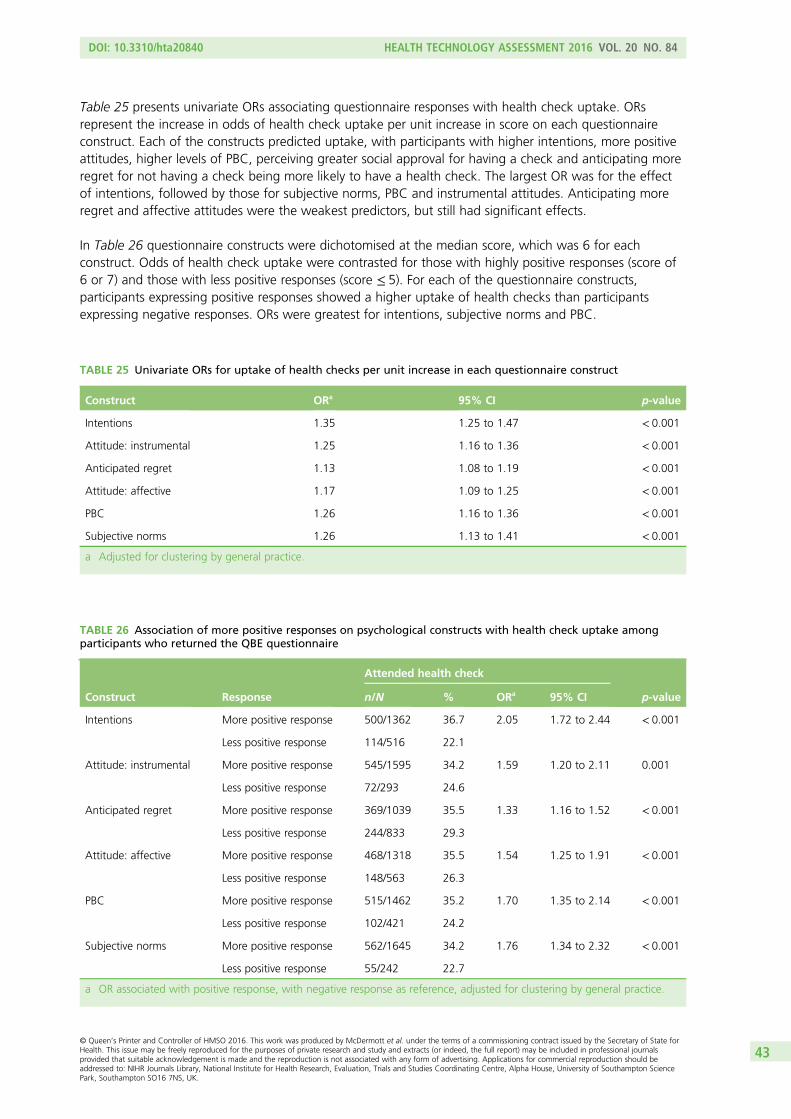
TABLE 25 Univariate ORs for uptake of health checks per unit increase in eachquestionnaire construct 43
TABLE 26 Association of more positive responses on psychological constructswith health check uptake among participants who returned the QBE questionnaire 43
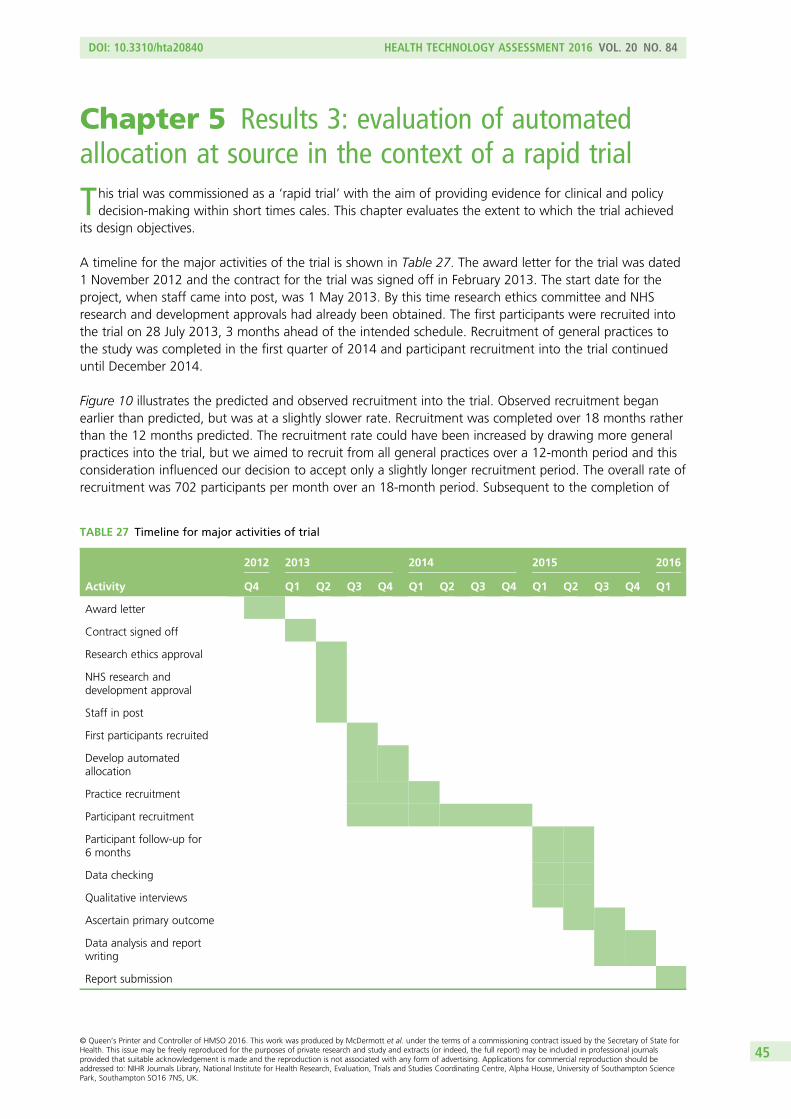
TABLE 27 Timeline for major activities of trial 45
TABLE 28 Comparison of in-practice and automated allocation methods 46
TABLE 29 Comparison of trial and management information system data 50
TABLE 30 Data from Lambeth and Lewisham Borough Councils concerninghealth check uptake at trial practices 51
TABLE 31 Distribution of invited and opportunistic checks by gender, age group,ethnicity and deprivation 52
TABLE 32 Proportions with a CVD risk score of ≥10% by source of health check 53
TABLE 33 Proportions with a CVD risk score of ≥ 20% by source of health check 53
TABLE 34 Proportions identified as overweight or obese by source of health check 54
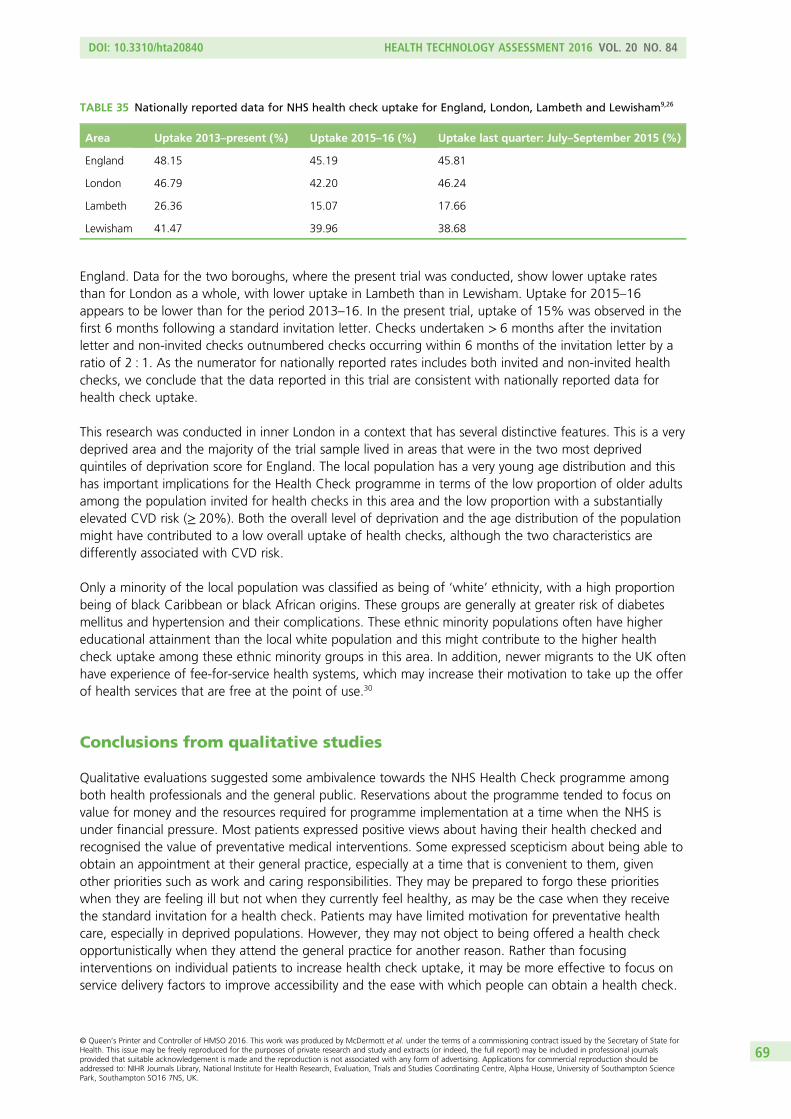
TABLE 35 Nationally reported data for NHS health check uptake for England,London, Lambeth and Lewisham 69
FIGURE 2 Histogram showing the distribution of cumulative uptake of NHShealth checks for 161 local authorities in England 5
FIGURE 3 Population pyramid showing the age distribution of the totalpopulation in Lambeth (left) and Lewisham (right) at the 2011 census 11
FIGURE 4 Trial design 14
FIGURE 5 Flow of individuals throughout the study from identification torandomisation and follow-up at 6 months 28
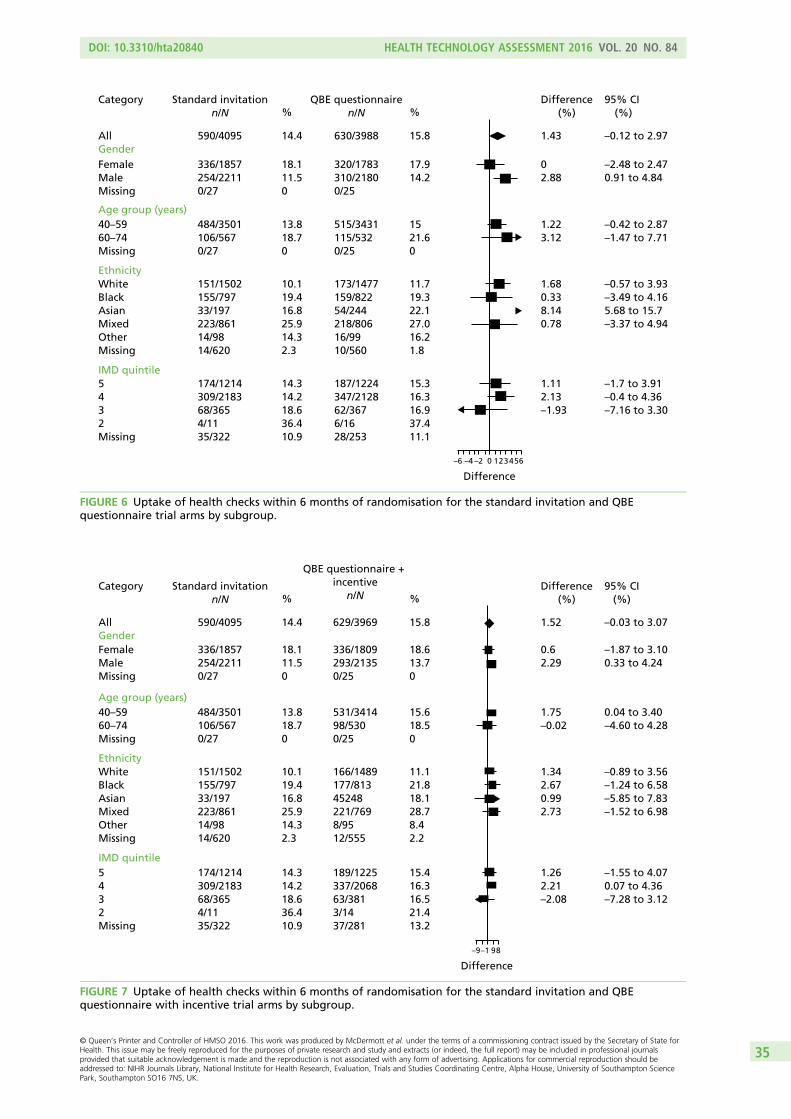
FIGURE 6 Uptake of health checks within 6 months of randomisation for thestandard invitation and QBE questionnaire trial arms by subgroup 35
FIGURE 7 Uptake of health checks within 6 months of randomisation for thestandard invitation and QBE questionnaire with incentive trial arms by subgroup 35
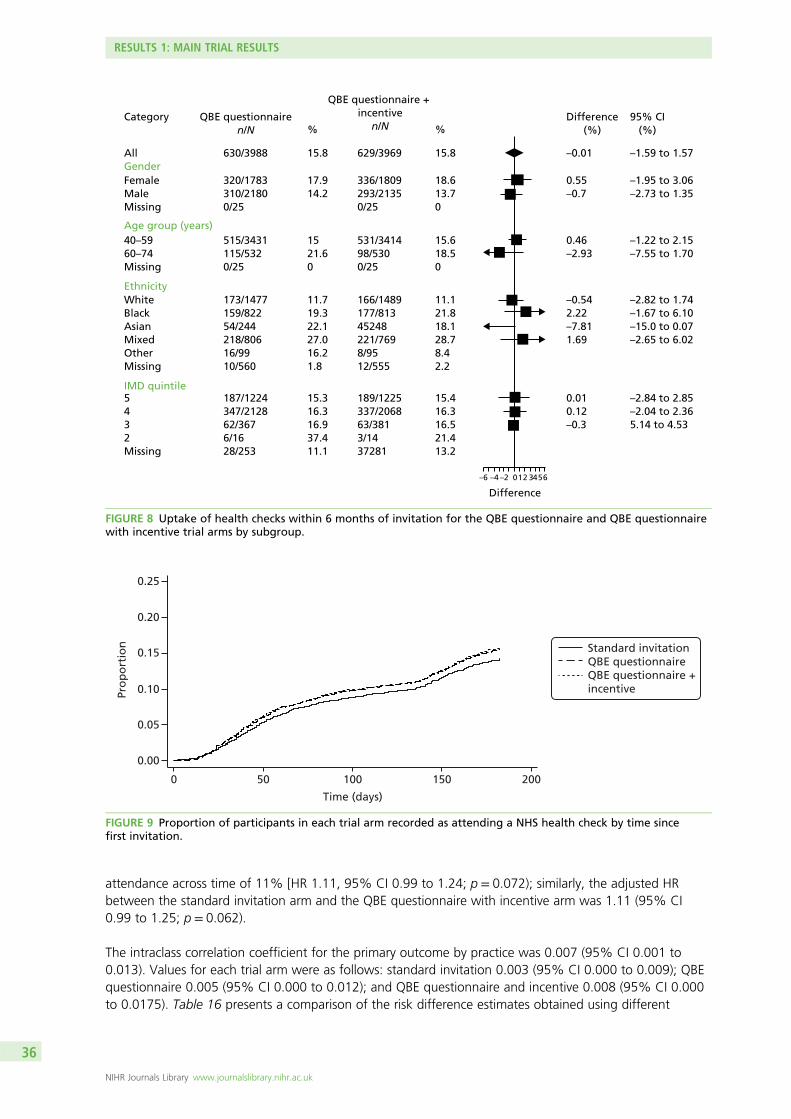
FIGURE 8 Uptake of health checks within 6 months of invitation for the QBEquestionnaire and QBE questionnaire with incentive trial arms by subgroup 36
FIGURE 9 Proportion of participants in each trial arm recorded as attending aNHS health check by time since first invitation 36
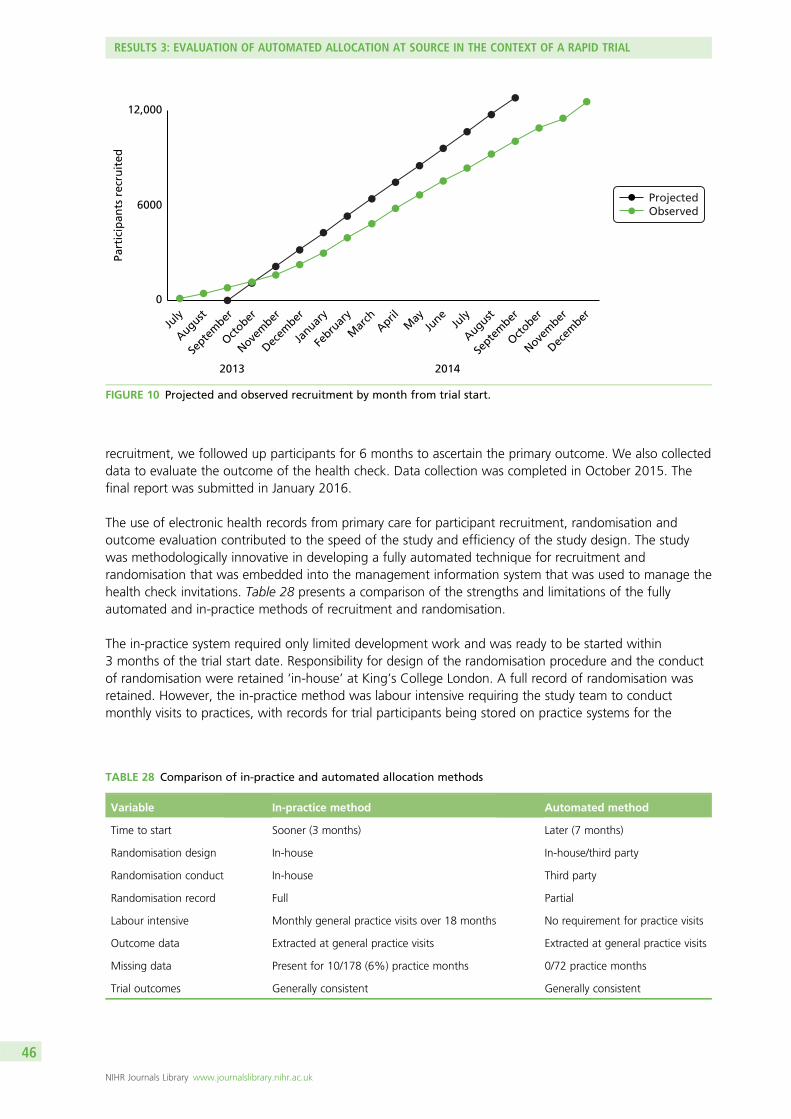
FIGURE 10 Projected and observed recruitment by month from trial start 46
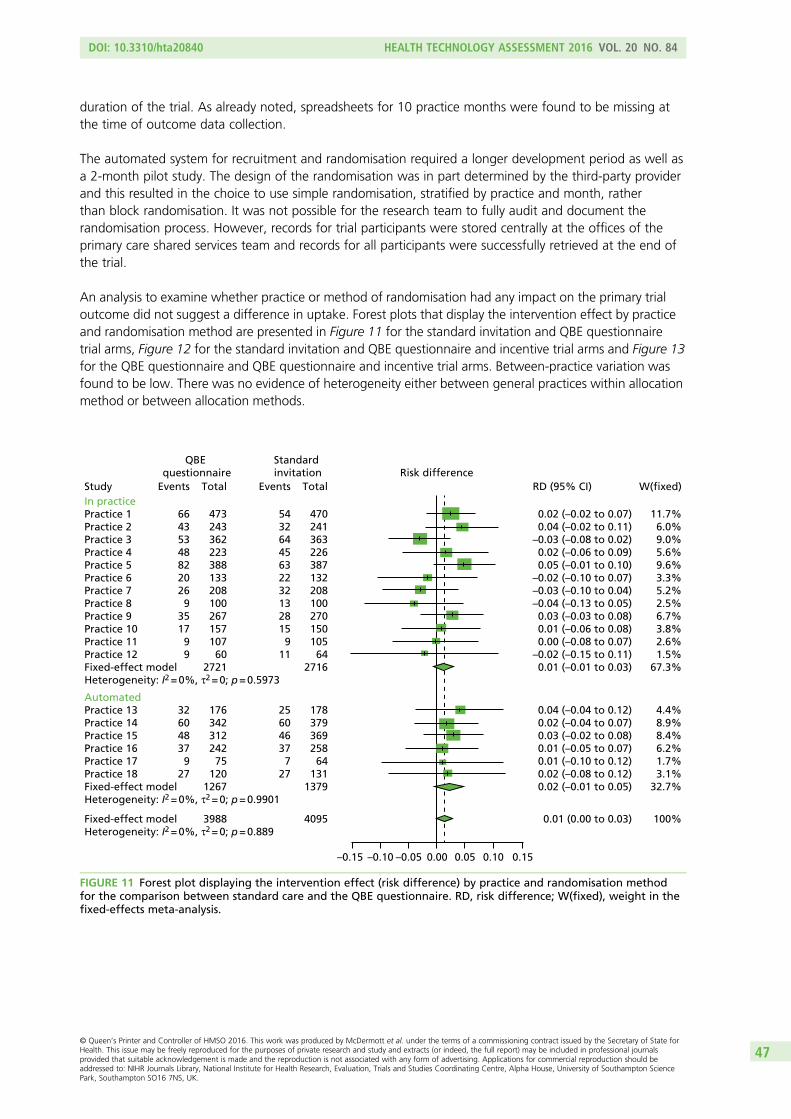
FIGURE 11 Forest plot displaying the intervention effect (risk difference) bypractice and randomisation method for the comparison between standard careand the QBE questionnaire 47
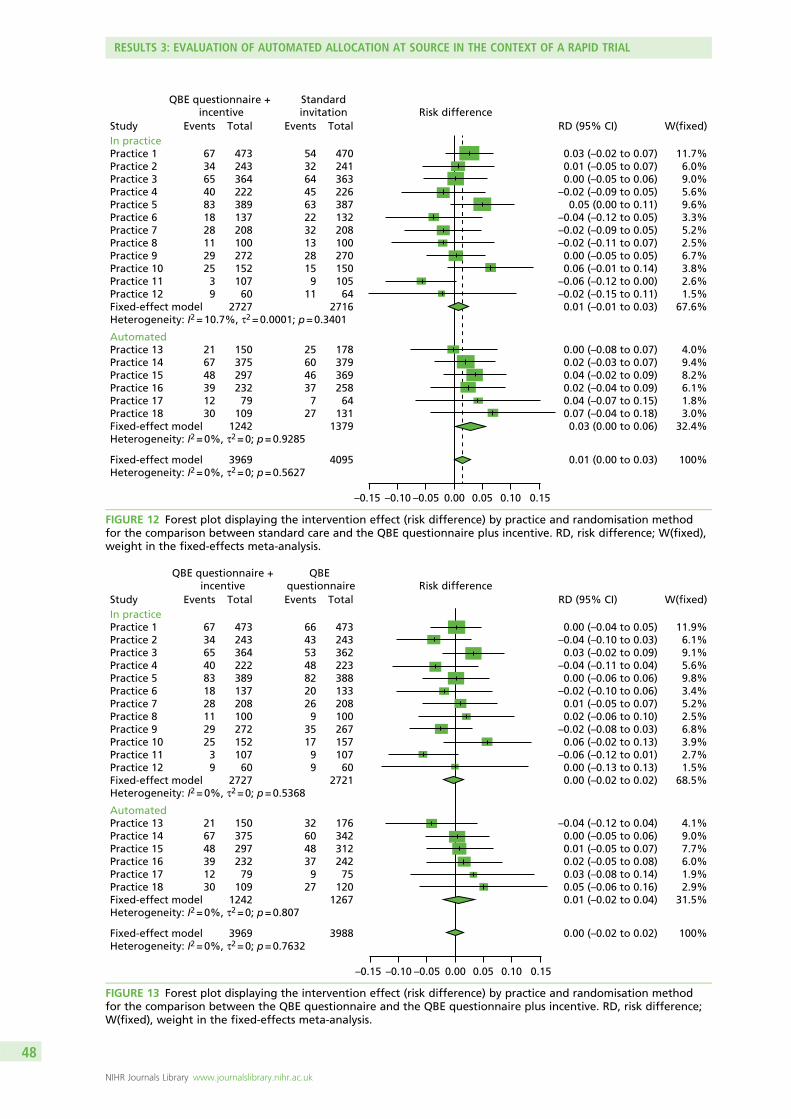
FIGURE 12 Forest plot displaying the intervention effect (risk difference) bypractice and randomisation method for the comparison between standard careand the QBE questionnaire plus incentive 48
FIGURE 13 Forest plot displaying the intervention effect (risk difference) bypractice and randomisation method for the comparison between the QBEquestionnaire and the QBE questionnaire plus incentive 48
DOI: 10.3310/hta20840 HEALTH TECHNOLOGY ASSESSMENT 2016 VOL. 20 NO. 84
In England, adults aged 40–74 years are offered health checks to reduce the risk of heart disease, stroke,diabetes mellitus and kidney disease. Uptake of health checks is < 50% nationally. This research tested
new invitation methods to increase the uptake of health checks. We evaluated the effect of a preliminaryquestionnaire that asked people about their thoughts and feelings about having a health check; we alsooffered people a £5 retail voucher if they completed the questionnaire. This was a large trial includingabout 12,000 patients. We found that overall uptake of health checks was low, being about 14%following a standard invitation letter. The research showed that receiving the preliminary questionnaireresulted in only a 1.5% increase in health check uptake and this was not statistically significant. The offerof a retail voucher had no effect on the response to the questionnaire. People who were in good healthfound it difficult to attend for a health check. More than half of the health checks completed during thestudy period were performed ‘opportunistically’, when people attended their general practice for otherreasons, and not in response to a standard invitation letter. People who had an opportunistic health checkwere more likely to have an increased risk of heart disease and stroke and were more often overweight orobese. The research suggests that, rather than focusing on individuals’ attitudes towards and motivationsfor a check, increasing the uptake of health checks requires interventions to make it easier to obtain ahealth check at a convenient time.
DOI: 10.3310/hta20840 HEALTH TECHNOLOGY ASSESSMENT 2016 VOL. 20 NO. 84
NHS Health Check is a national programme for the prevention of heart disease, stroke, diabetes mellitusand chronic kidney disease in England. Low uptake of health checks is a persistent problem. Thequestion–behaviour effect (QBE) hypothesises that asking questions about people’s views on a behaviour,or their current behaviour, increases the likelihood that individuals will later perform that behaviour.Previous studies suggest that the QBE may be used to increase the uptake of preventative medical services.
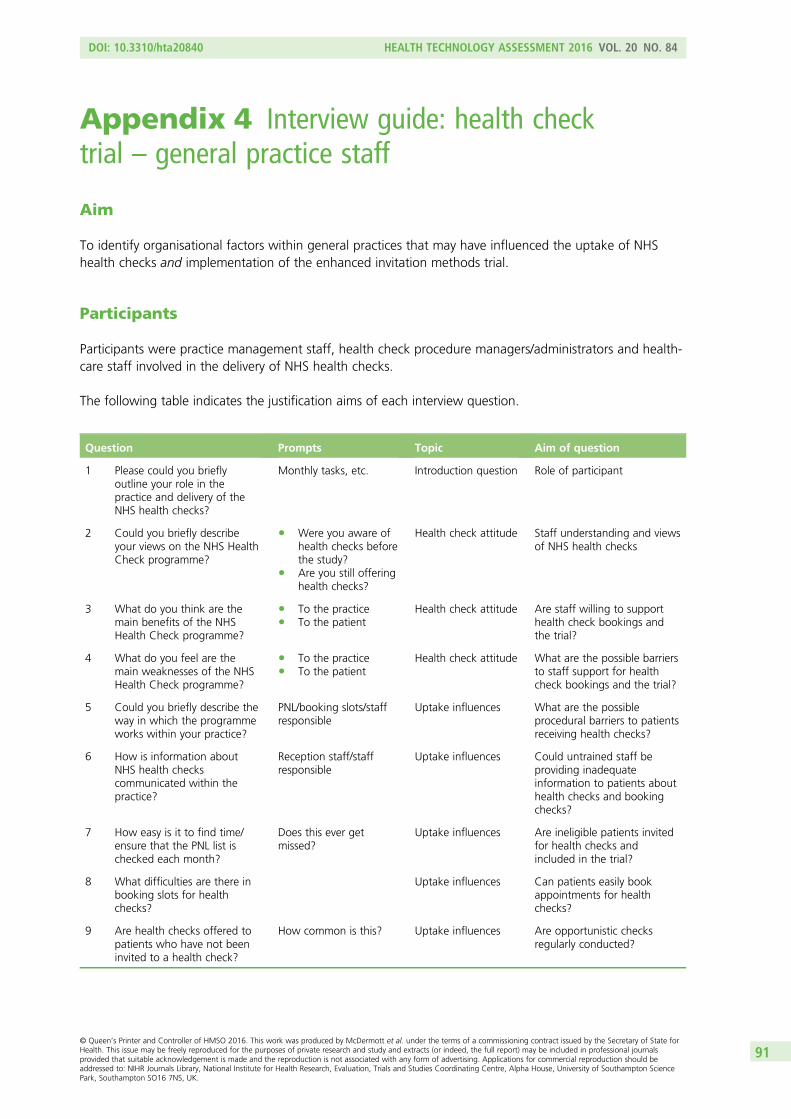
Aim
The primary purpose of the research was to evaluate the effectiveness of an enhanced invitation methodthat included a preliminary questionnaire about health checks, with or without the offer of a financialincentive to return the questionnaire, for increasing the uptake of health checks. We evaluated thefeasibility of a rapid trial using electronic health records, with an automated randomisation procedureembedded into the Health Check programme management information system. In addition, we conducteda cohort study to compare the characteristics of participants receiving invited health checks with thoseof participants receiving ‘opportunistic’ health checks. We also evaluated the views of health-careprofessionals and patients concerning the uptake of health checks to identify factors that influence uptakeand response to the trial interventions.
Methods
A randomised controlled trial was conducted at 18 general practices in two inner-London boroughs.Individual participants who were eligible to receive an invitation to the NHS Health Check programmewere individually randomised to three trial arms between July 2013 and December 2014. The three trialarms were (A) standard invitation letter; (B) QBE questionnaire followed by the standard invitation letter;and (C) QBE questionnaire with the offer of a £5 voucher as an incentive to return the questionnairefollowed by the standard invitation letter. The questionnaire focused on thoughts and feelings aboutattending for a health check. Recruitment and allocation were performed using electronic health recordsusing two different methods: at 12 general practices, allocation was conducted by the research team atthe general practices (‘in-practice method’); at six general practices, random allocation was programmedinto the software system that controlled participant selection for health checks (‘automated method’).Outcome data were extracted from general practice electronic health records, including whether a NHShealth check was conducted, the risk score obtained and body mass index (BMI) value recorded. Theprimary outcome was uptake of a health check at 6 months following the invitation. Risk differences wereestimated using the method of generalised estimating equations. A p-value of < 0.0167 was used forsignificance to allow for multiple comparisons. Secondary analyses evaluated subgroups of gender, age(40–59 and 60–74 years), ethnicity and deprivation quintile. Questionnaire return was evaluated by trialarm. Questionnaire item responses were evaluated using the constructs of ‘intentions’, ‘attitudes(instrumental and affective)’, ‘anticipated regret’, ‘perceived behavioural control’ and ‘subjective norms’in relation to health check attendance. A fixed-effects meta-analysis was employed to evaluate possibleheterogeneity between subgroups of recruitment and randomisation method. In a cohort study of allparticipants completing a health check during the study period, we evaluated the case mix of participantsreceiving a health check through the population-based call–recall system with that of participants receivingan opportunistic health check during the same period. Qualitative interviews were conducted with
DOI: 10.3310/hta20840 HEALTH TECHNOLOGY ASSESSMENT 2016 VOL. 20 NO. 84
programme and general practice staff as well as with patients who responded, or who did not respond,to an invitation to receive a health check. The content of free-text questionnaire responses was analysed.
Results
Main trial resultsIn total, 18 general practices were recruited into the trial. Trial practices generally had larger list sizes thannon-trial practices in the same area but were similar in terms of area deprivation and proportion of ethnicminority patients. In total, 12,459 participants were allocated, 8571 through the in-practice recruitmentmethod and 3888 through the fully automated recruitment method. The median age of participants was45 (interquartile range 40–54) years, 33% were in the most deprived quintile of deprivation for Englandand 39% were of ‘white’ ethnicity, with no differences among trial arms.
Health check uptake was evaluated for 12,052 participants for whom outcome data were collected.Overall uptake of health checks among invited participants within 6 months of the standard invitationletter was low (1849/12,052, 15.3%). In the standard invitation trial arm, 590 out of 4095 participants(14.41%) were recorded as attending a NHS health check within 6 months of the first invitation. In thepre-notification QBE questionnaire trial arm, 630 out of 3988 participants (15.80%) attended for a healthcheck within 6 months of the invitation. In the trial arm receiving the QBE questionnaire and the offer ofa financial incentive to return the questionnaire, 629 out of 3969 participants (15.85%) attended for ahealth check within 6 months of invitation. The risk difference associated with the QBE questionnaire was1.43% [95% confidence interval (CI) –0.12% to 2.97%; p = 0.070) and for the QBE questionnaire andoffer of financial incentive was 1.52% (95% CI –0.03% to 3.07%; p = 0.054). The estimated differencein health check uptake between the QBE questionnaire and the QBE questionnaire with the offer of anincentive to return it was –0.01% (–1.59% to 1.58%; p = 0.995).
Questionnaire return, questionnaire item responses and health check uptakeQuestion–behaviour effect questionnaires were returned by 917 out of 3988 participants (23.0%) in theQBE questionnaire trial arm and by 974 out of 3969 participants (24.5%) in the QBE questionnaire andincentive trial arm. The questionnaire return rate was 1.42% (95% CI –0.4% to 3.26%; p = 0.132) higher inthe trial arm that was offered an incentive to return the questionnaire. Questionnaire return was associatedwith female gender, older age and lower levels of deprivation. Compared with the standard invitation trialarm, health check uptake among questionnaire returners was 17.9% higher (95% CI 14.7% to 21.3%;p < 0.001) in the QBE questionnaire trial arm and 18.3% higher (95% CI 15.2% to 21.5%; p < 0.001) inthe QBE questionnaire and incentive trial arm. In a complier average causal effect (CACE) analysis, theestimated health check uptake was 6.0% greater in the QBE arm than in the standard invitation arm(95% CI 0.8% to 11.3%; p = 0.024) and 5.9% greater in the QBE questionnaire and incentive arm than inthe standard invitation arm (95% CI 0.8% to 10.9%; p = 0.022). Positive responses to QBE questionnaireitems were associated with greater odds of attending for a health check. Among participants who returnedthe QBE questionnaire, the ‘intentions’ construct was most strongly associated with health check uptake.
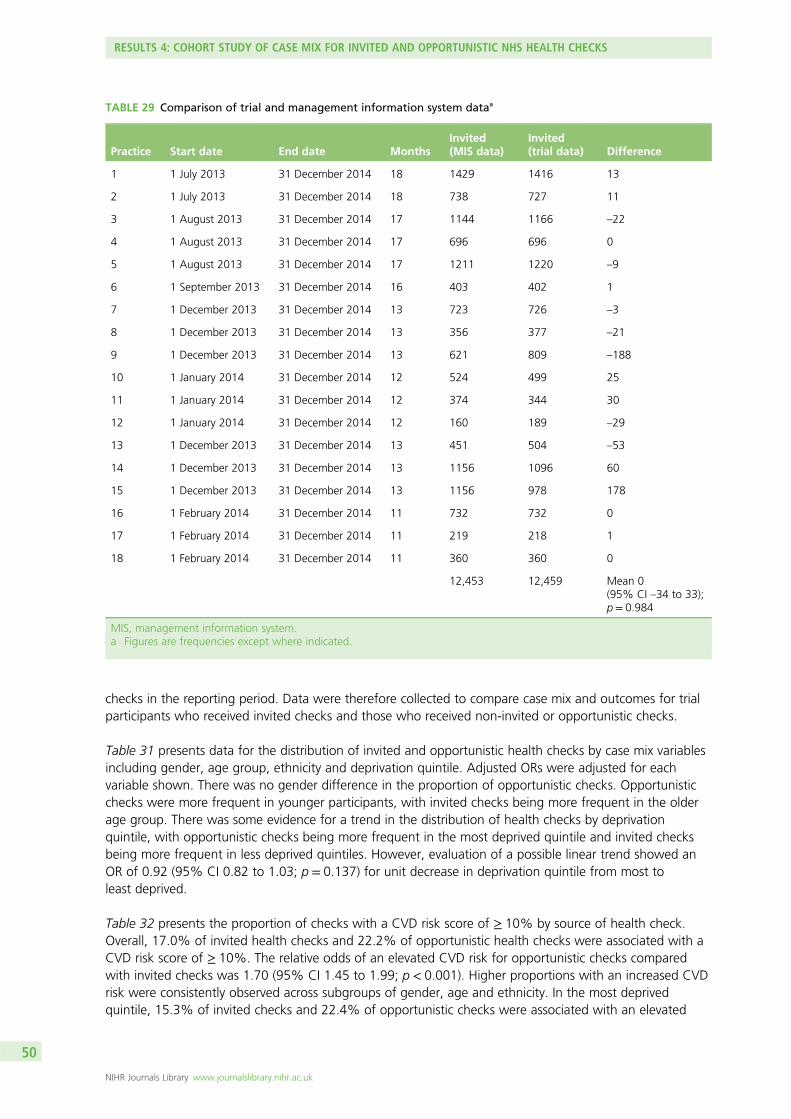
Reliability of trial dataThe reliability of the trial data was evaluated by comparison with routinely collected data from the NHSHealth Check programme management information system. During the study period, the managementinformation system recorded 12,453 patients being invited for a health check, compared with 12,459 inthe trial data. Across the 18 general practices, the mean difference (95% CI) between the trial data andmanagement information system data for the number of patients invited was 0 (95% CI –34 to 33;p = 0.984). Routinely collected data confirmed the low uptake of health checks in the 6 months followingstandard invitations. In total, 1690 health checks out of 12,453 (13.6%) invited health checks wererecorded within 6 months of invitation in the management information system data up to the end of thetrial recruitment period, with 1206 (71%) completed at general practices and 484 (29%) completed atthird-party providers.
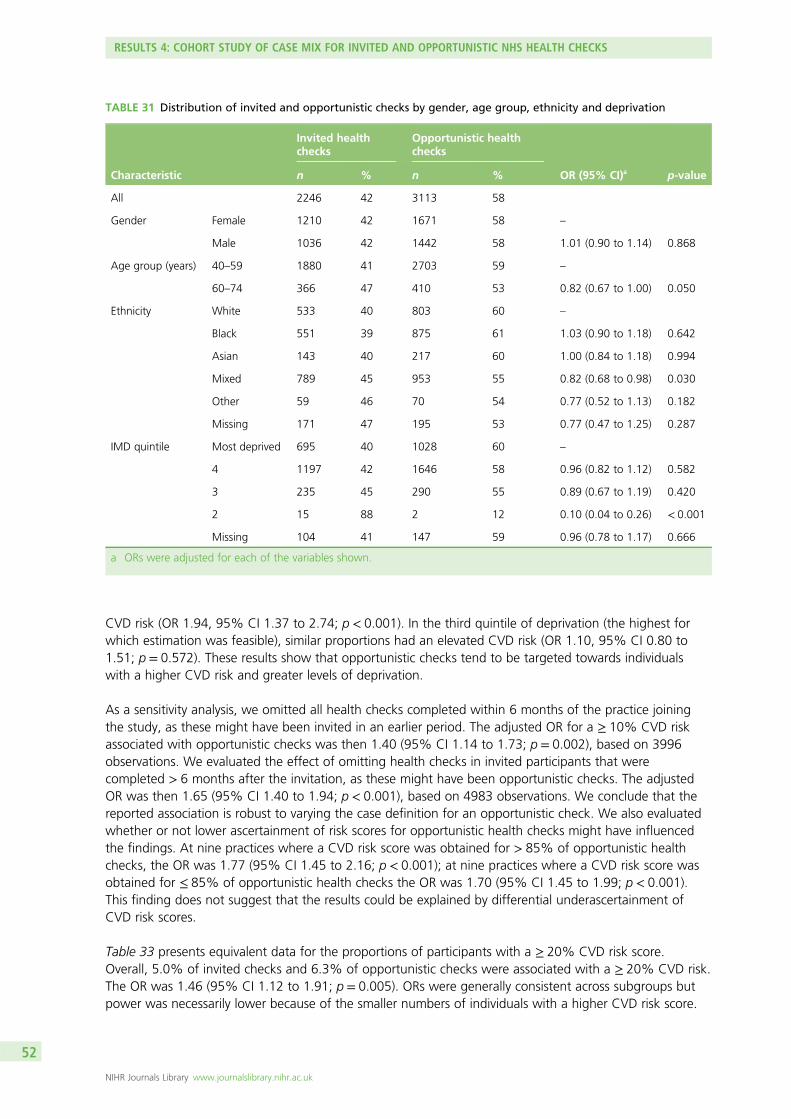
Case mix variables associated with health check uptakeHealth check uptake was lower in men than in women [adjusted odds ratio (OR) 0.74, 95% CI 0.69to 0.80; p < 0.001] and higher in participants aged ≥ 60 years (1.43, 95% CI 1.20 to 1.71; p < 0.001)than in those aged 40–59 years. Compared with participants of ‘white’ ethnicity, participants of blackAfrican or Caribbean ethnicity (adjusted OR 2.15, 95% CI 1.86 to 2.49; p < 0.001), Asian ethnicity(adjusted OR 2.03, 95% CI 1.63 to 2.67, p < 0.001) or mixed ethnicity (adjusted OR 3.09, 95% CI 2.07to 4.62; p < 0.001) had a higher uptake of health checks. Deprivation tended to be associated with alower uptake of health checks. The odds of health check uptake increased by 1.10 (95% CI 1.01 to 2.21;p = 0.035) per quintile decrease in deprivation.
Analysis by subgroups of gender, age group, ethnicity and deprivation showed that estimates forintervention effects were generally similar across subgroups but there was weak evidence for a greatereffect of the intervention in men than women.
Evaluation as a ‘rapid trial’ with automated randomisation and recruitmentThe trial was commissioned as a ‘rapid trial’ designed to provide evidence within policy-relevant timescales. The study start date was 1 May 2013 and the first patients were randomised in July 2013.The recruitment and randomisation of 12,459 participants from 18 general practices was completed inDecember 2014. Participant follow-up to 6 months was completed by June 2015, outcome data collectionwas completed in September 2015 and the final report was submitted in January 2016.
Strengths of the in-practice method for recruitment and randomisation were the short lead time beforeimplementation, the retention of randomisation in the hands of the research team and the completedocumentation of the randomisation process. Limitations were the labour-intensive requirements formonthly general practice visits to conduct the randomisation, as well as the higher proportion ofparticipants [407/8588 (4.7%)] for whom outcome data could not be collected. In contrast, the automatedmethod for randomisation and recruitment was less labour intensive and resulted in fewer missingoutcome data, but control over randomisation was delegated to a third party and was less completelydocumented. A fixed-effects meta-analysis showed no evidence of heterogeneity between estimates ofeffect for subgroups of recruitment and randomisation method. This suggested that consistent results wereobtained for the two randomisation methods.
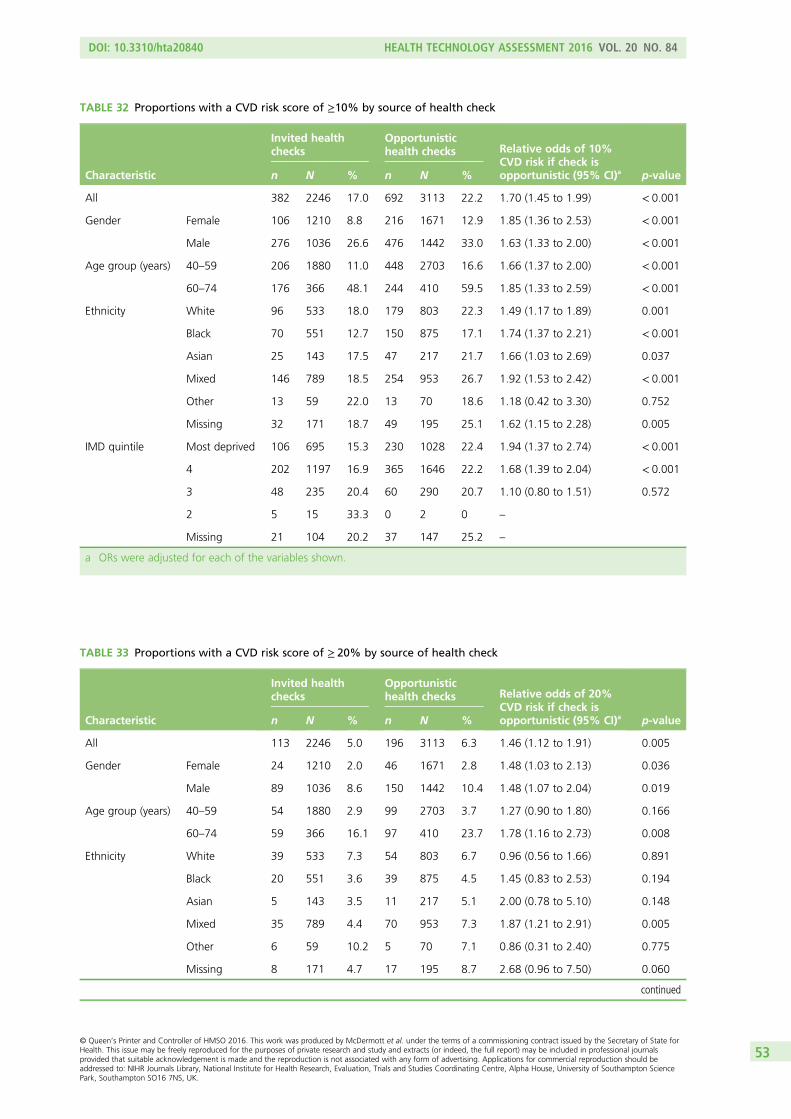
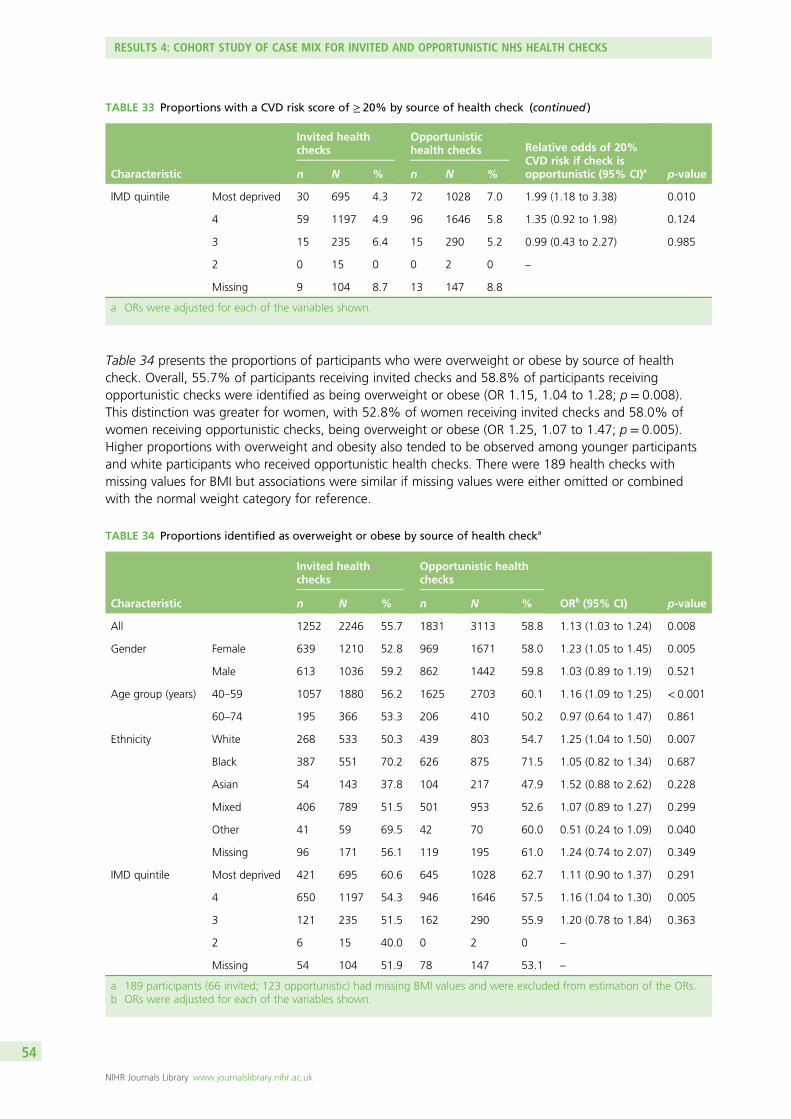
Cohort study to compare ‘invited’ and ‘opportunistic’ health checksDuring the study period 6184 health checks were completed at trial general practices, of which 2280(37%) were in trial participants who received standard invitation letters to the NHS Health Checkprogramme following invitation through the call–recall system. Cardiovascular risk scores were obtained for5359 participants, including 2246 trial participants and 3113 (58%) participants who underwent a healthcheck that did not follow a standard invitation. The proportion of non-invited health checks was found tobe 49% in data from the routine management information system, varying between 27% and 79% atdifferent general practices. Compared with trial participants who received health checks through thecall–recall system, participants who received ‘opportunistic’ checks were more likely to be identified with a≥ 10% cardiovascular disease (CVD) risk [invited 382/2246 (17%); opportunistic 692/3113 (22%); adjustedOR 1.70, 95% CI 1.45 to 1.99; p < 0.001]. The difference in risk between invited and opportunistic checkswas greatest in the quintile of greatest deprivation (adjusted OR 1.94, 95% CI 1.37 to 2.74; p < 0.001).Similar, although less marked, disparities between invited and opportunistic checks were observed for≥ 20% CVD risk (adjusted OR 1.46, 95% CI 1.12 to 1.91; p = 0.005) and overweight and obesity(adjusted OR 1.15, 95% CI 0.04 to 1.28; p = 0.008).
Qualitative interview studyTwenty-two general practice staff from 17 general practices and two public health leads responsible forimplementing health checks were interviewed. Staff appeared broadly supportive of the idea of a healthcheck programme but they expressed reservations centred on low uptake of the health check and aboutthe likelihood of individuals responding to information about their cardiovascular risk in a meaningful wayby changing their behaviour and adopting a healthier lifestyle.
DOI: 10.3310/hta20840 HEALTH TECHNOLOGY ASSESSMENT 2016 VOL. 20 NO. 84
Content analysis was conducted of 648 (33%) questionnaires with comments made in free text.Comments concerning health checks included the view of some individuals that such checks might notrepresent good value for money. There was a perception that having a health check at a time that wasconvenient would be a challenge or that arranging an appointment to have a health check might bedifficult. Twenty-seven non-trial participants were included in a patient interview study. The findingssuggest that some people found it difficult to arrange an appointment at their general practice. Theseindividuals may have held positive attitudes towards having a health check and fully intended to have one,but then found it challenging to fit it into their busy lives. Increasing the accessibility and flexibility of theservice design by expanding the availability of ‘drop-in’ health checks at community venues and at timesoutside standard working hours could make access easier for some people.
Conclusions
In this trial, overall uptake of health checks in the first 6 months following a standard invitation letter sentthrough the population-based call–recall system was 15%, with a high proportion of health checks beingperformed opportunistically in non-invited patients. An enhanced invitation method using the QBE was notassociated with an increased uptake of health checks overall but, among the 23% of intervention trial armparticipants who returned the QBE questionnaire, uptake of health checks was 32%. The offer of afinancial incentive was not associated with a greater return of the QBE questionnaire, or with increaseduptake of heath checks. In the context of low service uptake, it is possible that our intervention lacked thepotency to overcome barriers to attendance. Rather than focusing interventions on individuals, it may bemore effective to focus on service delivery factors to improve the ease with which people can obtain ahealth check.
This trial was conducted as a rapid trial with participant recruitment, randomisation and outcomeassessment being completed using primary care electronic health records. The trial demonstrated thefeasibility of an automated randomisation procedure in which 100% of participants who were eligible fora service were randomised into the trial over a period of 12 months. Similar approaches might now beextended to other contexts and services.
Analysis of data from the health check management system suggested that approximately half of healthchecks were performed opportunistically by health check providers. This was confirmed through dataextracted from trial general practices. Delivery of opportunistic health checks was associated withdeprivation, but invited and opportunistic checks were similar with respect to age group, gender andethnic group. Participants receiving an opportunistic check were more likely to have an elevated CVD riskand be overweight or obese than participants who received an invited health check.
Qualitative evaluations found that most people expressed positive views about having their health checkedand recognised the value of prevention. Some of these individuals expressed scepticism about being ableto obtain an appointment at their general practice, especially at a time that was convenient to them, givenother priorities such as work and caring responsibilities. However, they may not object to being offered ahealth check opportunistically when they attend the general practice for another reason.
Trial registration
This trial is registered as ISRCTN42856343.
Funding
Funding for this study was provided by the Health Technology Assessment programme of the NationalInstitute for Health Research.
Cardiovascular disease (CVD) accounts for more than one-quarter of all deaths in the UK, with about155,000 deaths per year.1 Diabetes mellitus is increasing in frequency and now affects around 6.2% ofthe UK population2 and the importance of early detection and treatment of chronic kidney disease isincreasingly recognised.3,4 Dementia shares many risk factors for CVD5 and might be reduced throughmore effective cardiovascular prevention. The British Heart Foundation estimates that the cost to the UK ofpremature death, lost productivity, hospital treatment and prescriptions relating to CVD is approximately£19B each year. Health-care costs alone may account for £8B per year.1 The cost of informal care forpeople with CVD in the UK was around £3.8B in 2009.6
Inequalities and cardiovascular risk
There are substantial social inequalities in the distribution of CVD. During 2001–3, CVD mortality was2.8 times higher for men in routine occupations than for men in higher managerial and professionaloccupations; for women, mortality was 3.8 times higher for routine occupations than for managerial andprofessional occupations.6 Mortality from CVDs has been declining but gains in life expectancy have notbeen equally shared by all groups; deprived communities have generally shown smaller mortality reductionsthan more affluent areas. There is also ethnic patterning of risk, with diabetes mellitus being more frequentin people of African, Caribbean and South Asian origins, stroke being more frequent among those ofAfrican origin and coronary heart disease being more frequent among those of African origin.
The major risk factors for CVD are well characterised. An analysis of the burden of disease for the UK in20107 revealed that smoking, high blood pressure, overweight and obesity, low levels of physical activity,poor diet and elevated cholesterol accounted for the highest proportion of burden of disease measured indisability-adjusted life-years.
The NHS Health Check programme
The NHS Health Check programme is a cardiovascular risk assessment programme, which was introduced by theDepartment of Health in 2009.8 The programme aims to identify people who are at increased risk of heartdisease, stroke, diabetes mellitus or chronic kidney disease, with the intention of delivering individualisedinterventions to reduce risk, and enable treatment of people with established disease. The Department of Healthestimated that the NHS Health Check programme could potentially prevent 2000 deaths and 9500 non-fatalmyocardial infarctions and strokes each year.8 Maximising the uptake of health checks across all groups isimportant in realising this aim and ensuring that the programme does not perpetuate existing health inequalities.
Programme implementation
The NHS Health Check programme has been rolled out across England.9 The first full year of theprogramme began in April 2011, but in many areas the programme was initiated from April 2010 orbefore. From 2011/12, the NHS Health Check programme aimed to enrol 90% of the eligible populationinto a 5-yearly cycle of call–recall through the participation of all primary care organisations (PCOs). PCOsinvite 18% of their eligible cohort each year, with about 1.8 million individuals receiving an invitation to ahealth check in 2011/12.9 Since 2013, the NHS Health Check programme has been a responsibility of local
DOI: 10.3310/hta20840 HEALTH TECHNOLOGY ASSESSMENT 2016 VOL. 20 NO. 84
authorities,10 supported by Public Health England (PHE), the National Institute for Health and CareExcellence (NICE) and the Local Government Association. Implementation is through commissioned servicesfrom NHS clinical commissioning groups and other providers. Implementation of health checks is a keyindicator in the Public Health Outcomes Framework in domain 2, health improvement.11
Eligibility for the NHS Health Check programme
Adults aged 40–74 years are eligible to be offered health checks. People who have previously beendiagnosed with clinical disease (including ischaemic heart disease, heart failure, atrial fibrillation,stroke or transient ischaemic attack, diabetes mellitus, chronic kidney disease, peripheral vascular disease)are excluded, as are people being treated for increased vascular risk (including those with hypertensionor hypercholesterolaemia or who are being treated with antihypertensive drugs or statins).1,6
Health check process
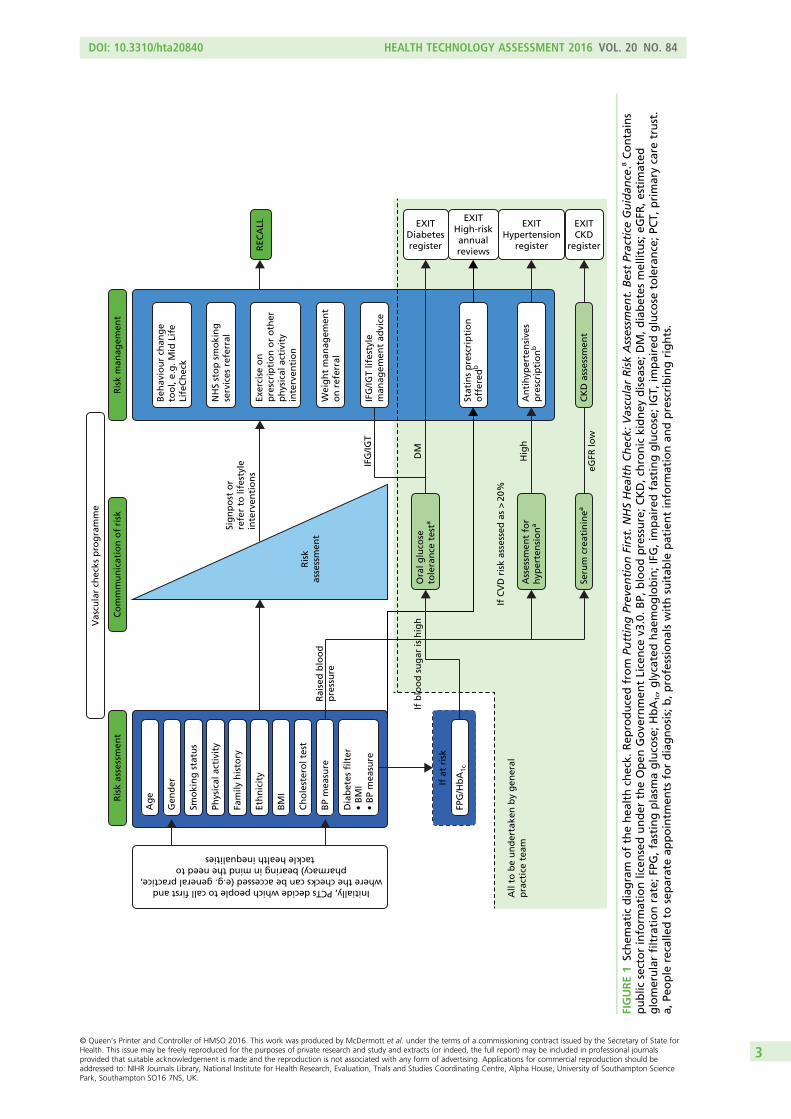
Each NHS health check consists of recording personal history, including age, ethnic group, smoking status,family history, assessment of physical activity, dietary quality including fruit and vegetable and salt intake,body mass index (BMI), blood pressure, smoking status, renal function, lipid levels and blood glucose whenindicated. The patient’s risk of developing CVD is then calculated using a CVD risk score calculator, whichmay include the Joint British Societies (JBS)12 calculator or the QRISK®2 score.13 During the period of this trial,the JBS calculator was mandated by the Health Check programme in the study area. The cardiovascular riskassessment implemented as part of the health check is used to inform graded intervention.14 Individualswhose risk of a cardiovascular event is > 20% over 10 years are classified as ‘high risk’ and exit theHealth Check programme to enter a high-risk register with a designated care pathway. Individuals who areidentified as having clinical disease, such as diabetes mellitus or atrial fibrillation, also enter appropriate carepathways based in primary care. Other individuals, especially those with a risk of a cardiovascular event of10–20%, are offered advice on reducing risk, or maintaining low risk, primarily through lifestyle advice.The individual elements of the health check intervention follow recognised and evidenced-based clinicalpathways approved by NICE to improve outcomes for individual patients15 (Figure 1).
Evidence of effectiveness
It is beyond the scope of this report to review the evidence for or against a national programme of healthchecks, nor do we aim to review the criteria to be satisfied that a programme of health checks is effectiveor discuss the appropriate balance between ‘population’ and ‘high-risk’ strategies for disease prevention.The purpose of this research was to evaluate methods for improving the delivery of an established policy ofhealth checks.
Randomised controlled trials (RCTs) from earlier decades, when arguably fewer effective interventions wereroutinely available, are not supportive of cardiovascular risk screening.16 In a Cochrane systematic review,Krogsbøll et al.16 identified 16 trials of health checks in unselected adults, with 155,899 participants and11,940 deaths. Risk ratios for total and cardiovascular mortality were 0.99 [95% confidence interval (CI)0.95 to 1.03] and 1.03 (95% CI 0.91 to 1.17), respectively. The review concluded that general health checkswere unlikely to be effective. Twelve of the 16 studies were from 1982 or before and this represents animportant limitation because older studies were less likely to use current methods of risk assessment and riskmanagement. However, more recent studies, including the Oxford and Collaborators Health CHECK(OXCHECK)17 and British Family Heart18 studies, suggest that health checks in primary care are unlikely toprovide a cost-effective approach to cardiovascular prevention. Other arguments19 against the use of healthchecks in their current form include the inefficiency of using predictive risk scores to allocate treatments,20
the small effects resulting from risk factor intervention and the high costs of the programme.19
The Health Check programme is consistent with the vision, proposed in the Wanless report,21 of a healthservice that ‘invest[s] in reducing demand by enhancing the promotion of good health and diseaseprevention’ (p. 3), with ‘health services evolving from dealing with acute problems through more effectivecontrol of chronic conditions to promoting the maintenance of good health’ (p. 10). This is even morerelevant at the present time with growing problems of obesity, pre-diabetes, alcohol and physical inactivity.The Health Check programme offers opportunities to address health problems of obesity, initiate diabetesprevention interventions and identify lifestyle concerns, as well as detecting other conditions includingatrial fibrillation or cognitive decline. There may be insufficient evidence to reach clear conclusionsconcerning the value of the Health Check programme. There is evidence for the effectiveness of theindividual interventions that may be delivered through health checks, as summarised in guidance fromNICE,3,15,22,23 but the question remains whether the Health Check programme can be used to improveimplementation of this guidance into practice.
Economic modelling for cost-effectiveness estimates
The case for implementing health checks was made through health economic modelling. The Departmentof Health’s economic model24 provided evidence to show that the costs of the NHS Health Checkprogramme would be between £180M and £243M per year (2008 costs). The cost of the health checkswas estimated to be about £40M, with additional treatment costs accounting for the remainder. Healthbenefits were estimated to be substantial and the intervention was judged to be cost-effective, with a costof < £3000 per quality-adjusted life-year.24
The economic model incorporated a range of assumptions concerning population engagement with theprogramme and the likely effectiveness of interventions in the context of the present quality of care. Thepresent research focuses on one key assumption, the uptake of health checks. The Department of Healthmodel assumed that overall uptake of the health check would be about 75%; 70% of individuals wereassumed to always attend, 15% might never attend and 15% might have a 33% probability of attending.These assumptions were informed by data on the uptake of the national breast screening programme.Women are generally more likely than men to seek help and engage with health services.
Uptake of the NHS Health Check programme
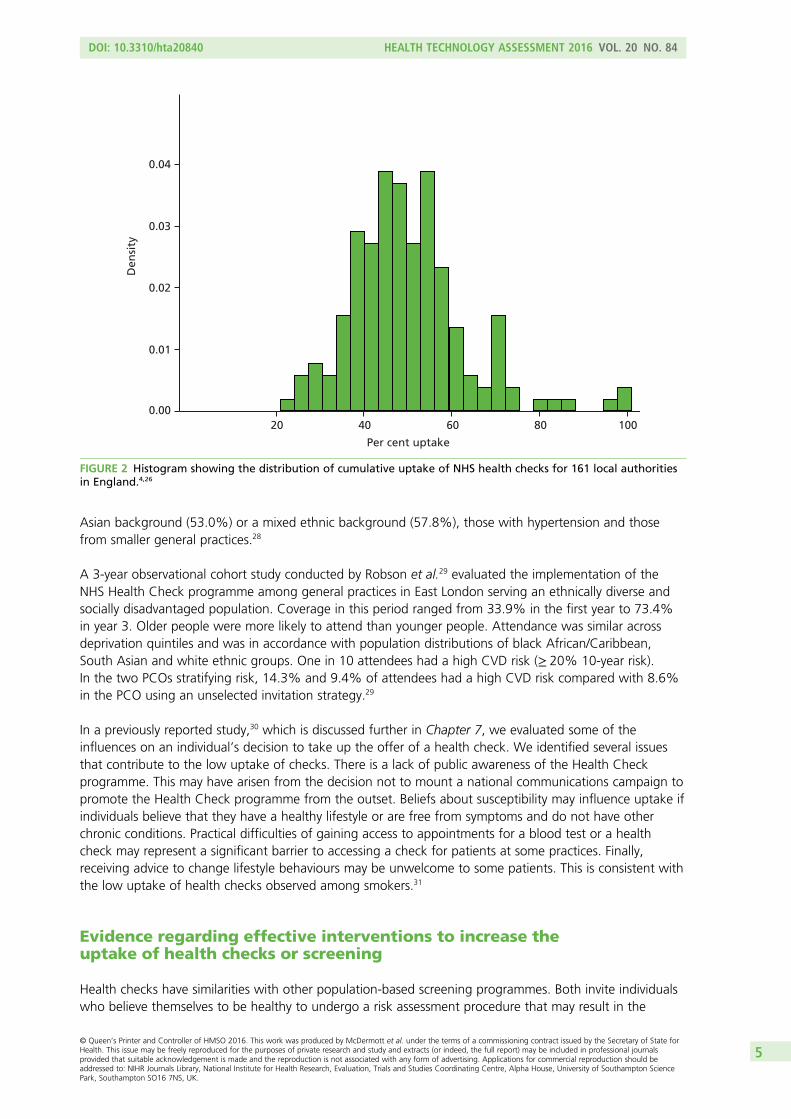
At the time that this trial was initiated in 2012, early indications were that uptake of health checks waslower than anticipated. Dalton et al.25 reported a 45% uptake of health checks in west London. This wasconsistent with experience in south London, where uptake was running at < 40%. In national data forEnglish PCOs in the third quarter of 2011/12,9 the median uptake was 52%, with values in different PCOsranging from 0% to 100%, with an interquartile range (IQR) of 35–67%. Only 30 (20%) out of151 PCOs had an uptake of ≥ 75%.9 At that stage of the implementation of the NHS Health Checkprogramme, 80% of PCOs were reporting that uptake of the checks was lower than expected based onthe health economic model. In more recent cumulative data for 2013–15, it was reported that 48.4% ofpeople offered a NHS health check received a check. Uptake ranged from 21% to 100% in different localauthority areas, with 143 out of 161 (89%) local authorities failing to achieve the lowered target of 66%uptake (Figure 2).
Evaluations of the roll-out of health checks
Local evaluations have confirmed a pattern of low uptake of health checks. Dalton et al.25 reported on theuptake of health checks in Ealing, a deprived and culturally diverse setting in London, with an estimateduptake of 44.8%. Attendance was found to be significantly lower among younger patients and smokers,consistent with the later findings of Artac et al.27 Uptake was significantly higher for those with a South
Asian background (53.0%) or a mixed ethnic background (57.8%), those with hypertension and thosefrom smaller general practices.28
A 3-year observational cohort study conducted by Robson et al.29 evaluated the implementation of theNHS Health Check programme among general practices in East London serving an ethnically diverse andsocially disadvantaged population. Coverage in this period ranged from 33.9% in the first year to 73.4%in year 3. Older people were more likely to attend than younger people. Attendance was similar acrossdeprivation quintiles and was in accordance with population distributions of black African/Caribbean,South Asian and white ethnic groups. One in 10 attendees had a high CVD risk (≥ 20% 10-year risk).In the two PCOs stratifying risk, 14.3% and 9.4% of attendees had a high CVD risk compared with 8.6%in the PCO using an unselected invitation strategy.29
In a previously reported study,30 which is discussed further in Chapter 7, we evaluated some of theinfluences on an individual’s decision to take up the offer of a health check. We identified several issuesthat contribute to the low uptake of checks. There is a lack of public awareness of the Health Checkprogramme. This may have arisen from the decision not to mount a national communications campaign topromote the Health Check programme from the outset. Beliefs about susceptibility may influence uptake ifindividuals believe that they have a healthy lifestyle or are free from symptoms and do not have otherchronic conditions. Practical difficulties of gaining access to appointments for a blood test or a healthcheck may represent a significant barrier to accessing a check for patients at some practices. Finally,receiving advice to change lifestyle behaviours may be unwelcome to some patients. This is consistent withthe low uptake of health checks observed among smokers.31
Evidence regarding effective interventions to increase theuptake of health checks or screening
Health checks have similarities with other population-based screening programmes. Both invite individualswho believe themselves to be healthy to undergo a risk assessment procedure that may result in the
0.00
0.01
0.02
0.03
Den
sity
0.04
20 40 60 80 100
Per cent uptake
FIGURE 2 Histogram showing the distribution of cumulative uptake of NHS health checks for 161 local authoritiesin England.4,26
DOI: 10.3310/hta20840 HEALTH TECHNOLOGY ASSESSMENT 2016 VOL. 20 NO. 84
attendee discovering that they have a serious health problem or are at high risk of a serious healthproblem in the future. The literature on interventions to increase screening uptake may reasonably beapplied to the uptake of health checks.
Interventions to increase uptake can have a number of foci: changes to the method of delivering theprogramme, different patterns of invitation letters and reminders or provision of additional information atthe time of invitation. Camilloni et al.32 recently updated the landmark review by Jepson et al.,33 focusingon methods to increase uptake of screening for breast, cervical or colorectal cancer. The review suggestedthat postal reminders in addition to the initial invitation could significantly increase uptake, whereasthe evidence for telephone reminders was largely favourable, although some primary studies did notdemonstrate significant effects. The review identified one trial which found that patients were more likelyto attend if they were invited by telephone rather than by letter. In the context of health checks, anobservational study found significantly higher uptake at practices using telephone or verbal health checkinvitations, either singly or in combination with letters.34 Telephone or face-to-face invitations to promotehealth check uptake may be difficult to implement on a large scale, as would be required for the nationalHealth Check programme.
In the cancer screening literature, providing a stated appointment time led to significantly higher uptake ofscreening than open appointments for cervical [relative risk (RR) 1.49, 95% CI 1.27 to 1.75] and breast(RR 1.26, 95% CI 1.02 to 1.75) cancer screening.32 Kumar et al.35 compared health check uptake by patientsoffered only a booked appointment with uptake by patients offered a choice of a booked appointment orattending a drop-in clinic. Uptake rates for the two groups separately are not reported, but the authorssuggested that use of drop-in clinics may be less costly. Norman et al.36 found a 70% attendance rate foran invitation letter with a given appointment time compared with 37% for an open letter invite.
Evidence of factors that may be associated with improved uptake of health checks was reviewed byCooper and Dugdill.37 They identified from existing studies, deemed transferable to a UK context, thekey factors influencing the uptake of health screening, including demographic, social, cultural andpsychological influences. Demographic and cultural factors that affect uptake may not be modifiable,whereas psychological factors may be more amenable to change. In cancer screening, the impact ofproviding additional information, such as leaflets or pamphlets, was mixed.32 The reviewers noted that theinterventions assessed were perhaps not entirely comparable. Different health conditions, and differenttypes of screening test [e.g. the self-completed faecal occult blood test (FOBT) for colorectal cancer vs.attending a mammography appointment at a hospital], may additionally account for variation in results.We next consider interventions targeting psychological factors to increase health check uptake.
One useful intervention may be providing invitees with planning prompts, asking them to form concreteplans about when, where or how to perform a behaviour. Such prompts can help motivated individuals bemore likely to act on their intentions. Sallis et al. (cited in Perry et al.38) found that an enhanced healthcheck invitation letter, which included a tear-off slip for individuals to write the date and time of theirhealth check, led to a 33% uptake of health checks in Medway, compared with 29% uptake forindividuals receiving the original, control invitation letter. Although this is a small absolute increase, it wasachieved using minimal extra resource. Planning prompts are not always effective. For example, they havefailed to increase the uptake of colorectal cancer screening among first-time invitees39 or antenatalscreening.40 In field settings, a substantial proportion of participants asked to do so may not record aplan.41 Moreover, plan formation has been shown to be most effective for individuals who are alreadymotivated to perform the behaviour,42 for example those who accepted a previous round of colorectalcancer screening.43
An alternative brief intervention that may be useful to increase uptake was demonstrated by Conner et al.,44
who reported a study conducted in one general practice in 1991. Sending a preliminary questionnaire priorto inviting individuals for a health check enhanced uptake, with 68.3% of the intervention group having ahealth check compared with 53.5% of the control (no questionnaire) group. This increase in uptake was
attributed to the question–behaviour effect (QBE), a phenomenon in which asking questions about people’sviews on a behaviour or their current behaviour increases the likelihood that individuals will later performthat behaviour. The potential of the QBE to increase uptake was also demonstrated in a study focusing oncervical cancer screening uptake.45 Uptake increased from 21% in the control group to 26% in the twoexperimental questionnaire groups, with those in one of the groups being asked to complete additionalquestions about whether or not they anticipated regretting not being screened. Among individuals whoreturned the questionnaire in these two experimental groups, those who had been asked about anticipatedregret had a higher screening uptake (65%) than those in the other questionnaire group (44%). Takentogether, these two studies suggest that the QBE might be a useful intervention to increase NHS healthcheck uptake. Subsequent to the initiation of the present study, a further trial reported no significant QBEon the uptake of colorectal cancer screening via a FOBT in Scotland.46
How does the question–behaviour effect work?
Psychologists have long been aware that asking questions about a behaviour may change the respondent’sfuture behaviour.47 A number of mechanisms have been proposed for the operation of the QBE.48 Theattitude accessibility account suggests that asking people to report their attitudes or intentions for abehaviour makes the attitude about that behaviour more accessible in memory. The increased accessibilitymakes it more likely that a person will perform the behaviour (e.g. have a health check) when theopportunity arises.
A second explanation concerns cognitive dissonance. Cognitive dissonance is a mental state that occurswhen a person’s behaviour is not consistent with his or her beliefs about how he or she should behave.Experiencing cognitive dissonance is uncomfortable and so individuals are motivated to try to reduce it.In terms of the QBE, cognitive dissonance can arise when completing a questionnaire leads individuals torealise that their current or past actions are incompatible with their beliefs about how they should act. Toreduce the cognitive dissonance aroused by completing a questionnaire, people may subsequently changetheir behaviour to be more in line with their beliefs.
A final explanation for the QBE concerns behavioural simulation and processing fluency. In this account, theQBE is driven by questioning, leading individuals to form behavioural scripts, that is, mental representationsof how to carry out that behaviour. These scripts are stored in memory and can be reactivated when theindividual encounters an opportunity to perform the relevant behaviour. This reactivation of the mentalrepresentation makes it seem easier for the person to perform that behaviour than it would otherwise,which then increases the likelihood that he or she proceeds to perform the behaviour in question.
Recent systematic review and other evidence regarding thequestion–behaviour effect
The QBE has been tested in a wide range of behaviours, including not only health-related behaviours butalso consumer and prosocial behaviours. Dholakia et al.49 provided an overview of the literature but didnot subject it to meta-analysis. Subsequent to the initiation of this project, two systematic reviews of theQBE with meta-analyses have been published.50,51 The two differ in their inclusion criteria and aims and soboth are discussed here.
Wood et al.50 reviewed literature published up to March 2013. They set out to examine the impact ofasking intention or self-prediction (i.e. rating the likelihood that one will perform a behaviour) questionson subsequent behaviour. Intentions are a key component of the theory of planned behaviour (TPB),52
a psychological model which states that behaviour is determined by an individual’s behavioural intentionand perceived behavioural control (PBC). Intentions reflect the individual’s motivation to engage in aparticular behaviour. PBC is very similar to the concept of self-efficacy, concerning the extent to which
DOI: 10.3310/hta20840 HEALTH TECHNOLOGY ASSESSMENT 2016 VOL. 20 NO. 84
people perceive that they have control and ability to engage in the behaviour. Intentions, in turn, aredetermined by an individual’s attitude towards the behaviour (whether the outcomes of performing thebehaviour are considered positive or negative), subjective norms (e.g. perceptions of whether or not othersthink one should engage in a behaviour) and PBC. Therefore, the review by Wood et al.50 examinedwhether including questionnaire items relating to other TPB variables, such as attitudes, subjective normsor PBC, or including additional questionnaire items about anticipated regret altered the effect of intentionor self-prediction questions on behaviour. This review also attempted to explore the mechanisms by whichthe QBE might operate by examining the effect of different study characteristics on effect sizes. Themeasure of effect size used was the standardised mean difference, Cohen’s d.
Overall, this review included 116 tests of the QBE. It found a small, statistically significant positive effect onbehaviour of asking intention or self-prediction questions (pooled effect size, d+ = 0.24, 95% CI 0.18 to0.30). There was evidence of publication bias, with a disproportionate concentration of studies with largereffect sizes and larger standard errors. There was also evidence of significant heterogeneity in effect sizes. Theeffects for health (d+ = 0.29), consumer (d+ = 0.34) and prosocial (d+ = 0.19) behaviours were significantlylarger than those for risky or undesirable behaviours (d+ = –0.05, 95% CI –0.23 to 0.13). Larger effect sizeswere observed for behaviours that the reviewers rated as easier to perform and more socially desirable.
A number of methodological factors were also significantly related to observed effect sizes. In particular,smaller effects were observed for studies conducted in field rather than laboratory settings (d+ = 0.17 vs.d+ = 0.38). The longer the time interval between answering questions and the measurement of thebehaviour, the smaller the effect size tended to be. Providing an incentive for study participation wasassociated with a larger effect size (d+ = 0.36) than not doing so (d+ = 0.19).
The types of question asked also influenced the observed effects on behaviour. Studies that asked onlyself-prediction questions (‘How likely is it that you will . . .’) reported significantly larger effects (d+ = 0.29)than studies that asked a mix of self-prediction and intention questions (d+ = 0.14). Measuring TPBconstructs other than intentions did not significantly influence effect sizes. Asking anticipated regret itemswas associated with smaller effects on behaviour (d+ = 0.08) than not doing so (d+ = 0.26).
In contrast to Wood et al.’s50 review, that of Rodrigues et al.51 focused only on studies published up toDecember 2012 examining the QBE on health behaviours. Also, in contrast to Wood et al.’s50 focus onintention and self-prediction questions, Rodrigues et al.51 included studies that measured cognitions,behaviours or a mix of cognitions and behaviours, as long as the effects of the questionnaire condition(s)were contrasted with the effects of a no-measurement condition. The review also aimed to examine theimpact of study methodological features on observed effects.
The results were based on 38 papers reporting 41 studies of the QBE. The overall effect size was statisticallysignificant but small [standardised mean difference (SMD) 0.09, 95% CI 0.04 to 0.13], with moderateheterogeneity. Again, there was significant evidence of publication bias. Moreover, there was considerablerisk of bias when assessed using the Cochrane Collaboration tool.53 There was no significant effect of risk ofbias on observed effects. Effect sizes varied by behaviour type, with the largest for physical activity (SMD0.20) and the smallest for drinking (SMD 0.04). Most relevant to health checks, the SMD for screening was0.06 (95% CI 0.003 to 0.12). The review concluded by calling for future QBE trials to be preregistered, tofocus on reducing risk of bias and to provide detailed descriptions of the procedures in each trial arm.
Financial incentives to increase questionnaire return rates
Financial incentives for questionnaire return are known to increase response rates. A systematic reviewincluding 94 trials with a pooled total of 160,004 participants found that the odds of returning a postalquestionnaire were considerably increased if a financial incentive was offered [odds ratio (OR) 1.87,95% CI 1.73 to 2.04].54 As the QBE is greater among individuals who return a questionnaire,44
incentivising questionnaire return may increase the size of any effect of a questionnaire on uptake ofhealth checks. A meta-analysis of 85,671 participants in 88 randomised trials of financial incentives toincrease response rates for mailed questionnaires reported that there was a significant increase in responserates for incentives up to the value of $5.55 There is strong evidence to suggest that the offer of a financialincentive may increase the rate of return of the QBE questionnaire.
What is the potential impact of the question–behaviour effecton socioeconomic inequalities in uptake?
Death rates from coronary heart disease are highest in areas of greatest deprivation,6 so consideringsocioeconomic inequalities in the evaluation of any intervention to increase the uptake of NHS healthchecks is important. Although evidence suggests that enhanced invitation methods such as a QBE-basedquestionnaire increase the uptake of screening and the performance of health-related behaviours, we donot know their impact on NHS Health Check, a relatively new programme. Theoretical arguments suggestthat uptake inequality might be either reduced or increased.
One argument is that it may be more difficult for those experiencing higher levels of deprivation to converttheir positive attitudes and intentions with regard to health checks into action. The QBE may increase thecognitive accessibility of attitudes towards the behaviour, thereby increasing the likelihood that thebehaviour is performed. This increased cognitive accessibility may make it easier for people experiencingmore socioeconomic deprivation to find an opportunity to act on their intentions, thereby increasing healthcheck uptake.
Another argument is that the strength of the QBE is affected by individuals’ beliefs about the behaviour inquestion, being stronger for individuals who hold positive attitudes to, and intentions for, the behaviour.44
The extent to which any socioeconomic inequality in health check uptake may be the result of moresocioeconomically deprived individuals having more negative views of health checks than less deprivedindividuals is unclear. If socioeconomic deprivation is associated with fewer perceived benefits of andgreater perceived barriers to uptake, as it is for cancer screening, then an intervention using the QBE mayincrease uptake inequality.56
How might offering an incentive for questionnaire returnaffect the social patterning of responses to thequestion–behaviour effect?
The offer of a financial incentive may increase questionnaire return rates only among those with alreadypositive attitudes towards health checks, in which case it would result in increased uptake. If the offer of afinancial incentive increases questionnaire return rates among those with less positive attitudes, the incentiveis likely to have less of an impact on uptake. There is little research examining how and if incentivesinfluence uptake of screening differentially across different levels of deprivation.57 The offer of a financialincentive may be most attractive for individuals who are experiencing deprivation and so may increase thestrength of the QBE on health check uptake particularly in individuals from deprived backgrounds.
According to a cognitive dissonance explanation of the QBE an incentive may backfire and not result in anincrease in attendance. This argument suggests that having an incentive gives respondents a reason forcompleting questions and reduces the cognitive dissonance that might be experienced. It is the dissonancethat drives the behaviour and removing it reduces the impact on behaviour. Such an effect has beensuggested in studies in progress on bowel cancer screening and cervical cancer screening (Professor MarkConner, University of Leeds, 2015, personal communication). It will be important to consider inequalities inuptake in any investigation of the impact of the QBE, with or without the provision of an incentive forquestionnaire return, on the uptake of health checks.
DOI: 10.3310/hta20840 HEALTH TECHNOLOGY ASSESSMENT 2016 VOL. 20 NO. 84
The concept of informed choice has received considerable attention in the context of the offer ofscreening tests and is relevant here even though NHS health checks are offered as a clinical service, not asa screening programme. Marteau et al.58 defined an informed choice as an action ‘based on relevantknowledge, consistent with the decision-maker’s values’. Marteau and Kinmonth59 argued that, in thecontext of cardiovascular screening, participation on the basis of informed choice might encouragethe participation of individuals who were more motivated to reduce their level of risk. This might have theunwanted consequence of increasing inequalities in cardiovascular risk.59 These hypotheses were notsupported by the results of a study of diabetes mellitus screening in which individuals’ knowledge, and thereceipt of an invitation that promoted informed choice, were only weakly associated with screeningattendance.60 In the context of the present study, we believe that it will not be feasible to evaluatewhether the uptake of NHS health checks is adequately informed. Distributing questionnaires to assessinformed choice in the no-questionnaire control condition would obviously contaminate the controlcondition. Including the questionnaire items to measure knowledge of health checks and their potentialoutcomes, which would be required to assess informed choice, would increase questionnaire length andpotentially dilute the QBE in those allocated to questionnaire conditions. Questions of informed choice andNHS health checks are left for a future study.
Uptake patterns
As previously explained, the NHS Health Check programme in England aims to identify people at risk ofdeveloping preventable illness, including heart disease, stroke, diabetes mellitus and kidney disease. Anyindividual between the ages of 40 and 74 years without an existing chronic condition should be invited fora health check once every 5 years.
Initial modelling of the cost-effectiveness of the programme was based on a 75% uptake. Sinceimplementation, uptake of the health checks remains below the national target. Research on NHS healthchecks has identified some patterns in uptake that are often observed in screening programmes. Theseinclude lower uptake rates in men, people at the younger end of the target age range and people withbetter health profiles.37 Associations between deprivation and uptake have been less consistent. Higherdeprivation has been linked with lower uptake,61 which is consistent with evidence from other screeningprogrammes,16 whereas some studies have reported higher uptake in more deprived areas27 or norelationship.25 In the same trial,25 the proportion of health checks and demographic characteristics werecompared between patients who received a postal invitation and those whose health checks wereperformed opportunistically.
Research objectives
The aim of this research was to determine whether enhanced invitation methods, using the QBE, lead toincreased uptake of NHS health checks. The project aimed to rapidly implement a RCT to generateevidence in the short term to inform decision-making in the NHS.
The specific objective of this research was to implement a RCT using individual participants who areeligible for NHS health checks as the unit of allocation. The trial compared the effects of (1) standardinvitation only, (2) a QBE questionnaire followed by a standard invitation 1 week later and (3) a QBEquestionnaire with an offer of a retail voucher as an incentive for questionnaire completion followed by astandard invitation 1 week later.
The intervention effect was evaluated using the primary outcome of whether or not each individualcompleted their NHS health check within 182 days (6 months) of the standard invitation being sent.
The research also evaluated the feasibility of a rapid trial using electronic health records, with anautomated randomisation procedure embedded into the Health Check programme managementinformation system.
We also conducted a cohort study of all health checks conducted during the study period at generalpractices participating in the trial with the aim of comparing the characteristics of participants receivinginvited health checks with the characteristics of participants receiving ‘opportunistic’ health checks.
We also conducted a qualitative interview study with the aim of evaluating the views of health-careprofessionals and patients concerning the uptake of health checks to identify factors that influence uptakeand response to the trial interventions.
Context
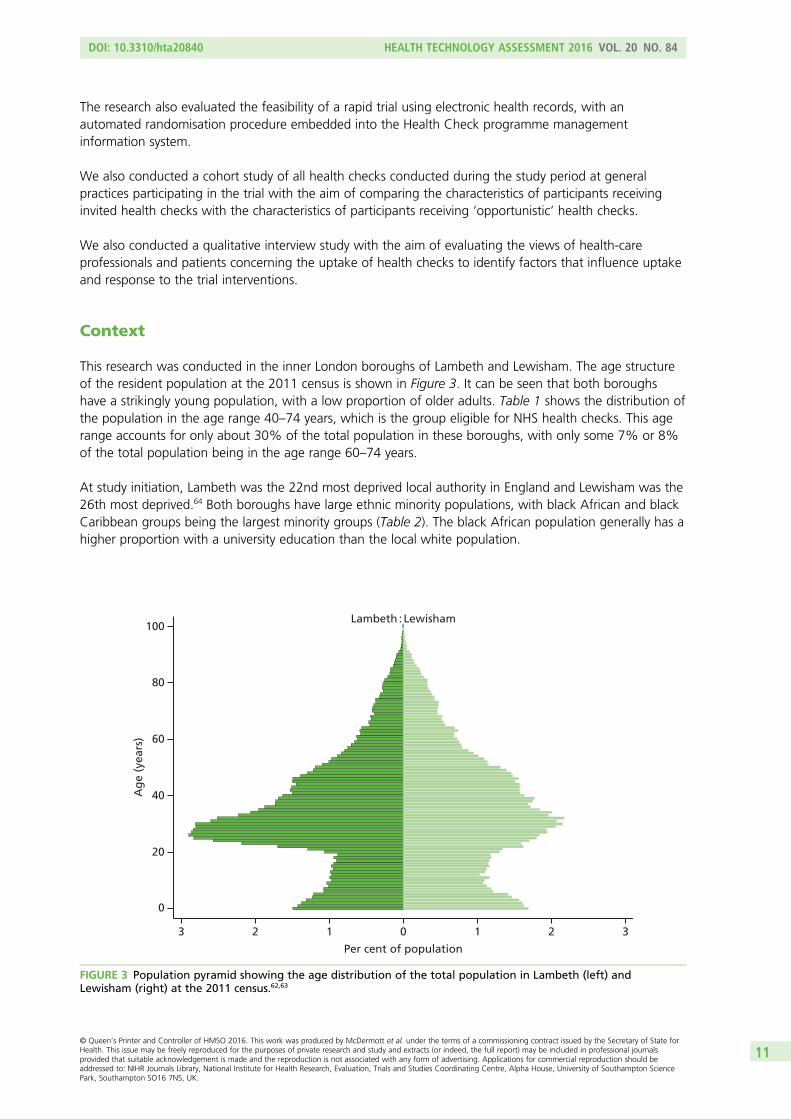
This research was conducted in the inner London boroughs of Lambeth and Lewisham. The age structureof the resident population at the 2011 census is shown in Figure 3. It can be seen that both boroughshave a strikingly young population, with a low proportion of older adults. Table 1 shows the distribution ofthe population in the age range 40–74 years, which is the group eligible for NHS health checks. This agerange accounts for only about 30% of the total population in these boroughs, with only some 7% or 8%of the total population being in the age range 60–74 years.
At study initiation, Lambeth was the 22nd most deprived local authority in England and Lewisham was the26th most deprived.64 Both boroughs have large ethnic minority populations, with black African and blackCaribbean groups being the largest minority groups (Table 2). The black African population generally has ahigher proportion with a university education than the local white population.
100
0
20
40
60
Ag
e (y
ears
)
80
0 1 2 33 2 1
Per cent of population
Lambeth : Lewisham
FIGURE 3 Population pyramid showing the age distribution of the total population in Lambeth (left) andLewisham (right) at the 2011 census.62,63
DOI: 10.3310/hta20840 HEALTH TECHNOLOGY ASSESSMENT 2016 VOL. 20 NO. 84
The Health Check programme in the two boroughs utilises a call–recall system. This is operated throughthe offices of the primary care shared services but is supported by a private sector company called QualityMedical Solutions (QMS) Ltd (Bournemouth, UK). QMS has developed a software system, known as HealthCheck Focus, that links the general practices in the boroughs to primary care shared services to enableinvitations to health checks to be organised. Standard invitations are sent out using a slightly modifiedversion of the national invitation template. The operation of this system is discussed further in Chapter 2.Patients who receive a standard invitation to a health check are offered a choice of making anappointment with their general practice or attending for a check at a local pharmacy. In general, atwo-stage process is followed, with a blood test followed by a health check appointment. Most generalpractices offer opportunistic health checks in addition to any health checks carried out in patients whorespond to a standard invitation letter. Both boroughs also commission outreach teams to conduct healthchecks opportunistically among high-risk groups. About 25% of health checks in Lewisham and 20% inLambeth are conducted by third-party providers, with pharmacy-based checks accounting for the majorityand outreach teams accounting for < 5% of all health checks. Results of third-party checks arecommunicated to general practices through the Health Check Focus software. The ratio of invited toopportunistic health checks is discussed further in Chapter 6.
TABLE 1 Distribution of the total population in Lambeth and Lewisham at the 2011 census by selectedage groups62
Age group (years)
Lambeth Lewisham
Population % Population %
≤ 40 199,929 66.0 170,288 61.7
40–44 23,088 7.6 21,919 7.9
45–49 20,897 6.9 20,481 7.4
50–54 15,601 5.1 15,750 5.7
55–59 11,372 3.8 11,523 4.2
60–64 9012 3.0 9789 3.5
65–69 6623 2.2 7284 2.6
70–74 5994 2.0 6357 2.3
≥ 75 10,570 3.5 12,494 4.5
Total 303,086 275,885
TABLE 2 Distribution of the population of Lambeth and Lewisham at the 2011 census by ethnic group62
Ethnicity
Lambeth Lewisham London England
Frequency % Frequency % Frequency % Frequency %
White 173,025 57 147,686 54 4,887,435 60 45,281,142 85
Mixed 23,160 8 20,472 7 405,279 5 1,192,879 2
Asian 20,938 7 25,534 9 1,511,546 18 4,143,403 8
Black African 35,187 12 32,025 12 573,931 7 977,741 2
Black Caribbean/black other 43,355 14 42,917 16 514,709 6 868,873 2
Other 7421 2 7251 3 281,041 3 548,418 1
Total 303,086 100 275,885 100 8,173,941 100 53,012,456 100
The protocol for the trial has been reported previously.65 The trial was registered on 21 March 2013(trial registration number ISRCTN42856343).
Trial design
This was a three-arm superiority RCT with equal allocation to each arm (Figure 4). The trial interventionsconsisted of (1) standard invitation only to a NHS health check, (2) a QBE questionnaire followed by astandard invitation and (3) a QBE questionnaire and offer of a financial incentive to complete thequestionnaire followed by a standard invitation. Participants in all three trial arms received a reminder letterat 3 months following the initial invitation.
Setting
The trial was conducted in two London boroughs, Lambeth and Lewisham, which are described briefly inChapter 1. Both boroughs are typical of areas that are in need of intervention to increase the number ofindividuals attending for their NHS health check; uptake is below the national average (48%). In 2012/13,31% of individuals invited for a health check in one borough attended and 45% in the other.
General practice recruitment
General practices in the two participating boroughs were eligible to participate in the trial. Each practiceparticipated in the trial for a minimum of 12 months to allow for seasonal variation in uptake ofhealth checks.
General practice recruitment was facilitated by the National Institute for Health Research (NIHR) SouthLondon Clinical Research Network, which advertised the trial to its general practices and offeredreimbursement of costs for participation. In addition, practices were recruited into the trial based on existingworking relationships either with members of the research team or with the borough NHS Health Checkprogramme co-ordinators. A non-probability sampling strategy was used because conducting the trialrequired a significant level of access to, and co-operation from, general practices to utilise the generalpractice electronic health record system and participating practices were necessarily volunteers. To evaluateselection bias, general practices that participated in the trial were compared with all general practices in thetwo boroughs with respect to general practice list size, area deprivation [Indices of Multiple Deprivation(IMD) 2010 score66], proportion of ethnic minorities and achievement of Quality and Outcomes Framework(QOF) targets, both overall and for public health. Although the method of general practice selection mightbe associated with patients’ uptake of health checks, it was not considered likely that general practiceselection would be associated with patients’ propensity to respond to the study interventions.
Individual participant recruitment
Patients were included in the trial only if the senior partner at the practice provided written informedconsent. All participants in the consented practices who were eligible to be invited for an NHS healthcheck were included in the trial. There were no exclusion criteria for trial recruitment.
A cross-borough call–recall system is used to recruit patients into the NHS Health Check programme.The call–recall system is commissioned by the boroughs and is implemented by the primary care shared
DOI: 10.3310/hta20840 HEALTH TECHNOLOGY ASSESSMENT 2016 VOL. 20 NO. 84
services team, working in association with the commercial information technology company, QMS. QMShas developed bespoke software (Health Check Focus) that is used in the management of the HealthCheck programme. All general practices in the two boroughs utilise Health Check Focus software.
Invitations to the programme are issued through a monthly cycle. This begins with the ‘harvesting’ ofeligible patients from general practice information systems. All general practices in the two boroughs useEMIS (EMIS Health, Cambridge, UK) electronic health records software. Eligibility for the NHS Health Checkprogramme is initially defined on the basis of age and comorbidity. Individuals who are registered withgeneral practices in Lambeth and Lewisham form the initial population. Participants are eligible forinvitation for a NHS health check if they are aged from 40 to 74 years. Participants are ineligible if theyalready have a defined comorbidity, including CVD, or treated risk states. Participants are excluded if theyhave diagnosed ischaemic heart disease, heart failure, atrial fibrillation, stroke or transient ischaemic attack,diabetes mellitus, chronic kidney disease or peripheral vascular disease. Participants are also excluded ifthey have diagnosed hypertension or hypercholesterolaemia or are being treated with antihypertensivedrugs or statins.
General practice data are uploaded into Health Check Focus on a monthly basis and bespoke software isused to remove ineligible participants on the basis of Read codes that identify patients already included onCVD registers. An initial pre-notification list (PNL) is prepared by QMS and sent to general practices forreview. Any participants whom the general practice considers should not be invited (e.g. they have died,are terminally ill or have left the practice) are excluded. The exclusions are confirmed by practice staff priorto patient invitations being sent each month by checking the records of patients included in the PNL.Only a very small number of patients are removed at the PNL stage. The final list of participants eligible forinvitation is then forwarded to primary care shared services by the 21st of each month and standard NHSHealth Check programme invitation letters are then sent out on the 28th of each month. A commercialmailing house is used to send the invitation letters.
Recruitment and randomisation
To conduct the trial, we negotiated with the borough teams, QMS, the primary care shared servicesteam and general practices to introduce modifications into the standard NHS Health Check programmeinvitation process. Our aim was to introduce an automated recruitment and randomisation procedureinto the standard invitation process, through modifications to QMS Health Check Focus software. At thestart of the trial the feasibility, reliability and likely time scale for such a modification were unknown.We considered that reliance on an unproven recruitment and randomisation procedure might carry asignificant risk to the successful conduct of the trial. We therefore developed an alternative method ofrecruitment and randomisation that could be implemented through visits to general practices. The trial wasdelivered through the use of these two different recruitment and randomisation procedures, which will bereferred to as the ‘automated’ and ‘in-practice’ recruitment methods, respectively.
In-practice method for recruitment and randomisationFor the in-practice method of allocation, members of the research team visited each practice monthly toaccess the practice-approved PNL. Participants included in the approved PNL were allocated to the three trialarms using previously prepared randomisation lists. Each month, the trial statistician drew up randomisationlists, stratified by general practice. As all patients within a practice were assigned simultaneously, participantswere allocated to intervention arms in a ratio of 1 : 1 : 1 by means of a computer-generated randomisationlist stratified by general practice and month using permuted blocks of three. Randomisation lists weregenerated using the Stata command ‘ralloc’ in Stata 12 (StataCorp LP, College Station, TX, USA). Therandomisation list was applied to the approved PNL by the trial researcher, who assigned the trial arm inthe existing order of the approved PNL. Practice staff responsible for preparing the approved PNL neverhad access to the randomisation list for the practice. This process was considered to provide adequateconcealment of the allocation procedure.
DOI: 10.3310/hta20840 HEALTH TECHNOLOGY ASSESSMENT 2016 VOL. 20 NO. 84
Automated method for recruitment and randomisationFor general practices assigned to the automated method for recruitment and allocation, randomisation wasperformed automatically using a randomisation procedure programmed into QMS Health Check Focussoftware, used to manage the Health Check programme. Randomisation lists were generated using abespoke algorithm embedded within the QMS software. Simple randomisation, stratified by practice andmonth, was employed. Participants were automatically assigned a study identification number and groupallocation when the PNL was electronically approved by the general practice.
Pilot studyDuring the first 2 months of use of the automated recruitment method, a review of the trial data showedthat the correct allocation ratio was not being achieved. Further adjustment to the software was thereforemade. The first 2 months were therefore considered to act as a pilot study and data from these monthswere excluded from the main trial analysis.
Once randomisation was completed, the PNL list, with trial arm allocations included, was forwarded to theoffices of the primary care shared services team. Here, trial research staff arranged for interventionmaterials to be sent to participants, as outlined in the following section. Initially, an in-house mailingprocedure was used; later, we used the services of the commercial mailing house, Docmail (Radstock, UK).Table 3 displays the procedure for mailing invitations during the trial.
Intervention rationale and development
The original study by Conner et al.,44 which suggested that the QBE may promote health check uptake,employed a questionnaire that assessed constructs from the TPB in relation to health check attendance.The questionnaire employed as the intervention in the present study was based on the same theory. It wasalso decided to add items assessing anticipated regret because a previous QBE study45 found that, amongparticipants who returned completed questionnaires, those who completed a TPB with anticipated regretquestionnaire had a significantly higher cervical cancer screening attendance rate (65.1%) than those whoreceived a TPB-only questionnaire (44%).
The questionnaire employed in the previous study using the QBE to promote health check uptake44
included 23 items, each in relation to health check attendance: eight measuring attitudes, nine measuringsubjective norms, three measuring PBC and three assessing intentions. The study by Conner et al.44 wasconducted in a single general practice in rural England. In contrast, the present trial was implemented intwo London boroughs ranked among the most deprived local authorities in England.62 Given the known
TABLE 3 Procedure for mailing invitations during the trial
Procedure Standard practiceStandardinvitation QBE questionnaire
QBE questionnaire andincentive
PNL list sent topractice
21st day of month 21st day of month 21st day of month 21st day of month
Randomisationcompleted by28th day of month
Randomisation completedby 28th day of month
Randomisation completedby 28th day of month
QBE questionnaire andcovering letter sent on28th day of month
QBE questionnaire andcovering letter offeringincentive sent on 28thday of month
Standard invitationletter sent toparticipants
28th day of month Standard invitationletter delayed by7 days
relationship between socioeconomic deprivation and low levels of literacy,67 there were concerns thatemploying a questionnaire of similar length in these boroughs would deter questionnaire completion,inhibiting the operation of the QBE. A decision was made to reduce the questionnaire length for use in thepresent study so that it contained two items for each psychological concept specified by the TPB and foranticipated regret, giving a total of 10 items.
For all questionnaire items, wording was based as much as possible on items that had been employedin previously successful QBE studies. When a number of possible items were available for assessing aconstruct, the choice was guided by considering which options had the best readability. One of theintentions items was asked in the interrogative form, that is, as a self-posed question (‘Will I . . .?), becausea previous study found that the QBE was stronger when intentions items were asked in the interrogative.68
All items were rated on a 7-point scale with labelled end points. The questionnaire items were printed in16pt font in an effort to maximise legibility in line with ‘clear print’ standards.67
The questionnaire was tested with six individuals attending for a NHS health check at a local communityevent. Most completed it within 5 minutes and made favourable comments on the layout and font size.However, respondents did not use the full range of response options, with responses instead clusteredaround the labelled end points. Another version of the questionnaire was developed that had all responseoptions labelled. Further pilot testing with five people in the target age range for a health check foundthat this format was associated with respondents using a wider range of the response options. Commentswere made on the repetitiveness of some items and a suggestion was made to reduce the numberof questions. At this stage the questionnaire was circulated for feedback to members of the projectmanagement team, including local general practitioners (GPs) and NHS Health Check programme leaders.It was agreed that the questionnaire was too long as the items covered three A5 sides in a booklet.The study team decided to have only one item for each of the two concepts that were thought to be lesscentral to the operation of the QBE, namely subjective norms and PBC. The PBC item retained reflectedperceived confidence and so might also be referred to as self-efficacy.
Table 4 presents the intervention questionnaire items in order. The full version of the questionnaire beganwith an example of how to record one’s response to a question, about a different topic (television
TABLE 4 Items used in the QBE questionnaire
Construct Item stem Response optionsPreviously used topromote
Intentions I intend to go for a health check in the next fewweeks
Strongly disagree tostrongly agree
Health check uptake44
Attitudes For me, going for a health check in the next fewweeks would be . . .
Very bad to very good Health check uptake44
Anticipatedregret
If I did not go for a health check in the next fewweeks, I would feel regret
Strongly disagree tostrongly agree
Cervical cancerscreening uptake45
Intentions Will I go for a health check in the next few weeks? Definitely no todefinitely yes
Physical activity68
Anticipatedregret
If I did not go for a health check in the next fewweeks, I would later wish I had
Strongly disagree tostrongly agree
Cervical cancerscreening uptake45
Attitudes For me, going for a health check in the next fewweeks would be . . .
Very worrying to veryreassuring
Health check uptake44
PBC(self-efficacy)
I’m confident I can go for a health check in thenext few weeks
Strongly disagree tostrongly agree
Health check uptake44
Subjective norms People who are important to me would . . . . . . ofme going for a health check in the next few weeks
Completely disapproveto completely approve
Flu vaccinationuptake44
DOI: 10.3310/hta20840 HEALTH TECHNOLOGY ASSESSMENT 2016 VOL. 20 NO. 84
viewing). Appendix 1 provides a fully formatted version of the questionnaire, as received by participants,including this example item. The leaflet had a Flesch reading ease score of 80.1 and a Flesch–Kincaid gradelevel of 5.9, suggesting that it was accessible to people with the reading ability of an 11-year-old.
Patient and public involvement
In addition to patient involvement in questionnaire development, as outlined in the previous section,patient feedback was also obtained on the use of an incentive, the study invitation letter and the protocol.The six patients interviewed during questionnaire development in addition to three members of the publicwho met the target age range for a health check were questioned regarding the acceptability of theincentive for questionnaire completion and the trial invitation letter (both of which were consideredacceptable). In addition, members of the Trial Steering Committee (TSC), which included stakeholders(NHS Lambeth and Lewisham Health Check programme and CVD managers) and patient representatives,discussed and provided feedback on the study documents and the protocol, which led to generalacceptability and some minor amendments being made before documents were sent out.
Justification of the incentive
Strong evidence suggests that financial incentives for questionnaire return increase response rates.A systematic review including 94 trials with a pooled total of 160,004 participants found that the odds ofreturning a postal questionnaire were almost doubled if a financial incentive was offered.54 As the QBE isgreater among individuals who return a questionnaire,44 incentivising questionnaire return may increasethe size of any effect of distributing a questionnaire on uptake of the NHS health check. A meta-analysisof 85,671 participants in 88 randomised trials of financial incentives to increase response rates for mailedquestionnaires reported a significant increase in response rates for incentives up to the value of $5.55 It wasdecided to offer participants in one arm of the trial the incentive of a £5 gift voucher to complete andreturn the questionnaire. The gift voucher scheme employed (Love2shop) provided vouchers that could beexchanged at a wide variety of shops and so was intended to appeal to as many participants as possible.
Details of the interventions received in each trial arm
Participants in the standard invitation trial arm received the standard invitation letter for a NHS healthcheck, sent from the primary care shared services team that organises health check invitations. Thisconsisted of a single-page letter from the participants’ GP inviting them to make an appointment at theirgeneral practice to receive a health check or to visit a local participating pharmacy. Participants alsoreceived an information sheet. Individuals were sent a reminder letter if they did not attend for a healthcheck within 12 weeks of their first invitation.
Participants in the QBE questionnaire trial arm were sent the QBE questionnaire with a prepaid returnenvelope and covering letter (see Appendix 2) 7 days before they were sent the standard NHS health checkinvitation letter and information sheet. They were also sent a reminder letter at 12 weeks if appropriate.
Participants in the QBE questionnaire and incentive trial arm were sent the QBE questionnaire with a prepaidreturn envelope and covering letter (see Appendix 3) 7 days before they were sent the standard NHS healthcheck invitation letter and information sheet (plus a reminder letter at 12 weeks if appropriate). The coveringletter in this trial arm offered the £5 retail voucher as an incentive to return the questionnaire.
Languages other than EnglishIn the study areas, the London boroughs of Lambeth and Lewisham, ethnic minority groups account for ahigh proportion of the population. The major ethnic groups are of black African and African Caribbean
origins and are English speaking. There are significant groups of European origin who speak languagesother than English, but these groups are generally literate in English.
Standard invitation letters were sent in English. A single sentence was included on the reverse side of theletter, translated into 11 different languages, offering translated versions of the invitation letter and leafletif required. Up to the study start date, no translations had been requested (primary care shared services,10 September 2012, personal communication). In view of this, we sent the QBE questionnaire andcovering letter in English only and included a telephone number to call on the final page of thequestionnaire if a translation was required. In a randomised study any differences in literacy betweenthe two arms will occur at random.
Sample size
It was important to detect even modest increments in screening uptake between trial arms because in apublic health programme small effects may yield substantial benefits across the population at risk. Wemade the statistically conservative assumption that the underlying proportion of people invited whoactually receive a health check is about 50%. If there are 4263 participants in each trial arm, with 12,789in total, this will provide > 90% power to detect a difference in uptake of health checks between eachactive treatment arm and the standard intervention arm of at least 4%. These calculations are based on a5% significance level using a Bonferroni correction for three comparisons (i.e. 0.0167). Calculations wereperformed in Stata 12. As present rates of health check uptake are < 50% in the study area, slightlygreater power may be realised in the study. There were no planned interim analyses and no stoppingguidelines as this trial had a low risk of adverse events.
In the study by Conner et al.44 47% of intervention group participants returned the QBE questionnaire andhealth check uptake was 78% among participants who completed the questionnaire, compared with 60%among non-completers and 54% in control participants. Based on experience in the study area in London,we expected that the response rate to the QBE questionnaire would be about 40%.69
The anticipated flow of patients through the intervention trial arms is shown in Table 5. If the QBE effectwas restricted to questionnaire returners, then to achieve an overall increment in health check uptake of4% we expected that uptake would have to be 10% higher in questionnaire returners than non-returners.Conner et al.44 found that health check uptake was 24% higher in questionnaire returners than in controlparticipants. In this study there was also a modest increment in uptake in questionnaire non-returners.
Blinding
Participants’ GPs provided consent to their participation in the trial and so participants were not overtlyaware that there were other trial arms. However, participants in the QBE questionnaire and QBEquestionnaire and incentive groups received a postal intervention and thus could not be blinded to theirtrial arm allocation. Members of the study team were blind to participants’ details during trial arm
TABLE 5 Flow of participants to achieve a 4% increase in health check uptake, with 40% return of the QBEquestionnaire and 50% underlying uptake of health checks
allocation and were blind to group allocation during extraction of participant data and outcomes fromgeneral practice records.
Duration of the treatment period
Participants were followed up for a minimum of 6 months after the first NHS health check invitation was sent.
Outcome data collection
No data were collected directly from patients. Data were extracted from electronic health records into aspreadsheet and were then transferred to a database for statistical analysis.
The primary outcome was uptake of a NHS health check within 182 days (6 months) of receiving thestandard invitation letter. Secondary outcomes included uptake of a NHS health check 91 days (3 months)post standard invitation and time elapsed between participants receiving the standard invitation anduptake of a health check.
Outcome data were extracted from participant electronic health records by members of the research teamusing nationally specified Read codes to record completion of NHS health checks (Table 6). Participantsfrequently had more than one code recorded to identify the completion of a health check. The codes8BAg (NHS health check completed) and 38B1 (vascular disease risk assessment) were often co-recorded.At the time of data extraction, participants’ postcodes were linked to the IMD 2010 score66 as a marker ofdeprivation. Data for gender, year of birth and practice-recorded ethnicity were also extracted. Data wereextracted in a single batch for each practice between 1 June 2015 and 2 July 2015.
Analysis of the data extracted on health check completion revealed a high proportion of health checkscompleted in non-trial participants. To investigate this observation further, we subsequently collected datafor CVD risk scores (see Table 6) and BMI for registered patients either who had a health check recorded
TABLE 6 Codes for completion of the NHS health check and CVD risk scores
Read code Read term
Codes for completion of the NHS health check
8BAg NHS health check completed
8BAg0 NHS health check completed by third party
38B1 Vascular disease risk assessment
38B10 CVD risk assessment by a third party
9OhA CVD risk assessment carried out
Codes for CVD risk score recording
38DF QRISK CVD 10-year risk score
38DP QRISK2 CVD 10-year risk score
662k JBS CVD risk < 10% over next 10 years
662l JBS CVD risk 10–20% over next 10 years
662m JBS CVD risk > 20% up to 30% over next 10 years
during the study period or who were trial participants. Data were extracted from general practice systemsbetween 17 August 2015 and 2 September 2015. Because there may have been changes to practicepopulations and health check recording between the first and second data extraction, the evaluation ofcase mix for invited compared with opportunistic checks was treated as a separate analysis from the trialanalysis. At the time of the study, the JBS risk score calculator12 was mandated by the NHS Health Checkprogramme locally. Values for the QRisk2 score13 were utilised if the JBS score was not recorded.
Reliability and data checking
Extensive checks were performed to ensure that the recruitment and randomisation procedures wereworking as intended:
l We evaluated the recording of completed health checks during the course of the trial and found thathealth checks in non-trial patients outnumbered health checks in trial patients by a ratio of about 2 : 1.
l We checked the details, including name and NHS number, of participants included in the approved PNLagainst general practice records. These checks identified a small number of discrepancies in NHSnumbers on the PNL list prepared through QMS Health Check Focus. This was drawn to the attentionof QMS who corrected the problem and there was no further recurrence.
l We conducted checks that confirmed that standard invitation letters were sent to the correct patientsidentified on the approved PNL list for practices using both the in-practice and the automatedrecruitment methods.
l During the trial, we checked the recording of completed health checks for a 10% sample of patientsin 1 month using general practice records. This check revealed 100% accuracy of recording of thecompletion or non-completion of health checks.
At the protocol stage we envisaged using outcome data extracted centrally for the NHS Health Checkprogramme through the health check management information system, QMS Health Check Focus. Duringthe conduct of the trial, we decided that higher-quality data could be obtained by using data extracted bytrial staff from general practice systems. Following the completion of the trial, we evaluated the reliabilityof the trial data against data extracted from the health check management information system. Weevaluated the number of patients invited for health checks during the trial period at each practice. We alsoevaluated the number of completed health checks in invited and non-invited patients at each practice.Completed health checks were divided into those delivered by the general practice and those delivered bythird-party providers, including pharmacies and outreach services.
Before analysis, basic checks to view incomplete or inconsistent data were performed. These includedassessment of missing data, data outside the expected range and other inconsistencies between variables.When any inconsistencies were found, data were double-checked and corrected if necessary or set tomissing otherwise. All changes were documented.
Data analysis plan: data description
A detailed statistical analysis plan was drawn up by the study statistician, principal investigator andstudy psychologist prior to completion of participant follow-up and compilation of the study data set.Recruitment and flow of participants through the study was depicted using a Consolidated Standards ofReporting Trials (CONSORT) flow chart.
Baseline comparability of randomised groupsBaseline descriptive variables of participants were summarised by treatment arm. Mean and standarddeviation (SD) or median (range, IQR) were reported for continuous outcomes, whereas frequencies andproportions were reported for categorical outcomes. Data available for analysis included participant age,
DOI: 10.3310/hta20840 HEALTH TECHNOLOGY ASSESSMENT 2016 VOL. 20 NO. 84
gender and ethnicity and deprivation quintile. Participants were divided into the age groups 40–59 yearsand ≥ 60 years for analysis. Practice-recorded data for ethnicity were recoded to six categories based onthe 2011 census question as shown in Table 7. It should be noted that general practice ethnicity recordingoften includes non-standard terminology, including details of nationality or religion. IMD 2010 scores66 atthe lower super output area level were mapped to quintiles of score for England. No significance testing ofdifferences in baseline values was undertaken.
Data analysis plan: inferential analysis
Analysis of the primary outcomeUptake of a NHS health check was defined as having taken place if any of the codes shown in Table 6were recorded within 6 months of the randomisation date.
The primary analysis was an intention-to-treat analysis including all participants who were randomisedregardless of whether the intervention was subsequently received. Patients who died or left the practiceprior to the 6-month follow-up period were included in the analysis using the status at their last recordedfollow-up.
The distribution in time of health checks following randomisation was evaluated in a time-to-eventframework. This allowed us to evaluate the impact of interventions on the primary outcome over time upto 6 months’ follow-up. To visualise the cumulative proportion of participants having a health check bytrial arm, a Kaplan–Meier curve was plotted for each trial arm.
The number and proportion of health checks were tabulated by practice and between-practice variationwas quantified by estimating the intraclass correlation coefficient using analysis of variance separately foreach trial arm.
To adjust for practice effect, a marginal model using the method of generalised estimating equations (GEEs)was implemented. As the number of practices was relatively small, we used an exchangeable correlationstructure with model-based variance estimates.70 As the primary interest was to estimate absolute differencesin NHS health check uptake, rather than in relative measures such as ORs, the GEE model was implementedusing the binomial family and an identity link. In addition to treatment arm the model included thestratification variables month of invitation and year. The associated p-values for treatment arm were assessedat the 1.67% significance level to allow for three comparisons: standard invitation with QBE, standardinvitation with QBE and incentive and QBE with QBE and incentive. Estimates were also obtained using thesame methods for subgroups of gender, age group, ethnic group and deprivation quintile. Forest plots wereconstructed using the ‘forestplot’ package in the R program (The R Foundation for Statistical Computing,Vienna, Austria).
Sensitivity analysis of the primary outcomeThe model estimates from the primary analysis were compared using different estimation methods. TheGEE model was compared with a general linear model (GLM) with and without the use of robust standarderrors and the results tabulated.
A meta-analysis was used to examine the impact of recruitment and randomisation procedures bycomparing automated and in-practice methods for each of the three trial arm comparisons in turn. A forestplot was used to visualise the intervention estimates for the difference in uptake between arms at practicelevel. Heterogeneity in estimates was assessed using the I2 statistic.71 In the absence of heterogeneity,estimates were combined by use of a fixed-effects model.
Analysis of secondary outcomes
Time to health check uptakeTime to health check uptake was calculated as the time between the invitation date and the date of therecorded health check or 6-month follow-up, whichever came first. Patients who died or who left thepractice were treated as a censored observation at the last date registered. A time to health check curvewas plotted by treatment arm using the method of Kaplan–Meier.72
InequalitiesThe distribution of the primary outcome was evaluated by subgroups of gender, age (5- and 10-year agegroups), ethnicity (white, mixed, black Caribbean, black African, black other, other and not known) anddeprivation (using deciles of the distribution of IMD 2010 scores for England66). The intervention effectwas estimated for each subgroup and displayed by means of a forest plot. The impact of participantcharacteristics on uptake was further examined by undertaking adjusted analyses using the primaryanalysis model including treatment arm, month of invitation, year, age, gender and deprivation quintile.Fully adjusted analyses were conducted using a logit link, to estimate adjusted ORs.
Analysis of questionnaire responsesTo explore whether or not individuals who completed the questionnaire were more likely to subsequentlyattend a health check and to assess whether or not offering an incentive for return differed acrossdeprivation quintile, we fitted a marginal model with a binomial family and identity link using the methodof GEEs. Covariates in the model included the stratification variable month of invitation, year, questionnairereturn (yes/no), treatment arm, deprivation quintile and trial arm by deprivation quintile interaction. Acomplier average causal effect (CACE) analysis was performed to estimate the effect of the interventionon health check uptake in ‘compliers’. Compliers were defined as participants who returned a QBEquestionnaire in either of the intervention arms, or who ‘would have’ returned a questionnaire if they were
DOI: 10.3310/hta20840 HEALTH TECHNOLOGY ASSESSMENT 2016 VOL. 20 NO. 84
in the standard invitation arm. This analysis followed the approach laid out in Dunn et al.73 As noparticipants were lost to follow-up we were able to estimate the intervention effect without taking intoaccount the missing data mechanism. An estimate of the standard error for the statistic was obtainedthrough bootstrapping.
Responses to questionnaire items were tabulated using means (SDs) of the seven-category scale. Pairwisecorrelations of relevant questionnaire items were evaluated prior to constructing scale scores for furtheruse in the analyses. The correlations of these constructs with each other were evaluated. Analysis ofvariance was employed to evaluate differences in responses between the two questionnaire trial arms.The association of each construct with health check uptake was evaluated in a logistic model, with theconstruct fitted as a linear predictor. Robust standard errors were estimated. Finally, each construct wasdichotomised at the median and the association of highly positive responses, compared with less positiveresponses, with health check uptake was evaluated in a logistic model.
Evaluation of the study as a rapid trial and analysis of therandomisation methods
The trial was commissioned and evaluated as a ‘rapid trial’. We evaluated the delivery of key milestonessuch as the recruitment rate over time. We also compared the in-practice and automated methods ofrecruitment. The number and proportion of participants with the primary outcome were tabulated bypractice. Between-practice variation was quantified by estimating the intraclass correlation coefficient usinganalysis of variance separately for each trial arm. A fixed-effects meta-analysis was conducted, usingaggregated data for each general practice as observations. Randomisation method (in-practice orautomated) was used as a subgroup. Heterogeneity was evaluated using I2 and tau2 statistics. The ‘meta’package in the R program was use for analysis.
Statistical considerations
Missing outcome dataAll participants who did not have a health check visit recorded were assumed not to have attended one.We cannot exclude the possibility that patients attended for a check but that this was not recorded. AsNHS health checks are a key indicator in the Public Health Outcomes Framework, and practices receiveremuneration for performing and recording health checks, it was anticipated that a high proportion of allcompleted health checks would be recorded. The number of missing baseline characteristics was reportedby treatment arm. Baseline variables were not included in the primary analysis and no imputation for thesevariables was undertaken. In secondary analyses participants with missing baseline values were included inthe analysis by use of a missing indicator variable.
Software for statistical analysis
Stata 13 was used for data description and the main inferential analysis.
Economic evaluation
As neither intervention was found to be effective, a cost-effectiveness analysis was not pursued.
A retrospective cohort study was conducted of all health checks completed at trial practices during thestudy period. The trial study period ran from 1 July 2013 to 30 June 2015. During the study period,the total number of NHS health checks recorded at trial practices, after their start date in the trial,was 6184, including 2280 in trial participants and 3904 in non-trial participants. We then extracted datafor cardiovascular risk scores and BMI for participants with health checks recorded. Cardiovascular riskscore data were obtained for 5359 participants, including 2246 out of 2280 (99%) trial participants withhealth checks recorded and 3113 out of 3904 (80%) non-trial participants with health checks recorded.The 3113 out of 5359 (58%) cardiovascular risk assessments in non-trial participants either wereperformed opportunistically or were carried out in patients invited before their general practice joined thetrial. Health checks were classified into ‘invited’ – those performed following a standard invitation letterto a trial participant – and ‘opportunistic’ – those that did not follow a standard invitation during the trial.The relative contribution of invited and opportunistic health checks to overall health check uptake wasestimated. We also compared the case mix of invited and opportunistic checks in terms of age group,gender, ethnic group and deprivation quintile. We also compared BMI category and CVD risk scoreestimates between invited and opportunistic checks. Among the opportunistic checks, 1363 out of 3113(44%) were completed within 6 months of the practice start date in the trial and might potentially haveresulted from invitations before the practice entered the trial. Sensitivity analyses were performed toevaluate the impact of possible misclassification on the results of the study.
Process evaluation and qualitative study
Themes and objectivesThis evaluation assessed the structure, process and outcomes of the Health Check programme. Structureevaluates the provision of facilities and services for effective delivery of the programme. Process elementsevaluate how well the programme was delivered to patients and outcome evaluation assesses the outputsfrom the programme. The purpose of this evaluation was to assess the NHS Health Check programmecarried out across 18 general practices in the London boroughs of Lambeth and Lewisham.
As part of this evaluation, practice staff’s views and attitudes in relation to the workings of theprogramme, benefits and weaknesses, influences on uptake and how improvements, if any, could bemade were explored. Hence, this evaluation deals solely with an assessment of the medical process at the‘patient–physician’ level. It focuses on the process of the NHS Health Check programme delivery, ratherthan the findings or indeed the effects and outcomes of such a programme.
Delivery of the NHS Health Check programme: practice staff and programmelead perspectivesA questionnaire delivered to practice staff included qualitative elements to capture their views on theoverall organisation and delivery of the NHS Health Check programme within their repsective practices.In addition, the two public health programme leads for the NHS Health Check programme in theLewisham and Lambeth boroughs were asked for their thoughts on the future of this programme.
In total, 22 practice staff members from 17 practices involved in delivering the Health Check programmeand two programme leads at commisioning level were interviewed using a semistructured questionnaire.These interviews were conducted over the telephone and face to face; 20 were recorded and transcribedand for two handwritten notes were made during the interviews.
Interviews with general practice and Health Check programme staffGeneral practice staff involved in the implementation of health checks from the 18 practices acrossLambeth and Lewisham included in the trial were invited to be interviewed using a semistructuredinterview schedule. The interview explored attitudes towards the NHS Health Check programme and
DOI: 10.3310/hta20840 HEALTH TECHNOLOGY ASSESSMENT 2016 VOL. 20 NO. 84
towards our RCT to promote uptake of health checks, interviews were conducted face to face or over thetelephone according to preference. Data were analysed using a thematic content analysis. Themes andillustrative quotes were discussed and agreed between three members of the research team.
Content analysis of participant free-text responsesParticipants in the intervention arms of the trial were invited to provide comments about the research in afree-text box at the end of the QBE questionnaire. A simple content analysis was conducted to categorisethe comments under emerging themes. Themes were agreed between two researchers and the commentswere grouped together under these themes in a Microsoft Excel® spreadsheet (2013; MicrosoftCorporation, Redmond, WA, USA).
Patient interview studyWe conducted a qualitative interview study with non-trial participants in the target population in south-eastLondon. The aim was to explore the influences on attendance for a NHS health check among peoplerecently invited to receive one. Semistructured interviews were conducted with a purposive sample recruitedaccording to age, gender and attendance or non-attendance for the health check.
Ethical arrangements
The study received ethical approval from the National Research Ethics Service Committee London, LondonBridge (reference no. 13/LO/01/97). The main ethical issue raised by the study concerned consent toparticipation. It was not feasible to obtain individual participant consent for randomisation. Obtainingconsent, through a postal invitation, from individual participants before entering the study would have ledto a sample that was likely to be highly biased with respect to the propensity to return a questionnaire orto participate in a health check. For this reason we obtained consent from the senior partner at eachgeneral practice that participated in the study. This approach is commonly used in cluster RCTs. Obtainingconsent from an individual who has a stewardship role in respect of a group of individual participants wasjudged to be acceptable by the Medical Research Council in its recommendations on ethical issues in clusterrandomisation.41 The approach was also applicable to the present study in which individual participantrandomisation was to be used. The research also accessed individual participant data on whether or not ahealth check was completed and, for completed checks, the results of the check; however, we had accessonly to fully anonymised data.
Research governance
King’s College London was the sponsor of the study. There was a TSC with an independent chair and twoindependent members. Stakeholder representatives, including managers and GPs, who are responsible forthe implementation of the NHS Health Check programme in Lambeth and Lewisham were also membersof the TSC. There was also a patient member of the TSC.
The following chapters of the report present the main findings of this research. The results are organisedinto five chapters. The first chapter addresses general practice and participant recruitment. This is
followed by a presentation of the main results of the trial. The second chapter analyses data from the QBEquestionnaire to evaluate potential mechanisms of effect. The third chapter compares health checksconducted in response to invitations through the population-based call–recall system with those conductedopportunistically by health check providers. The fourth chapter presents qualitative data from interviewswith health-care professionals and patients that aid interpretation of the findings of this research. The finalchapter evaluates the research as a rapid trial using electronic health records, presenting a comparison ofthe fully automated and in-practice randomisation methods.
Recruitment of general practices and participants
General practice recruitmentIn total, 18 general practices were recruited into the trial. Of these, 12 were selected for the in-practicerecruitment method and six were selected for the automated recruitment method. A 2 : 1 ratio wasimplemented to minimise risk to the trial because of the unknown difficulties of implementing theautomatic procedure.
At one practice using the manual method, recruitment started 2 months later than initially intendedbecause of access issues. Three general practices using automated recruitment completed only 11 monthsin the trial because the recruitment target was reached.
Table 8 shows a comparison of selected measures between general practices included in the trial andother practices in the two boroughs. Trial practices tended to have larger list sizes than non-trial practicesbut achievement of QOF targets was generally similar between trial and non-trial practices. Trial practicesshowed similar levels of deprivation66 and a similar proportion of non-white participants to the entirepopulations of the two boroughs. Evaluation of practices using the automated recruitment methodshowed that these had slightly higher list sizes and slightly higher deprivation scores but a lowerproportion of ethnic minorities than practices using the in-practice recruitment method.
TABLE 8 Characteristics of trial practices and non-trial practices in the two boroughs in 2014–15a
Characteristic Non-trial practices
Trial practices
In-practice recruitment Automated recruitment
Lambeth (n) 39 6 3
Lewisham (n) 32 6 3
List size 2014–15 (n) 6554 (4851–9348) 8093 (6179–12,568) 11,269 (7115–14,404)
Individual participant recruitmentFigure 5 shows the flow of participants through the trial. Between July 2013 and December 2014,12,702 participants were recruited but 21 participants were found to be registered with non-trial practicesand were excluded and second records for 38 participants were found to be duplicated after their firstallocation and these were also excluded, leaving 12,643 participants (Tables 9 and 10). In total,
Participant records allocated(n = 12,702)
• In practice, n = 8588• Automated, n = 4114
Participants from non-study practicesallocated in automated method
(n = 21)
Participant records duplicatedafter first randomisation
(n = 38)
Participant records from pilot ofautomated method
(n = 184)
Participant records(n = 12,681)
• In practice, n = 8588• Automated, n = 4093
Participant records(n = 12,643)
• In practice, n = 8571• Automated, n = 4072
Participant records(n = 12,459)
• In practice, n = 8571• Automated, n = 3888
Trial arm BQBE questionnaire + standard invitation
(n = 4124)
Trial arm B3988
136 participants
Trial arm CQBE questionnaire + incentive + standard
invitation(n = 4104)
Trial arm C3969
135 participants
Trial arm AStandard invitation
(n = 4231)
Trial arm A4095
136 participantsOutcome notascertained
FIGURE 5 Flow of individuals throughout the study from identification to randomisation and follow-up at6 months.
184 participants were included in the pilot of the automated randomisation procedure and were noteligible for the trial, leaving 12,459 participants randomised in the trial. The median number of participantsper site was 711, with a range of 189–1220 (Table 11).
Participant characteristics collected at the time of outcome data extraction included age, gender, ethnicgroup and deprivation category (Table 12). There was a higher proportion of men (52%) than women(44%) invited. This was confirmed in data from the Heath Checks programme management informationsystem, which showed that, in the 2014/15 financial year, 52% of invited patients in Lewisham were menand 56% of invited participants in Lambeth were men. This reflects the demographic distribution of theregistered population in this area. The median age of participants, based on recorded year of birth andyear of randomisation, was 45 (IQR 40 to 54) years. Calculation of age from year of birth may lead tomisclassification by 1 year, but there were nine participants randomised whose ages were < 39 years andtwo aged > 75 years who were nevertheless included in analyses. Trial participants showed generally highlevels of deprivation, with 29.5% in the most deprived quintile for England, 51.2% in the second mostdeprived quintile and none in the least deprived quintile for England. In total, 35.9% of participants werewhite, 19.4% were black and 19.5% were of mixed ethnicity. All participant characteristics were evenlybalanced across the three trial arms.
TABLE 10 Monthly recruitment from general practices using the fully automated methoda,b,c
Month
Practice
Number per month Cumulative total13 14 15 16 17 18
1
2
3
4 39 39 39
5 20 53 72 145 184
6 55 91 16 162 346
7 43 84 101 228 574
8 28 82 103 75 21 38 347 921
9 37 75 93 74 22 29 330 1251
10 33 67 100 71 21 34 326 1577
11 38 73 70 71 14 35 301 1878
12 37 108 84 67 26 34 356 2234
13 32 86 78 73 18 29 316 2550
14 35 80 81 74 19 36 325 2875
15 33 68 72 77 24 32 306 3181
16 44 65 68 57 14 26 274 3455
17 15 81 34 22 17 25 194 3649
18 74 136 78 71 22 42 423 4072
Total 563 1149 1050 732 218 360 4072
a Shaded area represents pilot study phase for the automated method.b Figures are frequencies.c 21 participants from non-study practices were excluded.
Missing outcome dataData for the primary outcome were extracted from general practice electronic health records. At the time ofdata extraction it was not possible to search for outcome data for a small number of participants. Researchand information governance regulations required that all patient-identifying records remained at generalpractices. Spreadsheets documenting recruitment and randomisation for the in-practice randomisationmethod were therefore stored on practice systems. At the time of data extraction, 6 months after the lastparticipant had been recruited, a small number of spreadsheets were found to be missing. Possible reasonsfor the spreadsheets being missing included their not being saved, their being saved in the wrong locationor their being inadvertently deleted during the 6-month follow-up period. It is also possible that in certainmonths a procedure might have been performed remotely at the offices of primary care shared services anddata stored there, but because of reorganisation and relocation of the shared services function during 2015 itwas not possible to investigate this possibility. Details of the missing outcome data are provided in Table 13.The 407 participants with missing outcome data amounted to 3.3% of all trial participants and 4.8% ofparticipants recruited through the in-practice recruitment method. These participants were excluded from trialanalyses, leaving 12,052 participants for further analysis (see Figure 5).
TABLE 12 Baseline characteristics of the study population (continued )
Characteristic
Standard invitation(n= 4231)
QBE questionnaire(n= 4124)
QBE questionnaire+ incentive(n= 4104)
n % n % n %
Mixed 861 20.4 806 19.5 769 18.7
Other 98 2.3 99 2.4 95 2.3
Missing 776 18.3 696 16.9 690 16.8
IMD quintile Most deprived 1214 28.7 1224 29.7 1225 29.9
4 2183 51.6 2128 51.6 2068 50.4
3 365 8.6 367 8.9 381 9.3
2 11 0.3 16 0.4 14 0.3
Least deprived 0 0 0
Missing 458 10.8 389 9.4 416 10.1
TABLE 13 Details of practices with missing outcome data
Primary and subgroup analysesThe primary analysis was undertaken on all participants for whom we had extracted outcome data(n = 12,052). The unadjusted proportions of participants recorded as attending a health check within6 months of the first invitation are shown in Table 14. In total, 590 out of 4095 (14.41%) participants inthe standard invitation arm, 630 out of 3988 (15.80%) participants in the QBE questionnaire arm and 629out of 3969 (15.85%) participants in the QBE questionnaire and incentive arm attended a health check.The primary analysis model estimated the difference in uptake between the standard invitation arm andthe QBE questionnaire arm to be 1.4% (95% CI –0.1 to 3.0%; p = 0.070), indicating a slight increase inhealth check uptake in the intervention arm. Similarly, the difference in uptake between the standardinvitation arm and the QBE questionnaire and incentive trial arm was estimated to be 1.5% (95% CI –0.0to 3.1%; p = 0.054). The two intervention arms were found to have a similar uptake, with an estimateddifference of –0.01% (95% CI –1.59% to 1.58%; p = 0.995). Overall variation in health check uptake bycalendar month was not significant (p = 0.239) but the highest uptake was for January invitations (18.2%)and the lowest was for June invitations (12.9%).
The results of the adjusted analysis, which yielded marginally more precise results, are presented in Table 15.These results demonstrate that health check uptake was about 4% higher in women than in men and about5% higher in people aged ≥ 60 years than in younger adults. Health check uptake was also higher inparticipants of black, Asian or mixed ethnicity than in the local white population. There was also evidence
TABLE 14 Uptake of health checks within 6 months of randomisation by trial arm
Trial armNumber ofparticipants
Number (%) of checkswithin 6 months
Difference in uptake(95% CI) (%)a p-valueb
Standard invitation 4095 590 (14.41) –
QBE questionnaire 3988 630 (15.80) 1.43 (–0.12 to 2.97) 0.070
QBE questionnaire and incentive 3969 629 (15.85) 1.52 (–0.03 to 3.07) 0.054
Total 12,052 1849 (15.34)
a Adjusted for month and year of randomisation and clustering by practice.b p-value of < 0.0167 required for significance because of multiple comparisons.
TABLE 15 Association of case mix variables with health check uptake within 6 months of randomisation
Characteristic Category
Uptake of health checks at 6 months after randomisation
N n % ORa 95% CI p-valueb
Trial arm Standard invitation 4095 590 14 Reference
QBE questionnaire 3988 630 16 1.13 1.00 to 1.27 0.042
QBE questionnaireand incentive
3969 629 16 1.13 1.02 to 1.26 0.018
Gender Female 5449 992 18 Reference
Male 6526 857 13 0.74 0.69 to 0.80 < 0.001
Missing 77 0 0 –
Age group (years) 40–59 10,346 1530 15 Reference
60–74 1629 319 20 1.43 1.20 to 1.71 < 0.001
Missing 77 0 0 –
continued
DOI: 10.3310/hta20840 HEALTH TECHNOLOGY ASSESSMENT 2016 VOL. 20 NO. 84
that health check uptake tended to be higher as level of deprivation decreased. Fitting IMD quintile as acontinuous variable revealed an increase in the odds of health check uptake of 1.10 (95% CI 1.01 to 2.21;p = 0.035) per quintile decrease in deprivation.
Figures 6–8 display intervention effect estimates by subgroup. It can be seen that the estimated differencein proportion of uptake between arms was consistent with the overall intervention effect for all subgroupsexcept for the subgroup of men. Men had a greater estimated difference in uptake for both interventionarms compared with standard invitation [difference 2.88% (95% CI 0.91% to 4.84%; p = 0.004) betweenstandard invitation and QBE questionnaire and 2.29% (95% CI 0.33% to 4.24%; p = 0.022) betweenstandard invitation and QBE questionnaire plus incentive].
Secondary analyses
Time to health checkIn total, 2280 health checks were recorded for trial participants, including 42 from the pilot study;therefore, a total of 2238 health checks were recorded in eligible patients during the entire period of thetrial. There were 1849 health checks within 6 months of the randomisation date, of which 1126 werewithin 3 months of the randomisation date. In total, 388 health checks were completed > 6 months afterthe randomisation date, with the latest being recorded 538 days following randomisation. One healthcheck conducted on the date of randomisation was not considered to result from trial invitation. A total of319 out of 2280 (14%) health checks were recorded with codes indicating that the health check wascompleted by a third-party provider. A Kaplan–Meier plot displaying the cumulative proportion recorded asattending a NHS health check by time since randomisation is shown in Figure 9. There is no apparentdifference between the curves for the two intervention trial arms but evidence of a small increase inuptake between the intervention curves and standard care over time. A reminder letter was sent tonon-responders at 3 months after the first invitation.
Analysis in a time-to-event framework showed that the adjusted hazard ratio between the standardinvitation arm and the QBE questionnaire arm indicated a non-significant relative increase in health check
TABLE 15 Association of case mix variables with health check uptake within 6 months of randomisation (continued )
Characteristic Category
Uptake of health checks at 6 months after randomisation
N n % ORa 95% CI p-valueb
Ethnicity White 4537 501 11 Reference
Black 2457 497 20 2.15 1.86 to 2.49 < 0.001
Asian 680 138 20 2.03 1.63 to 2.67 < 0.001
Mixed 2471 673 27 3.09 2.07 to 4.62 < 0.001
Other 295 38 13 1.28 0.88 to 1.85 0.194
Missing 1755 36 2 0.15 0.07 to 0.34 < 0.001
IMD quintile Most deprived 3663 550 15 Reference
4 6379 993 16 1.08 0.95 to 1.22 0.215
3 1113 193 17 1.15 0.95 to 1.39 0.156
2 41 13 32 2.78 1.87 to 4.12 < 0.001
Missing 856 100 12
a ORs were adjusted for each of the variables shown. Also adjusted for calendar month and clustering by practice(GEE method, robust standard errors) (missing IMD quintile omitted).
b p-value of 0.0167 required for significance for trial arm comparison.
–0.57 to 3.93–3.49 to 4.165.68 to 15.7–3.37 to 4.94
1.680.338.140.78
IMD quintile5432Missing
14.314.218.636.410.9
15.316.316.937.411.1
174/1214309/218368/3654/1135/322
187/1224347/212862/3676/1628/253
–1.7 to 3.91–0.4 to 4.36–7.16 to 3.30
1.112.13–1.93
FIGURE 6 Uptake of health checks within 6 months of randomisation for the standard invitation and QBEquestionnaire trial arms by subgroup.
Category% %
AllGender
14.4 15.8
Standard invitationn/N
590/4095
95% CI(%)
–0.03 to 3.07
Difference(%)
1.52
FemaleMaleMissing
18.111.50
18.613.70
336/1857254/22110/27
–1.87 to 3.100.33 to 4.24
0.62.29
Age group (years)40–5960–74Missing
13.818.70
15.618.50
484/3501106/5670/27
0.04 to 3.40–4.60 to 4.28
1.75–0.02
EthnicityWhiteBlackAsianMixed OtherMissing
10.119.416.825.914.32.3
11.121.818.128.78.42.2
151/1502155/79733/197223/86114/9814/620
QBE questionnaire + incentive
n/N
629/3969
336/1809293/21350/25
531/341498/5300/25
166/1489177/81345248221/7698/9512/555
–0.89 to 3.56–1.24 to 6.58–5.85 to 7.83–1.52 to 6.98
1.342.670.992.73
IMD quintile5432Missing
14.314.218.636.410.9
15.416.316.521.413.2
174/1214309/218368/3654/1135/322
189/1225337/206863/3813/1437/281
–1.55 to 4.070.07 to 4.36–7.28 to 3.12
1.262.21–2.08
–9–1
Difference
98
FIGURE 7 Uptake of health checks within 6 months of randomisation for the standard invitation and QBEquestionnaire with incentive trial arms by subgroup.
DOI: 10.3310/hta20840 HEALTH TECHNOLOGY ASSESSMENT 2016 VOL. 20 NO. 84
attendance across time of 11% [HR 1.11, 95% CI 0.99 to 1.24; p = 0.072); similarly, the adjusted HRbetween the standard invitation arm and the QBE questionnaire with incentive arm was 1.11 (95% CI0.99 to 1.25; p = 0.062).
The intraclass correlation coefficient for the primary outcome by practice was 0.007 (95% CI 0.001 to0.013). Values for each trial arm were as follows: standard invitation 0.003 (95% CI 0.000 to 0.009); QBEquestionnaire 0.005 (95% CI 0.000 to 0.012); and QBE questionnaire and incentive 0.008 (95% CI 0.000to 0.0175). Table 16 presents a comparison of the risk difference estimates obtained using different
–6 –4 –2 0
Difference
12 3456
Category% %
AllGender
15.8 15.8
QBE questionnairen/N
QBE questionnaire + incentive
n/N
630/3988 629/3969
95% CI(%)
–1.59 to 1.57
Difference(%)
–0.01
FemaleMaleMissing
17.914.2
18.613.70
320/1783310/21800/25
336/1809293/21350/25
–1.95 to 3.06–2.73 to 1.35
0.55–0.7
Age group (years)40–5960–74Missing
1521.60
15.618.50
515/3431115/5320/25
531/341498/5300/25
–1.22 to 2.15–7.55 to 1.70
0.46–2.93
EthnicityWhiteBlackAsianMixed OtherMissing
11.719.322.127.016.21.8
11.121.818.128.78.42.2
173/1477159/82254/244218/80616/9910/560
166/1489177/81345248221/7698/9512/555
–2.82 to 1.74–1.67 to 6.10–15.0 to 0.07–2.65 to 6.02
–0.542.22–7.811.69
IMD quintile5432Missing
15.316.316.937.411.1
15.416.316.521.413.2
187/1224347/212862/3676/1628/253
189/1225337/206863/3813/1437281
–2.84 to 2.85–2.04 to 2.365.14 to 4.53
0.010.12–0.3
FIGURE 8 Uptake of health checks within 6 months of invitation for the QBE questionnaire and QBE questionnairewith incentive trial arms by subgroup.
0
0.00
0.05
0.10
0.15
Pro
po
rtio
n
0.20
0.25
50 100 150 200
Time (days)
Standard invitationQBE questionnaireQBE questionnaire +incentive
FIGURE 9 Proportion of participants in each trial arm recorded as attending a NHS health check by time sincefirst invitation.
estimation methods. Estimates obtained using either the GEE approach or a GLM were consistent, whereasuse of robust standard errors yielded narrower CIs and smaller p-values with either estimation method, butthis did not lead to any difference in interpretation.
Health check uptake at 3 months following the invitation was 353 out of 4095 (8.6%) in the standardinvitation arm, 386 out of 3988 (9.7%) in the QBE questionnaire arm and 387 out of 3969 (9.8%) in theQBE questionnaire and incentive arm. Risk differences were 1.04 (95% CI –0.21 to 2.28; p = 0.103) for theQBE questionnaire arm compared with the standard invitation arm and 1.11 (–0.14 to 2.36; p = 0.083) forthe QBE questionnaire and incentive arm compared with the standard invitation arm.
TABLE 16 Comparison of different estimation methods for the primary outcome
Method
QBE questionnaire – standard invitationQBE questionnaire and incentive –
The QBE questionnaire was sent to 3988 participants in the QBE questionnaire arm and 3969 participantsin the QBE questionnaire plus incentive arm. Questionnaire return rates are presented in Table 17. Thequestionnaire return rate was slightly higher, by an adjusted estimate of 1.42% (95% CI –0.4% to 3.26%;p = 0.132), in the arm that included an incentive for completing the questionnaire.
Health check uptake was higher in participants who returned the QBE questionnaire. In the twointervention trial arms (QBE questionnaire and QBE questionnaire and incentive), 32.5% and 32.8% ofparticipants who returned the QBE questionnaire subsequently attended a health check, respectively.A per-protocol analysis estimated an increase in uptake of 17.9% for the QBE questionnaire and 18.3%for the QBE questionnaire and incentive compared with standard care (Table 18).
These estimates may be biased because a minority of randomised participants are included in theintervention trial arms but all participants are included in the control trial arm. To obtain an improvedestimate of the effect of completing and returning the QBE questionnaire, a CACE analysis wasperformed73 (Table 19). This analysis compared the average uptake of participants who returned thequestionnaire in the intervention trial arms with the average uptake in the standard care arm ofparticipants who were expected to return the questionnaire had the QBE questionnaire been sent tothem.73 As there was no loss to follow-up, it was possible to estimate the intervention effect withouttaking into account the missing data mechanism. The CACE analysis estimated the health check uptake to
TABLE 17 Question–behaviour effect questionnaire return rates by trial arm
Questionnaire return
Trial arm
QBE questionnaire QBE questionnaire and incentive
n % n %
Not returned 3071 77.0 2995 75.5
Returned 917 23.0 974 24.5
Total 3988 3969
TABLE 18 Per-protocol analysis: uptake of health checks within 6 months of randomisation by trial arm inparticipants who returned the questionnaire
QBE questionnaire and incentive 974 319 (32.8) 18.3 (15.2 to 21.5) < 0.001
a Adjusted for month and year of randomisation and clustering by practice.b p-value of < 0.0167 required for significance because of multiple comparisons.
DOI: 10.3310/hta20840 HEALTH TECHNOLOGY ASSESSMENT 2016 VOL. 20 NO. 84
be 6.0% greater in the QBE questionnaire arm compared with the standard invitation arm (95% CI 0.8%to 11.3%; p = 0.024) and 5.9% greater in the QBE questionnaire and incentive arm compared with thestandard invitation arm (95% CI 0.8% to 10.9%; p = 0.022) (see Table 19).
Table 20 presents an analysis of variables associated with return of the QBE questionnaire. The offer ofan incentive for questionnaire return did not lead to significantly higher rates of return but there was
TABLE 19 Complier average causal effect analysis: compliers (return of questionnaire) and uptake of health checkswithin 6 months of randomisation by trial arm
Trial armNumber of compliers(%); uptake (%)
Number of non-compliers(%); uptake (%)
Total (%);uptake (%)
Standard invitation NK; NK NK; NK 4095 (100); 14.4
NK, not known.CACE analysis estimated an increase in health checks of 6.0% (95% CI 0.8% to 11.3%; p= 0.024) in the QBEquestionnaire arm compared with standard invitation and 5.9% (95% CI 0.8% to 10.9%; p= 0.022) in the QBEquestionnaire and incentive arm compared with standard invitation.
TABLE 20 Variables associated with questionnaire return
Characteristic
Return of QBE questionnaire
N n % ORa 95% CI p-value
Trial arm QBE questionnaire 3988 917 23.0 Reference
QBE questionnaireand incentive
3969 974 24.5 1.09 0.98 to 1.22 0.105
Gender Female 3592 962 26.8 Reference
Male 4315 915 21.2 0.76 0.69 to 0.85 < 0.001
Missing 50 14 28.0 1.93 1.01 to 3.71 0.047
Age group (years) 40–59 6845 1539 22.5 Reference
60–74 1062 338 31.8 1.56 1.39 to 1.75 < 0.001
Missing 50 14 28.0 –
Ethnicity White 2966 722 24.3 Reference
Black 1635 314 19.2 0.76 0.65 to 0.90 0.001
Asian 472 115 24.4 1.02 0.78 to 1.34 0.890
Mixed 1575 526 33.4 1.54 1.34 to 1.77 < 0.001
Other 194 37 19.1 0.77 0.53 to 1.13 0.181
Missing 1115 177 15.9 0.59 0.44 to 0.78 < 0.001
IMD quintile Most deprived 2449 519 21.2 Reference
demographic variation among questionnaire respondents and non-respondents. Men were significantly lesslikely than women to return the questionnaire. Individuals for whom gender information was missing weresignificantly more likely to return the questionnaire than were women. Compared with white participants,black participants and those for whom ethnic group data were missing were significantly less likely toreturn a questionnaire. In contrast, those whose ethnic group was described as mixed were more likelythan white participants to return the questionnaire. There was an impact of socioeconomic deprivation onquestionnaire return. Individuals living in the middle 20% and second least deprived 20% of areas weremore likely to return a questionnaire than individuals living in the most deprived quintile.
Table 21 presents the mean (SD) questionnaire item responses by trial arm. These responses reveal that,among questionnaire respondents, beliefs about having a health check were largely positive, with noapparent difference between trial arms. Table 22 presents correlation coefficients for inter-itemcorrelations. Correlations between items tapping the same constructs were assessed. The items tapping‘intentions’ (questions 1 and 4) were well correlated and so an ‘intentions’ score for use in further analysiswas constructed from the mean of these two items for each participant. The items tapping ‘anticipatedregret’ (questions 3 and 5) were also correlated and so an ‘anticipated regret’ score was calculated as themean of the scores for these two items. The items tapping ‘attitudes’ (questions 2 and 6) were correlated(r = 0.525) but it was decided to use these as separate scores in the analysis because question 2 reflectsinstrumental attitudes, whereas question 6 reflects affective attitudes. Table 23 presents the correlationsbetween the resulting questionnaire constructs.
TABLE 21 Questionnaire item responses by trial arm
Questionnaire item Construct
Total QBE questionnaireQBE questionnaireand incentive
n Mean SD n Mean SD n Mean SD
Q1. I intend to go for a healthcheck in the next few weeks
Table 24 presents analysis of the variance of the questionnaire constructs by trial arm. There was noevidence that mean questionnaire construct scores differed by trial arm. Therefore, the suggestionthat people in the non-incentivised condition may hold more positive beliefs about health checks isnot supported.
TABLE 22 Correlation of questionnaire itemsa
Questionnaire item Q1 Q2 Q3 Q4 Q5 Q6 Q7
Q1. I intend to go for a health check in the next few weeks –
Q2. For me, going for a health check in the next few weekswould be . . . (very bad to very good)
0.527 –
Q3. If I did not go for a health check in the next fewweeks, I would feel regret
0.468 0.504 –
Q4. Will I go for a health check in the next few weeks? 0.685 0.621 0.536 –
Q5. If I did not go for a health check in the next fewweeks, I would later wish I had
0.502 0.573 0.715 0.600 –
Q6. For me, going for a health check in the next few weekswould be . . . (very worrying to very reassuring)
0.349 0.525 0.397 0.442 0.446 –
Q7. I’m confident I can go for a health check in the nextfew week
0.562 0.575 0.479 0.704 0.537 0.499 –
Q8. People who are important to me would . . . 0.377 0.552 0.437 0.502 0.508 0.415 0.497
Table 25 presents univariate ORs associating questionnaire responses with health check uptake. ORsrepresent the increase in odds of health check uptake per unit increase in score on each questionnaireconstruct. Each of the constructs predicted uptake, with participants with higher intentions, more positiveattitudes, higher levels of PBC, perceiving greater social approval for having a check and anticipating moreregret for not having a check being more likely to have a health check. The largest OR was for the effectof intentions, followed by those for subjective norms, PBC and instrumental attitudes. Anticipating moreregret and affective attitudes were the weakest predictors, but still had significant effects.
In Table 26 questionnaire constructs were dichotomised at the median score, which was 6 for eachconstruct. Odds of health check uptake were contrasted for those with highly positive responses (score of6 or 7) and those with less positive responses (score ≤ 5). For each of the questionnaire constructs,participants expressing positive responses showed a higher uptake of health checks than participantsexpressing negative responses. ORs were greatest for intentions, subjective norms and PBC.
TABLE 26 Association of more positive responses on psychological constructs with health check uptake amongparticipants who returned the QBE questionnaire
Construct Response
Attended health check
p-valuen/N % ORa 95% CI
Intentions More positive response 500/1362 36.7 2.05 1.72 to 2.44 < 0.001
Less positive response 114/516 22.1
Attitude: instrumental More positive response 545/1595 34.2 1.59 1.20 to 2.11 0.001
Less positive response 72/293 24.6
Anticipated regret More positive response 369/1039 35.5 1.33 1.16 to 1.52 < 0.001
Less positive response 244/833 29.3
Attitude: affective More positive response 468/1318 35.5 1.54 1.25 to 1.91 < 0.001
Less positive response 148/563 26.3
PBC More positive response 515/1462 35.2 1.70 1.35 to 2.14 < 0.001
Less positive response 102/421 24.2
Subjective norms More positive response 562/1645 34.2 1.76 1.34 to 2.32 < 0.001
Less positive response 55/242 22.7
a OR associated with positive response, with negative response as reference, adjusted for clustering by general practice.
TABLE 25 Univariate ORs for uptake of health checks per unit increase in each questionnaire construct
Construct ORa 95% CI p-value
Intentions 1.35 1.25 to 1.47 < 0.001
Attitude: instrumental 1.25 1.16 to 1.36 < 0.001
Anticipated regret 1.13 1.08 to 1.19 < 0.001
Attitude: affective 1.17 1.09 to 1.25 < 0.001
PBC 1.26 1.16 to 1.36 < 0.001
Subjective norms 1.26 1.13 to 1.41 < 0.001
a Adjusted for clustering by general practice.
DOI: 10.3310/hta20840 HEALTH TECHNOLOGY ASSESSMENT 2016 VOL. 20 NO. 84
Chapter 5 Results 3: evaluation of automatedallocation at source in the context of a rapid trial
This trial was commissioned as a ‘rapid trial’ with the aim of providing evidence for clinical and policydecision-making within short times cales. This chapter evaluates the extent to which the trial achieved
its design objectives.
A timeline for the major activities of the trial is shown in Table 27. The award letter for the trial was dated1 November 2012 and the contract for the trial was signed off in February 2013. The start date for theproject, when staff came into post, was 1 May 2013. By this time research ethics committee and NHSresearch and development approvals had already been obtained. The first participants were recruited intothe trial on 28 July 2013, 3 months ahead of the intended schedule. Recruitment of general practices tothe study was completed in the first quarter of 2014 and participant recruitment into the trial continueduntil December 2014.
Figure 10 illustrates the predicted and observed recruitment into the trial. Observed recruitment beganearlier than predicted, but was at a slightly slower rate. Recruitment was completed over 18 months ratherthan the 12 months predicted. The recruitment rate could have been increased by drawing more generalpractices into the trial, but we aimed to recruit from all general practices over a 12-month period and thisconsideration influenced our decision to accept only a slightly longer recruitment period. The overall rate ofrecruitment was 702 participants per month over an 18-month period. Subsequent to the completion of
TABLE 27 Timeline for major activities of trial
Activity
2012 2013 2014 2015 2016
Q4 Q1 Q2 Q3 Q4 Q1 Q2 Q3 Q4 Q1 Q2 Q3 Q4 Q1
Award letter
Contract signed off
Research ethics approval
NHS research anddevelopment approval
Staff in post
First participants recruited
Develop automatedallocation
Practice recruitment
Participant recruitment
Participant follow-up for6 months
Data checking
Qualitative interviews
Ascertain primary outcome
Data analysis and reportwriting
Report submission
DOI: 10.3310/hta20840 HEALTH TECHNOLOGY ASSESSMENT 2016 VOL. 20 NO. 84
recruitment, we followed up participants for 6 months to ascertain the primary outcome. We also collecteddata to evaluate the outcome of the health check. Data collection was completed in October 2015. Thefinal report was submitted in January 2016.
The use of electronic health records from primary care for participant recruitment, randomisation andoutcome evaluation contributed to the speed of the study and efficiency of the study design. The studywas methodologically innovative in developing a fully automated technique for recruitment andrandomisation that was embedded into the management information system that was used to manage thehealth check invitations. Table 28 presents a comparison of the strengths and limitations of the fullyautomated and in-practice methods of recruitment and randomisation.
The in-practice system required only limited development work and was ready to be started within3 months of the trial start date. Responsibility for design of the randomisation procedure and the conductof randomisation were retained ‘in-house’ at King’s College London. A full record of randomisation wasretained. However, the in-practice method was labour intensive requiring the study team to conductmonthly visits to practices, with records for trial participants being stored on practice systems for the
12,000
6000
Part
icip
ants
rec
ruit
ed
0
July
August
Septe
mber
October
Novem
ber
Decem
ber July
August
Septe
mber
October
Novem
ber
Decem
ber
Januar
y
Febru
ary
Mar
ch
20142013
AprilM
ayJu
ne
ProjectedObserved
FIGURE 10 Projected and observed recruitment by month from trial start.
TABLE 28 Comparison of in-practice and automated allocation methods
Variable In-practice method Automated method
Time to start Sooner (3 months) Later (7 months)
Randomisation design In-house In-house/third party
Randomisation conduct In-house Third party
Randomisation record Full Partial
Labour intensive Monthly general practice visits over 18 months No requirement for practice visits
Outcome data Extracted at general practice visits Extracted at general practice visits
Missing data Present for 10/178 (6%) practice months 0/72 practice months
Trial outcomes Generally consistent Generally consistent
RESULTS 3: EVALUATION OF AUTOMATED ALLOCATION AT SOURCE IN THE CONTEXT OF A RAPID TRIAL
duration of the trial. As already noted, spreadsheets for 10 practice months were found to be missing atthe time of outcome data collection.
The automated system for recruitment and randomisation required a longer development period as well asa 2-month pilot study. The design of the randomisation was in part determined by the third-party providerand this resulted in the choice to use simple randomisation, stratified by practice and month, ratherthan block randomisation. It was not possible for the research team to fully audit and document therandomisation process. However, records for trial participants were stored centrally at the offices of theprimary care shared services team and records for all participants were successfully retrieved at the end ofthe trial.
An analysis to examine whether practice or method of randomisation had any impact on the primary trialoutcome did not suggest a difference in uptake. Forest plots that display the intervention effect by practiceand randomisation method are presented in Figure 11 for the standard invitation and QBE questionnairetrial arms, Figure 12 for the standard invitation and QBE questionnaire and incentive trial arms and Figure 13for the QBE questionnaire and QBE questionnaire and incentive trial arms. Between-practice variation wasfound to be low. There was no evidence of heterogeneity either between general practices within allocationmethod or between allocation methods.
FIGURE 11 Forest plot displaying the intervention effect (risk difference) by practice and randomisation methodfor the comparison between standard care and the QBE questionnaire. RD, risk difference; W(fixed), weight in thefixed-effects meta-analysis.
DOI: 10.3310/hta20840 HEALTH TECHNOLOGY ASSESSMENT 2016 VOL. 20 NO. 84
FIGURE 12 Forest plot displaying the intervention effect (risk difference) by practice and randomisation methodfor the comparison between standard care and the QBE questionnaire plus incentive. RD, risk difference; W(fixed),weight in the fixed-effects meta-analysis.
FIGURE 13 Forest plot displaying the intervention effect (risk difference) by practice and randomisation methodfor the comparison between the QBE questionnaire and the QBE questionnaire plus incentive. RD, risk difference;W(fixed), weight in the fixed-effects meta-analysis.
RESULTS 3: EVALUATION OF AUTOMATED ALLOCATION AT SOURCE IN THE CONTEXT OF A RAPID TRIAL
Chapter 6 Results 4: cohort study of case mix forinvited and opportunistic NHS health checks
During the trial study period, from 1 July 2013 to 30 June 2015, the total number of NHS health checksrecorded at trial practices, after their start date in the trial, was 6184, including 2280 in trial participants
and 3904 in non-trial participants. We extracted data for cardiovascular risk scores and BMI for participantswith health checks recorded. Cardiovascular risk score data were obtained for 5359 participants, including2246 out of 2280 (99%) trial participants with health checks recorded and 3113 out of 3904 (80%)non-trial participants with health checks recorded. The proportion of health checks in non-trial participantswith a CVD risk score recorded ranged from 33% to 93% at different general practices. These findingssuggest that primary care staff may be less likely to record a CVD risk score when they complete anopportunistic health check. The 3113 cardiovascular risk assessments in non-trial participants [out of5359 participants with cardiovascular risk score data (58%)] either were performed opportunistically orwere carried out in patients invited before their general practice joined the trial. These will be referred to as‘opportunistic health checks’. Among the opportunistic checks were 1363 (44%) that were completedwithin 6 months of the practice start date in the trial, which might potentially have resulted from invitationssent before the practice entered the trial. Sensitivity analyses were performed to evaluate the impact ofpossible misclassification on the results of the study.
To confirm the reliability of these findings, routinely collected monitoring data were obtained from thehealth check management information system employed by the two boroughs. The routine data differfrom trial data because they are reported for follow-up to 31 December 2014 and not to the end of6 months’ follow-up in June 2015, as was completed for the trial.
Table 29 presents routinely collected and trial data for the numbers of participants invited for healthchecks at trial general practices during the study period. There is generally close agreement between themanagement information and trial data, with < 2% discrepancy between the two data sources for11 practices. More substantial differences were observed for two practices (numbers 9 and 15). Reasonsfor these discrepancies were not clear, although management information system data were extracted12 months after the completion of trial recruitment and we have observed previously that data from themanagement information system may show minor changes over time. The mean difference in number ofparticipants identified by the two data sources was 0 (95% CI –34 to 33; p = 0.984). In the context ofroutinely collected health service data, the overall level of agreement between the two sources of data wasconsidered to be good.
Table 30 presents routinely collected data from the management information system for the generalpractices included in the trial. During the period identified, 12,453 patients were recorded as being sent aninvitation for a health check. Among invited patients, 1206 health checks were carried out at generalpractices and 484 health checks were carried out by third-party providers (including pharmacies andoutreach teams), giving a total of 1690 ‘invited’ health checks. Among non-invited patients, 1285 healthchecks were carried out at general practices and 337 were carried out at third-party providers. In themanagement information system data, the term ‘invited’ refers to health checks completed within6 months of an invitation. The 1622 health checks classified as ‘not invited’ accounted for 49.0% of allhealth checks carried out during the reporting period. The proportion of not invited health checks rangedfrom 26.9% to 78.7% at different general practices. These routinely collected data confirm the findingfrom the trial data that a high proportion of health checks are not performed within 6 months of aninvitation issued through the call–recall system. Many of these non-invited health checks may beperformed opportunistically in general practices and pharmacies and through the activities of outreachteams, who are commissioned by the boroughs to conduct checks in high-risk and underserved groups ofthe local population. Health checks by third-party providers accounted for 24.8% (821/3312) of all health
DOI: 10.3310/hta20840 HEALTH TECHNOLOGY ASSESSMENT 2016 VOL. 20 NO. 84
checks in the reporting period. Data were therefore collected to compare case mix and outcomes for trialparticipants who received invited checks and those who received non-invited or opportunistic checks.
Table 31 presents data for the distribution of invited and opportunistic health checks by case mix variablesincluding gender, age group, ethnicity and deprivation quintile. Adjusted ORs were adjusted for eachvariable shown. There was no gender difference in the proportion of opportunistic checks. Opportunisticchecks were more frequent in younger participants, with invited checks being more frequent in the olderage group. There was some evidence for a trend in the distribution of health checks by deprivationquintile, with opportunistic checks being more frequent in the most deprived quintile and invited checksbeing more frequent in less deprived quintiles. However, evaluation of a possible linear trend showed anOR of 0.92 (95% CI 0.82 to 1.03; p = 0.137) for unit decrease in deprivation quintile from most toleast deprived.
Table 32 presents the proportion of checks with a CVD risk score of ≥ 10% by source of health check.Overall, 17.0% of invited health checks and 22.2% of opportunistic health checks were associated with aCVD risk score of ≥ 10%. The relative odds of an elevated CVD risk for opportunistic checks comparedwith invited checks was 1.70 (95% CI 1.45 to 1.99; p < 0.001). Higher proportions with an increased CVDrisk were consistently observed across subgroups of gender, age and ethnicity. In the most deprivedquintile, 15.3% of invited checks and 22.4% of opportunistic checks were associated with an elevated
TABLE 29 Comparison of trial and management information system dataa
Practice Start date End date MonthsInvited(MIS data)
Invited(trial data) Difference
1 1 July 2013 31 December 2014 18 1429 1416 13
2 1 July 2013 31 December 2014 18 738 727 11
3 1 August 2013 31 December 2014 17 1144 1166 –22
4 1 August 2013 31 December 2014 17 696 696 0
5 1 August 2013 31 December 2014 17 1211 1220 –9
6 1 September 2013 31 December 2014 16 403 402 1
7 1 December 2013 31 December 2014 13 723 726 –3
8 1 December 2013 31 December 2014 13 356 377 –21
9 1 December 2013 31 December 2014 13 621 809 –188
10 1 January 2014 31 December 2014 12 524 499 25
11 1 January 2014 31 December 2014 12 374 344 30
12 1 January 2014 31 December 2014 12 160 189 –29
13 1 December 2013 31 December 2014 13 451 504 –53
14 1 December 2013 31 December 2014 13 1156 1096 60
15 1 December 2013 31 December 2014 13 1156 978 178
16 1 February 2014 31 December 2014 11 732 732 0
17 1 February 2014 31 December 2014 11 219 218 1
18 1 February 2014 31 December 2014 11 360 360 0
12,453 12,459 Mean 0(95% CI –34 to 33);p= 0.984
MIS, management information system.a Figures are frequencies except where indicated.
RESULTS 4: COHORT STUDY OF CASE MIX FOR INVITED AND OPPORTUNISTIC NHS HEALTH CHECKS
CVD risk (OR 1.94, 95% CI 1.37 to 2.74; p < 0.001). In the third quintile of deprivation (the highest forwhich estimation was feasible), similar proportions had an elevated CVD risk (OR 1.10, 95% CI 0.80 to1.51; p = 0.572). These results show that opportunistic checks tend to be targeted towards individualswith a higher CVD risk and greater levels of deprivation.
As a sensitivity analysis, we omitted all health checks completed within 6 months of the practice joiningthe study, as these might have been invited in an earlier period. The adjusted OR for a ≥ 10% CVD riskassociated with opportunistic checks was then 1.40 (95% CI 1.14 to 1.73; p = 0.002), based on 3996observations. We evaluated the effect of omitting health checks in invited participants that werecompleted > 6 months after the invitation, as these might have been opportunistic checks. The adjustedOR was then 1.65 (95% CI 1.40 to 1.94; p < 0.001), based on 4983 observations. We conclude that thereported association is robust to varying the case definition for an opportunistic check. We also evaluatedwhether or not lower ascertainment of risk scores for opportunistic health checks might have influencedthe findings. At nine practices where a CVD risk score was obtained for > 85% of opportunistic healthchecks, the OR was 1.77 (95% CI 1.45 to 2.16; p < 0.001); at nine practices where a CVD risk score wasobtained for ≤ 85% of opportunistic health checks the OR was 1.70 (95% CI 1.45 to 1.99; p < 0.001).This finding does not suggest that the results could be explained by differential underascertainment ofCVD risk scores.
Table 33 presents equivalent data for the proportions of participants with a ≥ 20% CVD risk score.Overall, 5.0% of invited checks and 6.3% of opportunistic checks were associated with a ≥ 20% CVD risk.The OR was 1.46 (95% CI 1.12 to 1.91; p = 0.005). ORs were generally consistent across subgroups butpower was necessarily lower because of the smaller numbers of individuals with a higher CVD risk score.
TABLE 31 Distribution of invited and opportunistic checks by gender, age group, ethnicity and deprivation
Characteristic
Invited healthchecks
Opportunistic healthchecks
OR (95% CI)a p-valuen % n %
All 2246 42 3113 58
Gender Female 1210 42 1671 58 –
Male 1036 42 1442 58 1.01 (0.90 to 1.14) 0.868
Age group (years) 40–59 1880 41 2703 59 –
60–74 366 47 410 53 0.82 (0.67 to 1.00) 0.050
Ethnicity White 533 40 803 60 –
Black 551 39 875 61 1.03 (0.90 to 1.18) 0.642
Asian 143 40 217 60 1.00 (0.84 to 1.18) 0.994
Mixed 789 45 953 55 0.82 (0.68 to 0.98) 0.030
Other 59 46 70 54 0.77 (0.52 to 1.13) 0.182
Missing 171 47 195 53 0.77 (0.47 to 1.25) 0.287
IMD quintile Most deprived 695 40 1028 60 –
4 1197 42 1646 58 0.96 (0.82 to 1.12) 0.582
3 235 45 290 55 0.89 (0.67 to 1.19) 0.420
2 15 88 2 12 0.10 (0.04 to 0.26) < 0.001
Missing 104 41 147 59 0.96 (0.78 to 1.17) 0.666
a ORs were adjusted for each of the variables shown.
RESULTS 4: COHORT STUDY OF CASE MIX FOR INVITED AND OPPORTUNISTIC NHS HEALTH CHECKS
Table 34 presents the proportions of participants who were overweight or obese by source of healthcheck. Overall, 55.7% of participants receiving invited checks and 58.8% of participants receivingopportunistic checks were identified as being overweight or obese (OR 1.15, 1.04 to 1.28; p = 0.008).This distinction was greater for women, with 52.8% of women receiving invited checks and 58.0% ofwomen receiving opportunistic checks, being overweight or obese (OR 1.25, 1.07 to 1.47; p = 0.005).Higher proportions with overweight and obesity also tended to be observed among younger participantsand white participants who received opportunistic health checks. There were 189 health checks withmissing values for BMI but associations were similar if missing values were either omitted or combinedwith the normal weight category for reference.
TABLE 33 Proportions with a CVD risk score of ≥ 20% by source of health check (continued )
Characteristic
Invited healthchecks
Opportunistichealth checks Relative odds of 20%
CVD risk if check isopportunistic (95% CI)a p-valuen N % n N %
IMD quintile Most deprived 30 695 4.3 72 1028 7.0 1.99 (1.18 to 3.38) 0.010
a 189 participants (66 invited; 123 opportunistic) had missing BMI values and were excluded from estimation of the ORs.b ORs were adjusted for each of the variables shown.
RESULTS 4: COHORT STUDY OF CASE MIX FOR INVITED AND OPPORTUNISTIC NHS HEALTH CHECKS
Chapter 7 Results 5: process evaluation andqualitative study
A longside the RCT, we undertook evaluations of processes that might have an impact on the outcome ofthe trial. Such evaluations are useful to assess the fidelity and quality of implementation, clarify causal
mechanisms and identify contextual factors associated with variation in outcomes.74 This may provide insightsto aid implementation of an intervention or suggest how an intervention might be refined for better effect.
We did not need to assess the fidelity of our intervention as this was a written intervention and was in thesame format and delivered in the same way to each participant randomised to receive it. We examinedattitudes of practice staff and programme leads engaged in delivering the health check in case these influencedimplementation of our intervention in any way. Free-text responses by participants at the end of thequestionnaire (intervention) were also analysed to assess participant views towards either receiving ourintervention or the health check itself. Finally, an in-depth qualitative interview study of individuals invited toreceive a health check was conducted in the same boroughs as the trial, exploring influences on uptake of thehealth check that might help to explain participant behaviour in relation to our intervention to promote uptake.
There were therefore three aspects to our evaluation of process, which were analysed qualitatively:
1. qualitative interview study with general practice staff2. content analysis of trial participant responses to an open-ended question3. qualitative interview study with general practice patients.
Interviews with general practice staff
Twenty-two general practice staff from 17 general practices and two public health leads responsible forimplementing health checks in Lambeth and Lewisham were interviewed. Participants included practicemanagers (52%), nurses/health-care assistants (9%), administrators (30%) and public health leads (9%).Twenty interviews were recorded and transcribed and handwritten notes were made during two interviewsand included in the analysis. Responses were categorised according to three main themes: attitudes towardshealth checks; attitudes towards service delivery of the health checks; and attitudes towards the RCT.
Attitudes towards health checksIn general, staff expressed the view that health checks were beneficial but that the programme did havestrengths and weaknesses:
It’s a good way to try and prevent illness and long term or serious conditions developing in the future.P9 practice manager
I think it’s good that we have a health check programme in place and we’re all for supporting that.Healthier people mean less people queuing up in the hospitals.
P11 practice manager
Specific benefits that were highlighted included optimism that informing people of their risk might lead topositive behaviour change:
They can help people to improve their health and understand risks of disease and lifestyle. Patients canunderstand their risks and the way it influences their health. It’s good for the practice as potentialhealth issues can be detected early and prevention of these can begin.
P3 nurse
DOI: 10.3310/hta20840 HEALTH TECHNOLOGY ASSESSMENT 2016 VOL. 20 NO. 84
Patients will come in for them so that’s good as they get an extra check. Main benefit of them seemsto be that people will be made aware of how they are at risk and change what they are eating etc.
P2 administrator
Reservations about the programme included doubts about the long-term benefits of conducting healthchecks and about the costs of implementation, including staff resources:
The Health Check programme seems like a good idea. Not really sure about how good they will be inthe long term, it might just be one of those things that people forget about . . . Health checks aregood to get people thinking about their health but whether or not they do anything about this isanother issue. I’m not convinced they will result in behaviour change or health improvement – theyjust tell you what you already know, which is that you’re not healthy.
P1 administrator
I think the theory behind the programme is very laudable, but in terms of the amount of resource ittake up within a general practice, and what it picks up, it doesn’t seem to be what I would considersort of value for money.
P10 practice manager
It’s very time-consuming. It’s lengthy to deliver sometimes and a lot of the people that come for ithave got an actual problem that they want to discuss.
P17 nurse
Attitudes towards service delivery of the health checksWhen asked more specifically about the implementation of the health checks in their practices many stafffelt that it worked well, with clear communication channels among the staff who were involved in thedelivery of the health checks:
Yes patients ring in, the health checks are done by a nurse. There are three of us. We work alternateshifts. So there’s a nurse here eight ‘til eight, Mondays to Fridays. And they can see any nurse, anyday, any time for anything. But there’s not a specific clinic.
P17 health-care assistant
The patients are seen by a nurse. And we issue blood forms for patients. And once they’ve had theirblood tests, we ask them to then come in to book an appointment with the nurse. It is usually alonger appointment, a 30-minute appointment that’s booked with the nurse for them to go throughall the tests and all the check-ups. And all the staff in reception of how to book the health check, alsowhether the patient needs to have the blood test beforehand. And that is what we’ve done. The arechecked and if any patient is not eligible for whatever reason, it is then marked as such and the listsare returned.
P13 practice manager
Problems identified by some staff included concerns that uptake was low in their particular practice andthat sometimes when patients are referred for blood tests they fail to have these carried out so the healthcheck is not completed:
Not working well in the practice – more checks being done by third parties . . . we [practice] need toidentify ways of being more proactive.
P8 practice manager
Well you send them to [hospital A] to get their bloods done and they don’t come back.P8 practice manager
RESULTS 5: PROCESS EVALUATION AND QUALITATIVE STUDY
All general practices appeared to offer health checks opportunistically, that is, to patients attending thepractice for another, unrelated reason rather than them being invited through the HealthCheck programme:
Patients can ring up and book one, they don’t have to have invitation letter, or might have one ifseeing GP about something else or joining the practice.
P2 health check administrator
Yes, we encourage as many people to have one as possible. We checked that we were able to do thisand got permission from the Lambeth team and we can get paid for each one we do whether theywere invited or not.
P4 health check administrator
Routinely when patients register and they are between 40–74 we will then invite them in ourselvesand also opportunistically when patients come up to the desk they will be asked verbally to have ahealth check.
P3 practice manager
Yes a lot of opportunistic invites as the patients come into the practice also by doctors and we haveposters in the surgery.
P3 practice manager
A large proportion of people receiving the health check may therefore not be those who receive a writteninvitation to receive one. As well as receiving a health check opportunistically at their general practice,individuals may obtain checks at local pharmacies and community events, through outreach teams,without having to wait to be invited through the Health Check programme. Information from the healthcheck in these cases is sent through to the relevant general practice, where it is added to the database andcoded as a completed health check:
All coded relevantly as NHS health check completed by pharmacist or community-based nurse oranything like that, of if it’s done on site, obviously we have our own relevant code. Yes it’s codedaccordingly . . . Yes, we get them same, through the software, the QMS practice software, we getconfirmations of ‘completed health checks’ coming through, which we process and obviously note allthe information down on the patient’s file.
P15 health check administrator
Attitudes towards the randomised controlled trialThe general practices were, for the most part, unaware of and unaffected by the process of running ourRCT. Identification and randomisation of eligible participants was mostly conducted automatically andremotely from the practices. Those practices assigned to the in-practice method, whereby trial staffrequired access to general practice computers and software, reported a few problems with accessing therelevant list of patients eligible for a health check but this did not appear to be a major barrier to thesmooth running of the trial:
The trial was easy to run but difficult to check the PNL.P3 practice nurse
There was no challenge at all running study at practice. Just making sure the staff member who dealswith health checks was in office.
P1 administrator
It was good for the practice to have a trial running here.P2 administrator
DOI: 10.3310/hta20840 HEALTH TECHNOLOGY ASSESSMENT 2016 VOL. 20 NO. 84
Staff did not report the impression that uptake had increased during the trial study period:
So I wouldn’t assume that we’ve had a lot of uptake from even what you’ve done, to be honest.P12 practice manager
ConclusionsAlthough health-care staff appeared broadly to support the idea of a Health Check programme, they didexpress reservations about how effective it was likely to be. Their reservations were mainly centred onthe uptake of the health check and about the likelihood of individuals responding to information abouttheir cardiovascular risk in a meaningful way, that is, by changing their behaviour and adopting ahealthier lifestyle.
It is interesting to note that many of the health checks are conducted opportunistically and not justdelivered to individuals who have received a written invitation to receive one. Health checks deliveredopportunistically are added to the overall figures for uptake in the programme. Our trial targeted onlypeople receiving the written invitation for a health check, which may be a small proportion of the totalnumber actually completing the health check.
Despite the ambivalence of some general practice staff about the Health Check programme, it is unlikelythat this affected the smooth running of our trial. Most of the participants were identified and randomisedremotely and practices included in the ‘manual’ method did not report many problems with this, nor didtrial researchers report significant barriers to obtaining the information and support that they needed tocomplete the randomisation procedures at these practices.
Content analysis of participant responses
The total number of participants returning the QBE questionnaire was 1956 across the two interventiontrial arms. Of those returning a questionnaire, 648 (33%) had made comments in the free-text box. It waspossible to categorise comments according to whether they related to the health check itself or to the QBEintervention. There were also some miscellaneous responses that did not fit these two themes.
Views about the health checkParticipants expressed their views about the health check. In general, health checks were viewed positivelyand the preventative aspect of the health check was appreciated:
1. I would like an annual health check. I think they are a very good idea and would probably becost-effective in helping people to live healthier lives.
2. This is very important because this will help early detection and treatment of an illness orconditions. I’m very pleased with this, thanks.
Some respondents expressed more negative views about the health check, querying the value for moneyof conducting them. Despite returning a questionnaire to the research team such individuals may have feltambivalent about attending for their health check:
1. The government is wasting its money on public health programmes when it is the arrogant,incompetent compassionless behaviour of NHS employees at every level that deters people fromlistening or bothering to go.
2. Waste of money the NHS needs for other things.
RESULTS 5: PROCESS EVALUATION AND QUALITATIVE STUDY
Others appreciated the value of a health check and may have expressed the intention to have one but maynot have attended because they anticipated that it would be difficult to obtain an appointment at anappropriate time:
1. I’m 100% supportive of health checks but have two small children and not much support sodepends on childcare arrangements. Will make every effort to attend.
2. Just starting a new job so as much as I would like to, it could be dependent on timing/availability.
3. I have been unable to get an appointment with the GP of my choice, since the end of Septemberand he is not available until the New Year.
A few concerns were expressed about the consequences of having the health check and the implicationsfor their health:
1. After having a health check waiting for your result is worrying.
2. I am looking forward to it. Hopefully I will be healthy. I am very worried.
A lack of awareness of the Health Check programme was apparent and receiving our questionnaire aheadof the invitation to attend raised some queries about what the health check might involve:
1. Are they free? How do you go about getting a health check?
2. I could answer this [questionnaire] more accurately if I knew more detail about the health check,e.g. does it include a mammogram?
The invitation letter would have arrived within days of the questionnaire, with comprehensive informationabout the health check, but these comments raise the question of whether or not it might be beneficial toimprove general knowledge about cardiovascular health checks and what they entail ahead of invitingpeople to attend for one.
Views about the question–behaviour effect intervention (questionnaire)Participants commented on the content and style of the questionnaire. Although these participants clearlyreturned their questionnaires, it is possible that the issues they raise affected other potential participantswho failed to complete or post their questionnaires back to us. It is also possible that comments reflectpolarised views not held by non-respondents; perhaps only those who felt strongly in either direction weremotivated to return the questionnaire:
1. This is the most absurd questionnaire I have completed in some time.
2. I can’t tell you anything except that this is a bizarre form and would certainly put me off going.
3. Feel it is patronising and if I didn’t have some intelligence to make a decision I would be more thanlikely put off from going.
4. Questionnaire is poorly written and in my case completely irrelevant.
There was a suggestion that the questionnaire items may not have been understood as intended:
1. I’m curious about your research methodology, one question about TV but nothing about whetherthe distance/ease of transport/opening hours affect decision making, particularly as these are keyfor me.
DOI: 10.3310/hta20840 HEALTH TECHNOLOGY ASSESSMENT 2016 VOL. 20 NO. 84
2. The questionnaire is rather repetitive and question 5 is slightly misleading, you should take out thedots! It depends on whether you offer reasonable appointments outside working hours for thosewho work (i.e. the majority in London).
Although the intervention had been developed and tested for acceptability within the target populationahead of the trial, these comments suggest that the questionnaire may have benefited from furtherrefinement. Some participants may have felt that the questionnaire did not let them express their full rangeof views about health checks. This is a challenge for QBE interventions which attempt to address salientbeliefs that will promote the behaviour of interest.
ConclusionsAlthough only one-third of the participants who returned the questionnaire responded with comments inthe free-text box, these participants raised some interesting issues in relation to attendance for a healthcheck. These included the views of some individuals that such checks should not be a priority in anoverstretched NHS and do not represent good value for money. Even among those who felt that healthchecks were positive and beneficial there was a perception that having a health check at a time that wasconvenient would be a challenge or just arranging the appointment to have one might be difficult. It ispossible that our intervention lacked the potency to overcome these particular barriers to attendance.It is clear that some participants in the trial expressed the intention to attend for a health check but thenfailed to do so, suggesting that some changes in the system of delivering the checks may be needed toovercome the intention–behaviour gap in these cases.
Our intervention was modified from a QBE questionnaire developed for use in a study conducted outsideLondon. Although we tested and simplified our version of the intervention with the target population forour trial and obtained feedback from relevant health professionals and service providers, the questionnairemay have benefited from further piloting for use with the population in south-east London. It is unclearwhether further refinement might have improved the response rate to the questionnaire or impacted onattendance for the health check.
Participants were generally unaware of the Health Check programme and did not appreciate that it isdesigned specifically to assess the risk of CVD. Only three of those interviewed reported having heard ofhealth checks prior to being invited; two had seen a promotional poster and one participant’s spouse hadalready been invited.
RESULTS 5: PROCESS EVALUATION AND QUALITATIVE STUDY
Lack of awareness emerged as a general theme across both those who accepted and those who declinedto have a health check. It may be that a lack of clarity and understanding of what the health checkinvolved had discouraged attendance. People may need more specific information about what is involvedin a health check to inform their decision-making about attendance.
It appeared that the decision to take up the offer of a health check or not was influenced to some extentby perceived personal risk of CVD. There was evidence that a family history of stroke or heart attackaffected personal risk perceptions; attendance might be encouraged in those with a family history anddiscouraged in those without:
family history is obviously, you know, a huge determinant of various things. OK not completelyconclusive, but you know, law of averages, I thought I’m probably OK. So it just slipped and then Inever took up on it.
ID22, female aged 62 years, did not attend30
It was not always clear to those invited why they had been selected to receive a health check when theyfelt well and enjoyed a healthy lifestyle:
if it’s something that I need to do and something I need to be aware of [I’d do it] but unless you’rereally dying or feeling unwell, you’re not really going to bother with it,
ID25, female aged 57 years, did not attend30
Individuals expressed a need to understand why they had been selected for assessment when they werecurrently feeling well or perceived themselves as living a healthy lifestyle.
A sense of duty, not only to friends and family but also to the health-care system, encouraged attendancein some cases, as did taking advantage of a free service when it is offered:
I wasn’t sure with cuts to funding whether or not this is the sort of thing that will be continuing in thefuture. So the thought was to make the most of it as soon as possible, I might not have theopportunity or I’ll have to pay for it going forward.
ID14, male aged 40 years, attended30
Conversely, others felt that they should not burden the doctor or NHS unnecessarily by diverting time andresources away from people who were actually unwell:
I mean there’s no point in doing that if it’s, you know, using up people’s precious time and resourcesif it’s not necessary.
ID23, female aged 56 years, did not attend30
The data illustrated a complex relationship between individuals and the NHS health-care system. In particular,some people seemed to express a sense of personal responsibility towards making the best use of NHSresources. This led to them questioning whether or not undergoing a cardiovascular risk assessment wasjustifiable in their case, particularly if they were not currently experiencing symptoms.
Obtaining an appointment for a health check at a convenient time was reported as an obstacle toattendance for some of those who worked normal office hours or whose income was directly proportionalto hours worked:
It’s very difficult for me to [go to the appointment] and hold on to a nine-to-five job. It means I haveto take personal time off from my employer to do this. They don’t give you an option where you cango in the evening. I would have to take it off as annual leave, and do it in my own personal time.
ID25, female aged 57 years, did not attend30
DOI: 10.3310/hta20840 HEALTH TECHNOLOGY ASSESSMENT 2016 VOL. 20 NO. 84
Those who reported few practical problems in attending for a health check tended to live within walkingdistance to their general practice and were more likely to be retired or employed in part-time work.
Some individuals who did have their health check nevertheless reported initial difficulties obtaining anappointment at their general practice, which was discouraging:
I remember ringing the surgery and the receptionist said ‘There is a tremendous waiting list for this’.She said ‘I’ll tell the nurse’ and I never heard anything. Then when I got the next [reminder] letter Irang up and they did give me an appointment.
ID 11, female aged 66 years, attended30
Non-attendance was also sometimes linked to a belief that it might be better not to know that one mighthave an undiagnosed condition or be at risk of developing one. Furthermore, people who suspect thattheir risk could be high might avoid having this confirmed with a health check, particularly if they wouldalso receive unwelcome lifestyle change advice:
I didn’t want to find out I had more medical problems, I have epilepsy. And I don’t need a doctor totell me I need to stop smoking and lose weight.
ID01, male aged 46 years, did not attend30
Does it actually help you to have knowledge, or not? That’s kind of an interesting thing, isn’t it,because it can just make you more anxious and the thing about health checks is its sort of fine ifeverything is fine. And if it’s not fine, are people prepared enough for what they might feel?
ID23, female aged 56 years, did not attend30
ConclusionsThe findings from the patient interview study suggest that there are a number of factors that mayaffect uptake of a cardiovascular risk check. Many of the findings resonate with the comments of ourtrial participants in the free-text responses to the questionnaire. For example, those who were workingfull-time may have expressed the intention to attend but then found that it was not possible to arrangea convenient appointment time. The findings also suggest that some people found it difficult toarrange an appointment at their general practice or that no-one got back to them after they requestedan appointment. Again, these individuals may have held positive attitudes towards having a health checkand fully intended to have one, but then found it challenging to fit into their busy lives.
RESULTS 5: PROCESS EVALUATION AND QUALITATIVE STUDY
This chapter summarises the main findings from this research, makes comparisons with other studies,discusses the limitations of the research and finally makes recommendations for future research.
The main lessons learned from this research are summarised in Box 1.
BOX 1 Main findings from this research
Trial results
l Trial data revealed a low uptake of health checks in response to the standard invitation letter of 15% in the
first 6 months following invitation.l Uptake of health checks following a standard invitation letter was associated with greater age, female
gender, lower levels of deprivation and non-white ethnicity.l There was no evidence that an invitation method employing the QBE was associated with a useful increase
in the uptake of health checks.l There was no evidence that the offer of a financial incentive was associated with an increased response to
the QBE questionnaire.l Effects were generally consistent across subgroups of gender, ethnicity and deprivation quintile but there
was weak evidence of a greater effect in men than in women.
Question–behaviour effect questionnaire responses
l Participants who returned the QBE questionnaire were substantially more likely to attend for a
health check.l Participants with highly positive responses to the QBE questionnaire items were more likely to attend for a
health check than those with less positive responses.l These findings suggest that, in the subgroup of participants who responded to the QBE questionnaire,
uptake of health checks was predicted by psychological constructs represented in the questionnaire.
Rapid trial using an automated randomisation procedure
l This was a rapid trial. Participant recruitment was initiated within 3 months of the study start. Data
collection, with 6 months’ follow-up of > 12,000 participants, was completed within 2.5 years of the
study start.l The trial demonstrated the feasibility of an automated randomisation procedure programmed into health
service programme management software, which enabled randomisation of 100% of eligible participants
over a 1-year period.
Invited and opportunistic health checks
l Qualitative interviews with general practice staff confirmed that trial general practices were active in
offering opportunistic health checks.l During the study period, nearly 6 out of 10 health checks were completed either > 6 months after the
invitation or in participants who did not receive invitations through the population-based call–recall system.
These are referred to as ‘opportunistic health checks’.l Opportunistic health checks showed a similar distribution to invited health checks with respect to gender,
age group and ethnicity but were associated with greater deprivation.l Health checks conducted opportunistically were more likely to reveal elevated cardiovascular risk scores or
overweight and obesity than health checks conducted following a standard invitation.
DOI: 10.3310/hta20840 HEALTH TECHNOLOGY ASSESSMENT 2016 VOL. 20 NO. 84
Invitation methods for health checks and thequestion–behaviour effect
The primary objective of the study was to evaluate the effectiveness of an enhanced invitation method,based on the QBE, with or without the offer of a financial incentive to return the QBE questionnaire, atincreasing the uptake of health checks.65 The research provided no evidence that an invitation methodbased on the QBE could be associated with an increase in health check uptake that could be of clinical orpublic health importance. There was weak evidence, which did not reach the prespecified level ofstatistical significance, of a small increase in uptake, which amounted to < 2%. There was also weakevidence that this effect might be greater in men than in women but effects were otherwise similar acrosssubgroups of age, ethnicity and deprivation. There was no evidence that the offer of a financial incentiveto return the QBE questionnaire might increase the level of response to this invitation method.
Health check uptake was higher among individuals who returned the QBE questionnaire. The CACEanalysis provided an intervention effect estimate for comparable groups, finding an approximate 6%increase in uptake among those who returned the questionnaire. Positive responses to the QBEquestionnaire items were associated with greater uptake of the offer of a health check, with the strongestassociation being observed for the ‘intentions’ construct. The association of health check uptake with QBEquestionnaire return might be explained in several different ways. This might be interpreted as evidenceof the QBE at work, with stronger evidence of an effect among those who responded to the QBEintervention. A second alternative is that return of the QBE questionnaire, and attendance for a healthcheck, are both predicted by similar underlying psychological factors. These might include, for example,attaching high importance to health. A third explanation could be that questionnaire returners and healthcheck attendees share certain demographic characteristics that might make these behaviours easier toperform. The similarity of demographic factors predicting both health check uptake and questionnairereturn, including older age and lower levels of deprivation, might lend support to these secondtwo explanations.
How do the results compare with those of other studies of thequestion–behaviour effect?
This trial did not provide evidence that the QBE could make a contribution to increasing health checkuptake. This is in contrast to earlier study findings regarding the positive impact of the QBE on healthcheck uptake.44 The previous study used a longer questionnaire. It is possible that the reduction in thenumber of items or slight changes in the constructs tapped could explain the difference in effects.However, a recent systematic review did not find that the number of questionnaire items affected themagnitude of the observed QBE.50 The earlier study on health check uptake was conducted > 20 years
Qualitative analysis findings
l General practice staff endorsed the concept of preventative medical intervention but expressed concerns
regarding the opportunity costs of conducting health checks and their possible lack of effectiveness in
promoting behaviour change.l Patient interviews and free-text questionnaire responses revealed a lack of public understanding of the
Health Check programme. Patients often welcomed the idea of a health check but were concerned about
burdening services when they were well. They also experienced difficulty gaining access to appointments at
times that were convenient to them.
BOX 1 Main findings from this research (continued)
ago.44 Changes in pressures and resource constraints on general practice may have made it more difficultfor participants in the present study to act on their invitation to have a health check. The present studyalso sampled participants from a wider range of socioeconomic and ethnic backgrounds, which may havealso led to the difference in findings.
This is one of the largest trials conducted using the QBE and the results add to the weight of evidenceagainst a quantitatively important impact of an intervention based on the QBE.50,51 A recent trial of theimpact of the QBE on colorectal cancer screening uptake46 also found no benefit of the intervention.Indeed, the effect of QBE interventions on uptake in our trial (OR 1.12/1.13) was highly consistent with theeffect of the QBE on screening uptake reported in a recent review of the effects of the QBE on healthbehaviours51 (d = 0.06 can be converted to an OR of 1.1175). In contrast, a recent review that focusedsolely on the effects of asking intention or self-prediction questions to invoke the QBE found a largeroverall pooled effect size.50 This review included studies from both field and laboratory settings and awider range of behaviours, rather than being restricted to studies focusing on health behaviours.
A number of trials of the QBE have been found to have a considerable risk of bias.51 Although one reviewfound no evidence that risk of bias significantly moderated the observed effects of the QBE on healthbehaviours,51 an ongoing review suggests that, when tests of the QBE are restricted to those with a lowerrisk of bias, the size of the observed effect is diminished.76
The nature of the question–behaviour effect intervention usedin this trial
Question–behaviour effect interventions have used a wide variety of questionnaire items50,51 and it isreasonable to question whether or not the questionnaire used in this trial shared the features of thoseused in the most effective QBE interventions. The trial QBE intervention was developed before the recentpublication of two systematic reviews of the effects of the QBE. One of these reviews50 suggested that twoaspects of our questionnaire, including anticipated regret questions and having a mixture of intention andself-prediction questions instead of just self-prediction questions, may have been associated with smallereffects on behaviour. A future study could evaluate the effects of a redesigned questionnaire, focusingon self-prediction items and omitting anticipated regret, on health check uptake.
The primary purpose of this study was not to test the psychological predictors of health check uptake.The questionnaire functioned as an intervention, increasing the accessibility of certain beliefs amongquestionnaire completers and so making them more likely to act on a health check invitation.The questionnaire was not intended to provide exhaustive measurement of TPB constructs and anticipatedregret in relation to health check uptake. There is no evidence that the QBE requires the questionnaireemployed to be reliable and valid. A recent meta-analysis did not find that the number of questionnaireitems employed significantly moderated the magnitude of the QBE.50 The review also noted that the vastmajority of studies focused on measuring intention and self-prediction, so our measurement approach isconsistent with extant QBE literature. The questionnaire leaflet as a whole had a Flesch reading ease score of80.1 and a Flesch–Kincaid grade level of 5.9. This means that it is accessible to people with the readingability of an 11-year-old. It is possible that the reduction in the number of items or a slight change in theways that constructs were tapped could be explanations for the different effects in this study compared withthose in previous studies. However, we find the alternative explanations for the differences in our findings,namely changes in pressures on general practice over the intervening 20-year period and the widersociodemographic range of our participants, more plausible.
The free-text responses on a small proportion of returned questionnaires suggested that some participantsfelt that the questionnaire did not tap all of their key views on health check uptake, with participantsparticularly noting that there were no items asking about various barriers to health checks, such as
DOI: 10.3310/hta20840 HEALTH TECHNOLOGY ASSESSMENT 2016 VOL. 20 NO. 84
appointment availability and timing. The attitude accessibility account of the QBE argues for omitting suchitems, as they would make perceived barriers to having a check more salient, thus being likely to deteruptake when invitation letters were received. This is at odds with the QBE questionnaire being distributedunder the guise of an attempt to explore invitees’ views about health checks.
Previous studies and the present results suggest that the QBE best increases behaviour in participants witha positive reaction to the behaviour. Among questionnaire respondents, views about health checks werelargely positive but only a small proportion of study participants returned the questionnaire. Questionnairenon-respondents may have had less positive views about health checks. Combining the QBE with amotivational intervention to increase positive intentions and attitudes might better support health checkuptake.77 One recent systematic review50 also revealed several factors associated with smaller effects of theQBE that may be less amenable to change in the context of promoting health check uptake. In particular,field studies were associated with smaller effects than laboratory studies and the effect was attenuatedwhen there was a longer interval between the questionnaire and the opportunity to perform the behaviourand the behaviour was more difficult. The qualitative analyses suggest that having a health check mayhave been regarded as difficult by a notable proportion of participants.
How did offering a financial incentive affect the impact of thequestion–behaviour effect intervention?
This study was predicated on the idea that patients would be more likely to return a questionnaire if theyare given a financial incentive, as there is considerable evidence to support the positive, although modest,effects of incentivising postal questionnaire return.55 Return of the questionnaire was expected to beassociated with improved health check uptake, as a previous trial44 found that the magnitude of the QBE isgreatest in participants who complete the questionnaire. By incentivising questionnaire return, thehypothesis was that those in the incentive arm would have an even greater health check uptake rate thanthose receiving the questionnaire alone. The research showed that a financial incentive was not effective atincreasing questionnaire return in this area as a means to potentially increase the QBE. There wereconcerns that, in certain circumstances, a higher questionnaire return rate would not necessarily lead togreater health check uptake in incentive arm participants. First, the magnitude of the QBE is largest forindividuals with positive beliefs about the behaviour in question. If the incentive led to more participantswith negative views about health checks completing the questionnaire than in the non-incentivised QBEarm, then the increased return rate may not be associated with increased health check uptake. A furtheralternative is that any cognitive dissonance effect of completing a questionnaire is undermined by anincentive. Participants might attribute the fact that they filled in the questionnaire to the incentive andtherefore not experience any dissonance if they fail to have a health check, even though they said thatthey would do so in the questionnaire.
This trial showed that offering a conditional financial incentive for participants to complete a questionnairemade no difference to the rate of questionnaire return or the likelihood of patients taking part in theHealth Check programme. There was no evidence that the incentive differentially affected response ratesfor participants with different levels of socioeconomic deprivation. The lack of effect of the incentive onhealth check uptake was consistent across subgroups of age, gender, ethnicity and deprivation. Therandomised design, large sample size and the fact that the study took place in a natural setting all lendthemselves to supporting the strength of these findings. There was no evidence that the offer of afinancial incentive encouraged individuals who had less positive beliefs about health checks to completeand return the questionnaire. However, given that the provision of the incentive did not lead to a higherrate of questionnaire return, this finding must be interpreted with caution.
The present trial found no evidence that offering incentives enhanced the magnitude of the QBE effecton health check uptake. There was no evidence that response to the incentive, in terms of eitherquestionnaire return or health check uptake, was moderated by socioeconomic deprivation. Because the
offer of an incentive in the present study failed to increase questionnaire return rates, it is not possibleto ascertain whether or not a greater response rate in the incentive arm was associated with less positivebeliefs about health checks. The finding of no effect of an incentive on questionnaire return contrastswith the results of a recent trial of the QBE’s effects on FOBT uptake (Professor Mark Conner, personalcommunication), in which a financial incentive and a Post-it® note (Post-it® Brand, 3M United KingdomPLC, Bracknell, UK) thank you message increased questionnaire return rates in an older population thanwas studied here. However, the incentive and thank you message did not lead to increased rates of thebehaviour. Both of these findings contrast with those of a systematic review,50 which found a larger QBEeffect in studies in which participants were incentivised. Participant incentives were more likely to beoffered in laboratory studies with immediate measurement of the behaviour, both study features that werealso associated with larger QBE effects. It was not possible to disentangle the effects of these three factors.
There are a number of possible explanations for the lack of effect of the incentive on questionnaire returnin the trial. These relate to the nature of the incentive, participant motivation and research project-relatedfactors. The incentive was offered conditional on questionnaire return. However, larger benefits ofincentives with regard to response rates in postal surveys have been found for unconditional incentives,that is, when the incentive is provided at the time that the survey is sent to participants rather than on itsreturn. However, unconditional incentives may not be feasible when targeting large groups of patients,such as in the Health Check programme, and may not be deemed acceptable by either patients orcommissioners. It is possible that the value of the incentive offered, £5, was not considered sufficientlymotivating to increase questionnaire return and a higher-value incentive might have been effective.However, this value is identical to the incentive offered in the trial of the QBE on FOBT uptake, whichfound that the incentive enhanced response rates (Professor Mark Conner, personal communication).A further possibility is that participants mistakenly viewed the incentive as being paid from NHS funds.Given the qualitative findings that individuals were concerned about not wasting NHS resources, it maybe that some participants were reluctant to claim their incentive payment by returning the questionnaire,feeling that this was not a good use of the NHS’s limited funds. This study is limited by the scope of thetype of financial incentive offered. Our findings could be specific to the value of the incentive offer,although existing literature would suggest that a higher value of incentive would not necessarily changethe results.57
Research suggests that individuals are motivated to respond to surveys for three main types of reason:altruism (e.g. believing that the research is important, wanting to help society or the researchers), egoisticresponses (e.g. enjoying surveys, interested in or would benefit from the results) and survey characteristics(e.g. interest in the topic, length of survey).78 When surveys offer incentives, one frequently given ‘egoistic’reason for participation is to receive the payment. However, the incentive may be insufficient to create aresponse if interest in the topic is low. It may be that interest in health checks among participants was solow that even the offer of an incentive was insufficient to motivate questionnaire return for many. Anotherpossibility is that the offer of an incentive ‘crowded out’ motivation to return the questionnaire amongindividuals who would have otherwise done so for altruistic reasons. There is evidence that tangiblerewards undermine intrinsic motivation for a wide range of simple tasks, when individuals are alreadymotivated to perform the behaviour.79 Indeed, some free-text responses on returned questionnairesincluded statements such as ‘no need to send me the voucher’, suggesting that some participants werekeen to express that they had taken part for more altruistic reasons. The reduction in response rate as aresult of the incentive causing motivational crowding out may have been countered by an increase inresponse rate among less intrinsically motivated individuals, leading to the finding of no significantdifference in response rates between the QBE questionnaire arm and the QBE questionnaire andincentive arm.
There may also be factors specific to this particular research project that diminished the impact ofincentives on questionnaire return. Participants may have felt that they lacked a prior relationship with thesignatories and senders of the invitation letter and so may have been uncertain that the promise of anincentive would be honoured. A second issue was that the participant questionnaires were linked to health
DOI: 10.3310/hta20840 HEALTH TECHNOLOGY ASSESSMENT 2016 VOL. 20 NO. 84
check data through study identification numbers. Participants may have been unclear how they would bereimbursed for returning an apparently anonymous survey. Some chose to provide their name and addressin the free-text box on the questionnaire, whereas others directly questioned how they would be sent avoucher if the research team did not know who they were. It may be important for the cover letter in anyfuture QBE studies using conditional incentives to explain to participants how returned questionnaires canbe linked to individuals’ contact details to enable incentive distribution. A third issue, also hinted at by afew free-text comments, is that some participants may have misunderstood the incentive as being offeredfor having a health check, rather than returning the questionnaire. It might have been informative to speakto non-responders about why the offer of a voucher did not lead them to return the questionnaire, butthis was not feasible in the context of this research. Incentivising the health check itself rather than returnof the questionnaire might have also altered the results but this was a different research question fromthat asked in this study.
Cost-effectiveness
We did not complete a cost-effectiveness analysis alongside the trial because there was no evidence thatthe trial intervention was effective. This research raises a question concerning the cost-effectiveness ofissuing standard invitation letters for health checks through the population-based call–recall system, whenuptake within 6 months is low. It was beyond the scope of this research to compare the effectiveness andcost-effectiveness of opportunistic compared with population-based invitation methods for health checks,but this could be pursued through future research.
Rapid trials using electronic health records
This trial was conducted as a rapid trial using electronic health records. The conduct of trials usingelectronic health records as a means for increasing the speed and efficiency with which trials can becompleted is a topic of growing importance.80 We have previously conducted cluster RCTs using primarycare electronic health records, with the Clinical Practice Research Datalink (CPRD)81 as the data source.These cluster trials were in implementation research focusing on primary care management andappropriate prescribing for respiratory infections82 and stroke secondary prevention.83 Van Staa et al.84
reported on two pilot clinical trials to evaluate statin prescribing for CVD prevention and antibioticprescribing for chronic obstructive pulmonary disease. Such trials are sometimes referred to as ‘point-of-care’ trials because recruitment, randomisation and outcome evaluation are all conducted in the context ofroutine service delivery settings.85 The CPRD clinical trials demonstrated the feasibility of conductingpragmatic drug trials using electronic health records but identified several difficulties that would need tobe overcome before these could be implemented on a wider scale. These difficulties especially related tothe issue of obtaining informed consent in the context of routine primary care consultations. The presenttrial did not require individual participant consent. Individual randomisation was conducted at scale across18 general practices. It was possible to randomise > 12,000 individual participants in this trial. The studywas methodologically innovative in incorporating and demonstrating the feasibility of an automatedsystem for randomisation into the software system that was used to manage invitations to the HealthCheck programme. This approach to trial conduct might now be pursued in other contexts.
Uptake of health checks
The research yielded important insights into the processes underlying health check uptake. The level ofuptake of health checks within 6 months of a standard invitation letter was much lower than initiallyanticipated, being close to 15% overall. Nationally reported data for health check uptake in England,London, Lambeth and Lewisham are presented in Table 35.9 The results show that health check uptake ispresently < 50% at the national level. Returns for London show slightly lower uptake rates than for
England. Data for the two boroughs, where the present trial was conducted, show lower uptake ratesthan for London as a whole, with lower uptake in Lambeth than in Lewisham. Uptake for 2015–16appears to be lower than for the period 2013–16. In the present trial, uptake of 15% was observed in thefirst 6 months following a standard invitation letter. Checks undertaken > 6 months after the invitationletter and non-invited checks outnumbered checks occurring within 6 months of the invitation letter by aratio of 2 : 1. As the numerator for nationally reported rates includes both invited and non-invited healthchecks, we conclude that the data reported in this trial are consistent with nationally reported data forhealth check uptake.
This research was conducted in inner London in a context that has several distinctive features. This is a verydeprived area and the majority of the trial sample lived in areas that were in the two most deprivedquintiles of deprivation score for England. The local population has a very young age distribution and thishas important implications for the Health Check programme in terms of the low proportion of older adultsamong the population invited for health checks in this area and the low proportion with a substantiallyelevated CVD risk (≥ 20%). Both the overall level of deprivation and the age distribution of the populationmight have contributed to a low overall uptake of health checks, although the two characteristics aredifferently associated with CVD risk.
Only a minority of the local population was classified as being of ‘white’ ethnicity, with a high proportionbeing of black Caribbean or black African origins. These groups are generally at greater risk of diabetesmellitus and hypertension and their complications. These ethnic minority populations often have highereducational attainment than the local white population and this might contribute to the higher healthcheck uptake among these ethnic minority groups in this area. In addition, newer migrants to the UK oftenhave experience of fee-for-service health systems, which may increase their motivation to take up the offerof health services that are free at the point of use.30
Conclusions from qualitative studies
Qualitative evaluations suggested some ambivalence towards the NHS Health Check programme amongboth health professionals and the general public. Reservations about the programme tended to focus onvalue for money and the resources required for programme implementation at a time when the NHS isunder financial pressure. Most patients expressed positive views about having their health checked andrecognised the value of preventative medical interventions. Some expressed scepticism about being able toobtain an appointment at their general practice, especially at a time that is convenient to them, givenother priorities such as work and caring responsibilities. They may be prepared to forgo these prioritieswhen they are feeling ill but not when they currently feel healthy, as may be the case when they receivethe standard invitation for a health check. Patients may have limited motivation for preventative healthcare, especially in deprived populations. However, they may not object to being offered a health checkopportunistically when they attend the general practice for another reason. Rather than focusinginterventions on individual patients to increase health check uptake, it may be more effective to focus onservice delivery factors to improve accessibility and the ease with which people can obtain a health check.
TABLE 35 Nationally reported data for NHS health check uptake for England, London, Lambeth and Lewisham9,26
Area Uptake 2013–present (%) Uptake 2015–16 (%) Uptake last quarter: July–September 2015 (%)
England 48.15 45.19 45.81
London 46.79 42.20 46.24
Lambeth 26.36 15.07 17.66
Lewisham 41.47 39.96 38.68
DOI: 10.3310/hta20840 HEALTH TECHNOLOGY ASSESSMENT 2016 VOL. 20 NO. 84
Patients commented on the difficulty of accessing appointments for blood tests and health checks and thedifficulty of prioritising these when they did not feel in need of a doctor. In the context of significantobstacles to taking up the offer of a health check, it is understandable that an intervention grounded inbehavioural science theory that targeted the individual patient behavioural response to receiving astandard invitation letter might not be effective.
Opportunistic compared with invited health checks
This research showed that invited health checks, conducted within 6 months following receipt of astandard invitation letter, represented a minority of completed health checks in this area. Data collected forthe trial revealed that nearly six out of 10 completed checks either were carried out > 6 months after aninvitation or were performed opportunistically. This finding was confirmed through analysis of routinelycollected data from the health check management information system. Qualitative interview resultsconfirmed that most general practices offered opportunistic health checks. This may reflect practicesrecognising the barriers to attending invited health checks in their patient populations suggested by thequalitative analysis and so offering health checks in a manner that is more feasible for patients. There wasconsiderable variation among practices in the extent to which opportunistic health checks were pursued,with variation in the proportion of opportunistic health checks, and late responders to invitations, amongpractices. An opportunistic approach to offering health checks might be effective because the offer of ahealth check is made at a time when the general practice is ready to complete it and at a time when thepatient is already engaged in accessing health-care services to meet their health needs. Data collected forthe trial showed that the case mix of patients attending for opportunistic checks was generally similar tothat of patients attending for invited checks in terms of age, gender and ethnicity, although the proportionof opportunistic checks appeared to be slightly higher in deprived populations. Importantly, the yield fromopportunistic checks, in terms of elevated cardiovascular risk and overweight and obesity, was higher thanfor invited health checks. This suggests that general practices generally target the offer of a health checkto higher-risk sections of their registered population.
Strengths and limitations of this research
This study had several strengths. The trial was conducted in a large number of general practices and thelarge target sample size for the trial was achieved. The study had sufficient power to detect small increasesin uptake of health checks. Two different methods for recruitment and randomisation were used andthese gave consistent results. We evaluated the reliability of the trial results against routinely collected datafrom the health check management information system. This comparison showed that the number ofparticipants invited was consistent between the two data sources. The high proportion of patientsreceiving non-invited checks was also consistent in trial data and in routinely collected data. We conductedqualitative research, including interviews with health-care staff and patients, and analysed free-textresponses from returned questionnaires. These qualitative data confirmed our interpretation that there aresignificant obstacles to the uptake of standard health check invitations, but that most practices are activein offering opportunistic health checks.
The trial was conducted in a deprived area of inner London with a young population age distribution anda high proportion of ethnic minority groups. This research does not exclude the possibility that anenhanced invitation method based on the QBE might be more effective in more affluent areas with olderpopulations. However, trial subgroup analyses did not suggest any possible important difference in effectaccording to subgroups of age or deprivation quintile.
The conduct of the trial depended on using primary care electronic health records, linked to theproprietary health check management information system, to recruit participants, arrange for the deliveryof the intervention materials and ascertain trial outcomes. We conducted extensive checks to ensure that
these processes were being implemented as intended. Nevertheless, there was evidence of discrepanciesarising in the health check management information system. In the automated recruitment trial arm, asmall number of participants who were registered at non-trial general practices were initially included.These individuals had possibly moved to a new general practice. In addition, a small number of participantswere identified as eligible for a health check more than once during the trial study period. Both groupsof discrepant participants were excluded at the time of analysis. The number of discrepancies recordedwas too small to have an influence on the overall results of the study. We used Read codes recordedin electronic health records to ascertain trial outcomes. It is possible that general practices might usenon-standard Read codes to identify health checks. However, we searched for the Read codes that aremandated by the Health Check programme, which are used for reimbursement of practices for completedhealth checks. The same Read codes are used by the information system to manage the Health Checkprogramme. As noted earlier, data from the trial were generally consistent with data obtained from thehealth check management information system. It is noted that there may be variation between practices inuse of Read codes for recording information about patients and that recording systems are not always upto date. However, any data discrepancies should be equally distributed between trial arms and should nothave a differential effect. Any data discrepancy large enough to mask a clinically important effect shouldhave been detected through our data checks, but none was identified.
Research recommendations
Research recommendations will be discussed in relation to the NHS Health Check programme, the QBEand financial incentives and methods for conducting rapid trials using electronic health records.
NHS Health Check programmePublic Health England has already developed research recommendations to support the NHS Health Checkprogramme.86 These identify four general areas of importance including delivery and implementation,outcomes, cost-effectiveness and health inequalities. The research conducted for the present trial mainlyfocused on the first of these areas, with a more limited relevance to the question of health inequalities.
l We endorse the PHE suggestion that further research should address optimal methods of recruitmentof patients for NHS health checks. Our research raises a question concerning the value of a population-based call–recall system, when uptake of health checks within 6 months is low. Opportunistic checksmight sometimes be effective at reaching more deprived populations and those at higher risk.
l We also endorse the PHE recommendation for further research into the organisation and delivery ofhealth checks. In particular, our research identifies barriers to access in terms of time costs to patientsand difficulties of obtaining access to appointments at convenient times and locations as keydeterminants of health check uptake.
l This research draws attention to the young age distribution and high proportion of ethnic minorities inthis urban population. In this population, the proportion with a ≥ 20% risk of CVD is comparativelylow, with implications for the efficiency of the Health Check programme. In areas with younger andmore ethnically diverse populations there may be a case for tailoring health checks to address relevanthealth problems, including diabetes mellitus, obesity, hypertension and risk of chronic kidney disease.This will enable a link with diabetes prevention initiatives. Research is needed to identify the mosteffective and efficient ways of achieving this.
The question–behaviour effectOur findings offer no support for use of the QBE in increasing attendance at NHS health checks.Our findings suggest that the QBE may have limited use as an intervention in public health.
DOI: 10.3310/hta20840 HEALTH TECHNOLOGY ASSESSMENT 2016 VOL. 20 NO. 84
l evaluate the effects of a redesigned questionnaire focusing on self-prediction items and omittinganticipated regret
l assess whether or not combining the QBE with a motivational intervention to increase positiveintentions and attitudes might better support health check uptake
l investigate whether or not alternative documentation sent to participants would result in similar levelsof attendance.
Methods for conducting rapid trials using electronic health recordsWe have shown that it is feasible to conduct a rapid RCT, with automated randomisation, using electronichealth records. Future research should:
l identify a wider range of health service and public health settings in which automated randomisationmay be used
l identify a wider range of interventions that can be delivered remotely at low costl address issues of governance and informed consent in the context of large simple trials.
The trial was funded by the NIHR Health Technology Assessment programme (reference number11/129/61).
Caroline Burgess and Alice Forster were also supported by the Guy’s and St Thomas’ Charity (grantnumber G100702). Martin Gulliford was supported by the NIHR Biomedical Research Centre at Guy’s andSt Thomas’ Hospitals. The views expressed are those of the authors and not necessarily those of the NHS,the NIHR or the Department of Health.
We thank all of the general practices and individuals participating in this trial, the staff of the centralservice that co-ordinates health check invitations in the two trial boroughs and the members of our TSC.
Contribution of authors
Lisa McDermott designed and tested the intervention questionnaire, planned the conduct of the trial,implemented the randomisation lists and conducted data collection and data management for the trial.
Alison J Wright designed the study, designed and tested the intervention questionnaire, providedadditional data management and data analysis support and drafted the report.
Victoria Cornelius designed the study, planned the conduct of the trial, prepared the randomisation lists,wrote the statistical analysis plan and conducted the analysis and drafted the report.
Caroline Burgess designed the study, designed and tested the intervention questionnaire and plannedthe conduct of the trial.
Alice S Forster designed the study, designed and tested the intervention questionnaire, planned theconduct of the trial, implemented the randomisation lists and conducted data collection and datamanagement for the trial.
Mark Ashworth planned the conduct of the trial and assisted with data collection and data management.
Bernadette Khoshaba conducted data collection and data management for the trial, provided additionaldata analysis support and drafted the report.
Philippa Clery conducted data collection and data management for the trial.
Frances Fuller planned the conduct of the trial and assisted with data collection and data management.
Jane Miller planned the conduct of the trial and assisted with data collection and data management.
Hiten Dodhia planned the conduct of the trial and assisted with data collection and data management.
Caroline Rudisill conducted the economic evaluation.
Mark T Conner designed the study and designed and tested the intervention questionnaire.
DOI: 10.3310/hta20840 HEALTH TECHNOLOGY ASSESSMENT 2016 VOL. 20 NO. 84
Martin C Gulliford designed the study, planned the conduct of the trial, provided additional datamanagement and data analysis support and drafted the report.
All authors reviewed and commented on the draft report. Martin C Gulliford is guarantor.
Data sharing statement
All available data can be obtained by contacting the corresponding author; the study team will retainexclusive use until the publication of major outputs.
1. British Heart Foundation. Cardiovascular Disease Statistics. UK Factsheet. London: BritishHeart Foundation; 2014. URL: www.bhf.org.uk/∼/media/files/research/heart-statistics/cardiovascular-disease-statistics—headline-statistics.pdf (accessed 18 January 2018).
2. UK Diabetes. Diabetes Prevalence 2014. London: Diabetes UK; 2015. URL: www.diabetes.org.uk/About_us/What-we-say/Statistics/Diabetes-prevalence-2014/ (accessed 18 January 2016).
3. National Institute for Health and Care Excellence. Chronic Kidney Disease in Adults: Assessmentand Management. CG182. London: NICE; 2014.
4. Aitken GR, Roderick PJ, Fraser S, Mindell JS, O’Donoghue D, Day J, et al. Change in prevalenceof chronic kidney disease in England over time: comparison of nationally representativecross-sectional surveys from 2003 to 2010. BMJ Open 2014;4:e005480. http://dx.doi.org/10.1136/bmjopen-2014-005480
5. Dregan A, Stewart R, Gulliford MC. Cardiovascular risk factors and cognitive decline in adults aged50 and over: a population-based cohort study. Age Ageing 2013;42:338–45. http://dx.doi.org/10.1093/ageing/afs166
6. Townsend N, Wickramasinghe K, Bhatnagar P, Smolina K, Nichols M, Leal J, et al. Coronary HeartDisease Statistics 2012 Edition. London: British Heart Foundation; 2012.
7. Murray CJL, Richards MA, Newton JN, Fenton KA, Anderson HR, Atkinson C, et al. UK healthperformance: findings of the Global Burden of Disease Study 2010. Lancet 2013;381:997–1020.http://dx.doi.org/10.1016/S0140-6736(13)60355-4
8. Department of Health. Putting Prevention First. NHS Health Check: Vascular Risk Assessment.Best Practice Guidance. London: Department of Health; 2009.
9. NHS. Health Check Uptake Data. 2016. URL: www.healthcheck.nhs.uk/commissioners_and_providers/data/ (accessed September 2016).
10. Secretary of State. The Local Authorities (Public Health Functions and Entry to Premises by LocalHealthwatch Representatives) Regulations No. 351. Regulation 4. The Stationery Office: London; 2013.
11. Department of Health. Healthy Lives, Healthy People: Transparency in Outcomes. Proposals for aPublic Health Outcomes Framework. London: Department of Health; 2010.
12. JBS3 Board. Joint British Societies’ consensus recommendations for the prevention of cardiovasculardisease (JBS3). Heart 2014;100(Suppl. 2):ii1–67. http://dx.doi.org/10.1136/heartjnl-2014-305693
13. Hippisley-Cox J, Coupland C, Robson J, Brindle P. Derivation, validation, and evaluation of a newQRISK model to estimate lifetime risk of cardiovascular disease: cohort study using QResearchdatabase. BMJ 2010;341:c6624. http://dx.doi.org/10.1136/bmj.c6624
14. Caley M, Chohan P, Hooper J, Wright N. The impact of NHS health checks on the prevalence ofdisease in general practices: a controlled study. Br J Gen Pract 2014;64:e516–21. http://dx.doi.org/10.3399/bjgp14X681013
15. National Institute for Health and Care Excellence. Cardiovascular Disease: Risk Assessment andReduction, Including Lipid Modification. CG181. London: NICE; 2014. URL: www.nice.org.uk/guidance/cg181/chapter/1-recommendations (accessed 18 January 2016).
16. Krogsbøll LT, Jorgensen KJ, Gronhoj Larsen C, Gotzsche PC. General health checks in adults forreducing morbidity and mortality from disease: Cochrane systematic review and meta-analysis.BMJ 2012;345:e7191. http://dx.doi.org/10.1136/bmj.e7191
DOI: 10.3310/hta20840 HEALTH TECHNOLOGY ASSESSMENT 2016 VOL. 20 NO. 84
17. Imperial Cancer Research Fund OXCHECK Study Group. The effectiveness of health checksconducted by nurses in primary care: final results from the OXCHECK study. BMJ1995;310:1099–104. http://dx.doi.org/10.1136/bmj.310.6987.1099
18. British Family Heart Study Group. Randomised controlled trial evaluating cardiovascular screeningand intervention in general practice: principal results of the British Family Heart Study. BMJ1994;308:313–20. http://dx.doi.org/10.1136/bmj.308.6924.313
19. Capewell S, McCartney M, Holland W. Invited debate: NHS Health Checks – a naked emperor?J Public Health 2015;37:187–92. http://dx.doi.org/10.1093/pubmed/fdv063
20. van Staa T-P, Smeeth L, Ng ES-W, Goldacre B, Gulliford M. The efficiency of cardiovascular riskassessment: do the right patients get statin treatment? Heart 2013;99:1597–602. http://dx.doi.org/10.1136/heartjnl-2013-303698
21. Wanless D. Securing Good Health for the Whole Population. Final Report. London: HMSO; 2004.
22. National Institute for Health and Care Excellence. Obesity: Identification, Assessment andManagement of Overweight and Obesity in Children, Young People and Adults. London:NICE; 2014.
23. National Institute for Health and Care Excellence. Lipid Modification: Cardiovascular RiskAssessment and the Modification of Blood Lipids for the Primary and Secondary Prevention ofCardiovascular Disease. London: NICE; 2008.
24. Department of Health. Economic Modelling For Vascular Checks. London: Department ofHealth; 2008.
25. Dalton AR, Bottle A, Okoro C, Majeed A, Millett C. Uptake of the NHS Health Checks programmein a deprived, culturally diverse setting: cross-sectional study. J Public Health 2011;33:422–9.http://dx.doi.org/10.1093/pubmed/fdr034
26. NHS. NHS Health Check. URL: www.healthcheck.nhs.uk (accessed November 2016).
27. Artac M, Dalton AR, Majeed A, Car J, Huckvale K, Millett C. Uptake of the NHS Health Checkprogramme in an urban setting. Fam Pract 2013;30:426–35. http://dx.doi.org/10.1093/fampra/cmt002
28. Dalton AR, Bottle A, Okoro C, Majeed A, Millett C. Implementation of the NHS Health Checksprogramme: baseline assessment of risk factor recording in an urban culturally diverse setting.Fam Pract 2011;28:34–40. http://dx.doi.org/10.1093/fampra/cmq068
29. Robson J, Dostal I, Madurasinghe V, Sheikh A, Hull S, Boomla K, et al. The NHS Health Checkprogramme: implementation in east London 2009–2011. BMJ Open 2015;5:e007578. http://dx.doi.org/10.1136/bmjopen-2015-007578
30. Burgess C, Wright AJ, Forster AS, Dodhia H, Miller J, Fuller F, et al. Influences on individuals’decisions to take up the offer of a health check: a qualitative study. Health Expect2015;18:2437–48. http://dx.doi.org/10.1111/hex.12212
31. Forster AS, Burgess C, Dodhia H, Fuller F, Miller J, McDermott L, et al. Do health checks improverisk factor detection in primary care? Matched cohort study using electronic health records. J PublicHealth. 2015;fdv119:1–8. http://dx.doi.org/10.1093/pubmed/fdv119
32. Camilloni L, Ferroni E, Cendales BJ, Pezzarossi A, Furnari G, Borgia P, et al. Methods to increaseparticipation in organised screening programs: a systematic review. BMC Public Health2013;13:464. http://dx.doi.org/10.1186/1471-2458-13-464
33. Jepson R, Clegg A, Forbes C, Lewis R, Sowden A, Kleijnen J. The determinants of screening uptakeand interventions for increasing uptake: a systematic review. Health Technol Assess 2000;4(14).
34. Gidlow C, Ellis N, Randall J, Cowap L, Smith G, Iqbal Z, et al. Method of invitation andgeographical proximity as predictors of NHS Health Check uptake. J Public Health2015;37:195–201. http://dx.doi.org/10.1093/pubmed/fdu092
35. Kumar J, Chambers R, Mawby Y, Leese C, Iqbal Z, Picariello L, et al. Delivering more with less?Making the NHS Health Check work in financially hard times: real time learning fromStoke-on-Trent. Qual Prim Care 2011;19:193–9.
36. Norman P, Conner MT, Willits DG, Bailey DR, Hood DHJ, Coysh HL. Health checks in generalpractice: a comparison of two invitation letters. Br J Gen Pract 1991;41:432–3.
37. Cooper AM, Dugdill L. Evidence of Improved Uptake of Health Checks: Rapid Review. Salford:University of Salford; 2014. URL: http://usir.salford.ac.uk/31864/ (accessed 18 January 2016).
38. Perry C, Krishna C, Damesick D, Hobden S, Volpe L. Behavioural Insights in Health Care: Nudgingto Reduce Inefficiency and Waste. London: Health Foundation; 2015.
39. Lo SH, Good A, Sheeran P, Baio G, Rainbow S, Vart G, et al. Preformulated implementationintentions to promote colorectal cancer screening: a cluster-randomized trial. Health Psychol2014;33:998–1002. http://dx.doi.org/10.1037/a0033507
40. Dormandy E, Bryan S, Gulliford MC, Roberts TE, Ades AE, Calnan M, et al. Antenatal screening forhaemoglobinopathies in primary care: a cohort study and cluster randomised trial to inform asimulation model. The Screening for Haemoglobinopathies in First Trimester (SHIFT) trial. HealthTechnol Assess 2010;14(20). http://dx.doi.org/10.3310/hta14200
41. Michie S, Dormandy E, Marteau TM. Increasing screening uptake amongst those intending to bescreened: the use of action plans. Patient Educ Couns 2004;55:218–22. http://dx.doi.org/10.1016/j.pec.2003.09.005
42. Prestwich A, Kellar I. How can the impact of implementation intentions as a behaviour changeintervention be improved? Eur Rev Appl Psychol 2014;64:35–41. http://dx.doi.org/10.1016/j.erap.2010.03.003
43. Neter E, Stein N, Barnett-Griness O, Rennert G, Hagoel L. From the bench to public health:population-level implementation intentions in colorectal cancer screening. Am J Prev Med2014;46:273–80. http://dx.doi.org/10.1016/j.amepre.2013.11.008
44. Conner M, Godin G, Norman P, Sheeran P. Using the question–behavior effect to promotedisease prevention behaviors: two randomized controlled trials. Health Psychol 2011;30:300–9.http://dx.doi.org/10.1037/a0023036
45. Sandberg T, Conner M. A mere measurement effect for anticipated regret: impacts on cervicalscreening attendance. Br J Soc Psychol 2009;48:221–36. http://dx.doi.org/10.1348/014466608X347001
46. O’Carroll RE, Chambers JA, Brownlee L, Libby G, Steele RJC. Anticipated regret to increase uptakeof colorectal cancer screening (ARTICS): a randomised controlled trial. Soc Sci Med2015;142:118–27. http://dx.doi.org/10.1016/j.socscimed.2015.07.026
47. Sherman SJ. On the self-erasing nature of errors of prediction. J Pers Soc Psychol 1980;39:211–21.http://dx.doi.org/10.1037/0022-3514.39.2.211
48. Wood C, Conner M, Sandberg T, Godin G, Sheeran P. Why does asking questions change healthbehaviours? The mediating role of attitude accessibility. Psychol Health 2014;29:390–404.http://dx.doi.org/10.1080/08870446.2013.858343
49. Dholakia UM. A Critical Review of Question–Behavior Effect Research. In Malhotra NK. Reviewof Marketing Research. Bingley: Emerald; 2010. pp. 145–97. http://dx.doi.org/10.1108/S1548-6435(2010)0000007009
DOI: 10.3310/hta20840 HEALTH TECHNOLOGY ASSESSMENT 2016 VOL. 20 NO. 84
50. Wood C, Conner M, Miles E, Sandberg T, Taylor N, Godin G, Sheeran P. The impact of askingintention or self-prediction questions on subsequent behavior: a meta-analysis. Pers Soc PsycholRev 2016;20:245–68. http://dx.doi.org/10.1177/1088868315592334
51. Rodrigues AM, O’Brien N, French DP, Glidewell L, Sniehotta FF. The question–behavior effect:genuine effect or spurious phenomenon? A systematic review of randomized controlled trials withmeta-analyses. Health Psychol 2015;34:61–78. http://dx.doi.org/10.1037/hea0000104
52. Ajzen I. Theories of cognitive self-regulation. The theory of planned behavior. Organ Behav HumDecis Process 1991;50:179–211. http://dx.doi.org/10.1016/0749-5978(91)90020-T
53. Higgins JP, Altman DG, Gøtzsche PC, Jüni P, Moher D, Oxman AD, et al. The CochraneCollaboration’s tool for assessing risk of bias in randomised trials. BMJ 2011;343:d5928.http://dx.doi.org/10.1136/bmj.d5928
54. Edwards PJ, Roberts I, Clarke MJ, Diguiseppi C, Wentz R, Kwan I, et al. Methods to increaseresponse to postal and electronic questionnaires. Cochrane Database Syst Rev 2009;3:MR000008.http://dx.doi.org/10.1002/14651858.mr000008.pub4
55. Edwards P, Cooper R, Roberts I, Frost C. Meta-analysis of randomised trials of monetary incentivesand response to mailed questionnaires. J Epidemiol Community Health 2005;59:987–99.http://dx.doi.org/10.1136/jech.2005.034397
56. von Wagner C, Good A, Whitaker KL, Wardle J. Psychosocial determinants of socioeconomicinequalities in cancer screening participation: a conceptual framework. Epidemiol Rev2011;33:135–47. http://dx.doi.org/10.1093/epirev/mxq018
57. Dolan P, Rudisill C. The effect of financial incentives on chlamydia testing rates: evidence froma randomized experiment. Soc Sci Med 2014;105:140–8. http://dx.doi.org/10.1016/j.socscimed.2013.11.018
58. Marteau TM, Dormandy E, Michie S. A measure of informed choice. Health Expect 2001;4:99–108.http://dx.doi.org/10.1046/j.1369-6513.2001.00140.x
59. Marteau TM, Kinmonth AL. Screening for cardiovascular risk: public health imperative or matter forindividual informed choice? BMJ 2002;325:78–80. http://dx.doi.org/10.1136/bmj.325.7355.78
60. Mann E, Kellar I, Sutton S, Kinmonth AL, Hankins M, Griffin S, et al. Impact of informed-choiceinvitations on diabetes screening knowledge, attitude and intentions: an analogue study.BMC Public Health 2010;10:768. http://dx.doi.org/10.1186/1471-2458-10-768
61. Cochrane T, Gidlow CJ, Kumar J, Mawby Y, Iqbal Z, Chambers RM. Cross-sectional review of theresponse and treatment uptake from the NHS Health Checks programme in Stoke on Trent.J Public Health 2013;35:92–8. http://dx.doi.org/10.1093/pubmed/fds088
62. Office for National Statistics. National Statistics. 2015. URL: www.neighbourhood.statistics.gov.uk/dissemination/ (accessed 20 September 2016).
63. London Data Store. Demographic Data. 2016. URL: https://data.london.gov.uk/census/themes/demography/ (accessed October 2016).
64. Department for Communities and Local Government. English Indices of Deprivation 2015.2015. URL: www.gov.uk/government/statistics/English-indices-of-deprivation-2015 (accessed20 September 2016).
65. Forster AS, Burgess C, McDermott L, Wright AJ, Dodhia H, Conner M, et al. Enhanced invitationmethods to increase uptake of NHS health checks: study protocol for a randomized controlled trial.Trials 2014;15:342. http://dx.doi.org/10.1186/1745-6215-15-342
66. Department for Communities and Local Government. English Indices of Deprivation 2010. 2011.URL: www.gov.uk/government/statistics/English-indices-of-deprivation-2010 (accessed20 September 2016).
67. Sensory Trust. Accessible Information – Clear and Large Print Sensory Trust Information Sheet.URL: www.sensorytrust.org.uk/resources/connect/infosheet_clearlargeprint.pdf(accessed 18 January 2016).
68. Godin G, Belanger-Gravel A, Vezina-Im LA, Amireault S, Bilodeau A. Question–behaviour effect:a randomised controlled trial of asking intention in the interrogative or declarative form. PsycholHealth 2012;27:1086–99. http://dx.doi.org/10.1080/08870446.2012.671617
69. Cowie L, Morgan M, Gulliford M. Handwritten ‘post-it’ notes, questionnaire formats and response toa postal questionnaire survey. Int J Epidemiol 2011;40:254–5. http://dx.doi.org/10.1093/ije/dyq043
70. Kahan BC. Accounting for centre-effects in multicentre trials with a binary outcome – when, why,and how? BMC Med Res Methodol 2014;14:20. http://dx.doi.org/10.1186/1471-2288-14-20
71. Higgins JP, Thompson SG. Quantifying heterogeneity in a meta-analysis. Stat Med 2002;21:1539–58.http://dx.doi.org/10.1002/sim.1186
72. Kaplan EL, Meier P. Nonparametric estimation from incomplete observations. J Am Stat Assoc1958;53:457–81. http://dx.doi.org/10.1080/01621459.1958.10501452
73. Dunn G, Maracy M, Dowrick C, Ayuso-Mateos JL, Dalgard OS, Page H, et al. Estimatingpsychological treatment effects from a randomised controlled trial with both non-compliance andloss to follow-up. Br J Psychiatry 2003;183:323–31. http://dx.doi.org/10.1192/bjp.183.4.323
74. Moore GF, Audrey S, Barker M, Bond L, Bonell C, Hardeman W, et al. Process evaluation of complexinterventions: Medical Research Council guidance. BMJ 2015;350:h1258. http://dx.doi.org/10.1136/bmj.h1258
75. Chinn S. A simple method for converting an odds ratio to effect size for use in meta-analysis.Stat Med 2000;19:3127–31. http://dx.doi.org/10.1002/1097-0258(20001130)19:22%3C3127::AID-SIM784%3E3.0.CO;2-M
76. Wilding S, Conner MT, Lawton RJ, Prestwich AJ. Can Answering Questions Change Behaviour?A Systematic Review and Meta-Regression. Oral presentation. European Health Psychology SocietyConference, Limassol, Cyprus, August 2015. URL: www.ehps.net/ehp/index.php/contents/article/view/1093 (accessed 20 September 2016).
77. Ayres K, Conner M, Prestwich A, Hurling R, Cobain M, Lawton R, et al. Exploring thequestion–behaviour effect: randomized controlled trial of motivational and question–behaviourinterventions. Br J Health Psychol 2013;18:31–44. http://dx.doi.org/10.1111/j.2044-8287.2012.02075.x
78. Singer E, Ye C. The use and effects of incentives in surveys. Ann Am Acad Pol Soc Sci2013;645:112–41. http://dx.doi.org/10.1177/0002716212458082
79. Promberger M, Marteau TM. When do financial incentives reduce intrinsic motivation? comparingbehaviors studied in psychological and economic literatures. Health Psychol 2013;32:950–7.http://dx.doi.org/10.1037/a0032727
80. van Staa TP, Goldacre B, Gulliford M, Cassell J, Pirmohamed M, Taweel A, et al. Pragmaticrandomised trials using routine electronic health records: putting them to the test.BMJ 2012;344:e55. http://dx.doi.org/10.1136/bmj.e55
81. Herrett E, Gallagher AM, Bhaskaran K, Forbes H, Mathur R, van Staa T, et al. Data Resource Profile:Clinical Practice Research Datalink (CPRD). Int J Epidemiol 2015;44:827–36. http://dx.doi.org/10.1093/ije/dyv098
DOI: 10.3310/hta20840 HEALTH TECHNOLOGY ASSESSMENT 2016 VOL. 20 NO. 84
82. Gulliford M, van Staa T, Dregan A, McDermott L, McCann G, Asworth M, et al. Utilising electronichealth records for intervention research. Cluster randomised trial to reduce antibiotic prescribing inprimary care (eCRT study). Ann Fam Med 2014;4:244–51.
83. Dregan A, van Staa TP, McDermott L, McCann G, Ashworth M, Charlton J, et al. Point-of-carecluster randomized trial in stroke secondary prevention using electronic health records. Stroke2014;45:2066–71. http://dx.doi.org/10.1161/STROKEAHA.114.005713
84. van Staa TP, Dyson L, McCann G, Padmanabhan S, Belatri R, Goldacre B, et al. The opportunitiesand challenges of pragmatic point-of-care randomised trials using routinely collected electronicrecords: evaluations of two exemplar trials. Health Technol Assess 2014;18(43). http://dx.doi.org/10.3310/hta18430
85. Fiore LD, Brophy M, Ferguson RE, D’Avolio L, Hermos JA, Lew RA, et al. A point-of-care clinical trialcomparing insulin administered using a sliding scale versus a weight-based regimen. Clin Trials2011;8:183–95. http://dx.doi.org/10.1177/1740774511398368
86. Public Health England. NHS Health Check Programme: Priorities for Research. London: PublicHealth England; 2014.
Appendix 2 Covering letter: question–behavioureffect questionnaire trial arm
Dear [Title, Surname],
Over the next few weeks you will be receiving an invitation to a free Health Check offered by the NHS.
We want to find out how people decide whether to accept the invitation to have a NHS Health Check. Wewould be grateful if you would complete the questions in the booklet that came with this letter and returnit as soon as possible in the prepaid envelope.
We will not tell anyone else what answers you give us. Your personal details will only be seen by thepeople involved in your health care.
Yours sincerely,
Clinical Lead,
Lewisham NHS Health Check programme
DOI: 10.3310/hta20840 HEALTH TECHNOLOGY ASSESSMENT 2016 VOL. 20 NO. 84
Appendix 3 Covering letter: question–behavioureffect questionnaire and incentive trial arm
Dear [Title, Surname],
Over the next few weeks you will be receiving an invitation to a free Health Check offered by the NHS.
We want to find out how people decide whether to accept the invitation to have a NHS Health Check.We would be grateful if you would complete the questions in the booklet that came with this letter andreturn it as soon as possible in the prepaid envelope.
We will not tell anyone else what answers you give us. Your personal details will only be seen by thepeople involved in your health care.
If you complete and return the survey we will send you a £5 ‘Love to Shop’ voucher.
Yours sincerely,
Clinical Lead,
Lewisham NHS Health Check programme
DOI: 10.3310/hta20840 HEALTH TECHNOLOGY ASSESSMENT 2016 VOL. 20 NO. 84
Appendix 4 Interview guide: health checktrial – general practice staff
Aim
To identify organisational factors within general practices that may have influenced the uptake of NHShealth checks and implementation of the enhanced invitation methods trial.
Participants
Participants were practice management staff, health check procedure managers/administrators and health-care staff involved in the delivery of NHS health checks.
The following table indicates the justification aims of each interview question.
Question Prompts Topic Aim of question
1 Please could you brieflyoutline your role in thepractice and delivery of theNHS health checks?
Monthly tasks, etc. Introduction question Role of participant
2 Could you briefly describeyour views on the NHS HealthCheck programme?
l Were you aware ofhealth checks beforethe study?
l Are you still offeringhealth checks?
Health check attitude Staff understanding and viewsof NHS health checks
3 What do you think are themain benefits of the NHSHealth Check programme?
l To the practicel To the patient
Health check attitude Are staff willing to supporthealth check bookings andthe trial?
4 What do you feel are themain weaknesses of the NHSHealth Check programme?
l To the practicel To the patient
Health check attitude What are the possible barriersto staff support for healthcheck bookings and the trial?
5 Could you briefly describe theway in which the programmeworks within your practice?
PNL/booking slots/staffresponsible
Uptake influences What are the possibleprocedural barriers to patientsreceiving health checks?
6 How is information aboutNHS health checkscommunicated within thepractice?
Reception staff/staffresponsible
Uptake influences Could untrained staff beproviding inadequateinformation to patients abouthealth checks and bookingchecks?
7 How easy is it to find time/ensure that the PNL list ischecked each month?
Does this ever getmissed?
Uptake influences Are ineligible patients invitedfor health checks andincluded in the trial?
8 What difficulties are there inbooking slots for healthchecks?
Uptake influences Can patients easily bookappointments for healthchecks?
9 Are health checks offered topatients who have not beeninvited to a health check?
How common is this? Uptake influences Are opportunistic checksregularly conducted?
DOI: 10.3310/hta20840 HEALTH TECHNOLOGY ASSESSMENT 2016 VOL. 20 NO. 84
Part of the NIHR Journals Library www.journalslibrary.nihr.ac.uk
Published by the NIHR Journals Library
This report presents independent research funded by the National Institute for Health Research (NIHR). The views expressed are those of the author(s) and not necessarily those of the NHS, the NIHR or the Department of Health