Specialty Minerals and Metals Canaccord Genuity is the global capital markets group of Canaccord Genuity Group Inc. (CF : TSX | CF. : LSE) The recommendations and opinions expressed in this research report accurately reflect the research analyst's personal, independent and objective views about any and all the companies and securities that are the subject of this report discussed herein. Australian Equity Research 16 December 2015 Company Rating Price Target Specialty Minerals and Metals GMM-ASX Spec Buy A$0.20 A$0.40 GXY-ASX Spec Buy A$0.09 A$0.16 Share price data as of Dec 16, 2015 Reg Spencer | Canaccord Genuity (Australia) Ltd. | [email protected] | +61.2.9263.2701 Tim McCormack | Canaccord Genuity (Australia) Ltd. | [email protected] | +61.407.195.774 Larry Hill (Associate Analyst) | Canaccord Genuity (Australia) Ltd. | [email protected] | +61.2.9263.2789 Initiation of Coverage Lithium sector set to charge Lithium-ion (Li-ion) batteries represent the largest and highest-growth segment of the lithium market. They are currently considered the preeminent battery technology in high- growth industries, such as portable electronic devices, hybrid/electric vehicles, and storage batteries. We expect strong lithium demand growth in the coming years based on the positive outlook in these industries. Demand growth is compounded by tight supply side conditions. Production issues from existing brine producers (poor capacity utilisation, expansion issues, new entrants still in ramp-up phase, and the changing dynamics of the lithium mineral (spodumene) market support the potential for significant lithium price increases in the near-medium term, in our view. Initiating coverage: Galaxy Resources Ltd (GXY:ASX) • GXY is a globally diverse lithium development company. Primary assets include the Mt Cattlin spodumene project in WA (subject to 50% earn in by GMM), the Sal de Vida lithium brine project in Argentina (100%) and the James Bay spodumene exploration project (subject to 50% earn in by GMM) in Canada. • GXY recently re-structured its business, having recently sold its underperforming lithium carbonate (Li 2 CO 3 ) plant, reduced/re-structured its corporate debt, and established a JV with GMM to re-start production at Mt Cattlin in early 2016. In addition, GXY's Sal de Vida brine project offers optionality and potential strategic value in our view, with options to reduce capex and fund a potential staged development now being assessed. • We value GXY on a NAV basis comprising 50% of our base case NPV10% for Mt Cattlin, our blended DCF/market based value for Sal de Vida, and exploration, net of corporate and other adjustments. We initiate coverage with a SPECULATIVE BUY rating and A $0.16/sh target price. Initiating coverage: General Mining Corporation (GMM:ASX) Canaccord Genuity (Australia) Limited was the Lead Manager to the Placement of ~40.3 million shares at $0.18 per share to raise ~A$7.3 million in December 2015. • GMM's primary asset is a right to earn 50% of the +15 year, ~110ktpa Mt Cattlin spodumene project through sole funding a re-start of production (expected early 2016) and cash payments to GXY. GMM is also earning a 50% interest in the James Bay exploration project. • Previous production issues at Mt Cattlin are being addressed through upgrades of the process plant, while project economics benefit from existing infrastructure, low initial start-up capex (<A$10m), a lower A$ and improved spodumene product pricing. • We value GMM on a NAV basis, consisting of 50% of our base case NPV10% for Mt Cattlin, exploration (James Bay), net of corporate and other adjustments. We initiate coverage with a SPECULATIVE BUY rating and A$0.40/sh target price. For important information, please see the Important Disclosures beginning on page 44 of this document.
Transcript
Specialty Minerals and Metals
Canaccord Genuity is the global capital markets group of Canaccord Genuity Group Inc. (CF : TSX | CF. : LSE)The recommendations and opinions expressed in this research report accurately reflect the research analyst's personal, independent and objective views about any and allthe companies and securities that are the subject of this report discussed herein.
Australian Equity Research16 December 2015
Company Rating Price TargetSpecialty Minerals and MetalsGMM-ASX Spec Buy A$0.20 A$0.40GXY-ASX Spec Buy A$0.09 A$0.16Share price data as of Dec 16, 2015
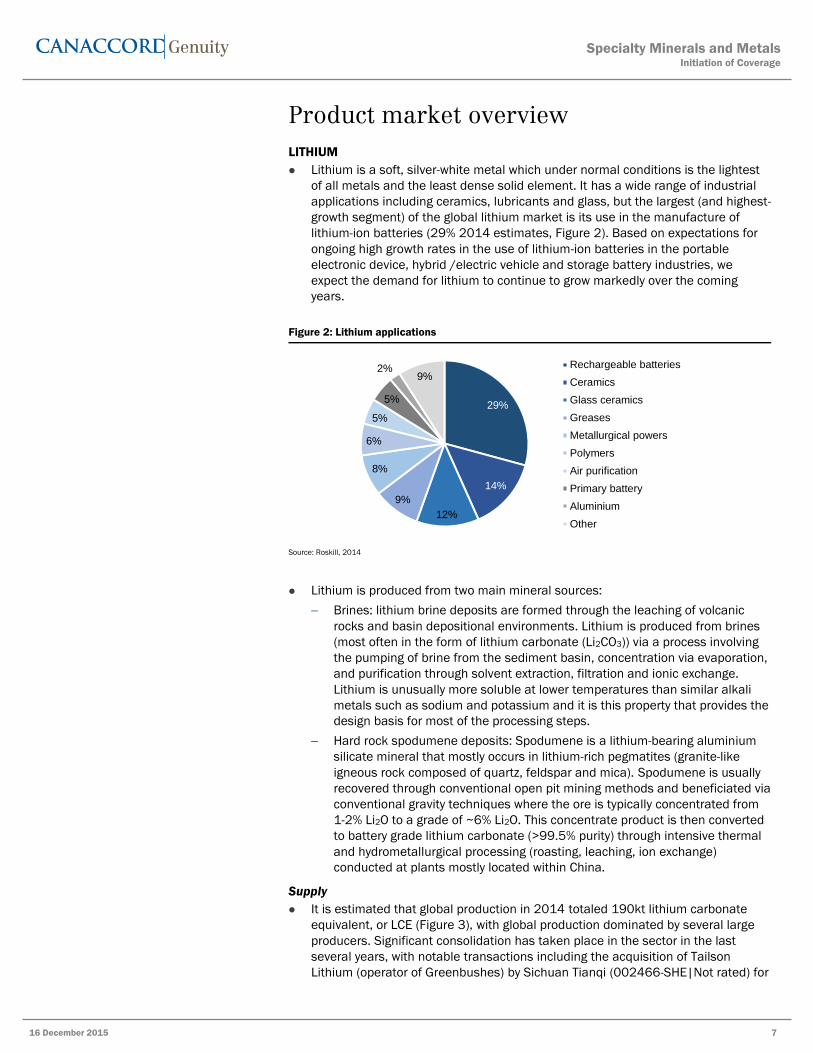
Lithium sector set to chargeLithium-ion (Li-ion) batteries represent the largest and highest-growth segment of thelithium market. They are currently considered the preeminent battery technology in high-growth industries, such as portable electronic devices, hybrid/electric vehicles, andstorage batteries. We expect strong lithium demand growth in the coming years based onthe positive outlook in these industries.Demand growth is compounded by tight supply side conditions. Production issues fromexisting brine producers (poor capacity utilisation, expansion issues, new entrants still inramp-up phase, and the changing dynamics of the lithium mineral (spodumene) marketsupport the potential for significant lithium price increases in the near-medium term, inour view.
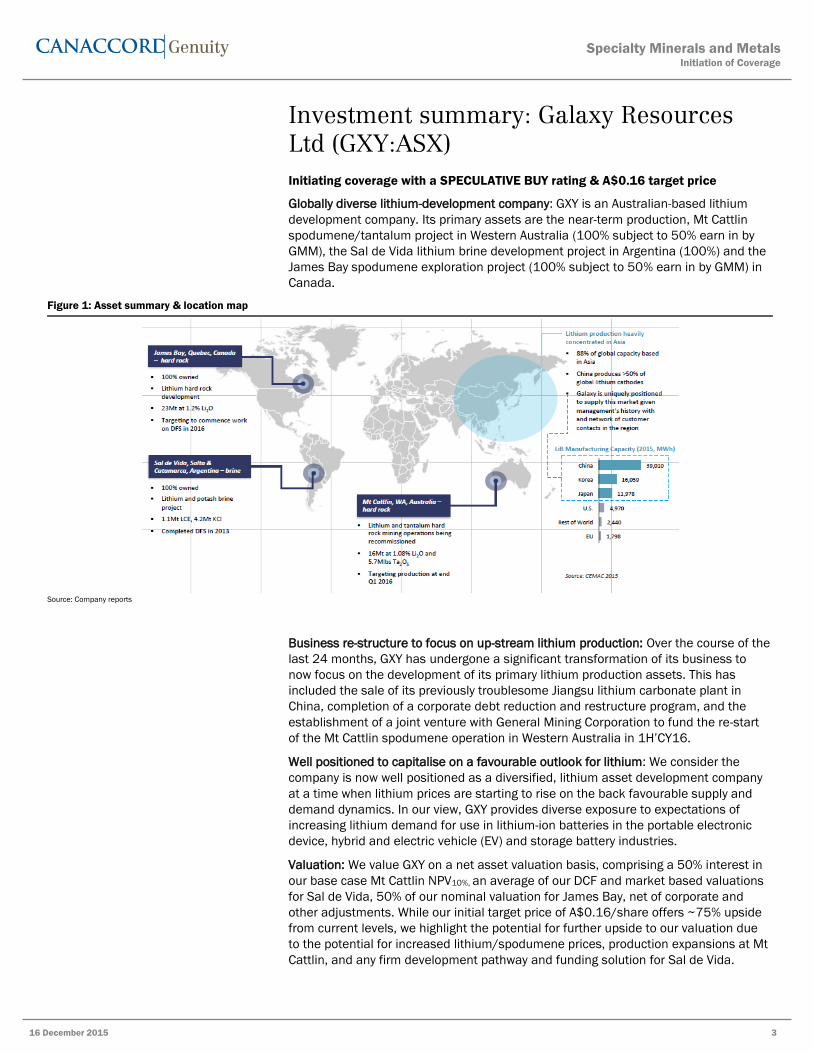
Initiating coverage: Galaxy Resources Ltd (GXY:ASX)• GXY is a globally diverse lithium development company. Primary assets include the
Mt Cattlin spodumene project in WA (subject to 50% earn in by GMM), the Sal de Vidalithium brine project in Argentina (100%) and the James Bay spodumene explorationproject (subject to 50% earn in by GMM) in Canada.
• GXY recently re-structured its business, having recently sold its underperforminglithium carbonate (Li2CO3) plant, reduced/re-structured its corporate debt, andestablished a JV with GMM to re-start production at Mt Cattlin in early 2016. Inaddition, GXY's Sal de Vida brine project offers optionality and potential strategic valuein our view, with options to reduce capex and fund a potential staged development nowbeing assessed.
• We value GXY on a NAV basis comprising 50% of our base case NPV10% for Mt Cattlin,our blended DCF/market based value for Sal de Vida, and exploration, net of corporateand other adjustments. We initiate coverage with a SPECULATIVE BUY rating and A$0.16/sh target price.
Initiating coverage: General Mining Corporation (GMM:ASX)Canaccord Genuity (Australia) Limited was the Lead Manager to the Placement of~40.3 million shares at $0.18 per share to raise ~A$7.3 million in December 2015.• GMM's primary asset is a right to earn 50% of the +15 year, ~110ktpa Mt Cattlin
spodumene project through sole funding a re-start of production (expected early 2016)and cash payments to GXY. GMM is also earning a 50% interest in the James Bayexploration project.
• Previous production issues at Mt Cattlin are being addressed through upgrades of theprocess plant, while project economics benefit from existing infrastructure, low initialstart-up capex (<A$10m), a lower A$ and improved spodumene product pricing.
• We value GMM on a NAV basis, consisting of 50% of our base case NPV10% for MtCattlin, exploration (James Bay), net of corporate and other adjustments. We initiatecoverage with a SPECULATIVE BUY rating and A$0.40/sh target price.
For important information, please see the Important Disclosures beginning on page 44 of this document.
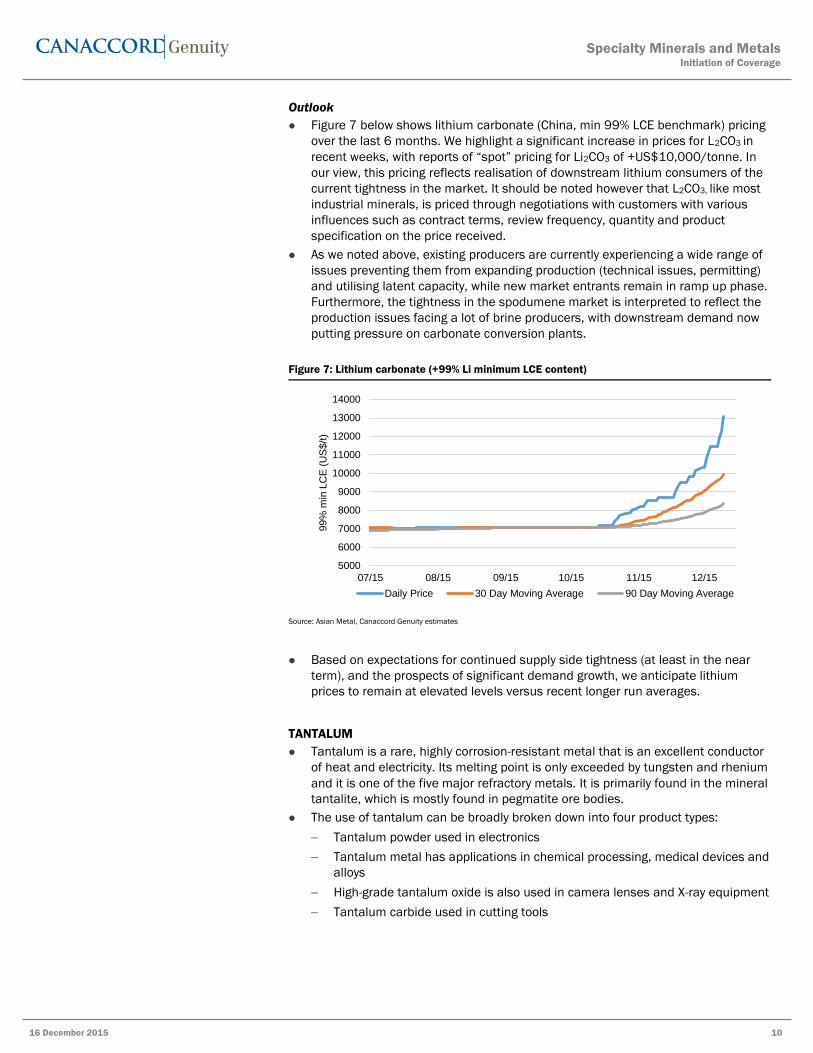
over the last 6 months. We highlight a significant increase in prices for L2CO3 in
recent weeks, with reports of “spot” pricing for Li2CO3 of +US$10,000/tonne. In
our view, this pricing reflects realisation of downstream lithium consumers of the
current tightness in the market. It should be noted however that L2CO3, like most
industrial minerals, is priced through negotiations with customers with various
influences such as contract terms, review frequency, quantity and product
specification on the price received.
As we noted above, existing producers are currently experiencing a wide range of
issues preventing them from expanding production (technical issues, permitting)
and utilising latent capacity, while new market entrants remain in ramp up phase.
Furthermore, the tightness in the spodumene market is interpreted to reflect the
production issues facing a lot of brine producers, with downstream demand now
putting pressure on carbonate conversion plants.
Figure 7: Lithium carbonate (+99% Li minimum LCE content)
Source: Asian Metal, Canaccord Genuity estimates
Based on expectations for continued supply side tightness (at least in the near
term), and the prospects of significant demand growth, we anticipate lithium
prices to remain at elevated levels versus recent longer run averages.
TANTALUM
Tantalum is a rare, highly corrosion-resistant metal that is an excellent conductor
of heat and electricity. Its melting point is only exceeded by tungsten and rhenium
and it is one of the five major refractory metals. It is primarily found in the mineral
tantalite, which is mostly found in pegmatite ore bodies.
The use of tantalum can be broadly broken down into four product types:
Tantalum powder used in electronics
Tantalum metal has applications in chemical processing, medical devices and
alloys
High-grade tantalum oxide is also used in camera lenses and X-ray equipment
Tantalum carbide used in cutting tools
5000
6000
7000
8000
9000
10000
11000
12000
13000
14000
07/15 08/15 09/15 10/15 11/15 12/15
99%
min
LC
E (
US
$/t
)
Daily Price 30 Day Moving Average 90 Day Moving Average
Specialty Minerals and MetalsInitiation of Coverage
16 December 2015 10
11
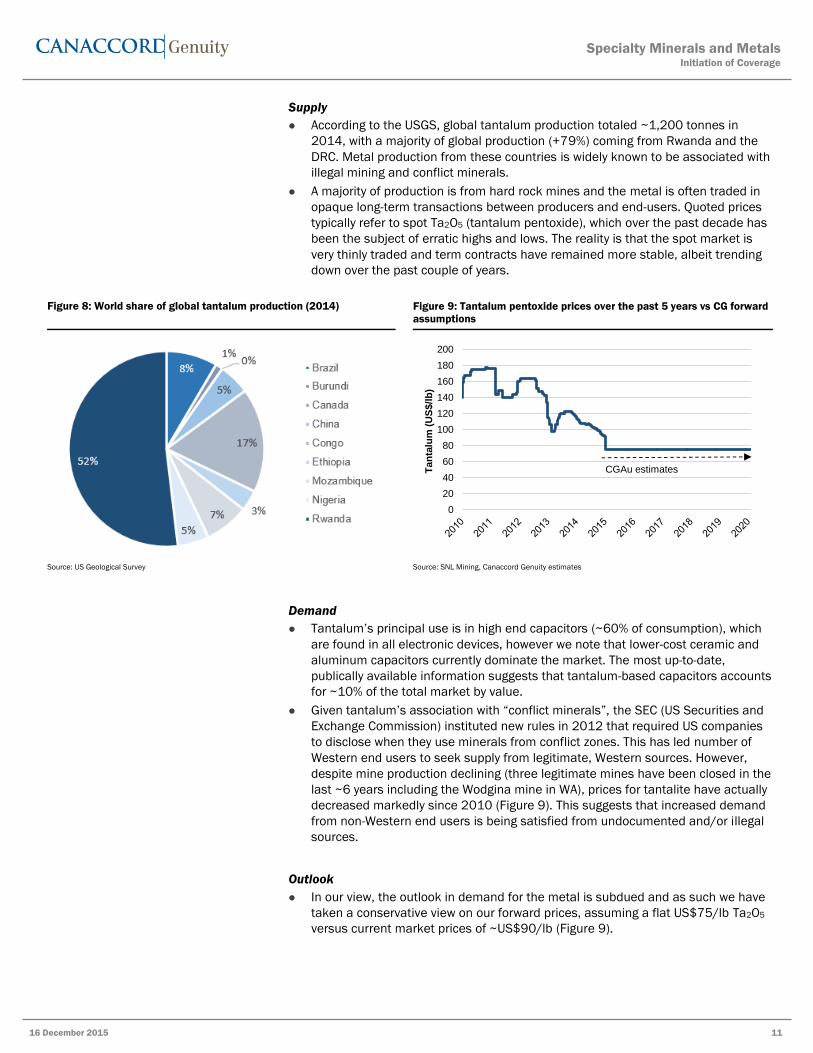
Supply
According to the USGS, global tantalum production totaled ~1,200 tonnes in
2014, with a majority of global production (+79%) coming from Rwanda and the
DRC. Metal production from these countries is widely known to be associated with
illegal mining and conflict minerals.
A majority of production is from hard rock mines and the metal is often traded in
opaque long-term transactions between producers and end-users. Quoted prices
typically refer to spot Ta2O5 (tantalum pentoxide), which over the past decade has
been the subject of erratic highs and lows. The reality is that the spot market is
very thinly traded and term contracts have remained more stable, albeit trending
down over the past couple of years.
Figure 8: World share of global tantalum production (2014) Figure 9: Tantalum pentoxide prices over the past 5 years vs CG forward
assumptions
Source: US Geological Survey Source: SNL Mining, Canaccord Genuity estimates
Demand
Tantalum’s principal use is in high end capacitors (~60% of consumption), which
are found in all electronic devices, however we note that lower-cost ceramic and
aluminum capacitors currently dominate the market. The most up-to-date,
publically available information suggests that tantalum-based capacitors accounts
for ~10% of the total market by value.
Given tantalum’s association with “conflict minerals”, the SEC (US Securities and
Exchange Commission) instituted new rules in 2012 that required US companies
to disclose when they use minerals from conflict zones. This has led number of
Western end users to seek supply from legitimate, Western sources. However,
despite mine production declining (three legitimate mines have been closed in the
last ~6 years including the Wodgina mine in WA), prices for tantalite have actually
decreased markedly since 2010 (Figure 9). This suggests that increased demand
from non-Western end users is being satisfied from undocumented and/or illegal
sources.
Outlook
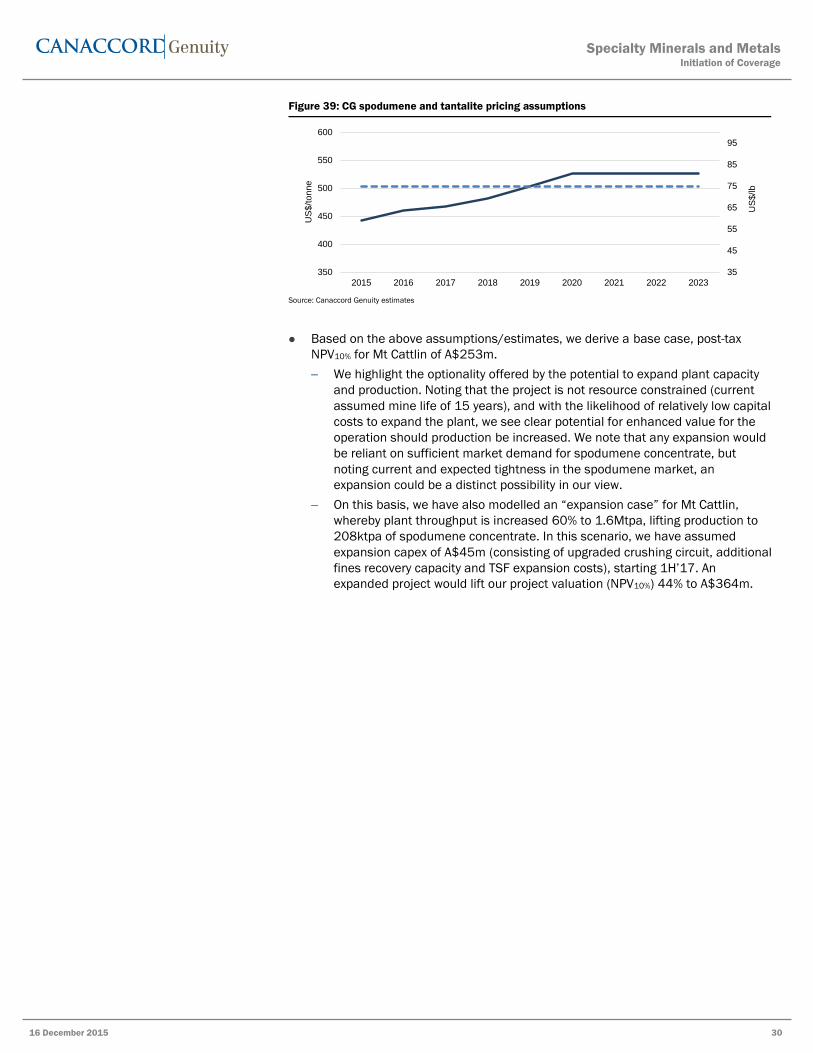
In our view, the outlook in demand for the metal is subdued and as such we have
taken a conservative view on our forward prices, assuming a flat US$75/lb Ta2O5
versus current market prices of ~US$90/lb (Figure 9).
0
20
40
60
80
100
120
140
160
180
200
Tan
talu
m (
US
$/l
b)
CGAu estimates
Specialty Minerals and MetalsInitiation of Coverage
16 December 2015 11
2
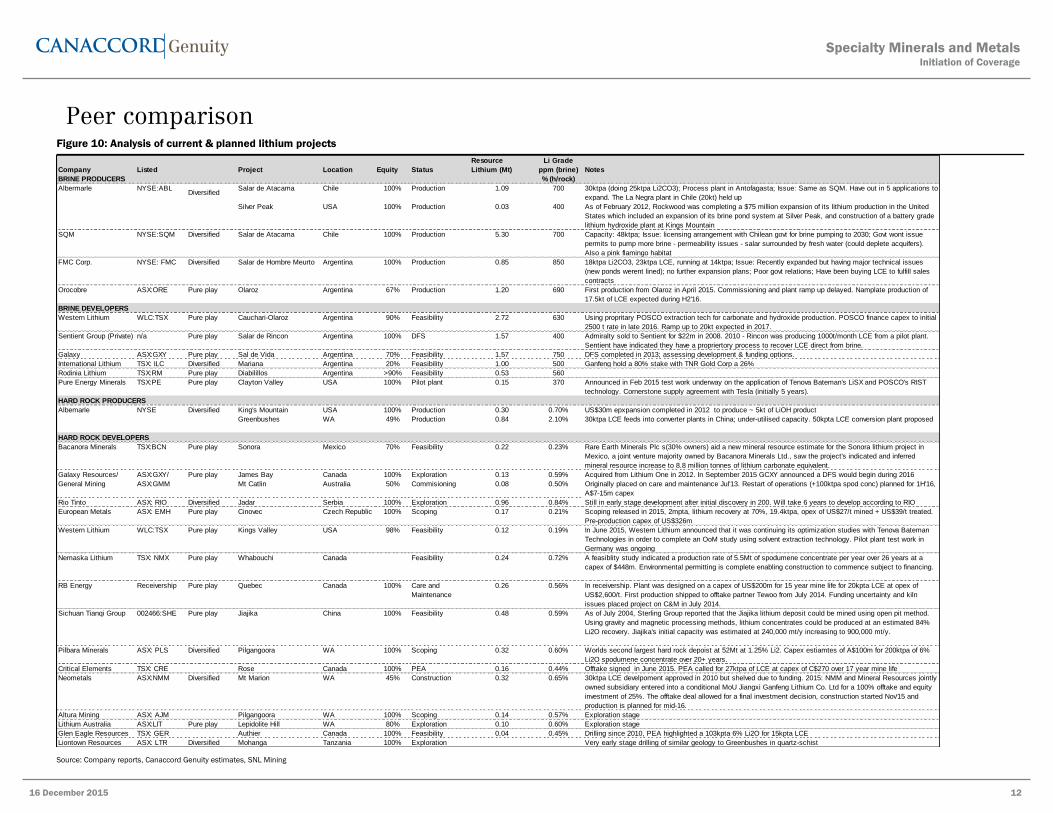
Peer comparison Figure 10: Analysis of current & planned lithium projects
Source: Company reports, Canaccord Genuity estimates, SNL Mining
2.153 5.323 Resource Li Grade
Company Listed Project Location Equity Status Lithium (Mt) ppm (brine) Notes
BRINE PRODUCERS % (h/rock)
Albermarle NYSE:ABLDiversified
Salar de Atacama Chile 100% Production 1.09 700 30ktpa (doing 25ktpa Li2CO3); Process plant in Antofagasta; Issue: Same as SQM. Have out in 5 applications to
expand. The La Negra plant in Chile (20kt) held up
Silver Peak USA 100% Production 0.03 400 As of February 2012, Rockwood was completing a $75 million expansion of its lithium production in the United
States which included an expansion of its brine pond system at Silver Peak, and construction of a battery grade
lithium hydroxide plant at Kings Mountain
SQM NYSE:SQM Diversified Salar de Atacama Chile 100% Production 5.30 700 Capacity: 48ktpa; Issue: licensing arrangement with Chilean govt for brine pumping to 2030; Govt wont issue
permits to pump more brine - permeability issues - salar surrounded by fresh water (could deplete acquifers).
Also a pink flamingo habitat
FMC Corp. NYSE: FMC Diversified Salar de Hombre Meurto Argentina 100% Production 0.85 850 18ktpa Li2CO3, 23ktpa LCE, running at 14ktpa; Issue: Recently expanded but having major technical issues
(new ponds werent lined); no further expansion plans; Poor govt relations; Have been buying LCE to fulfill sales
contracts
Orocobre ASX:ORE Pure play Olaroz Argentina 67% Production 1.20 690 First production from Olaroz in April 2015. Commissioning and plant ramp up delayed. Namplate production of
17.5kt of LCE expected during H2'16.
BRINE DEVELOPERS
Western Lithium WLC:TSX Pure play Cauchari-Olaroz Argentina 90% Feasibility 2.72 630 Using propritary POSCO extraction tech for carbonate and hydroxide production. POSCO finance capex to initial
2500 t rate in late 2016. Ramp up to 20kt expected in 2017.
Sentient Group (Private) n/a Pure play Salar de Rincon Argentina 100% DFS 1.57 400 Admiralty sold to Sentient for $22m in 2008. 2010 - Rincon was producing 1000t/month LCE from a pilot plant.
Sentient have indicated they have a propriertory process to recover LCE direct from brine.
Galaxy ASX:GXY Pure play Sal de Vida Argentina 70% Feasibility 1.57 750 DFS completed in 2013; assessing development & funding options.
International Lithium TSX: ILC Diversified Mariana Argentina 20% Feasibility 1.00 500 Ganfeng hold a 80% stake with TNR Gold Corp a 26%
Rodinia Lithium TSX:RM Pure play Diabilillos Argentina >90% Feasibility 0.53 560
Pure Energy Minerals TSX:PE Pure play Clayton Valley USA 100% Pilot plant 0.15 370 Announced in Feb 2015 test work underway on the application of Tenova Bateman's LiSX and POSCO's RIST
technology. Cornerstone supply agreement with Tesla (initially 5 years).
HARD ROCK PRODUCERS
Albemarle NYSE Diversified King's Mountain USA 100% Production 0.30 0.70% US$30m epxpansion completed in 2012 to produce ~ 5kt of LiOH product
Greenbushes WA 49% Production 0.84 2.10% 30ktpa LCE feeds into converter plants in China; under-utilised capacity. 50kpta LCE conversion plant proposed
HARD ROCK DEVELOPERS
Bacanora Minerals TSX:BCN Pure play Sonora Mexico 70% Feasibility 0.22 0.23% Rare Earth Minerals Plc s(30% owners) aid a new mineral resource estimate for the Sonora lithium project in
Mexico, a joint venture majority owned by Bacanora Minerals Ltd., saw the project's indicated and inferred
mineral resource increase to 8.8 million tonnes of lithium carbonate equivalent.
Galaxy Resources/ ASX:GXY/ Pure play James Bay Canada 100% Exploration 0.13 0.59% Acquired from Lithium One in 2012. In September 2015 GCXY announced a DFS would begin during 2016
General Mining ASX:GMM Mt Catlin Australia 50% Commisioning 0.08 0.50% Originally placed on care and maintenance Jul'13. Restart of operations (+100ktpa spod conc) planned for 1H'16,
A$7-15m capex
Rio Tinto ASX: RIO Diversified Jadar Serbia 100% Exploration 0.96 0.84% Still in early stage development after initial discovery in 200. Will take 6 years to develop according to RIO
European Metals ASX: EMH Pure play Cinovec Czech Republic 100% Scoping 0.17 0.21% Scoping released in 2015, 2mpta, lithium recovery at 70%, 19.4ktpa, opex of US$27/t mined + US$39/t treated.
Pre-production capex of US$326m
Western Lithium WLC:TSX Pure play Kings Valley USA 98% Feasibility 0.12 0.19% In June 2015, Western Lithium announced that it was continuing its optimization studies with Tenova Bateman
Technologies in order to complete an OoM study using solvent extraction technology. Pilot plant test work in
Germany was ongoing
Nemaska Lithium TSX: NMX Pure play Whabouchi Canada Feasibility 0.24 0.72% A feasiblity study indicated a production rate of 5.5Mt of spodumene concentrate per year over 26 years at a
capex of $448m. Environmental permitting is complete enabling construction to commence subject to financing.
RB Energy Receivership Pure play Quebec Canada 100% Care and
Maintenance
0.26 0.56% In receivership. Plant was designed on a capex of US$200m for 15 year mine life for 20kpta LCE at opex of
US$2,600/t. First production shipped to offtake partner Tewoo from July 2014. Funding uncertainty and kiln
issues placed project on C&M in July 2014.
Sichuan Tianqi Group 002466:SHE Pure play Jiajika China 100% Feasibility 0.48 0.59% As of July 2004, Sterling Group reported that the Jiajika lithium deposit could be mined using open pit method.
Using gravity and magnetic processing methods, lithium concentrates could be produced at an estimated 84%
Li2O recovery. Jiajika's initial capacity was estimated at 240,000 mt/y increasing to 900,000 mt/y.
Pilbara Minerals ASX: PLS Diversified Pilgangoora WA 100% Scoping 0.32 0.60% Worlds second largest hard rock depoist at 52Mt at 1.25% Li2. Capex estiamtes of A$100m for 200ktpa of 6%
Li2O spodumene concentrate over 20+ years.
Critical Elements TSX: CRE Rose Canada 100% PEA 0.16 0.44% Offtake signed in June 2015. PEA called for 27ktpa of LCE at capex of C$270 over 17 year mine life
Neometals ASX:NMM Diversified Mt Marion WA 45% Construction 0.32 0.65% 30ktpa LCE develpoment approved in 2010 but shelved due to funding. 2015: NMM and Mineral Resources jointly
owned subsidiary entered into a conditional MoU Jiangxi Ganfeng Lithium Co. Ltd for a 100% offtake and equity
investment of 25%. The offtake deal allowed for a final investment decision, construction started Nov'15 and
Source: Company reports, Canaccord Genuity estimates
Based on the average value of “comparable” transactions, we estimate a market-
based value for SdV of US$92m (A$128m).
Year Asset Acqurier Interest Value (US$m) Implied Project Seller
Value (US$m)
2008 Salar de Rincon Sentient Group 100% 22.0 22.0 Admiralty Res*
2012 Salar de Olaroz Toyota Tsusho 25% 55.0 220.0 Orocobre
2015 Sal de Vida Galaxy Resources 4% 2.5 62.5 KORES
2015 Cauchari-Olaroz Western Lithium 100% 63.0 63.0 Lithium Americas**
Average 91.9
Specialty Minerals and MetalsInitiation of Coverage
16 December 2015 38
28
JAMES BAY LITHIUM PROJECT (GXY 100%; GMM EARNING 50%)
Location & Access
The James Bay lithium pegmatite project is located in north-west Quebec, Canada.
The project is readily accessible by sealed roads and is 381km from the town of
Mattagami which provides access to mining infrastructure and a skilled workforce.
The nearest airstrip to the James Bay project is ~15kms away.
The project is exposed to seasonal extremes common in Canada. Winter (October
to April) temperatures range from -45 to 5 degrees generally associated with
significant snow cover, whereas summer months are typically characterized by
temperatures between 15 to 35 degrees. While not prohibitive to commercial
development, we expect the majority of the feasibility work to be completed in the
summer months.
Figure 50: James Bay location map
Source: Google Maps
Project History
The James Bay deposit was first discovered in 1966 and drill tested by the
Canadian government in 1977, where three diamond holes confirmed the
presence of spodumene mineralisation. Little modern exploration was completed
until Lithium One began drilling in 2008. During a two year drilling campaign
which followed targets based on extensive surface mapping, the presence of wide
pegmatite intersections with several hundred metres of lateral extent and a strike
length of >1km was confirmed. Drilling returned consistent grades throughout the
deposit of 1.2-1.8% Li20 which culminated in release of a maiden resource of
22.2Mt at 1.3% Li2O in November 2010.
Shortly after release of the James Bay maiden resource, GXY signed an agreement
with Lithium One to earn up to 70% in the project through C$3m cash payment
and completion of DFS. In March 2012, GXY and Lithium One ended up merging
and GXY currently has 100% ownership of the project.
GXY currently own 100% of the James Bay project. However, in June 2015, the
company executed an agreement that will allow GMM to earn a 50% stake by
Specialty Minerals and MetalsInitiation of Coverage
16 December 2015 39
29
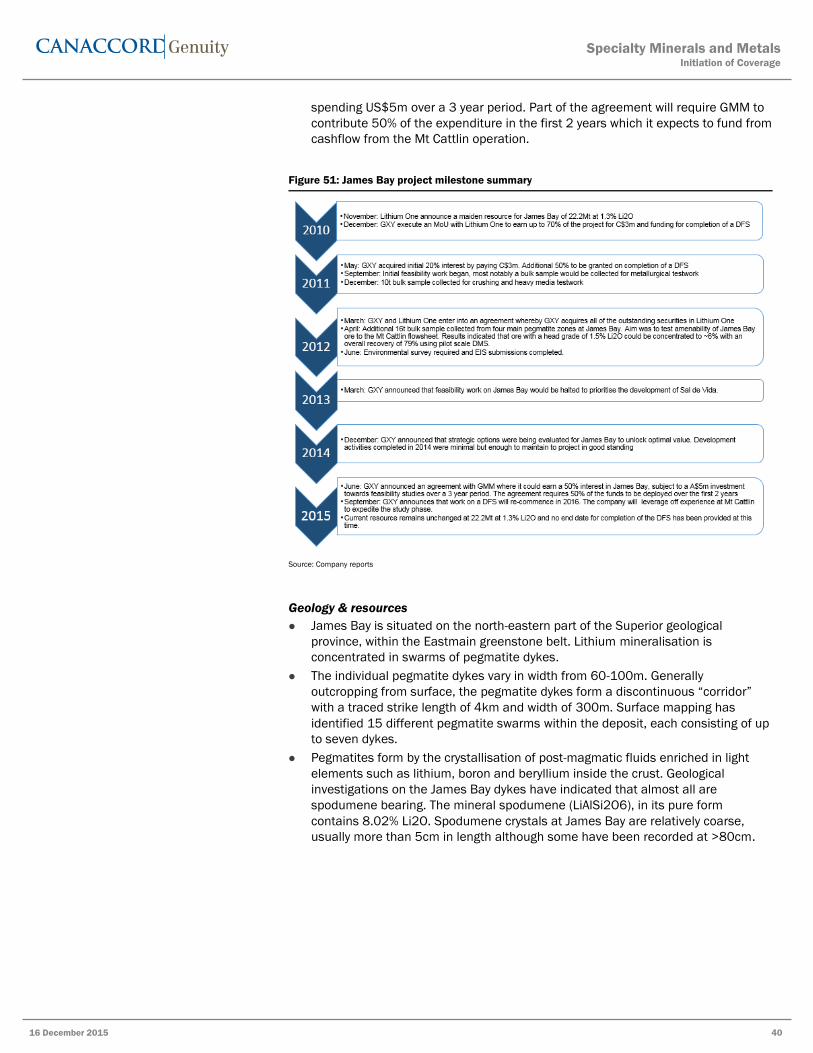
spending US$5m over a 3 year period. Part of the agreement will require GMM to
contribute 50% of the expenditure in the first 2 years which it expects to fund from
cashflow from the Mt Cattlin operation.
Figure 51: James Bay project milestone summary
Source: Company reports
Geology & resources
James Bay is situated on the north-eastern part of the Superior geological
province, within the Eastmain greenstone belt. Lithium mineralisation is
concentrated in swarms of pegmatite dykes.
The individual pegmatite dykes vary in width from 60-100m. Generally
outcropping from surface, the pegmatite dykes form a discontinuous “corridor”
with a traced strike length of 4km and width of 300m. Surface mapping has
identified 15 different pegmatite swarms within the deposit, each consisting of up
to seven dykes.
Pegmatites form by the crystallisation of post-magmatic fluids enriched in light
elements such as lithium, boron and beryllium inside the crust. Geological
investigations on the James Bay dykes have indicated that almost all are
spodumene bearing. The mineral spodumene (LiAlSi2O6), in its pure form
contains 8.02% Li2O. Spodumene crystals at James Bay are relatively coarse,
usually more than 5cm in length although some have been recorded at >80cm.
Specialty Minerals and MetalsInitiation of Coverage
16 December 2015 40
30
Figure 52: James Bay – base line cross section
Source: Company reports
Figure 53: Pegmatite outcrop at James Bay
Source: Company reports
In November 2010, Lithium One announced a maiden resource estimate for
James Bay comprising 22.2 Mt at 1.28% Li2O. The resource was estimated using
a 0.75% Li2O cut off.
Figure 54: James Bay resources (2010)
Source: Company reports
Specialty Minerals and MetalsInitiation of Coverage
16 December 2015 41
31
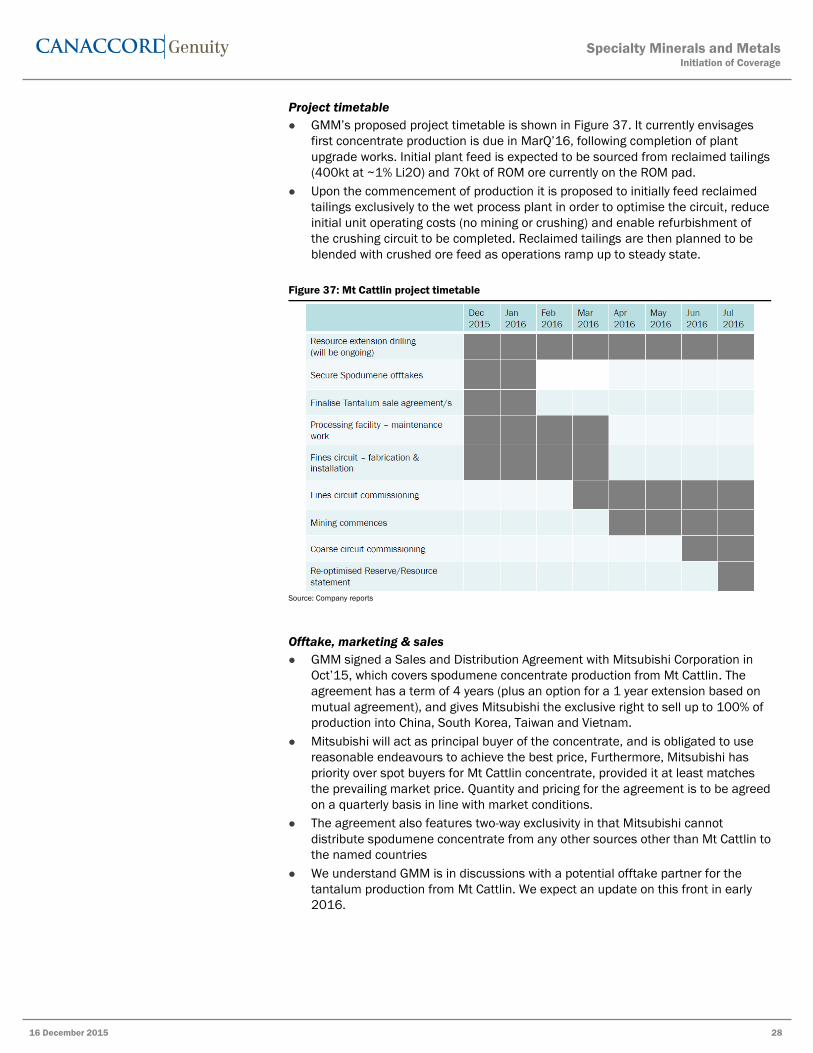
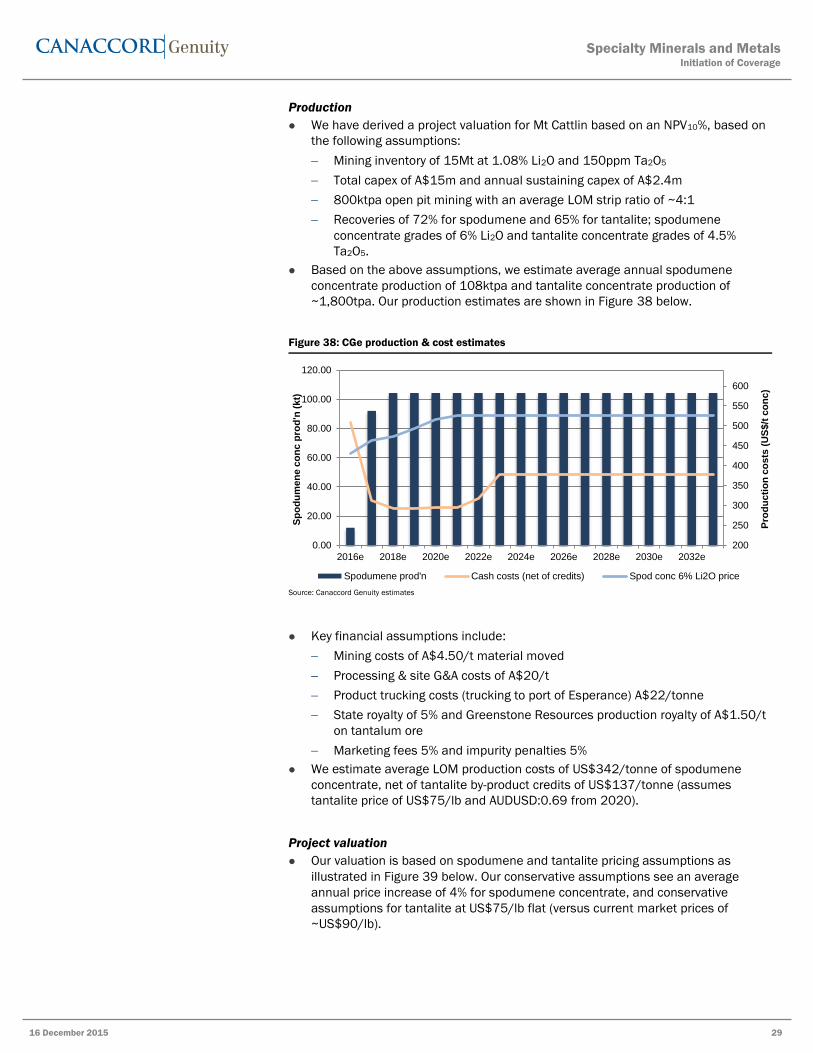
Project development & timetable
GXY has indicated that a DFS will commence in 2016 on the James Bay project.
Given the weather constraints of the Canadian winter, we don’t expect to see field
work meaningfully start before May next year.
At this stage, key deliverables and timing for completion of the DFS are yet to be
outlined. We expect to see follow up drilling to convert Inferred resources into
Measured and Indicated categories, ongoing metallurgical testwork (samples of
James Bay pegmatite are planned to be shipped to Mt Cattlin for processing and
assessment), pit optimizations and advancement of necessary permits to be the
key areas of ongoing work.
While early stage, that geometry of the current resource looks amenable to open
pit mining and we expect the coarse grained pegmatite mineralisation to respond
well to similar processing as Mt Cattlin. Ultimately, given the relative similarity in
orebodies, we expect Mt Cattlin to serve as a blueprint for the development of
James Bay.
Pending the outcomes of a DFS, we expect the scale of the operation to
potentially be similar to that of Mt Cattlin, with the exception of the tantalum
production. The target market would likely be North America which is widely
expected to have a growing appetite for lithium. Given the current earn-in timeline
with GMM, we don’t expect to see a funding and development decision for the
project before late 2018. In terms of priority for GXY, we see James Bay as the
third rank priority, behind Sal de Vida and Mt Cattlin.
Specialty Minerals and MetalsInitiation of Coverage
16 December 2015 42
32
Appendix I – Investment risks
The key investment risks for GXY and GMM include:
Funding risk
As a pre-production company with no material income, both GXY and GMM are reliant
on equity and debt markets to fund feasibility studies and development of their
various projects. We can make no assurances that accessing these markets will be
done without further dilution to shareholders.
Exploration risks
Exploration is subject to a number of risks and can require a high rate of capital
expenditure. Risks can also be associated with conversion of inferred resources and
lack of accuracy in the interpretation of geochemical, geophysical, drilling and other
data. No assurances can be given that exploration will delineate further minable
reserves.
Operating risks
Once in production, the company will be subject to risks such as plant/equipment
breakdowns, metallurgical (meeting design recoveries within a complex flowsheet),
materials handling and other technical issues. An increase in operating costs could
reduce the profitability and free cash generation from the operating assets
considerably and negatively impact valuation. Further, the actual characteristics of an
ore deposit may differ significantly from initial interpretations which can also
materially impact forecast production from original expectations.
Commodity price and currency fluctuations
As with any mining company, GXY and GMM are directly exposed to commodity price
and currency fluctuations. Commodity price fluctuations are driven by many
macroeconomic forces including inflationary pressures, interest rates and supply and
demand factors. These factors could reduce the profitability, costing and prospective
outlook for the business.
Specialty Minerals and MetalsInitiation of Coverage
16 December 2015 43
Appendix: Important DisclosuresAnalyst CertificationEach authoring analyst of Canaccord Genuity whose name appears on the front page of this research hereby certifies that (i) therecommendations and opinions expressed in this research accurately reflect the authoring analyst’s personal, independent andobjective views about any and all of the designated investments or relevant issuers discussed herein that are within such authoringanalyst’s coverage universe and (ii) no part of the authoring analyst’s compensation was, is, or will be, directly or indirectly, related to thespecific recommendations or views expressed by the authoring analyst in the research.Analysts employed outside the US are not registered as research analysts with FINRA. These analysts may not be associated persons ofCanaccord Genuity Inc. and therefore may not be subject to the NASD Rule 2711 and NYSE Rule 472 restrictions on communicationswith a subject company, public appearances and trading securities held by a research analyst account.Target Price / Valuation Methodology:General Mining Corporation Limited - GMMTo reach our A$0.40/sh target price, we value GMM on a net asset valuation basis, comprising a 50% interest in our base case MtCattlin NPV10%, 50% of our nominal valuation for James Bay, net of corporate and other adjustments.Galaxy Resources Limited - GXYTo reach our A$0.16/sh target price, We value GXY on a NAV basis comprising 50% of our base case NPV10% for Mt Cattlin, our blendedDCF/market based value for Sal de Vida, and exploration, net of corporate and other adjustments.Orocobre Limited - OREOur target price is derived from a NAV comprising NPV10% for operating assets, interco loan receivables, net of corporate and otheradjustments.Risks to achieving Target Price / Valuation:General Mining Corporation Limited - GMMThe key investment risks for GMM include:Funding riskAs a pre-production company with no material income, GMM is reliant on equity and debt markets to fund feasibility studies anddevelopment of various projects. We can make no assurances that accessing these markets will be done without further dilution toshareholders.
Exploration risksExploration is subject to a number of risks and can require a high rate of capital expenditure. Risks can also be associated withconversion of inferred resources and lack of accuracy in the interpretation of geochemical, geophysical, drilling and other data. Noassurances can be given that exploration will delineate further minable reserves.
Operating risksOnce in production, the company will be subject to risks such as plant/equipment breakdowns, metallurgical (meeting design recoverieswithin a complex flowsheet), materials handling and other technical issues. An increase in operating costs could reduce the profitabilityand free cash generation from the operating assets considerably and negatively impact valuation. Further, the actual characteristicsof an ore deposit may differ significantly from initial interpretations which can also materially impact forecast production from originalexpectations.
Commodity price and currency fluctuations
As with any mining company, GMM is directly exposed to commodity price and currency fluctuations. Commodity price fluctuations aredriven by many macroeconomic forces including inflationary pressures, interest rates and supply and demand factors. These factorscould reduce the profitability, costing and prospective outlook for the business.Galaxy Resources Limited - GXYThe key investment risks for GXY include:Funding riskAs a pre-production company with no material income, GXY is reliant on equity and debt markets to fund feasibility studies anddevelopment of various projects. We can make no assurances that accessing these markets will be done without further dilution toshareholders.
Exploration risks
Specialty Minerals and MetalsInitiation of Coverage
16 December 2015 44
Exploration is subject to a number of risks and can require a high rate of capital expenditure. Risks can also be associated withconversion of inferred resources and lack of accuracy in the interpretation of geochemical, geophysical, drilling and other data. Noassurances can be given that exploration will delineate further minable reserves.
Operating risksOnce in production, the company will be subject to risks such as plant/equipment breakdowns, metallurgical (meeting design recoverieswithin a complex flowsheet), materials handling and other technical issues. An increase in operating costs could reduce the profitabilityand free cash generation from the operating assets considerably and negatively impact valuation. Further, the actual characteristicsof an ore deposit may differ significantly from initial interpretations which can also materially impact forecast production from originalexpectations.
Commodity price and currency fluctuations
As with any mining company, GXY is directly exposed to commodity price and currency fluctuations. Commodity price fluctuations aredriven by many macroeconomic forces including inflationary pressures, interest rates and supply and demand factors. These factorscould reduce the profitability, costing and prospective outlook for the business.Orocobre Limited - OREThe key investment risks for ORE include: Geological risk -- the actual characteristics of an ore deposit may differ significantly frominitial interpretations and expectations. We note however the resource is extremely large relative to the forecast extraction rates andmine life, somewhat mitigating geological risk. Technical risk -- the construction and operation of brine based lithium carbonate projectsalthough proven is still in its relative infancy and therefore construction and operating risks are inherently elevated. Mitigating this riskis a pilot plant has been operating on site for in excess of 18 months, producing battery grade lithium carbonate. Financing risk -- theability of ORE to fund its portion of the development of the Olaroz project should also be considered a key investment risk. Equity andcredit markets may not be conducive to securing the required funds to complete construction of the project although we consider withthe Capital expenditure and operating risk -- the risk that capital and or operating costs exceed budget and/or exhaust available fundingbefore project completion, and reduce the profitability and free cash generation of the project. Commodity price and exchange rate risk:As with all mining and mineral exploration companies, commodity price and exchange rate risk should also be considered. In particularlithium and lithium carbonate are not exchange-traded commodities and are relatively small markets. Small and illiquid markets can bemore susceptible to wild fluctuations in prices.
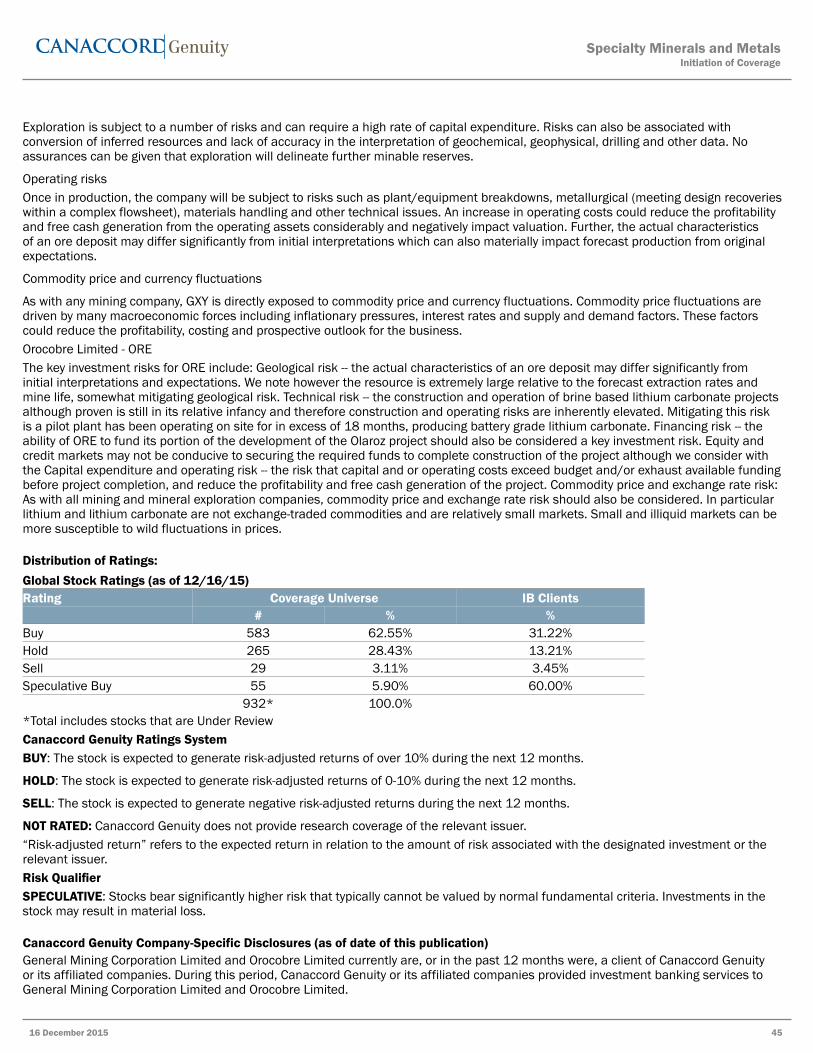
Distribution of Ratings:Global Stock Ratings (as of 12/16/15)Rating Coverage Universe IB Clients
932* 100.0%*Total includes stocks that are Under ReviewCanaccord Genuity Ratings SystemBUY: The stock is expected to generate risk-adjusted returns of over 10% during the next 12 months.
HOLD: The stock is expected to generate risk-adjusted returns of 0-10% during the next 12 months.
SELL: The stock is expected to generate negative risk-adjusted returns during the next 12 months.
NOT RATED: Canaccord Genuity does not provide research coverage of the relevant issuer.“Risk-adjusted return” refers to the expected return in relation to the amount of risk associated with the designated investment or therelevant issuer.Risk QualifierSPECULATIVE: Stocks bear significantly higher risk that typically cannot be valued by normal fundamental criteria. Investments in thestock may result in material loss.
Canaccord Genuity Company-Specific Disclosures (as of date of this publication)General Mining Corporation Limited and Orocobre Limited currently are, or in the past 12 months were, a client of Canaccord Genuityor its affiliated companies. During this period, Canaccord Genuity or its affiliated companies provided investment banking services toGeneral Mining Corporation Limited and Orocobre Limited.
Specialty Minerals and MetalsInitiation of Coverage
16 December 2015 45
In the past 12 months, Canaccord Genuity or its affiliated companies have received compensation for Corporate Finance/InvestmentBanking services from General Mining Corporation Limited and Orocobre Limited .In the past 12 months, Canaccord Genuity or any of its affiliated companies have been lead manager, co-lead manager or co-manager ofa public offering of securities of General Mining Corporation Limited and Orocobre Limited or any publicly disclosed offer of securities ofGeneral Mining Corporation Limited and Orocobre Limited or in any related derivatives.Canaccord Genuity or one or more of its affiliated companies intend to seek or expect to receive compensation for Corporate Finance/Investment Banking services from Galaxy Resources Limited, General Mining Corporation Limited and Orocobre Limited in the next sixmonths.The primary analyst, a member of primary analyst's household, or any individual directly involved in the preparation of this research, hasa long position in the shares or derivatives, or has any other financial interest in Orocobre Limited, the value of which increases as thevalue of the underlying equity increases.
An analyst has visited the material operations of Galaxy Resources Limited, General Mining Corporation Limited and Orocobre Limited.No payment was received for the related travel costs.Canaccord Genuity (Australia) Limited was the Lead Manager and Bookrunner to the Placement to raise A$32.3m in June'15
Jan 2013 Apr 2013 Jul 2013 Oct 2013 Jan 2014 Apr 2014 Jul 2014 Oct 2014 Jan 2015 Apr 2015 Jul 2015 Oct 2015
0.30
0.25
0.20
0.15
0.10
0.05
0.00
Galaxy Resources Limited Rating History as of 12/14/2015
Closing Price Target Price
Buy (B); Speculative Buy (SB); Sell (S); Hold (H); Suspended (SU); Under Review (UR); Restricted (RE); Not Rated (NR)
Jan 2013 Apr 2013 Jul 2013 Oct 2013 Jan 2014 Apr 2014 Jul 2014 Oct 2014 Jan 2015 Apr 2015 Jul 2015 Oct 2015
0.25
0.20
0.15
0.10
0.05
0.00
General Mining Corporation Limited Rating History as of 12/14/2015
Closing Price Target Price
Buy (B); Speculative Buy (SB); Sell (S); Hold (H); Suspended (SU); Under Review (UR); Restricted (RE); Not Rated (NR)
Specialty Minerals and MetalsInitiation of Coverage
16 December 2015 46
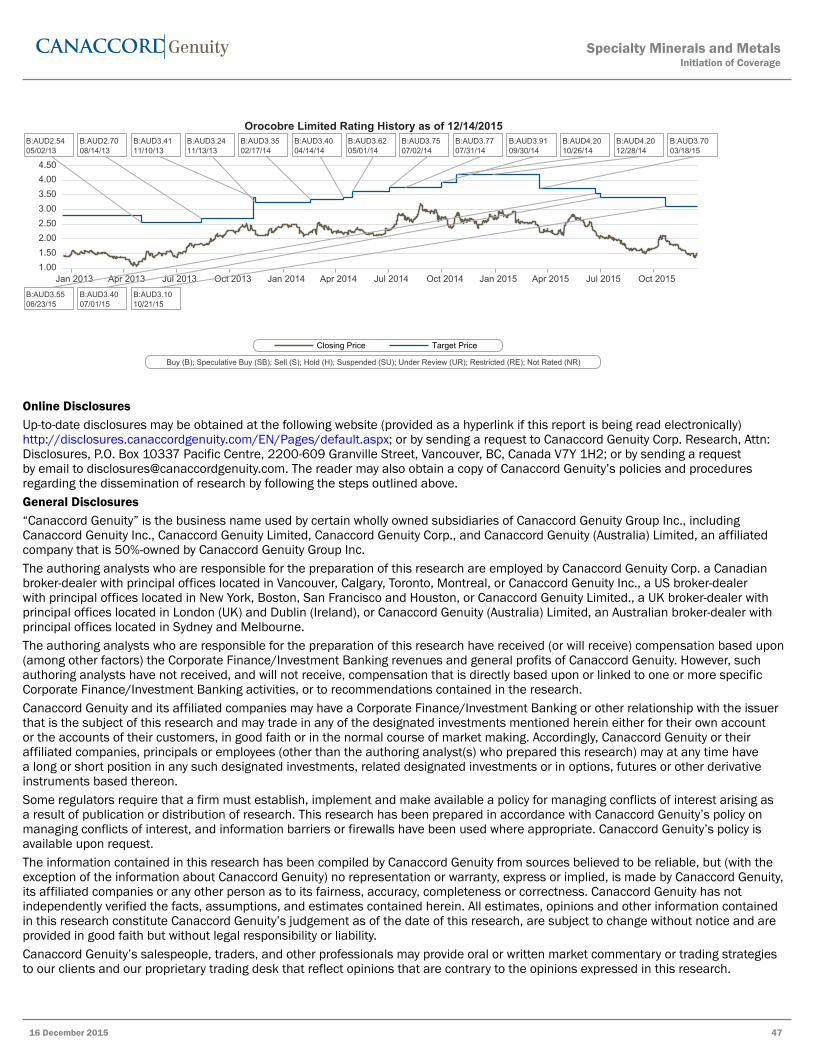
Jan 2013 Apr 2013 Jul 2013 Oct 2013 Jan 2014 Apr 2014 Jul 2014 Oct 2014 Jan 2015 Apr 2015 Jul 2015 Oct 2015
4.504.003.503.002.502.001.501.00
Orocobre Limited Rating History as of 12/14/2015
Closing Price Target Price
Buy (B); Speculative Buy (SB); Sell (S); Hold (H); Suspended (SU); Under Review (UR); Restricted (RE); Not Rated (NR)
B:AUD2.5405/02/13
B:AUD2.7008/14/13
B:AUD3.4111/10/13
B:AUD3.2411/13/13
B:AUD3.3502/17/14
B:AUD3.4004/14/14
B:AUD3.6205/01/14
B:AUD3.7507/02/14
B:AUD3.7707/31/14
B:AUD3.9109/30/14
B:AUD4.2010/26/14
B:AUD4.2012/28/14
B:AUD3.7003/18/15
B:AUD3.5506/23/15
B:AUD3.4007/01/15
B:AUD3.1010/21/15
Online DisclosuresUp-to-date disclosures may be obtained at the following website (provided as a hyperlink if this report is being read electronically)http://disclosures.canaccordgenuity.com/EN/Pages/default.aspx; or by sending a request to Canaccord Genuity Corp. Research, Attn:Disclosures, P.O. Box 10337 Pacific Centre, 2200-609 Granville Street, Vancouver, BC, Canada V7Y 1H2; or by sending a requestby email to [email protected]. The reader may also obtain a copy of Canaccord Genuity’s policies and proceduresregarding the dissemination of research by following the steps outlined above.General Disclosures“Canaccord Genuity” is the business name used by certain wholly owned subsidiaries of Canaccord Genuity Group Inc., includingCanaccord Genuity Inc., Canaccord Genuity Limited, Canaccord Genuity Corp., and Canaccord Genuity (Australia) Limited, an affiliatedcompany that is 50%-owned by Canaccord Genuity Group Inc.The authoring analysts who are responsible for the preparation of this research are employed by Canaccord Genuity Corp. a Canadianbroker-dealer with principal offices located in Vancouver, Calgary, Toronto, Montreal, or Canaccord Genuity Inc., a US broker-dealerwith principal offices located in New York, Boston, San Francisco and Houston, or Canaccord Genuity Limited., a UK broker-dealer withprincipal offices located in London (UK) and Dublin (Ireland), or Canaccord Genuity (Australia) Limited, an Australian broker-dealer withprincipal offices located in Sydney and Melbourne.The authoring analysts who are responsible for the preparation of this research have received (or will receive) compensation based upon(among other factors) the Corporate Finance/Investment Banking revenues and general profits of Canaccord Genuity. However, suchauthoring analysts have not received, and will not receive, compensation that is directly based upon or linked to one or more specificCorporate Finance/Investment Banking activities, or to recommendations contained in the research.Canaccord Genuity and its affiliated companies may have a Corporate Finance/Investment Banking or other relationship with the issuerthat is the subject of this research and may trade in any of the designated investments mentioned herein either for their own accountor the accounts of their customers, in good faith or in the normal course of market making. Accordingly, Canaccord Genuity or theiraffiliated companies, principals or employees (other than the authoring analyst(s) who prepared this research) may at any time havea long or short position in any such designated investments, related designated investments or in options, futures or other derivativeinstruments based thereon.Some regulators require that a firm must establish, implement and make available a policy for managing conflicts of interest arising asa result of publication or distribution of research. This research has been prepared in accordance with Canaccord Genuity’s policy onmanaging conflicts of interest, and information barriers or firewalls have been used where appropriate. Canaccord Genuity’s policy isavailable upon request.The information contained in this research has been compiled by Canaccord Genuity from sources believed to be reliable, but (with theexception of the information about Canaccord Genuity) no representation or warranty, express or implied, is made by Canaccord Genuity,its affiliated companies or any other person as to its fairness, accuracy, completeness or correctness. Canaccord Genuity has notindependently verified the facts, assumptions, and estimates contained herein. All estimates, opinions and other information containedin this research constitute Canaccord Genuity’s judgement as of the date of this research, are subject to change without notice and areprovided in good faith but without legal responsibility or liability.Canaccord Genuity’s salespeople, traders, and other professionals may provide oral or written market commentary or trading strategiesto our clients and our proprietary trading desk that reflect opinions that are contrary to the opinions expressed in this research.
Specialty Minerals and MetalsInitiation of Coverage
Canaccord Genuity’s affiliates, principal trading desk, and investing businesses may make investment decisions that are inconsistentwith the recommendations or views expressed in this research.This research is provided for information purposes only and does not constitute an offer or solicitation to buy or sell any designatedinvestments discussed herein in any jurisdiction where such offer or solicitation would be prohibited. As a result, the designatedinvestments discussed in this research may not be eligible for sale in some jurisdictions. This research is not, and under nocircumstances should be construed as, a solicitation to act as a securities broker or dealer in any jurisdiction by any person or companythat is not legally permitted to carry on the business of a securities broker or dealer in that jurisdiction. This material is prepared forgeneral circulation to clients and does not have regard to the investment objectives, financial situation or particular needs of anyparticular person. Investors should obtain advice based on their own individual circumstances before making an investment decision.To the fullest extent permitted by law, none of Canaccord Genuity, its affiliated companies or any other person accepts any liabilitywhatsoever for any direct or consequential loss arising from or relating to any use of the information contained in this research.For Canadian Residents:This research has been approved by Canaccord Genuity Corp., which accepts sole responsibility for this research and its disseminationin Canada. Canaccord Genuity Corp. is registered and regulated by the Investment Industry Regulatory Organization of Canada (IIROC)and is a Member of the Canadian Investor Protection Fund. Canadian clients wishing to effect transactions in any designated investmentdiscussed should do so through a qualified salesperson of Canaccord Genuity Corp. in their particular province or territory.For United States Residents:Canaccord Genuity Inc., a US registered broker-dealer, accepts responsibility for this research and its dissemination in the United States.This research is intended for distribution in the United States only to certain US institutional investors. US clients wishing to effecttransactions in any designated investment discussed should do so through a qualified salesperson of Canaccord Genuity Inc. Analystsemployed outside the US, as specifically indicated elsewhere in this report, are not registered as research analysts with FINRA. Theseanalysts may not be associated persons of Canaccord Genuity Inc. and therefore may not be subject to the NASD Rule 2711 and NYSERule 472 restrictions on communications with a subject company, public appearances and trading securities held by a research analystaccount.For United Kingdom and European Residents:This research is distributed in the United Kingdom and elsewhere Europe, as third party research by Canaccord Genuity Limited,which is authorized and regulated by the Financial Conduct Authority. This research is for distribution only to persons who are EligibleCounterparties or Professional Clients only and is exempt from the general restrictions in section 21 of the Financial Services andMarkets Act 2000 on the communication of invitations or inducements to engage in investment activity on the grounds that it is beingdistributed in the United Kingdom only to persons of a kind described in Article 19(5) (Investment Professionals) and 49(2) (High NetWorth companies, unincorporated associations etc) of the Financial Services and Markets Act 2000 (Financial Promotion) Order 2005(as amended). It is not intended to be distributed or passed on, directly or indirectly, to any other class of persons. This material is not fordistribution in the United Kingdom or elsewhere in Europe to retail clients, as defined under the rules of the Financial Conduct Authority.For Jersey, Guernsey and Isle of Man Residents:This research is sent to you by Canaccord Genuity Wealth (International) Limited (CGWI) for information purposes and is not to beconstrued as a solicitation or an offer to purchase or sell investments or related financial instruments. This research has been producedby an affiliate of CGWI for circulation to its institutional clients and also CGWI. Its contents have been approved by CGWI and we areproviding it to you on the basis that we believe it to be of interest to you. This statement should be read in conjunction with your clientagreement, CGWI's current terms of business and the other disclosures and disclaimers contained within this research. If you are in anydoubt, you should consult your financial adviser.CGWI is licensed and regulated by the Guernsey Financial Services Commission, the Jersey Financial Services Commission and the Isleof Man Financial Supervision Commission. CGWI is registered in Guernsey and is a wholly owned subsidiary of Canaccord Genuity GroupInc.For Australian Residents:This research is distributed in Australia by Canaccord Genuity (Australia) Limited ABN 19 075 071 466 holder of AFS Licence No234666. To the extent that this research contains any advice, this is limited to general advice only. Recipients should take into accounttheir own personal circumstances before making an investment decision. Clients wishing to effect any transactions in any financialproducts discussed in the research should do so through a qualified representative of Canaccord Genuity (Australia) Limited. CanaccordGenuity Wealth Management is a division of Canaccord Genuity (Australia) Limited.For Singapore Residents:This research is distributed pursuant to 32C of the Financial Advisers under an arrangement between each of the Canaccord Genuityentities that publish research and Canaccord Genuity Singapore Pte. Ltd who is an exempt financial adviser under section 23(1)(d) ofthe Financial Advisers Act. This research is only intended for persons who fall within the definition of accredited investor, expert investoror institutional investor as defined under section 4A of the Securities and Futures Act. It is not intended to be distributed or passed on,directly or indirectly, to any other class of persons. Recipients of this report can contact Canaccord Genuity Singapore Pte. Ltd. (ContactTel: +65 6854 6150) in respect of any matters arising from, or in connection with, the research.
Specialty Minerals and MetalsInitiation of Coverage
All rights reserved. All material presented in this document, unless specifically indicated otherwise, is under copyright to CanaccordGenuity Corp., Canaccord Genuity Limited, Canaccord Genuity Inc or Canaccord Genuity Group Inc. None of the material, nor its content,nor any copy of it, may be altered in any way, or transmitted to or distributed to any other party, without the prior express writtenpermission of the entities listed above.
Specialty Minerals and MetalsInitiation of Coverage