23
Littoral dynamics modelling Filipa Simões de Brito Ferreira de Oliveira Núcleo de Estuários e Zonas Costeiras Departamento de Hidráulica e Ambiente

Littoral dynamics
modelling
Filipa Simões de Brito Ferreira de Oliveira
Núcleo de Estuários e Zonas Costeiras
Departamento de Hidráulica e Ambiente

Outline
• Brief introduction of LNEC-DHA-NEC
• Methodologies for evaluation and testing beach vulnerability &
protection-rehabilitation solutions: general overview
• Applications of Mike – Litpack modelling system at LNEC
• Case study: an application of Litpack

Hydraulics and Environment Department
R&D&I topics cover the whole water cycle:
• Surface and groundwater resources
• Urban, coastal and port engineering
Strategic lines of approach:
• Risk management and safety
• Hydraulic infrastructures
• Environment and aquatic systems
• Urban water
• Information technology applied to water and environment

Estuaries and Coastal Zone Unit
R&D&I areas
• Beach dynamics, protection and rehabilitation
• Management of coastal risks including erosion and flooding
• Morphodynamics and stability of inlets
• Improved design of estuarine and coastal infrastructure
• Maintenance of ports, harbours and navigation channels
• Assessment and prediction of water quality in estuaries
• Prediction and monitoring of oil spills at sea
LNEC | 44
Present SLR = 1 mSLR = 0.23 m SLR = 0.35 m

Methodologies for evaluation and testing
beach vulnerability & protection-rehabilitation solutions
applied at LNEC
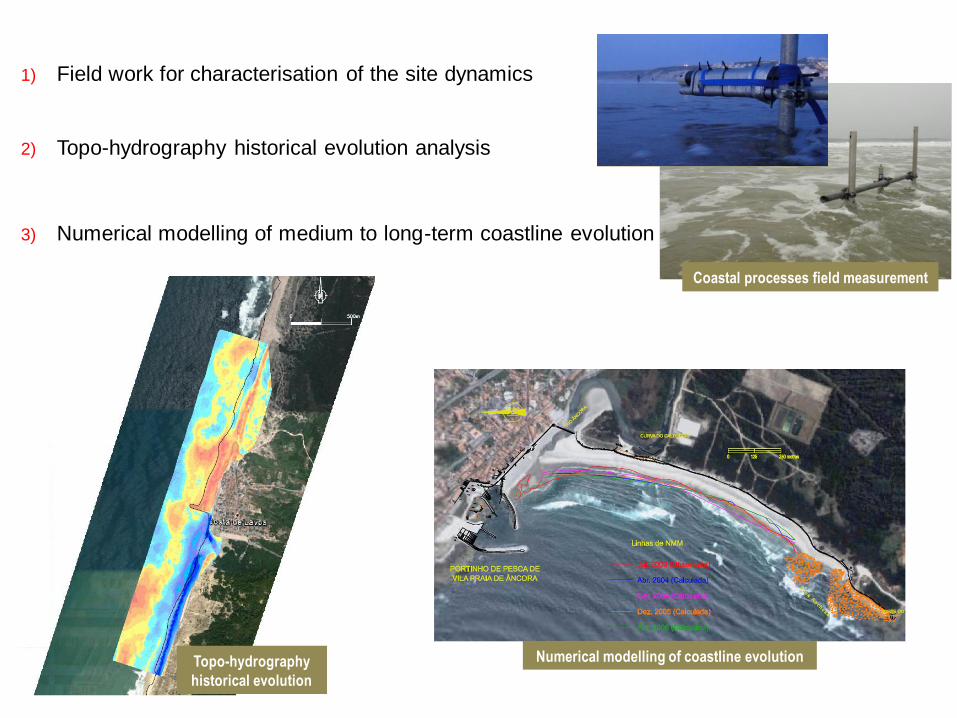
1) Field work for characterisation of the site dynamics
Coastal processes field measurement
Numerical modelling of coastline evolutionTopo-hydrography
historical evolution
2) Topo-hydrography historical evolution analysis
3) Numerical modelling of medium to long-term coastline evolution
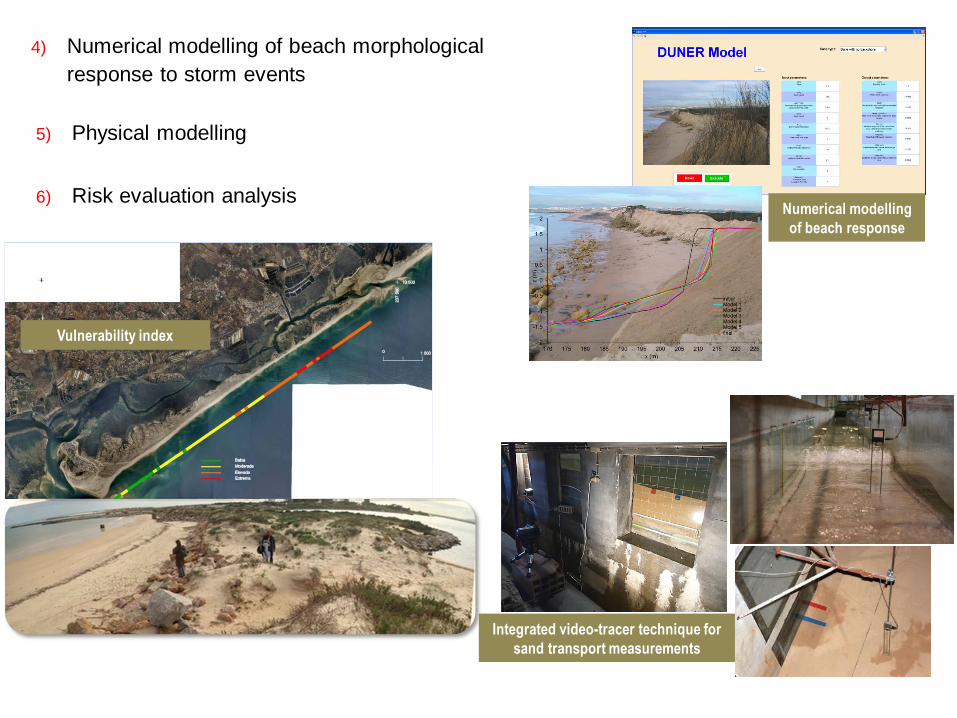
4) Numerical modelling of beach morphological
response to storm events
Vulnerability index
Numerical modelling
of beach response
Integrated video-tracer technique for
sand transport measurements
5) Physical modelling
6) Risk evaluation analysis

Applications of Mike – Litpack modelling system
at LNEC

…in international consultancy projects
Integrated solution for
environmental rehabilitation
of Rodrigo de Freitas lagoon
and Leblon, Ipanema and
Arpoador beaches, Brasil
Rehabilitation of
Hac-Sá beach,
Macau, People's
Republic of China
Detailed Modelling Studies for
Colwyn Bay Coastal Defence
Scheme, United Kingdom
Characterisation of the
coastal dynamics conditions
and impact assessment of
Marina Luanda’s
construction, Angola
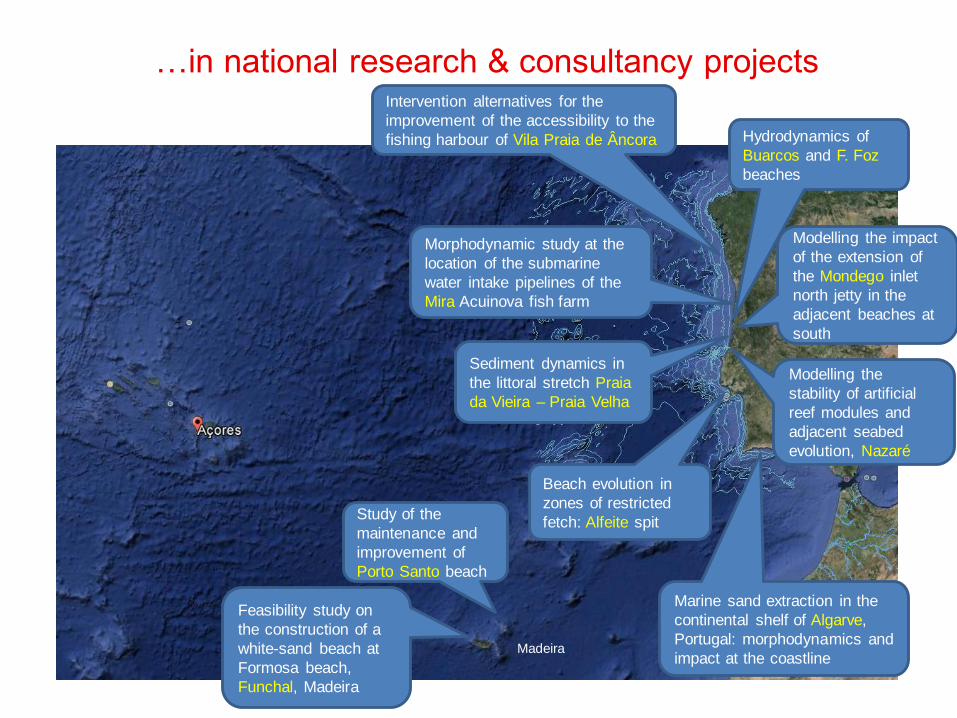
…in national research & consultancy projects
Feasibility study on
the construction of a
white-sand beach at
Formosa beach,
Funchal, Madeira
Study of the
maintenance and
improvement of
Porto Santo beach
Madeira
Intervention alternatives for the
improvement of the accessibility to the
fishing harbour of Vila Praia de Âncora
Sediment dynamics in
the littoral stretch Praia
da Vieira – Praia Velha
Beach evolution in
zones of restricted
fetch: Alfeite spit
Morphodynamic study at the
location of the submarine
water intake pipelines of the
Mira Acuinova fish farm
Marine sand extraction in the
continental shelf of Algarve,
Portugal: morphodynamics and
impact at the coastline
Modelling the impact
of the extension of
the Mondego inlet
north jetty in the
adjacent beaches at
south
Hydrodynamics of
Buarcos and F. Foz
beaches
Modelling the
stability of artificial
reef modules and
adjacent seabed
evolution, Nazaré

Case study: an application of Litpack
Rehabilitation and protection
of Colwyn Bay beach, UK

Rehabilitation and protection of Colwyn Bay beach, UK
Problem
• Process of beach erosion
1946
1990
Impact
• Reduction of beach width
• Beach face and berm lowering
• Coastal defence structures degrading
• Seawall overtopping and consequent flooding of the
promenade
2009

Objectives
• Characterisation of the beach sediment dynamics and its recent
evolution
• Test and evaluate coastal protection solutions based on artificial
beach nourishment and control structures

Methodology

Characterisation of the beach dynamics
Historical evolution
• Average shoreline retreat: 13 m (1956-2007)
• Maximum shoreline retreat: 76 m (1980-1990)
• Foreshore volume loss: 40x103 m3 (2001-2007)
-80.0
-60.0
-40.0
-20.0
0.0
20.0
40.0
60.0
80.0
1 3 5 7 9 11 13 15 17 19 21 23 25 27 29 31 33 35 37 39 41 43 45 47 49 51
transects number
net
sh
ore
lin
e m
ovem
en
t (m
)
1956-1980 1980-1990 1990-2002 2002-2007 1956-2007W E
A

Characterisation of the beach dynamics
Sediment
• Upper foreshore: coarse-grained sands and gravel (D50=0.6-3 mm), poorly sorted (σ > 3)
• Lower foreshore:fine to medium-grained sands (D50=0.2-0.3mm), well sorted (σ ~ 1)
• Particles density: 2.7
Sea level
• Tide: 4<TR<8 m
• Maximum surge observed: 1.02 m

Characterisation of the beach dynamics
Wave climate
• 50% waves Hs<0.25 m and max Hs<3.25 m Mild climate
• Most frequent class is 3<Tz<4 s and max Tz=7.1 s
• 65% of the inshore waves reach from the Northwest quadrant, with
predominance of directions 285<Dir<345
100x103 m3/year
0
20 000
40 000
60 000
80 000
100 000
120 000
140 000
160 000
180 000
200 000
198
6
198
7
198
8
198
9
199
0
199
1
199
2
199
3
199
4
199
5
199
6
199
7
199
8
199
9
200
0
200
1
200
2
200
3
200
4
200
5
200
6
Se
dim
en
t tr
an
sp
ort
(m
3.y
ea
r-1)
Year
Longshore annual transport
West
East
Longshore sediment drift
• Significant interanual variations of the transport potential (52-188 x 103m3.year-1)
Hrms (m)
Above 2.00
1.75 - 2.00
1.50 - 1.75
1.25 - 1.50
1.00 - 1.25
0.75 - 1.00
0.50 - 0.75
0.25 - 0.50
0.10 - 0.25
Below 0.10
C:\D
ocum
ents
and
Set
tings
\FO
livei
ra\M
y D
ocum
ents
\Pro
ject
s_10
\Col
wyn
Bay
\Mod
ellin
g\Li
tdrif
t_ol
d be
ach\
Tra
nspo
rt_1
987c
_orig
inal
sed
imen
t.dfs
0
N
Calm0.10 %
5 %
Sediment balance
Hrms (m)
Above 2.00
1.75 - 2.00
1.50 - 1.75
1.25 - 1.50
1.00 - 1.25
0.75 - 1.00
0.50 - 0.75
0.25 - 0.50
0.10 - 0.25
Below 0.10
C:\
Do
cu
me
nts
an
d S
ett
ing
s\F
Oliv
eira
\My D
ocu
me
nts
\Pro
jects
_1
0\C
olw
yn
Ba
y\M
od
elli
ng
\Wa
ve
clim
ate
\Litco
nv\C
lima
te_
19
87
b.d
fs0
N
Calm35.55 %
5 %
Wave climate

Definition of optimum recharged beach profile
• Long-term submerged profile: two-slope (surf and shoaling) EBP due to the large tidal range
2S-EBP profiles: Berm configuration A
-8
-6
-4
-2
0
2
4
6
0 100 200 300 400 500 600 700
x (m)
h (
m O
D)
C31
C33
C35
C37
EBP, D50=0.75
EBP, D50=0.25
EBP, D50=0.45
ar
r
xxxhC
D
C
hX
xxhA
B
A
hx
,
0,
3
23
23
3
23
23
2S-EBP profiles: Berm configuration B
-8
-6
-4
-2
0
2
4
6
0 100 200 300 400 500 600 700
x (m)
h (
m O
D)
C31
C33
C35
C37
EBP, D50=0.25
EBP, D50=0.45
• Berm designwidth (beach protection; recreational use; recharge economy)
height (sea level frequency of exceedance)

Definition of optimum recharged beach profile
• Berm vulnerability testing: beach response to storm events – numerical modelling Extreme maritime events definition (2 criteria 2 events)
Storm Feb/90
-0.4
-0.3
-0.2
-0.1
0
0.1
0.2
0.3
0.4
1800 1900 2000 2100 2200
Cross-shore distance (m)
Ch
an
ge i
n z
(m
)
-6
-4
-2
0
2
4
6
8
EB
P i
n O
DN
level
(m)
D50=0.25mm, Spreading=1.72 D50=0.45mm, Spreading=2.1D50=0.25mm D50=0.45mm
Main findings:
• Only the 50 m width and 1:100 slope berm revealed enough resilience to prevent direct wave action on the seawall
• Importance of the geometrical spreading for the erosion process

Long-term Shoreline Modelling
• Two long-term coastline evolution numerical models with different characteristics and capacities (complementary)
• Calibration• coastlines (Oct/01, Oct/02, Jul/03, May/04 & Jul/05)
• synoptic hydrodynamic data (wave series & sea level)
• Alternative solutions• 2 solutions of beach nourishment
• 6 solutions of beach nourishment (2.5x10³ m3 for D50=0.25mm) with control structures
3.3x10⁶ m3 for D50=0.25mm 2.2x10⁶ m3 for D50=0.45mm
Classical groynes
Detached breakwaters
Fishtail groynes

Construction of the terminal groyne (eastern end of the frontage)
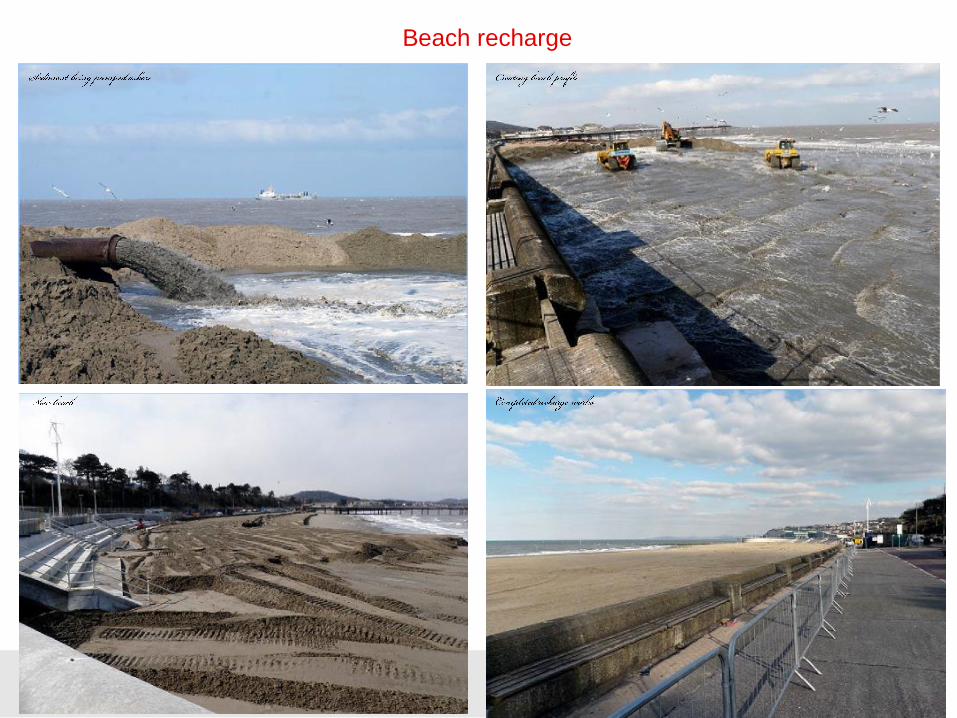
Beach recharge

Thank you for your attention !
2016


