Carolina Population Center University of North Carolina at Chapel Hill 123 West Franklin Street/ Campus Box 8120 / Chapel Hill, North Carolina 27516-2524 August 30, 2012 Michael Park, Sudhanshu Handa University of North Carolina, Chapel Hill, NC USA Contact: [email protected]Robert Darko Osei, Isaac Osei-Akoto Institute of Statistical Social and Economic Research Accra, Ghana Livelihood Empowerment Against Poverty Program Assessment of LEAP Operations
Transcript
Carolina Population Center University of North Carolina at Chapel Hill 123 West Franklin Street/ Campus Box 8120 / Chapel Hill, North Carolina 27516-2524
August 30, 2012
Michael Park, Sudhanshu Handa University of North Carolina, Chapel Hill, NC USA
Institute of Statistical Social and Economic Research Accra, Ghana
Livelihood Empowerment Against Poverty Program Assessment of LEAP Operations
[This page intentionally left blank]
i| Page
Acknowledgements The authors wish to thank Carlos Alviar, Julianna Lindsey and Jane Mwangi of UNICEF and Graham Gass of DFID for useful discussion and guidance, and Mawutor Ablo, William Niyuni and Lawrence Ofori-Addoo for their commitment to the evaluation exercise.
ii| Page
Executive Summary This document reports on the results of the operational module that was fielded as part of the follow-up household survey for the Livelihood Empowerment against Poverty (LEAP) Program impact evaluation. The module contains information on a range of topics related to the administration of the LEAP program, including targeting, communication and information, and payment delivery. For the operational module, the 1504 households from the final longitudinal sample were asked an initial filter question on whether they had heard of LEAP. Of these households, 684 households were aware of the LEAP program, of which 13 percent were from the Institute of Statistical Social and Economic Research (ISSER) sample (i.e. from the comparison group sample). These 684 households were then asked whether they had ever received a LEAP payment, of which 561 had received had received a transfer from the LEAP program and 123 had never received a transfer. Highlights are presented below. Some alleged beneficiaries have not received any transfer. Of the Of 646 LEAP households interviewed in the follow-up, 48 have not heard of the LEAP program. Of the remaining 546 LEAP households that heard of the LEAP program, 52 have not yet received any payment from the LEAP program. In total 100 LEAP households appear not to be in the program or receiving benefits. Households are not receiving all the necessary information regarding the eligibility criteria. LEAP beneficiaries believe that the program is for the old, very poor, sick, and those unable to work. Surprisingly, only 28 percent of LEAP households know that Orphans and Vulnerable Children (OVC) is an eligibility criterion for the LEAP program despite the fact that about 85 percent of all beneficiaries nationwide fall under this criterion. Thus there is a mismatch between the perceived eligibility criteria and the actual eligibility criteria. There remains some confusion about conditionality and payment expiry rules. Of households receiving LEAP payments, 83 percent say that households do not have to follow any rules or conditions, 13 percent say that there are rules or conditions, and 4 percent did not know. Among those who believed there were conditions, the most frequently reported conditions were NHIS and school enrollment of children. Moreover, 24 percent of households don’t know how many days they have before the payments expire, but results show that almost half of the households believe that they should have at least 4-30 days before expiration. Over 95 percent of households felt that how they received information regarding payment was appropriate. In general, 43 percent of the households receive information from a community leader and 14 percent from a Local Organizing Committee (LOC) member. Seventy-six percent of households were informed publicly of their payment, while 24 percent were told in private.
iii| Page
There is no apparent stigma tied with the LEAP program. Of the 561 LEAP households, 96 percent say that the people in the community are aware that they are LEAP. The majority (85 percent) of LEAP households responded that it is not a problem that community members know that they are LEAP beneficiaries.
LEAP beneficiaries are satisfied with service and treatment by payment point staff and LEAP representatives. Overall, most (92 percent) of the households feel that they are happy with treatment at the payment site. Furthermore, 94 percent feel that they are treated well by LEAP representative, which also doesn’t differ by type of beneficiaries. Over 93 percent oh households responded that they did not pay any bribes to payment point or LEAP staff. Only 5 percent have every paid bribes to payment staff during payment pick-up, and 2 percent reported that they could not say. Of the different categories of beneficiaries, widows were the most susceptible to bribes, with 8 percent reporting paying bribes to payment staff before or after payment collection, and 12 percent reporting paying bribes to community member before or after payment collection. Also, bribes were more likely to occur in the Brong Ahafo region. Of the respondents who have paid bribes, almost 60 percent of all bribes being paid are in this region. There is a large variation in the household payment collection practices. In over half the LEAP households (54 percent), the household head collects the transfers. In 22 percent of households, the primary person who collects was a child, grandchild or spouse. However, in 16 percent of the households, it was a non-household member who picked up the payment. About one-quarter of LEAP beneficiaries have had an alternate collect their transfer, implying that this is a useful program rule that beneficiaries take advantage of. Many households are willing to have alternatives to collect payments, but only 53 percent of households have a designated alternate. As expected, households with less mobile beneficiaries are more willing to have an alternative. For example, among handicapped beneficiaries, 78 percent are willing to have an alternate. Of the households that have designated alternative representative to collect LEAP payments, 59 percent are household members and 37 percent are family members that live outside the household. Transportation is not an obstacle to payment collection. About 88 percent of households walk to collect payments. The average time, for the non-zero observations, to collect the payment is 26 minutes. Of the 67 households that do not walk to collect the payment, they pay about 1.88 cedi for transportation costs. This exceeds the amount that they are willing to pay of 0.90 cedis. Most households have received their last payment in January or February of 2012. For 47 percent of the households that have received LEAP payments, the last payment date was February 2012. Twenty-three percent of households received their last payment in January. The remaining households received their last payments in 2011, with the majority receiving last payments in November or December 2011.
iv| Page
There is a large variation in who decides how to use transfers between female and male-headed households. In 55 percent of households, the head of households does not consult with any other members. When disaggregated by gender, female-headed households are more likely to make the decision alone (63 percent) than male-headed households (43 percent). This difference is driven by marital status, as most female-heads are not married. Although the majority of households use the transfers for food, health, and education, households differ in their opinion on who benefits from the program within the household. When asked whether the LEAP transfer is separate from household income, 66 percent say that LEAP transfer is not separate and 33 percent say that it is separate from household income. Of the households that have received LEAP payments, 77 percent say that the entire household benefits from the transfer. Only 3 percent of households feel that the LEAP benefits only OVC, and 16 percent believe that the LEAP only benefits adults.
v| Page
Acronyms DSW Department of Social Welfare ISSER Institute of Statistical Social and Economic Research LEAP Livelihood Empowerment Against Poverty LOC Local Organizing Committee OVC Orphans and Vulnerable Children PSM Propensity Score Matching
vi| Page
Table of Contents
1. Introduction and Background ..................................................................................................... 1
Carolina Population Center University of North Carolina at Chapel Hill 123 West Franklin Street/ Campus Box 8120 / Chapel Hill, North Carolina 27516-2524
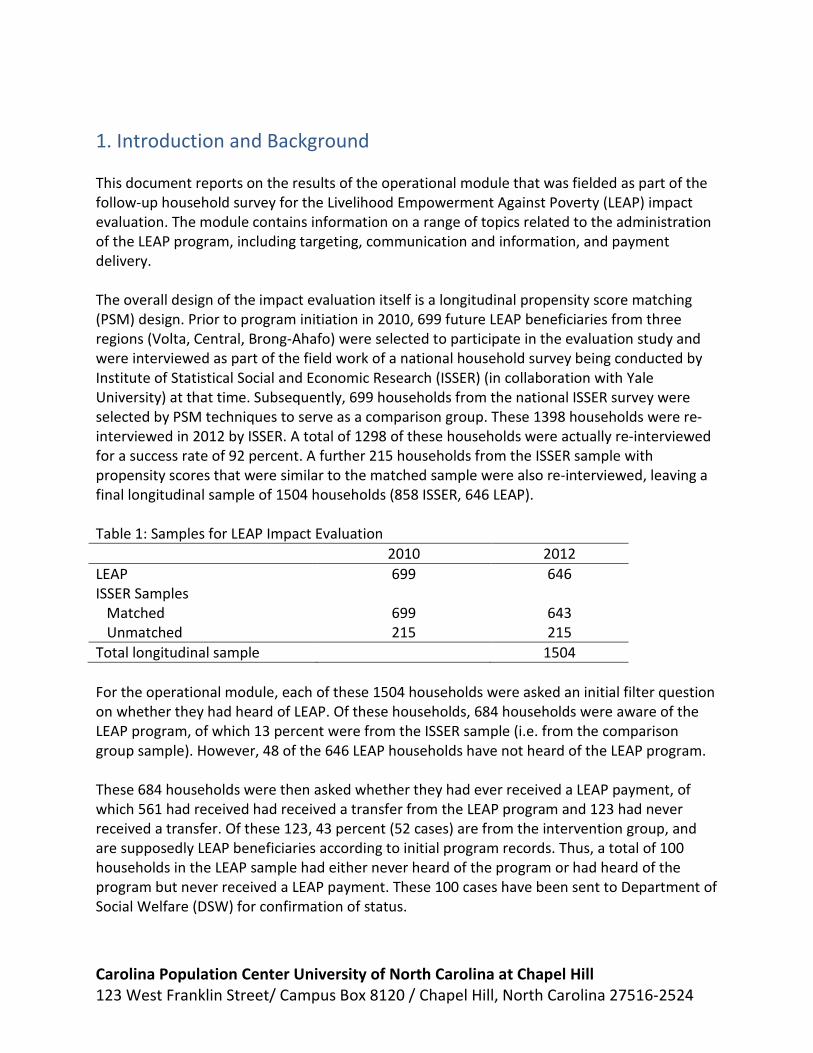
1. Introduction and Background This document reports on the results of the operational module that was fielded as part of the follow-up household survey for the Livelihood Empowerment Against Poverty (LEAP) impact evaluation. The module contains information on a range of topics related to the administration of the LEAP program, including targeting, communication and information, and payment delivery. The overall design of the impact evaluation itself is a longitudinal propensity score matching (PSM) design. Prior to program initiation in 2010, 699 future LEAP beneficiaries from three regions (Volta, Central, Brong-Ahafo) were selected to participate in the evaluation study and were interviewed as part of the field work of a national household survey being conducted by Institute of Statistical Social and Economic Research (ISSER) (in collaboration with Yale University) at that time. Subsequently, 699 households from the national ISSER survey were selected by PSM techniques to serve as a comparison group. These 1398 households were re-interviewed in 2012 by ISSER. A total of 1298 of these households were actually re-interviewed for a success rate of 92 percent. A further 215 households from the ISSER sample with propensity scores that were similar to the matched sample were also re-interviewed, leaving a final longitudinal sample of 1504 households (858 ISSER, 646 LEAP). Table 1: Samples for LEAP Impact Evaluation 2010 2012 LEAP 699 646 ISSER Samples Matched Unmatched
699 215
643 215
Total longitudinal sample 1504 For the operational module, each of these 1504 households were asked an initial filter question on whether they had heard of LEAP. Of these households, 684 households were aware of the LEAP program, of which 13 percent were from the ISSER sample (i.e. from the comparison group sample). However, 48 of the 646 LEAP households have not heard of the LEAP program. These 684 households were then asked whether they had ever received a LEAP payment, of which 561 had received had received a transfer from the LEAP program and 123 had never received a transfer. Of these 123, 43 percent (52 cases) are from the intervention group, and are supposedly LEAP beneficiaries according to initial program records. Thus, a total of 100 households in the LEAP sample had either never heard of the program or had heard of the program but never received a LEAP payment. These 100 cases have been sent to Department of Social Welfare (DSW) for confirmation of status.
Carolina Population Center University of North Carolina at Chapel Hill 123 West Franklin Street/ Campus Box 8120 / Chapel Hill, North Carolina 27516-2524
Meanwhile among ISSER households that had heard of LEAP, there were 15 households that reported actually having received payments from the LEAP program, which would indicate possible contamination of the comparison group. Table 2 summarizes the cases in each of the categories described above. Table 2: Summary of responses to filter questions LEAP (N=646) ISSER (N=858) Never heard of LEAP 48 772 Never received payment from LEAP 52 86 Asked Q3: “Who do you think is eligible for LEAP?” 52 71 Asked remainder of Operations Module 546 15
2. Targeting/Selection Both groups of households were asked about the eligibility criteria of the LEAP program. These results are presented in Figure 1 below. From this graph we can see that most of the LEAP beneficiaries believe that the program is for the old, very poor, sick, and those unable to work. Surprisingly, only 28 percent of LEAP households know that Orphans and Vulnerable Children (OVC) is an eligibility criterion for the LEAP program despite the fact that about 85 percent of all beneficiaries nationwide fall under this criterion. Conversely, the majority of the households who were unaware of the LEAP program correctly identified the eligibility criteria for the LEAP program: OVC, handicapped, old, and very poor. In general, those in the program believe the eligibility criteria are elderly, very poor, inability to work or being sick. In contrast, the non-beneficiaries believe all of the offered criteria are generally applicable. Figure 1: Household targeting and selection
Carolina Population Center University of North Carolina at Chapel Hill 123 West Franklin Street/ Campus Box 8120 / Chapel Hill, North Carolina 27516-2524
Table 3: Percentage of households’ response on LEAP program eligibility Type of Beneficiary Have not received LEAP
transfer (n=123) Have received LEAP
transfer (n=561) OVC 0.57 0.28 Sick 0.60 0.43 Widowed 0.48 0.35 Not able to work 0.55 0.44 Handicapped 0.59 0.14 Old 0.60 0.54 Very poor 0.50 0.46 Fairness and clarity Respondents were asked their opinions on the fairness and clarity of the eligibility criteria. Almost all the households that have ever received LEAP payments “strongly agree” or “agree” that the eligibility criteria are fair (95 percent) and/or clear (97 percent), with no variation by type of beneficiary.
3. Perceptions of program and conditions Social Cohesion Questions were developed to gain insight on social cohesion, especially stigma and treatment by others. Of the 561 LEAP households, 96 percent say that the people in the community are aware that they are LEAP. The majority (85 percent) of LEAP households responded that it is not a problem that community members know that they are LEAP beneficiaries. Conditions and rules Of households receiving LEAP payments, 83 percent say that households do not have to follow any rules or conditions, 13 percent say that there are rules or conditions, and 4 percent did not know. Table 4 presents the percentage of households that replied that there are no LEAP conditions. Of the three main LEAP eligibility criteria, results show that most (86 percent) of OVC, 79 percent of handicapped and 78 percent of households with old beneficiaries believe that there are no conditions for the LEAP program. When households that believe there are rules were asked to list the rules that must be followed, the most common rules were having an NHIS card (95 percent), enrollment in primary school (18 percent), and immunization (11 percent). When these households were asked which household members do these rules apply to, 33 percent stated all children in household, 11 percent replied only OVC, and 11 percent said all household members. Of these households, over 50 percent think that if they do not
Carolina Population Center University of North Carolina at Chapel Hill 123 West Franklin Street/ Campus Box 8120 / Chapel Hill, North Carolina 27516-2524
follow the rules that they will be kicked out of the program. Additional, over 40 percent believe that there is someone that will follow-up to check to see if the families are following the rules. Table 4: Awareness of LEAP conditions Type of Beneficiary (Yes) LEAP
conditions
(NO) LEAP conditions
Don’t know if there are any LEAP conditions
OVC 0.12 0.86 0.02 Sick 0.17 0.77 0.06 Widowed 0.23 0.73 0.05 Not able to work 0.17 0.78 0.06 Handicapped 0.14 0.79 0.07 Old 0.15 0.78 0.07 Very poor 0.18 0.76 0.07 Total 0.13 0.83 0.04
4. Payment systems and operations Respondents were also asked up their experience in receiving the payments. These responses are described below. Table 5 shows who collects the payment from the payment point. In over half the LEAP households (54 percent), the household head collects the transfers. In 22 percent of households, the primary person who collects was a child, grandchild or spouse. However, in 16 percent of the households, it was a non-household member who picked up the payment. These responses are also disaggregated by type of beneficiaries. Not surprisingly, a higher percentage of households with old (19 percent) and handicapped (20 percent) beneficiaries use a non-household member Table 5: Who collects payment from payment point Type of Beneficiary Household Head
Spouse, child,
grandchild Non household
member OVC (n=144) 0.60 0.22 0.10 Sick (n=218) 0.53 0.23 0.17 Widowed (n=183) 0.62 0.13 0.17 Not able to work (n=230) 0.49 0.25 0.17
Handicapped (71) 0.56 0.13 0.20 Old (n=281) 0.49 0.23 0.19 Very poor (n=235) 0.57 0.20 0.18 Total (n=546) 0.54 0.22 0.16
Carolina Population Center University of North Carolina at Chapel Hill 123 West Franklin Street/ Campus Box 8120 / Chapel Hill, North Carolina 27516-2524
Primary caregiver Households were also asked who was the primary care giver specified on the LEAP program ID card. In most of the households receiving LEAP payments is the household head. For eighty percent of widowed households, the head of the household was the primary care giver. In households with old and/or sick beneficiaries, 25 percent of the primary caregivers were the spouse, child, or grandchild of the head of household. Responses on the primary caregiver are presented in Table 6 below. Table 6: Primary caregiver Type of Beneficiary Household Head Spouse, child, grandchild OVC 0.72 0.21 Sick 0.67 0.25 Widowed 0.80 0.15 Not able to work 0.65 0.28 Handicapped 0.69 0.19 Old 0.67 0.25 Very poor 0.72 0.22 Total 0.69 0.23 Payments For 47 percent of the households that have received LEAP payments, the last payment date was February 2012. Twenty-three percent of households received their last payment in January. The remaining households received their last payments in 2011, with the majority receiving last payments in November or December 2011. Figure 2 presents the last reported time households received payments (dark grey) and the number of payments dispersed by DSW (light grey) as provided by LEAP officials. When asked about next payments, 47 percent of households that have received LEAP payments expect the next payment to occur in the next two months. Over 44 percent expect the next payment in the next six months. Finally, 3 percent expect to never receive another payment. Households were also asked how long they expect to keep receiving payments. Almost 89 percent expect to receive payments for longer than 5 years/rest of life. The response to this question disaggregated by type of beneficiary is presented below in Table 7. From this table, we see that the households that believe that they are eligible due to kids or poverty are least likely to believe that the LEAP program would continue for the rest of their lives. This is as expected as children age out of the program. For households that have received LEAP, the mean transfer amount was 60 cedis and the median was 60 cedis. The transfer amounts ranged from .55 cedis to 330 cedis. Figure 3 presents a scatter plot of house size and transfer payment of households receiving LEAP payments.
Carolina Population Center University of North Carolina at Chapel Hill 123 West Franklin Street/ Campus Box 8120 / Chapel Hill, North Carolina 27516-2524
Figure 2: Last reported payments and payment disbursements.
Table 7: how long do they expect to receive LEAP Type of Beneficiary Longer/rest of life OVC 0.86 Sick 0.98 Widowed 0.95 Not able to work 0.94 Handicapped 0.93 Old 0.96 Very poor 0.84 Total 0.89
Carolina Population Center University of North Carolina at Chapel Hill 123 West Franklin Street/ Campus Box 8120 / Chapel Hill, North Carolina 27516-2524
Figure 3: House size and amount of transfer
Transportation Table 8 shows the mode of transportation used by households to collect the LEAP payments. About 88 percent of households walk to collect payments. Of the 67 households that do not walk to collect the payment, they pay about 1.88 cedi for transportation costs. This exceeds the amount that they are willing to pay of 0.90 cedis.
Table 8: mode of transportation Mode of transportation Percentage of
The range of the report time to collect payment is from 0 minutes to 6 hours/10 minutes, with the 64 percent reporting a travel time of 0 minutes. The distribution of average travel time for the non-zero observations is presented below in figure 4. The average time, for the non-zero observations, to collect the payment is 26 minutes, which is well below the accepted time of 14 hours. Of the 542 households with transportation times, 4 percent reported times over two hours. For the purpose of the graph, these households were assigned their mean reported
Carolina Population Center University of North Carolina at Chapel Hill 123 West Franklin Street/ Campus Box 8120 / Chapel Hill, North Carolina 27516-2524
transportation time of 2 hours and 43 minutes to address these few outliers. The graph is presented below, as figure 4.
Figure 4: Distribution of average travel time
Information Table 9 presents the preference of households in receiving information on payment collection by type of beneficiary. In general, 43 percent of the households receive information from a community leader and 14 percent from a Local Organizing Committee (LOC) member. Seventy-six percent of households were informed publicly of their payment, while 24 percent were told in private. Over 95 percent of households felt that how they received information was appropriate. The method of communication preferred by these households is shown below in Table 10, which shows that more households prefer that the information come from the community leader and LOC members. It appears like the actual method of receiving information is consistent with the way that beneficiaries prefer to receive the information. Table 9: How households receive information regarding payment Type of Beneficiary
Carolina Population Center University of North Carolina at Chapel Hill 123 West Franklin Street/ Campus Box 8120 / Chapel Hill, North Carolina 27516-2524
Not able to work 0.53 0.04 0.06 0.12 Handicapped 0.58 0.09 0.03 0.08 Old 0.52 0.09 0.07 0.08 Very poor 0.53 0.05 0.04 0.04 Total 0.43 0.09 0.05 0.14 Table 10: How household prefer to receive information Type of Beneficiary
Community Leader
Govt rep Other Community member
LOC member
OVC 0.47 0.12 0.03 0.11 Sick 0.57 0.04 0.08 0.08 Widowed 0.53 0.10 0.07 0.05 Not able to work 0.53 0.04 0.06 0.12 Handicapped 0.58 0.09 0.03 0.08 Old 0.52 0.09 0.07 0.08 Very poor 0.53 0.05 0.04 0.04 Total 0.53 0.09 0.09 0.16 Households were asked how many days they have to collect the payment from the payment point before it expires. They were also asked how many days that they think is reasonable for the collection of the payment. These responses are presented in Table 11 below. The results show that 64 percent of households believe that they only have 1 day to pickup the payment before it expires. Moreover, 24 percent of households don’t know how many days they have before the payments expire. When compared with the number of days that they believe is reasonable, the results show that almost half of the households believe that they should have at least 4-30 days before expiration. Although 95 percent of households believe that the method that they receive information is appropriate, they are clearly not receiving all the necessary information regarding the collection of payments.
Table 11: Days before payment expires How many days they think
they have before expiration How many days they believe is reasonable
1 day 0.64 0.25 2-3 days 0.09 0.19 4-30 days 0.03 0.48 31-90 days 0.05 Don’t know 0.24 0.01
Carolina Population Center University of North Carolina at Chapel Hill 123 West Franklin Street/ Campus Box 8120 / Chapel Hill, North Carolina 27516-2524
Payment collection practices Table 12 presents the percentage of households that have a designated alternative compared to households that are willing to have an alternative-only 53 percent of households have a designated alternate. In general, a higher percentage of households are willing to have an alternative. As expected, households with less mobile beneficiaries are more willing to have an alternative. For example, among handicapped beneficiaries, 78 percent are willing to have an alternate. Of the households that have designated alternative representative to collect LEAP payments, 59 percent are household members and 37 percent are family members that live outside the household. Additionally, of the households that have alternatives, 58 percent have already sent them to collect payments. Thus, about one-quarter of LEAP beneficiaries have had an alternate collect their transfer, implying that this is a useful program rule that beneficiaries take advantage of. Table 12: Households that have designated alternatives to collect LEAP payments Type of Beneficiary Have alternatives Willing to have alternatives OVC 0.38 0.54 Sick 0.65 0.77 Widowed 0.55 0.61 Not able to work 0.58 0.73 Handicapped 0.63 0.78 Old 0.57 0.65 Very poor 0.53 0.64 Total 0.53 0.59 When asked whether they feel safe when collecting the payments, 92 percent of beneficiaries feel that it is safe to collect the payment, presented in Table 13. There is no difference by type of beneficiaries. Of the households that have sent an alternative to pick up payments, 93 percent feel that it is safe, which supports the reasoning that households using alternatives are due to mobility versus security issues. Overall, most (92 percent) of the households feel that they are happy with treatment at the payment site. When broken down by beneficiaries, satisfaction does not differ by type of beneficiaries. Furthermore, 94 percent feel that they are treated well by LEAP representative, which also doesn’t differ by type of beneficiaries. Overall, 90 percent of households receiving LEAP payments are happy with the payment method at the payment point. These results demonstrate that the service at the payment point and the LEAP representatives is satisfactory and meets the expectations of the beneficiaries.
Table 13: Perception of payment services Yes
Feel safe collecting payment 0.92 Happy with treatment by payment point staff 0.92
Happy with treatment by LEAP staff 0.94
Carolina Population Center University of North Carolina at Chapel Hill 123 West Franklin Street/ Campus Box 8120 / Chapel Hill, North Carolina 27516-2524
Happy with current payment method 0.90 Table 14 shows other payment options suggested by the households. An estimated 80 percent recommended no changes to the payment option. The two main suggested options include payment at home (8 percent) and commercial banks (6 percent).
Table 14: Suggested payment options Type of Beneficiary
Rural banks
Payment at home
OVC 0.10 0.10 Sick 0.04 0.10 Widowed 0.05 0.07 Not able to work 0.06 0.10
Handicapped 0.13 0.07 Old 0.05 0.08 Very poor 0.04 0.11 Total 0.06 0.08
Questions were asked to gauge whether LEAP beneficiaries are susceptible to paying bribes at various times. Responses include yes, no and can’t say. In most cases, LEAP beneficiaries replied that they did not pay bribes before, during, or after receiving the transfer. Over 93 percent responded that they did not pay any bribes to payment point staff during the collection of the transfer. Only 5 percent have every paid bribes to payment staff during payment pick-up, and 2 percent reported that they could not say. When asked about bribes to the payment point staff before or after collection of the payment, 95 percent replied no, and 5 percent replied that they had paid a bribe. Surprisingly, the majority of households that have paid bribes are happy with the payment methods. Of the different categories of beneficiaries, widows were the most susceptible to bribes, with 8 percent reporting paying bribes to payment staff before or after payment collection, and 12 percent reporting paying bribes to community member before or after payment collection. Bribes were more likely to occur in the Brong Ahafo region. Of the respondents who have paid bribes, almost 60 percent of all bribes being paid are in this region. Moreover, 91 percent of those that could not say whether they paid a bribe were in this region. These results were presented in the table below. Table 15: Have you ever paid a bribe to payment point staff before or after payment collection Yes No Can’t say
Carolina Population Center University of North Carolina at Chapel Hill 123 West Franklin Street/ Campus Box 8120 / Chapel Hill, North Carolina 27516-2524
Central Region 0.36 0.24 0.09 Volta Region 0.04 0.12 0.00 Brong Ahafo Region 0.60 0.64 0.91 Total 25 505 11 The communities in the central region where households reported paying bribes in the central region are Dabir, Adugyaa, Ansamanso, Bukuruso, Pepekrom, and Pewodie. Jukwa Kro is the only community in the central region, where households could not say whether they paid a bribe. In the Brong Ahafo region, communities where bribes were reported are Mo-Line, Nwoase, Prang, Yeji, Dorbor, Hani, 55, and 239. Communities where they could not say include Gruman-Li, Kawampe, Tagwana, Yeji, Hani, and Nsuhunu.
5. Use of transfers Figure 5 displays the main items that the transfers are used for in the households. The majority of households responded that they use the transfers for food, health, and education
Households were also asked how they decide on using the transfers. In 55 percent of households, the head of households does not consult with any other members. When disaggregated by gender, female-headed households are more likely to make the decision alone (63 percent) than male-headed households (43 percent).
Carolina Population Center University of North Carolina at Chapel Hill 123 West Franklin Street/ Campus Box 8120 / Chapel Hill, North Carolina 27516-2524
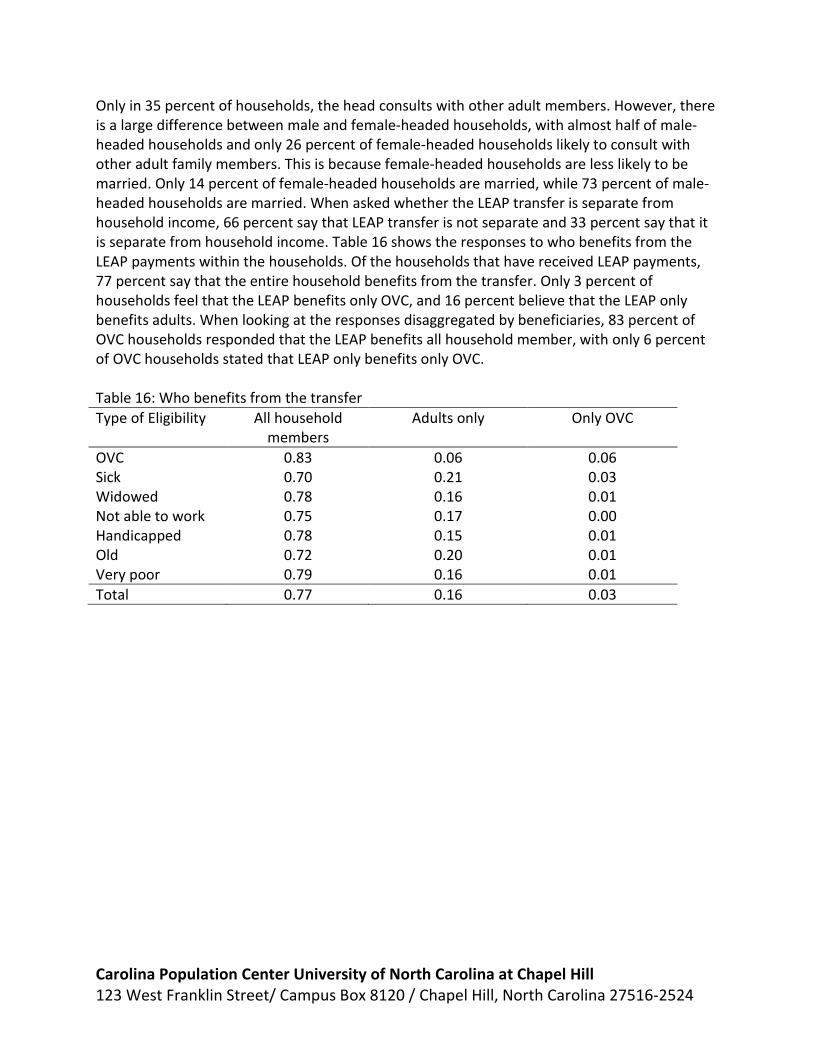
Only in 35 percent of households, the head consults with other adult members. However, there is a large difference between male and female-headed households, with almost half of male-headed households and only 26 percent of female-headed households likely to consult with other adult family members. This is because female-headed households are less likely to be married. Only 14 percent of female-headed households are married, while 73 percent of male-headed households are married. When asked whether the LEAP transfer is separate from household income, 66 percent say that LEAP transfer is not separate and 33 percent say that it is separate from household income. Table 16 shows the responses to who benefits from the LEAP payments within the households. Of the households that have received LEAP payments, 77 percent say that the entire household benefits from the transfer. Only 3 percent of households feel that the LEAP benefits only OVC, and 16 percent believe that the LEAP only benefits adults. When looking at the responses disaggregated by beneficiaries, 83 percent of OVC households responded that the LEAP benefits all household member, with only 6 percent of OVC households stated that LEAP only benefits only OVC. Table 16: Who benefits from the transfer Type of Eligibility All household
members Adults only Only OVC
OVC 0.83 0.06 0.06 Sick 0.70 0.21 0.03 Widowed 0.78 0.16 0.01 Not able to work 0.75 0.17 0.00 Handicapped 0.78 0.15 0.01 Old 0.72 0.20 0.01 Very poor 0.79 0.16 0.01 Total 0.77 0.16 0.03
Carolina Population Center University of North Carolina at Chapel Hill 123 West Franklin Street/ Campus Box 8120 / Chapel Hill, North Carolina 27516-2524
6. Summary of Main Results and Programmatic Guidance Many supposed beneficiaries have never received a payment. The database of program beneficiaries may need to be validated.
• Among the 646 LEAP households interviewed, 48 have not heard of the LEAP program. Of the remaining 546 LEAP households that heard of the LEAP program, 52 have not yet received any payment from the LEAP program. In total 100 LEAP households appear not to be in the program or receiving benefits.
There is a need to improve knowledge among LEAP beneficiaries regarding eligibility, conditions, and rules of the LEAP program.
• Households are not receiving all the necessary information regarding the eligibility criteria. LEAP beneficiaries believe that the program is for the old, very poor, sick, and those unable to work. Surprisingly, only 28 percent of LEAP households know that OVC is an eligibility criterion for the LEAP program despite the fact that about 85 percent of all beneficiaries nationwide fall under this criterion. In general, those in the program believe the eligibility criteria are elderly, very poor, inability to work or being sick.
• There remains some confusion about conditionality and payment expiry rules. Of households receiving LEAP payments, 83 percent say that households do not have to follow any rules or conditions, 13 percent say that there are rules or conditions, and 4 percent did not know. Among those who believed there were conditions, the most frequently reported conditions were NHIS and school enrollment of children. Moreover, 24 percent of households don’t know how many days they have before the payments expire, but results show that almost half of the households believe that they should have at least 4-30 days before expiration.
Flexibility in payment collection is appreciated and used by LEAP beneficiaries. Costs associated with payment pick-up are minimal. There is little evidence of bribery, though when it is reported, widows are most at risk.
• There is a large variation in the household payment collection practices. In over half the LEAP households (54 percent), the household head collects the transfers. In 22 percent of households, the primary person who collects was a child, grandchild or spouse. However, in 16 percent of the households, it was a non-household member who picked up the payment.
• About one-quarter of LEAP beneficiaries have had an alternate collect their transfer, implying that this is a useful program rule that beneficiaries take advantage of. Many households are willing to have alternatives to collect payments, but only 53 percent of households have a designated alternate. As expected, households with less mobile
Carolina Population Center University of North Carolina at Chapel Hill 123 West Franklin Street/ Campus Box 8120 / Chapel Hill, North Carolina 27516-2524
beneficiaries are more willing to have an alternative. For example, among handicapped beneficiaries, 78 percent are willing to have an alternate. Of the households that have designated alternative representative to collect LEAP payments, 59 percent are household members and 37 percent are family members that live outside the household.
• Transportation is not an obstacle to payment collection. About 88 percent of households walk to collect payments. The average time, for the non-zero observations, to collect the payment is 26 minutes, which is well below the accepted time of 14 hours. Of the 67 households that do not walk to collect the payment, they pay about 1.88 cedi for transportation costs. This exceeds the amount that they are willing to pay of 0.90 cedis.
• Over 93 percent of households responded that they did not pay any bribes to payment point or LEAP staff. Only 5 percent have every paid bribes to payment staff during payment pick-up, and 2 percent reported that they could not say. Of the different categories of beneficiaries, widows were the most susceptible to bribes, with 8 percent reporting paying bribes to payment staff before or after payment collection, and 12 percent reporting paying bribes to community member before or after payment collection. Also, bribes were more likely to occur in the Brong Ahafo region. Of the respondents who have paid bribes, almost 60 percent of all bribes being paid are in this region
The majority of households use the transfers for food, health, and education, but households differ in their opinions on who benefits from the program within the household.
• Although the majority of households use the transfers for food, health, and education, households differ in how the transfers are used within the household. When asked whether the LEAP transfer is separate from household income, 66 percent say that LEAP transfer is not separate and 33 percent say that it is separate from household income. Of the households that have received LEAP payments, 77 percent say that the entire household benefits from the transfer. Only 3 percent of households feel that the LEAP benefits only OVC, and 16 percent believe that the LEAP only benefits adults.
• There is a large variation in who decides how to use transfers between female and male-headed households. In 55 percent of households, the head of households does not consult with any other members. When disaggregated by gender, female-headed households are more likely to make the decision alone (63 percent) than male-headed households (43 percent). Only in 35 percent of households, the head consults with other adult members. However, there is a large difference between male and female-headed households, with almost half of male-headed households and only 26 percent of female-headed households are likely to consult with other adult family members due to marital status.
There is a need for better monitoring of payment disbursements.
Carolina Population Center University of North Carolina at Chapel Hill 123 West Franklin Street/ Campus Box 8120 / Chapel Hill, North Carolina 27516-2524
• Most households have received their last payment in January or February of 2012. For 47 percent of the households that have received LEAP payments, the last payment date was February 2012. Twenty-three percent of households received their last payment in January. The remaining households received their last payments in 2011, with the majority receiving last payments in November or December 2011.
Carolina Population Center University of North Carolina at Chapel Hill 123 West Franklin Street/ Campus Box 8120 / Chapel Hill, North Carolina 27516-2524