r .'._ 'i'i t i i. i t- iif '¡- i ¡-\ i" Presentation COMPASS LEXECON lmpact assessment of a 550 Emission Performance Standard - A study for EURELECTRIC Preliminary results 7 September 2OL7 Work in Progress
Transcript
r .'._ 'i'i t i i. i t- iif '¡-
i ¡-\ i"
Presentation
COMPASS LEXECON
lmpact assessment of a 550 Emission PerformanceStandard - A study for EURELECTRIC
Preliminary results
7 September 2OL7
Work in Progress
CONTENTS
STLt.Jy cotrtext and cblectivrsProiect iinreiineApproach ancl r,ruiti criteria frarnel¡ci'k for ÊPS lmpact assessffìentMnclellÌng approachKer¡ mo<q:oo c
lnrpact on rnstalied capacitv io*se vs peak)lmpaci 0n gas criìsumpilOnimpacr t:n CtZ eìr¡ssiorìslmpêcl ün ilûwer price and energy cûsiìrnpact on capacity price and capacliy cost
Annex 1
Annex 2
Annex 3
i rJfv!p455 t Ë.xË,:.(]l.l i
lntroductionaa.. "..
COMPASS I-EXECON' , . . . . I O'
a
COMPASS LEXECON 2
INTRODUCTION - STUDY CONTEXT AND OBJECTIVES
As part of its proposal fora new Electricity Regulation, the EurCIpean Cornmission introduces an EmissionPerformance Standard (550 g CO2/kWh)forgeneration capacity participatrng in capacity mechanisms. Suchthreshold will apply to existing plants 5 years after entry into force of the Regulation (Art. 73.4) and to newplants imrnediately at the entry into force,
ln orderto inform the Furopean energy policy debate, EURELECTRIC has appointed Compass Lexecon toperform an independent impact assessment of the 550 EPS in European power and capacity markets.
The service will be provided through a detailed analysis of the irrrpact of the introduction of the EPS incapacity mechanism performed as foilow"
-2 scenarios: i / ihe CM scenarfo assumes that ali countries modelied have a wliolesale power market wirh arrarket wide CM; Notethat this CM scenario does therefore represent a hypothetical scenario and rts resultsshould therefore not be interpreted as berng representative of future developmerrts
2 I The 550 EPS scertorio assurnes that ali countries nrodelled have a wholesaie power rnarketwith a market wide Clvl with an Emission Performance Standard (550 g CO2lkWh)
2O2A to 2040 time horizon with a 5 years granularity (202A, 2025,2030, 2035, 2040); and
-2 regíons: Western and Eastern region.
Nofe thot the scensrios and assumptians do not represent the views of EURELECTRIC members.
The EPS impact assessment relies on the counterfactual approach which considers two scenarios....¡ Reference CM scenario: National market wide capacity markets remunerating all necessary capacity¡ 550 EPS scenario: National capacity markets remunerating only eligible capacity under the EPS
... and assesses the impact on a set of criteria along three dimensions:¡ Generation capacity
Eligible capacity defin itionThermal capacity outlook and increase stranded cost risk
r Security of supplylmpact on gas imports / gas network reinforcementSecurity of Supply impact
I DecarbonisatíonCO2 emission reductionCO2 abatement cost
¡ Competitiveness and costs:Power priceCapacity price
This slíde deck presents the key results of the analysis in the next section, whilst the appendices provide the completedescription of the modelling approach and assumptions.
5COMPASS LEXECON
WORK IN PROGRESS
IMPACT ASSESSMENT: NET PRESENT VALUE BASED MODELLINGAPPROACHTwo scenarios are modelled to perform the EPS impact assessment
t Reference CM scenarioNational capacity marketRemunerating all necessary capacityldentical optimisation process for all plants
Optimisation in the Reference scenarioand in 550 EPS scenario for eligible plants
¡ 550 EPS scenarioNational capacity marketRemuneratÍng only eligibie capacityOptimisation díffers depending on the CM eligibility of plants
Optimisation in 550 EPS scenario for ineligible plants
+
6
Reliability standard Reliability standard
lnstalled capacityu ireme nt
Energy revenue
relnstalled capacity
uirement
Energy revenue
re
re5technoloEconomics of thermal
¡IPV
Iteration oncapacity
whileensuring
reliability andeconomics'
Iteration oncapacity
whileensuring
reliability andeconomics "
iesNpV technoloEconomicl of thermal
COMPASS LEXTCÛN * Reliability and economic iterative process assumes perfect foresight from ali market participants
550 EPS IMPACT - SUMMARY OF KEY MESSAGES
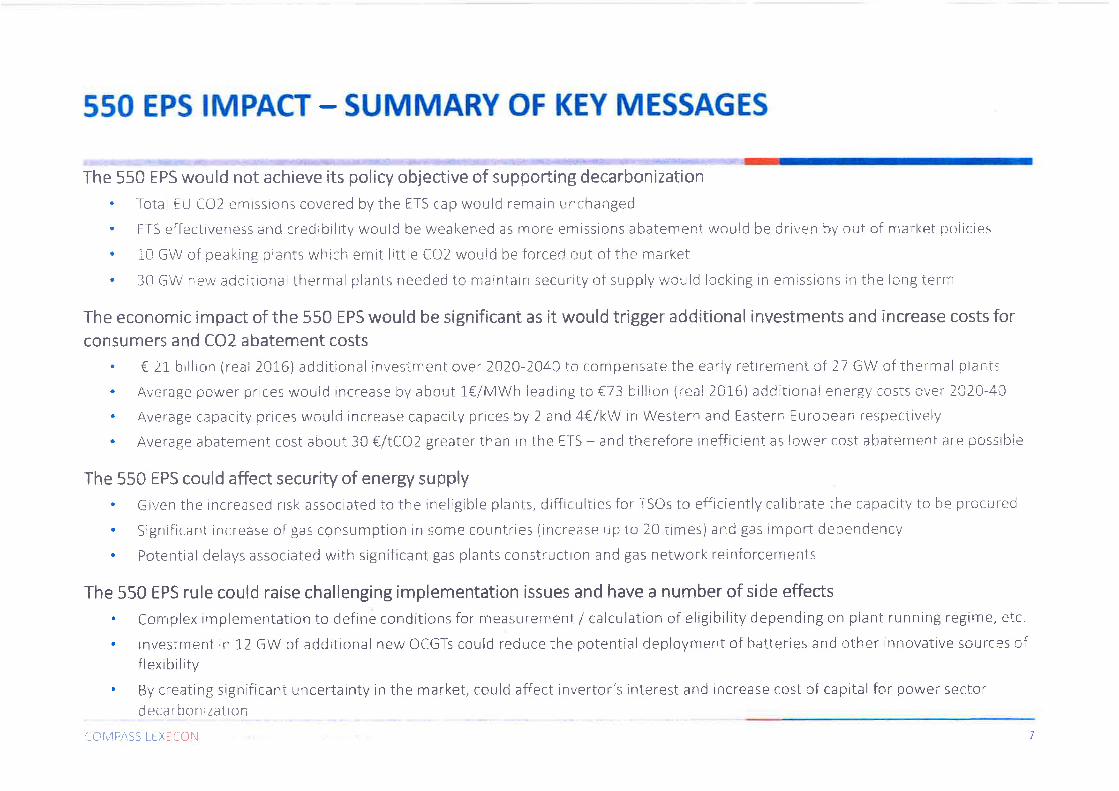
The 550 FPS would not achieve its policy objective of supporting decarbonization. Totai ËtJ CO2 emissrons covered bythe ETS cap would remain unchanged
' ËI5 effectrveness and credrbility wouid be i¡¡eakened as more emissions abatement would be driven by out of mari<et poiicies. 10 GW of ceaking plants which emit lirtie CO2 would be fclrced out of the market. 30 GW new adciitionai thermal plants needeo to maintarr, tsçili-it! of supply i¡rculd locking in emrssions in the lcng iern
The econornic impact of the 550 EPS would be significant as ít would tr¡gger additional investments and increase costs fCIr
consumers and co2 abatement costs. € 21 brilion (real 20i"6) additional investment over 2A2O-ZA4} to compensate the eai-ly retirement cf 27 GW of thermal plantl. Average power pr'rces wouid increase bV about 1€lMWh ieading to €73 billion (real 2û1-6) additior¡al energy costs ûver 2020-4,3. Average capacity prices woulcl rncrease capacity prices by 2 and 4€/kW in Western and Eastern Ëuropean respectively. Average abatement cost about 30 €/tCO2 greater than in the ETS - and therefore inefficient as lower cost abatement are possiirle
The 550 ËPS could affect secur¡ty of energy supply' Given the increasecj rrsk assocrated to the ineiìgible plarrts, difficulties for rsOs to effrciently calibrate ihe capacitv to be procureci. Significant increase of gas censumption in sorïe countries {increase rjp tû 20 iimes) and gas import depenclency. Potential delays associated with significant gas plants constructron and gas network reinforcemenis
The 550 EPS rule could raise challenging implementat¡on issues and have a number of side effests. Complex implementation to define conditions for measurernent / calculation of eligibility depending on plant runntng regime, etc
' lnvestment in 12 GW of additional new OCGTs could reciuce the potential deployment of Llatterres and other innovative sources offlexibility
' By creâting significant uncertainty in the market, could affect invertor's interest and lncrease cost of capital for power sectord eca rbon ization
r-crvlPASS t ËXr{ûf!
WORK IN PROGRES5
I pact on Europeanpower sector COMPASS LEXECON
. . . o r Oo
ao... !. ¡
a550 EPs ¡
8COMPASS LEXECON
WORK IN PROGRESS
550 EPS IMPACT ON CAPACIW _ SIGNIFICANT UNcERTAINTY oN THEDEFINITION OF ELIGIBLE UNITS
CO2 emissions per technology subtypes COZ emissions calculation
ñ
ìcrcï
old rctd 2
RecentNewccs
O¡d 1
old 2
Rerent
400 600 800 1000 1200 i400 1600
FPS 550
Kev:Eligible to capacity paymentlncreased emissions due to running regirnelneligible to capacity payment
t The CO2 emissions per technology subtypes is calculated asfollow:
I As shown on the chart, an Emission Performance Standard of550 eCOZ/kWhe would impact:
r Baseload plants:* All coal-fired plants;* All lignite-fired plants; and
- Old CCGTs and boilers characterized by low efficiencies
r Peaking plants:- All oil-fired plants; and
- Old OCGTs characterized by low efficiencies
Comment: Using the nameplate efficiency ís a conservativemetric regardíng real CO2 emissions, as the running regime andsize of the plant could have a negative effect on the operationalefficiency, and materially increase the CO2 emissions per KWhe.
NOte: (1) As shown on the chart, the test including modelled emissions vsnameplate emissions for the potential plants at risk show the resilience ofthe above definition.
(2): Only electricity generation is considered in the eligibilíty
550 EPS IMPACT ON THERMAL BASELOAD CAPACIW - UNEVENIMPACT AS COUNTRIES IN THE EASTERN REGION GENERALLY MORE AFFECTEDlneligible vs eligible installed baseload capacity, 202t
r Gas eligibie . Gas ineligibleCoal ineligible ¡ Coal Biofuel eligible
Ratio of ineligible capacity over baseload thermal capacity (%)^7039ooËHs0qr!o40rögr30û'20
10
^3039zsËo9.20t!o9 4Co rJ=G8to
ir lnel¡gible capacity to be shut down by 2025under standard assumptions of lifetime
?r :r-ji--¡
4)i
61,6:---¡,----t
,.
'..,.,.i'
i4"8
5 3 4 rì.ù6
--l
FR0
AT
t.1tr
BE DK ES IT LU NL PT DE
WEST
r Gas eligible.: Gas ineligible
Coal inetigible
illneligible capacity to be shut down by2025 under standard assumptions oflifetime
23tl--ìril___,ì.'.
t.:.:.
' ''.1
.', ;¡.1¡
Or.
978.4 I !ì?,
I
4.i I tg. ¿3n
fìl
5
0
'.t {.i 1l 1.1 i 3
BG CZ HU LT
{ üt'll.¿\ss [8"{ii i.)f,i
ËE GR HR
EAST
LV PL RO SI SK
i0
WORK IN PROGRËss550 EPS IMPACT ON THERMAL BASELOAD CAPACITY IN WESTERNEUROPE - NEW INVESTMENTS NEEDED TO CoMPENSATE FoR EARLYCLOSU RES
Base therrnal capacity : CM Scenario 2CI20 - 2040 550 EPS compared to CM : Annuai capacity impact
l5i60
r.,al []I
2020 2t25¡ Exist¡ne Gas Etrgibie,4 [x,sting Soiid Fuel ' tneligibleI Nevr Base
20t0 2035 2û40¡./ Existrng Gas . Ineìigibie
Ixisting Sclid Fuel - Extension
0!.-,-
2û20 2025
Existrng SolrC Fuel L,xtens¡r ¡l.l Éxistrng Gas - ineligil":leI New Bäse
2t3,J 2035 2040
I Exrstrng Ga: Êrrgrbleã Ëxistrng Solicl Ëuel lneligii;le
-lË
lå
f#///ffi
10
- i2f-.)
(9ì- :¡n.:Go xrlU¡o0)ÂnõOJ
ô /,!1
IvUñõU(umoo
5I T:
1Ð
¿{)
150
550 EPS would impact baseload capacity and require about 13 GW of additional new ínvestments in the western region as the ineligiblebaseload plants would face limitations in (i) refurbishrnent, (ii) normal operation lifetime, and {iii} life extension.
>F 1 GW less capacrty would be refurbished;r 1 GW of capacity would close ahead of normal closure date;F As a result, comparing to the CM scenario an additional l-3 GW of new thermal baseload plants would be required
Potenî!ãl Lipsrde irrìpact oiìeirgible plants
(,o\4pAss t-Fxttf l"l '1" 1
WORK IN PROGRËSs550 EPS ¡MPACT ON THERMAL BASELOAD CAPACITY IN EASTERNEUROPE - SIGNIFICANT NEW INVESTMENTS NEEDED AS LIFE EXTENSIoN oRREFURBISHMENT ARE NOT ECONOMIC WITHOUT CAPACITY REMUNERATION
ßaseload thermal capacity: CM Scenario 2020 - 2040
550 EPS would impact strongly baseload capacity in the eastern region and would typically anticipate the new investment requirements byabout a decade:. Compared to the CM scenario an additional 7 GW of new thermal baseload pants would be required :
r 3 GW iess capacity would be refurbished to carry on oper-ation;r 1 GW of capacity would close ehead of normal closure date;i Oniy limited life extension would be economrc leading to 7 GW of arrticipated closure;'r As a resr¡lt an additronal 7 GW of new thernral baseloaci pants would be required tc replace the closing capacity.
Poten{ið{ ripsrde ilt¡:act r.rn
eiigible planrs
C(-r l'i,t PASS L Ë X [ [l ¡,] L2
WORK IN PROGRESS
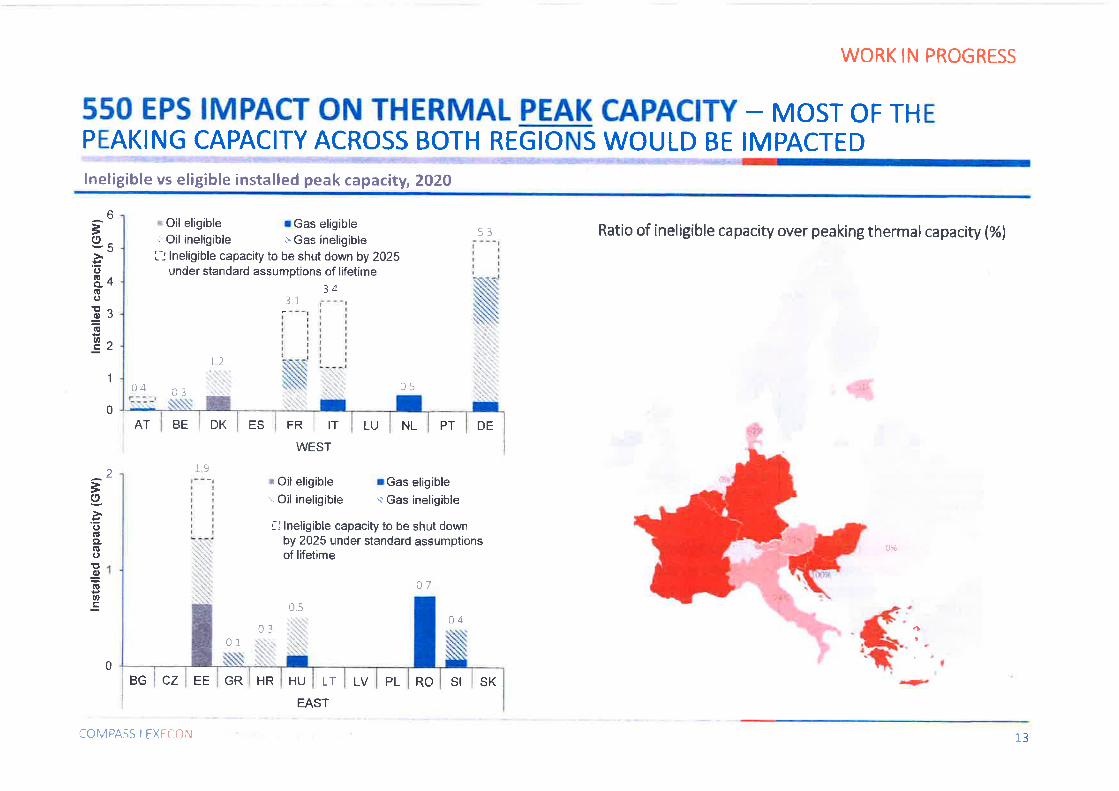
550 EPS IMPACT ON THERMAL PEAK CAPACIW - MosT oF THEPEAKING CAPACITY ACROSS BOTH REGIONS WOULD BE IMPACTEDlneligible vs eligible installed peak capacity, 2O2O
r Oil eligible r Gas eligible: Oil ineligible ;'Gas ineligible
L.: lneligible capacity to be shut down by 2025under standard assumptions of lifetime
34
Ratio of ineligible capacity over peaking thermalcapacity (%)
*r,{#
Èo'õt!CL(úoEg(!o!
6
5
4
3
2
clIIIII
I
ItItt
t1
FR
t----ltl¡lttItIttltltt12
1
0
U)
IT LU NL PT DE
WEST
r Oil eligible rGas eligible.: Oil ineligible r'Gas ineligible
illneligible capacity to be shut downby 2O25 under standard assumptionsof lifetime
Õa
0,504
AT DKBE ES
1.9¿
=o'õfitÊLat¡o'ttgIEø
f
()É
03 $I
0BG cz HU LT
COMPASS LEXECON
EE GR HR
EAST
LV PL RO SI SK 1r*,
1"3
WORK IN PROGRISS
550 EPS IMPACT ON PEAK CAPACITY IN THE WESTERN REGION -90% OF THE EXISTING PEAK CAPACITY WOULD CLOSE BY 2025
. .:-!'. :'-:..tt,. .- -:.,'. t .
Peak thermal capacity : CM Scenaria 2û2û - 2t4û 550 f PS cûmpared to CM ; Annual capacity impact'irJ
8
6
4
2
è(9
.!GõÇooLoÕ
!(i
4lj
Itì
5.gÇßoEUqj
Õ
Wlä
lä
0i-
I
iû
i {.1
.4
-Õ
,8
i) 203û
¿02c 2025 2030 2ü35 t04ûI Ëxrstrng i:,eak Gas Iirg,i]¡íl i{ Exrstiirg Peak Gas . lneiigLrie t¿ Ex¡sting Pcak Orl . trreiigibleI l¡e\r Prrak I DSR 3aÌr¿.rv
Besides normal closure of existing ageing oil plants, the 550 EPS would accelerate their closure from 2025 onwards andanticipate the need for new ínvestrnent by about 5 years on average. ln addition, about L0 GW of additional peaking plantswould be needed:'i 6 GW of existing oil and gas plants would close before their normal closure date
/ They would be replaced by 10 GW of additional new peaking plants.
r* ülvlPASS L[X[CON I4
WORK IN PROGRËSS
550 EPS IMPACT ON PEAK CAPACITY IN THE EASTERN REGION -EXISTING CAPACITY IS STRONGLY IMPACTED AND NEW PEAKING UNITS AREN EED ED
Feak thermai capacity : CM Scenaria 2û20 - 204CI
2t)
L8
Ifi; ."
:iaza t02-i 2-03Ü l0:t5 2040I Êx¡st¡ng Pe;k tìas Fligible ? txrsting Peat< Gas lneligble ra Ëxisting Peak Oi! , ineligiblet lrlew Peak f ìlSR Battery
:iì; l l :ç- .., ...¡.t,."
55t ËPS compared to CM ; Annuai capac¡ty impact
I
lå
lå
3(9.ËuCLo0ûJ
0)Õ
> t,'õõo ll1rc"oûarc(Ut:ô
4
-¿ylE)']-1 2 -.:¿:¿!¿rå:.:,*s Ê¿ttrîttÌlt
202r-r ?il2 5 2 03L' 2035 2ri40
I Exrstrrìg Fe¿k Gas' Ëligible ¡l Êx¡stirrg Fear G¡s ineligbie {, Ixrstirrg Peak {)r: rnerrÉ,!hie
I New Peak ¡ DSR B¿tierv
6
4"¿l ,
I
0!
2-,:4:
6:
8
Besides normal closure of existing oil plants, the 550 EPS would accelerate plants closure from 2A25 onwards andanticipate the need for new investment by about 5 years. ln addition about 3 GW of new additional peaking capacity wouldbe needed:
/ 3 GW of extsting oil anci gas plants would close before their normal closure date.r They would [:e replaced by 3 GW of additional peal<ing plants.
(.;rlvlPASS LËX:CÕN 1c,
WORK IN PROGRESS
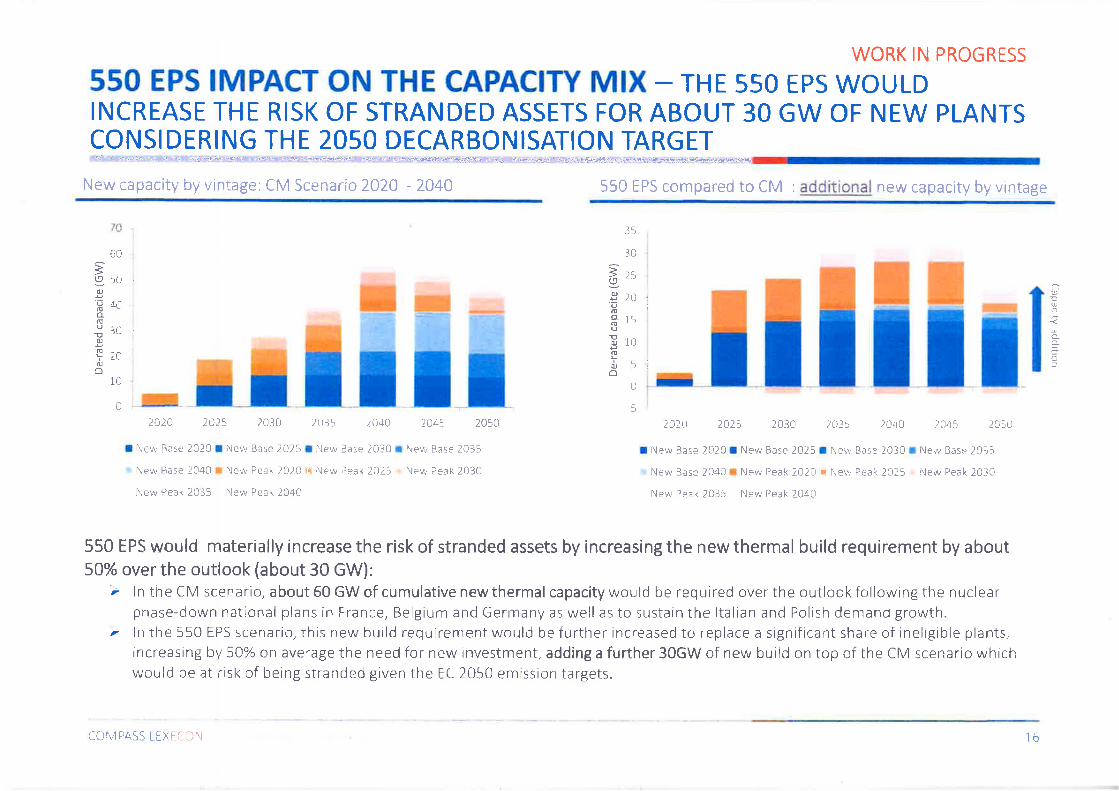
550 EPS IMPACT ON THE CAPACITY MIX - THE 550 EPS WoULDINCREASE THE RISK OF STRANDED ASSETS FOR ABOUT 30 GW OF NEW PLANTSCONSIDERING THE 2O5O DECARBONISATION TARGET'¡a'r_.r:t.?Jr
New capacíty by vintage: CM Scenario 2ü2û - 2û40 550 IPS compared to CM ; additional new capacity by vintage
)É
lä
3C
a)!ooeoo.EOJ
o¡U¿f
60:59stOJ
oñ¡JUqJ,ñ __L /{ IcJ'O tu,
¿)
2crì-,
i
1û ',
I5ì
ü ,T 0
)¿o20 2t23 2030 2035 2i140 2ü45 205C
I f'lew Base 2020 ¡ friev,r Base 2025 f i'{ew Base 203û r Nevy B¿se 2035
New Base 1040 r ¡lew Peak 2020 r New Peak 2025 Nev,, Peak 2030
f;ew Peek 2035 New Peak 2û40
2û2ri 2A2t :030 1035 2040 2045 20)tJ
I l\e\to Base ¿O2Oa New Base 2025 I Ner,r, Base 2030 r Ne,¡, Base 2035
New Base 204û r Nerry'Peak 2020 : Nev¡ Peak 2025 New Peak 2Cj3ü
New Peak 2035 ltlew Peak 2û4ü
550 EPS would materially increase the risk of stranded assets by increasing the new thermal build requirement by about50% over the outlook (about 30 GW):
ù ln the CM scenario, about 60 GW of cumulative new thermal capacity would be required over the outlook following the nuclearphase-down national plans in France, Belgium and Germany as well as to sustäin the ltaiian and Polish demand growth.
7 ln the 550 EPS scenar¡o, this new build requirement would be further iricreased to replace a significarrt share of ineligible plants,increasing by 50% CIn average the need for new investment, adding a furlher 30GW of new build on top of the CM scenario whichwould be at risl< of being stranded given the EC 2050 emission targets.
LOMPASS t[XTIÛN 1-5
WORK IN PRÜGRËSS
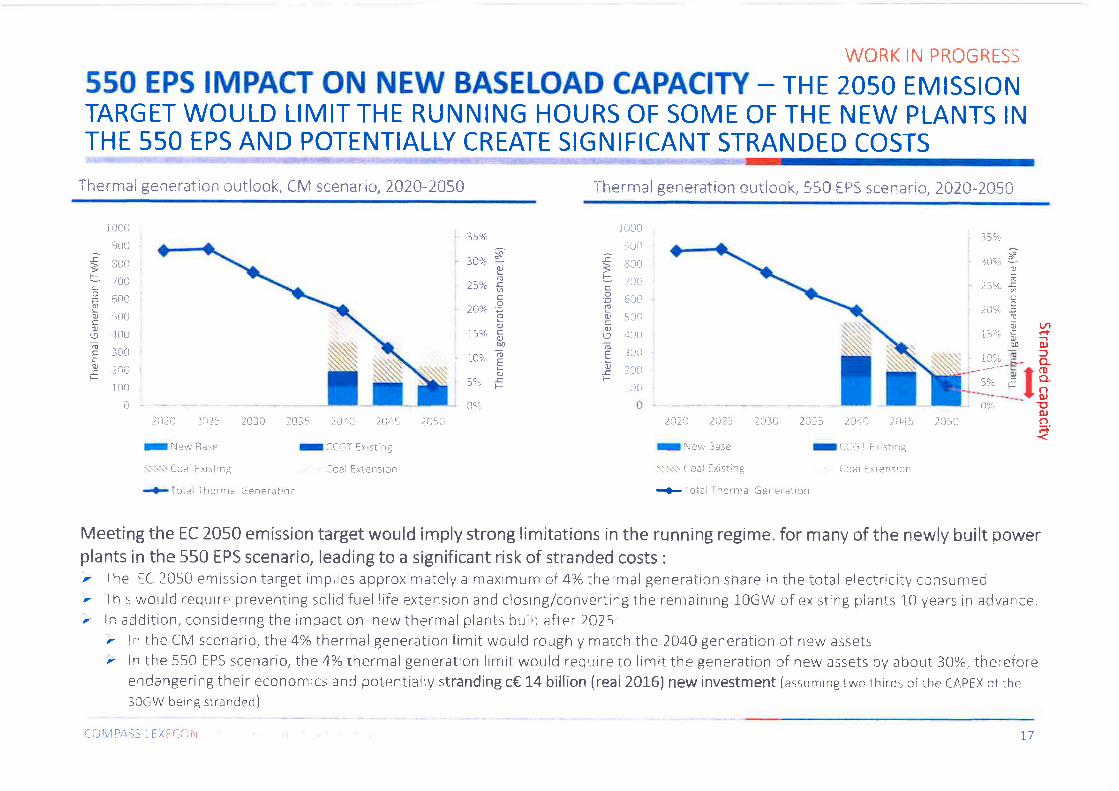
550 EPS IMPACT ON NEW BASELOAD CAPACITY - THE 2O5O EMISSIoNTARGET WOULD LIMIT THE RUNNING HOURS OF SOME OF THE NEW PLANTS INTHE 550 EPS AND POTENTIALLY CREATE SIGNIFICANT STRANDED COSTS
2û2Û )û25 2031-1 2015 2J4(, )A'itI i\ew Base I CCGT Ex sting,{.¡.'..j Coei Lxrstrng Ccai Extensron
*Tct¡l fherm¿l Gener¡tic¡i-r
205ii 2ù2, 2û2: 203ú 2035 ¿An )fr{a,
I [\evv ßäse I r*'-iìr Ë\ sï f ìg
.'-t..:.\ Coãl Exi-.iinå í-oal E.x:.ensron
.{- Toiel fìlermal Gerrer ation
2 05t
Meeting the EC 2050 emiss¡on target would imply strong limitations in the runn¡ng regime. for many of the newly built powerplants in the 550 EPS scenario, leading to a significant risk of stranded costs :
/ The ËC 2Û50 emission target impl:es approximately a maximum of 4%thermalgeneration share in the totai electricily consunredr Ihis would require preventing solid fuel life extensron and closing/convert¡ngthe remaining 1-0GW of existing piants 1û years in advance"/ ln addition, considering the rmpact on new thermai plants built after 2A2\'.
. in the CM scenai'io, the 4% thermal generation limit would roughly match the 2040 generation of new assets, ln the 550 EPS scenario, the 4?6 therr¡al generation limit would require to iimit the generation of new assets bV about 30?å, therefore
endangering their economtcs and potentialiy stranding c€ 14 billion {real 2016) new investment {assLrmrng rwc rhirds oí rhe CAeFX of rhe30GW being strarrded)
tIJh4PA55 LFXËCÜIi 17
WORK IN PROGRESS
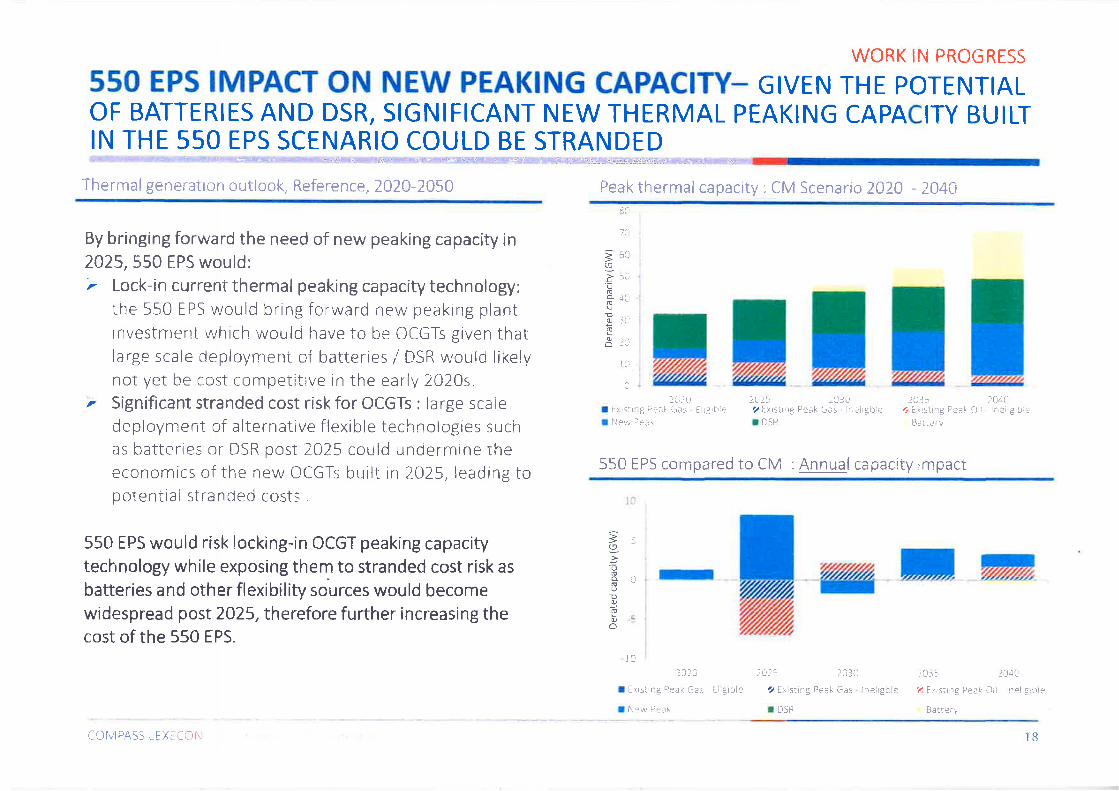
550 EPS IMPACT ON NEW PEAKING CAPACITY_ GIVEN THE PoTENTIALOF BATTERIES AND DSR, SIGNIFICANT NEW THERMAL PEAKING CAPACITY BUILTIN THE 550 EPS SCENARIO COULD BE STRANDED
By bringing forward the need of new peaking capacity in2025, 550 EPS would:'r Lock-in current thermal peaking capacity technology;
the 550 EPS would bring forward new peaking plantinvestnnent which would have to be ûCGTs given thatlarge scale deploymeni cf batteríes / DSR woulci likelynot yet be cost competítive ln the early 2020s.
È Significant stranded cost risk for OCGTs : large scalecleployment of alternative flexible technologies suchas batteries or DSR post 7t25 could und'ermine theeconomics of the new OCGTs built in 2A25,leading topotential stranded costs
550 EPS would risk locking-in OCGT peakíng capacitytechnology while exposing them to stranded cost risk asbatteries and other flexibility sources would becornewidespread post 2025, therefore further increasing thecost of the 550 EPS.
550 EpS compared to CM : Annr-¡al capacity rmpact
li.l
ìI:Gù6o!0laUrf
5Lr
4[r
ll':
¿lì
a()
lJ rilI l¡;rSIr'1c Pe¿l- Gas flrgrbieI l(e'l )¡ak
2u-¿5 lLrJù7 [xrstrilg Peak Ç".s irreirgbie¡ DSR
2f :5 2a)_30
/,i Ë\isting Peak G¿s . rnelrgble
I LISR
.Ì(i:15 :û4ll4 Etrstlng FSaf a)ir lne¡rgib;i
Batt*;"y
3(,.y-ußo.
E0o0Õ
lr n n øM
rû: J:J
I !xrsirng Peat< Gas tliSible
I lrl:w Fea¡
rfl3 5 ì041r
:4 E ( Sire€i ùê¿k ';r' ;flêi:g '-"t'
tati€r'y
tOlvlP,AS5 LEX[inN 18
WORK IN PRÜGRISS
550 EPS IMPACT ON GAS CONSUMPTION IN WESTERN EURoPE, GASCONSUMPTION INCREASE 15 CONCENTRATED IN GERMANY AND ITALY AS ITYIELDS THE GREATEST IMPACT ON ITS GAS AND COAL GENERATION
iias ccnsumpiicln in Reference scenario, 2û20-204û
ræ
^ 600
=L- 500o
f +oot,I ¡oottatoß 200goû
100
-
600
500
400 nr300
200
1oo -
3þ,9
oôoo.E(9
55û [pS irnpacT; increase marnly in ü*r-many, Spain anrl in italy
02024 2025
TAT.BE rDE rDK
I In
2A4A
550 EPS would slightly increase gas consumption in some Western European countr¡es:F Main increase of gas consumption happens in Germany and ltaly where the most coal plants would be impacreclt Gas consumption would increase to a lesser extent in France, Belgiunr, Sparn and Portugal, as ciomestic and
neighbouring countries coal generation would decrease.
Over 2O2CI-2A40 total gas consurnption in Western Europe would increase by an average 24% as the result of 550 EPS,however even though the maximum gas consumption would increase in 2025, it would decrease in tiie longer term
202A 2A2s
rAT ,,BE rDE rDK2030
ES TFR2035
lT cNL PT
2030
ES TFR2035
lT .e NL FT
2A4C
a üf'"4 PAS: Li: X l/- ü !\l 19
WORK IN PROGRËsS
550 EPS IMPACT ON GAS CONSUMPTION - tN EASTERN EURopE, GASCONSUMPTION MATERIALLY INCREASES IN POLAND, GREECE AND CZECHREPUBLIC
Gas consr"¡nrptinn in Reference scenãrio, 2020-2040
nI-EI
550 EPS impact: sharp increase in Poíancj
^ 140
ã rzoÊ.9 100gc
=80o
360ah
ö4020
t!#IîTI T
èI
^ 180
F root-
!.oof rzo
P rooootu, 80(!o60
2024
rBG 'CZ rGR2025
HR ¡HU
-
2035 2040
PL r RO ",Sl SK
0
2024rBG , CZ rGR
II
2425
HR THU
I
2030
LT "LV
I
2035 2040
PL rRO .Sl SK
40
2A
02030
LT aLV
550 EPS would increase gas consumpt¡on in selected Eastern Ëuropean countries:r ln Poland, the 550 [PS wouid lead to a sharp increase of consumption from 5TWh to l-OûTWh (or 20 times).'F ln Bulgaria gas consumpt¡on would increase to a lesser extent to 25TWh and in Czech Republic, gas consumption
would increase from 5TWh to 21TWh.i ln Greece, gäs consumption would increase within 2A2A gas consumption range (30-40TWh)
Over 2O2A-2A40, total gas consumpt¡on in Eastern Europe would increase by an average LL3Ya as the result of 550 EPS, andwould lead to a material increase of annual gas consumption from 130TWh in 2A2O to 220TWh by 2040. (2.S%lannum)This would lead to significantgas- network investment requirement¡ especially in Po[atül''¿1 PA55 Lf X r {-,i)i J
nd2CI
550 EPS IMPACT ON SECURITY OF SUPPLY - THE EPS CREATESUNCERTAINTY FOR TSOS OR MEMBER STATES TO SET KEY PARAMETERS OF THECM, WHICH COULD UNDERMINE SECURITY OF SUPPLY AND INCREASE COSTS
3i
r h q ç rct¡-q-a l ç,q rq ¡_tu-drì c sp q _q üy in rx wi ! h hieþ,[ey_qiå qleaga c Ll l-e ¡
emitting more than 550eCO2/kWh
t The 550 EPS would create significant uncertainty on howto set the capacity target in the CM. ln this simpleexample:
r Need for de-rated capacity of 30 GW to meet peak loadcJemand and respect the security of supply criterion
t 2t GW of de-rated capacity are from energy sourcesemitting rnore than 550gCO2lkWh (coal and lignite)
r Should the TSO be certain that coal and lignite plantswould remain in the system, the capacity to be procuredwould be around 9 GW
r However, these capacities are not committed in the CMand their prof¡tability is far frorn beíng guaranteed, sothey might close
r The TSO would therefore face a significant uncertaintywhen determining the capacity to be procured
T,¡tr¡i cie -ratedtapacrty neeci
f | ¡
Noû-Ðotticipotinq derated cûÐacrty
Portictpottnc de-røterl capactty
1!
llr
j
l)
lGås , RES
De-raieJ r:apaciiy
Hydr^cr DSF, Other '¡ Coai 'r lrgnite
The EPS ín the CM could therefore have significant implications in practice which are not captured by our model assuming perfectforesight:' it could lead conservative TSOs or Member States to over-procure as an insurance, with significant consequences: impact on cost of
the mechanism, dampening energy prices and crowding out of more plants, impact on cross-border flows and neighbouring countries.' On the contrary, if TSOs or Member States underestimateclosures, they couid face majorelectricitysecurityof suppÍyissues' The role of the CM in providing a structure remedy to resource adequacy issues would be undermined and Member States could turn
to a less-efficient options such as targeted tenders
¿1
'1 í-rtv'lP 55 LExIii:]t,i 2t
WORK IN PROGRESS
550 EPS IMPACT ON CO2 EMISSIONS - 550 EPS WoULD NoT ACHIEVE ITSPOLICY OBJECTIVE OF SUPPORTING DECARBONISATION
C02 emission reduction, 202û-2û40
The 550 EPS would not achieve its policy objective of supportingdecarbonization as total EU co2 emissions covered by the ETS cap wouldremain unchanged' The ETS sets ar annuai cap on greenhouse gas emissions for all sectors
covered with a fixed number of allowances supplied in the ETS marketeacit ¡rea r
' The EU wide emission level may not change srgnificantly, asthe increasein emissions frcm other sectors would offset the additional reciuction inthe power sector
The 550 EPS overiaps with the EU ËIS would likely undermine the ETS asprime driver of the EU's decarbonisation. The ETS efíectiveness and credibiiity would lre weakened as more
emisslons abatement would be driven by out of market policies. Ihe porentially lower carbon pnces could have side effects and delayinvestment decistons to reduce emissions in othei-sectors covered bythe ETS
The 550 ËPS should be assocíated with a re-adjustment of the ETS cap,and/or by the intake rate of the MSR and the cancellation of permits from themarket to limit negative effects on the ETS
' ln any case the complexity of the interference between the 550 EPS andthe ITS would be a source of market uncertainty and could lead topossible u n intended consequences
Cû2 emission reduction, 2û20-2040
1 600
1400
1 200
1 00û
800
600
400
200
0
-ZLYy -43o/o -60%u,
oo
€{oo
-tI¡I¡
I
¡IIIt
¡¡
I
t
2005 2010 2015 2020IReference scenano
--+- COz emission target
202s 2030 2035 2A40n550 ËPS scenario
EC outlook 2016
COMPASS LEXTION 22
WORK IN PROGRESS
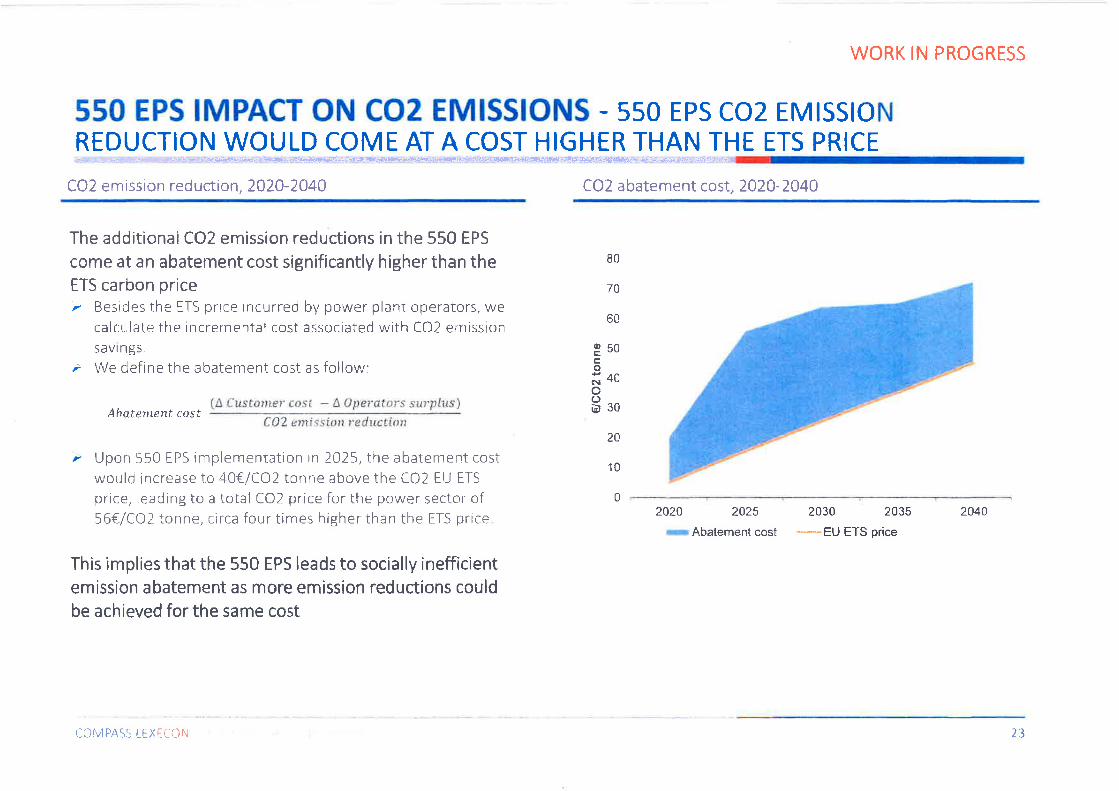
550 EPS IMPACT ON COz EMISSIONS - sso Eps coz EMrssroNREDUCTION WOULD COME AT A COST HIGHER THAN THE ETS PRICE
CO2 emission reduction, 2020-204CI COZ abatement cost, 2û20-2040
The additionai CO2 emission reductions in the 550 EPSccme at an abatement cost significantly higher than theETS carbon price/ Besides the ETS price incurred by power plani operators, we
calcr:late the incrernental cost associated with CO2 emissionsavi ngs.
7 We define the abatenrent cost as follov¡:
(A Cusfo¡r¿er cost - Lûperators sirrplus)Ahotenrcnf cost
80
70
60
950o;4ûc)ù30
r Upon 550 EPS implementation in 2t75, the abatement costwould increase to aO€lCO2 tonne above the CO2 EU ETSprice, leading to a total CO2 price for the power sector of56€/CO2 tonne, circa four times higher than the ETS price
This implies that the 550 EPS leads to socially inefficientemiss¡on abatement as more em¡ssion reductions couldbe achieved for the same cost
20
10
02420 2025
rAbatement cost2030 2035
-EU ETS price
2t40
COMPASS LEXICÕN 23
WORK IN PROGRESS
550 EPS IMPACT ON POWER PRICE - Eps tMpACr oN powER pRtcES tsSTRONGER IN THE EASTERN REGION THAN IN THE WESTERN REGION AS A LARGERSHARE OF THE GENERATION MIX IS IMPACTED
Ëvclutisn CIf power price in Western Ëurope, 2ü20-204Cr Fvolution of pcwer price in fiastern Ëurope, 2ü2ü-2û4û
==q¡,
o(,LqLo=o&
==wo)o!
o3oc-
100
90
80
70
OU
50
40
30
2A
10
0
'100
90
80
70
60
50
40
30
2A
10
02020 2425 2030 2035
- Reference scenaric' . "* 55û EPS
2040 2020 2025 2030 203s
-Reference scenario * ** 550 EPS
204A
While in both regions power price increase throughout the modellíng horizon, following the steady commodity priceincrease, the 550 EPS would further increase average power prices by at least l-€/MWh on average :
>impacted
r ln the Eastern region, the average inrpact remains around 1.S€/MWh as larger proportion of the mix is impacted
{-OIIPASS LÊXiiül.t 24
25
20
5
0
5
r|r¡
.9=o,0oEÞo
UJ
1¡)g.95oooCD
o¡r¡
WORK IN PROGRESS
550 EPS IMPACT ON ENERGY COST - THE EPS 550 ScENARIo INcREAsESTHE ENERGY COST FOR CONSUMERS COMPARED TO THE CM SCENARIOTHROUGHOUT THE HORIZON
Energy cost in Reference scenario, ztZA-Zt4A 550 ËPS impact: increase by €73 billion over 2020-2CI40
800
700
600
500
4oCI
300
200
100
o 02A20-2022 2023-2027 2028-2032 2033-2037 2038-2040
¡ Westem Europe r Eastem Europe2020-2022 2023-2027 2028-2A32 2033-2037 2038-2040
¡ Western Europe ¡ Eastern Europe
While 550 EPS would increase the energy cost for consumers s by €T3billion over 2A2A-2O40| overall:ù ln the western region, the energy cost increases significantly in 2025-2030, as cheap coal generation is replaced by
more expensive gas generation.
new coal plants are built.
COMPASS LEXTCON 25
WORK IN PROGRESS
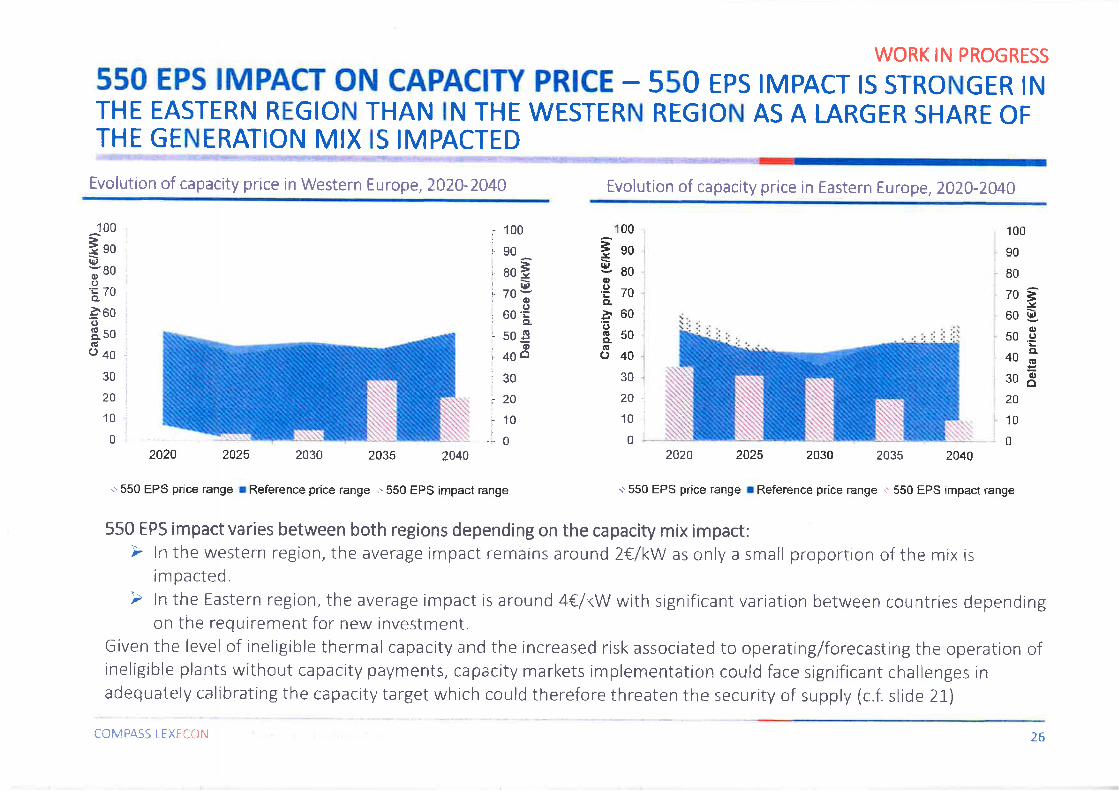
550 EPS IMPACT ON CAPACITY PRICE - 550 EPs tMpAcr ts sTRoNGER tNTHE EASTERN REGION THAN IN THE WESTERN REGION A5 A LARGER SHARE OFTHE GENERATION MIX 15 IMPACTEDr
Evolution of capacíty price in Western Europe, 2020-2040 Evolution of capacity price in Eastern Europe, 2020-204CI
00100
ãto(&,
;80o'ã70
,à60oS. soGo+o
30
20
I
I
100
90
80
70F!eoÐô50 .g
ooË30å?o
10
0
iro9l aoo'Ë zog,.à 60og. 50ño40
i 100r90i 80ËI l¡,l'70ã:(,i 60'=i 509ioi- 40ôi
i30i20iroi;0
10
0
30
20
10
0
i
I
1I
2020 2425 2030 2035 2040 2020 2t25 2030 2035 2040
i'550 EPS price range r Reference price range ¡ 550 EPS impact range ." 550 EPS price range I Reference price range c. 550 EPS impact range
550 EPS impact varies between both regions depending on the capacity mix impact:Þ ln the western region, the average impact remains around 2€/kW as only a small proportion of the mix is
impacted
on the requirement for new investment.Given the level of ineligible thermal capacity and the increased risk associated to operatingfforecasting the operation ofineligible plants without capacity payments, capacity markets ímplementation could face significant challenges inadequately calibrating the capacity target which could therefore threaten the security of supply (c.f. slide 2i.)
COMPASS LEXÊCCIN 26
WORK IN PROGRESS
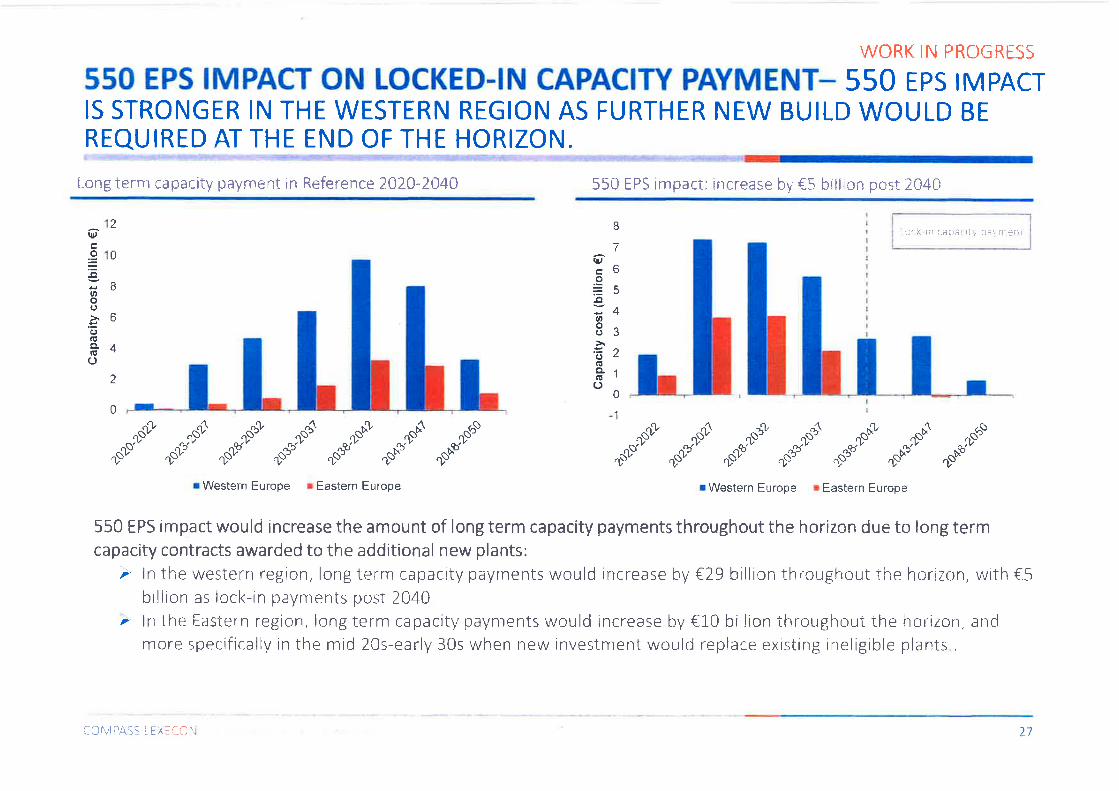
550 EPS IMPACT ON LOCKED-IN CAPACITY PAYMENT_ 550 EPS IMPACTIS STRONGER IN THE WESTERN REGION AS FURTHER NEW BUILD WOULD BEREQUIRED AT THE END OF THE HORIZON.
Long terrn capacity payment in Reference 202CI-204CI 55û f PS impact: increase by €5 billion post 204t
(¡lJ
c.e=Eatoo.:oa!a.r!(J
l¡,
o
at,o(t
'õ(l{E(J
2
0
n
6
4
2
0
I7
o5
4
3
2
1
0
I
i L,.ck ¡n aaL.ai rtr pAi.,,"ìr!i-ìi
A
"SP',n5"aU,v
4
'ì,sn
,$,^ov
"S;'10t
"1,
.ü9o" ^p{bb-"rì,"^Ê .9'
"oP" ,oo""^dP ""Ó "d& "É *P ^S .g"
"*"" dF'" "*p"' "dF
" .rso' noñ "
,oñ "
¡ Western Europe r Êastern Europe r Western Europe ¡ Eastern Europe
550 EPS impact would increase the amount of long term capacity payments throughout the horizon due to long termcapac¡ty contracts awarded to the additional new plants:'r ln the western region, long term capacity payments would increase by €29 billion throughout the horizon, with €5
billion as lock-in payments post 204CI.. ln the [astern regiCIn, long term capacity payn'ìents would increase by €10 billion throughout ihe horizon, and
mCIre specifically in the mid 20s-early 30s when new investment would replace existing ineligibie plants .
COf\,oIPAS! i EX:fNN 27
Appendix L - CompassLexecon's model I ing a pproach
""t.."''C(]MPASS LEXECt]N' ' ' . . . ¡ ¡ ll
COMPASS LEXECON 28
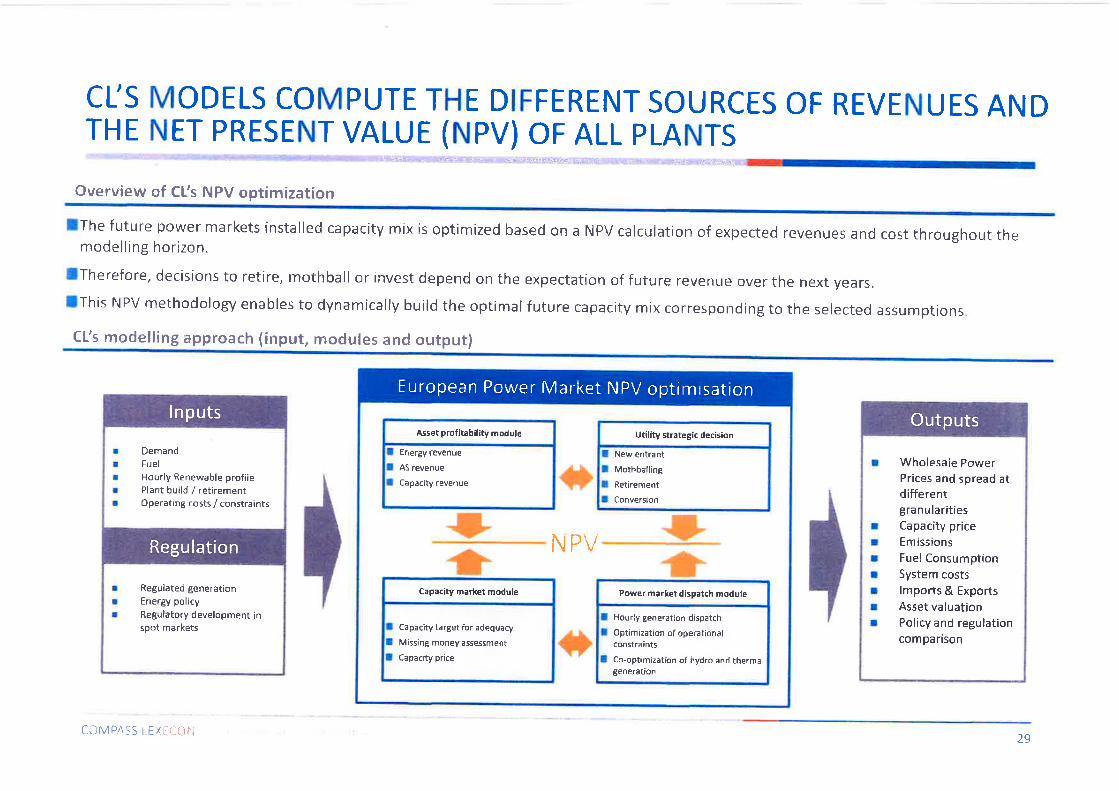
CTS MODELS COMPUTE THE DIFFERENT SOURCES OF REVENUES ANDTHE NET PRESENT VALUE (NPV) OF ALL PLANTS
lThe future power markets installed capacíty mix is optimized based on a NPV calculation of expected revenues and cost throughout themodelling horizon.
lTherefore, decisíons to retire, rnothball or invest depend on the expectatíon of future revenue over the next years.IThis NPV methodology enables to dynamically build the optimal future capacity mix corresponding to the selected assumptionsCfs modelling approach {input, modules and outputI
I Energy revenueI ASrevenueI Cãpacity revenue
Asset profitability m odule
I NewentrantI Mothbell¡ngI RetirementI Conversion
Utility strategic d€cis¡on
I Capacity target for adequacyI Missing money assessment
I Capacity price
Capacity merket module
I Hourly generat¡on dispatchI Optimization of operational
coflstraintsI Co-opt¡mization of hydro and thermâl
generatioñ
Power merket dispãt€h module
NPVt+*
*
'tt
European Power Market NPV optimisation
Regulated generationEnergy policyRegulatory development inspot merkets
r Wholesaie PowerPrices and spread atdifferentgranularities
l Capacity price¡ Emissionst Fuel Consumptionr System costsr lmports & Exportsr Asset valuationr Policy and regulation
comparison
Outputs
CÜMPA-CS LEXÊiCII.I 29
CTS EUROPEAN POWER MARKET MODEL COVERS THE POWERMARKETS OF EU28+ AND CALCULATES POWER PRICES IN EACH ZONE
Overview of Compass Lexecon's power market model
I Compass Lexecon's power market model covers the FU-28countries as well as Switzerland, Norway, the Balkans andTurkey.
r Countries beyond this geographic scope are modelled at anaggregate level.
I The model is run on a commercial modelling platformPlexoso using cjata and assumptions from public sourcesand assembled by Compass Lexeconfor demand, supply,commodity price and interconnection.
I Conrpass Lexecon's power market model constructs supplyin each price zone based a set of typical pant categories.r European power plants clatabase containing technícal parameters
of all thermal European aggregated plantsr Zonal prices are found as the marginal value of energy accounting
for generators' bidding strategies.
I lt takes into account cross-border transmission andi ntercon necto rs a nd u nit-com m itment pla nt constra ints.
Gengraphic sc*pe CIf the nrüdel
üüMPASS i rxt-Cilr,l 30
CTS ASSET PROFITABILITY MODULE INTEGRATES THE REVENUESFROM THE ENERGY AND THE CAPACITY MARKETl:+h¡¡it:u:4t.F-::':l
Overview of Compass Lexecon's capacity market model
I Capacity market bids based on the "missing money"depend on the revenues expected in the energy andancilla ry services {ba lancing) markets.
I Compass Lexecon's capacity model simulates therecurrent auctions over several years:
r Decision to retire, invest or mothball units depends on theexpectation of the future income over the next years.
¡ These decisions are made based on a multi-period strategytaking into account the inter-temporal constraints of theauction design, i.e. price-taker/maker price caps andcontract durations.
I The model is set up to run over a number of futureperiods from 2020 to 2050.
I Energy market revenues are fed to the capacitymarket model from Compass Lexecon's power marketmodel developed in Plexos@.
lnteraction between the capacity and energy markets
# *
e t
Srtrlll¿ticrrr oftlre er rer"gv
'r r: rkel
Change in thenrix clearing
Estimation of"missingmoney"
C;¡rarrlytrtvesTrnerlt,/lelirertreillde:rston
COMPASS LEXTCCIN 31
I
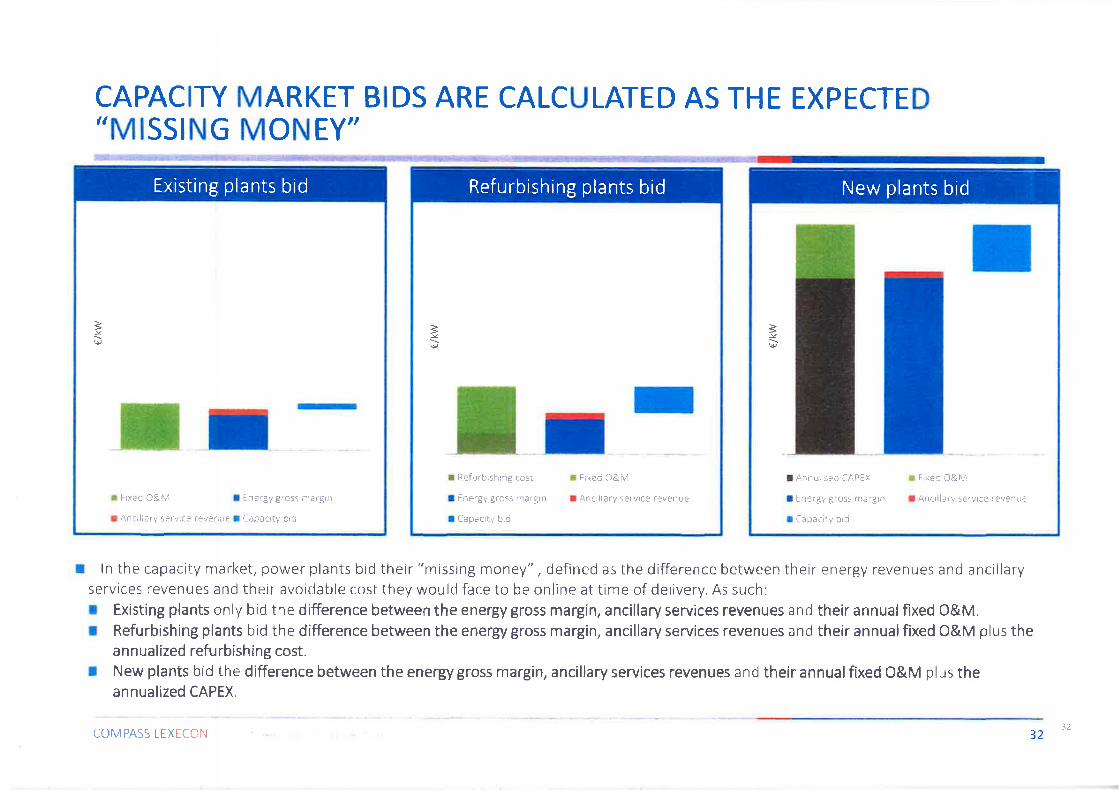
CAPACITY MARKET BIDS ARE CALCULATED AS THE EXPECTED,,MISSING MONEY'
ln the capacity market, power plants bid their "missing money", defined as the difference between their energy revenues and ancillaryservices revenues and their avoidable cost they would face to be online at time of delivery. As such:I Êxísting plants only bid the difference between the energy gross margin, ancillary services revenues and their annualfixed O&M.t Refurbishing plants bid the difference between the energy gross margin, ancillary services revenues and their annual fixed O&M plus the
annualized refurbishing cost.I New plants bid the difference between the energy gross margin, ancillary services revenues and their annual fixed 0&M plus the
annualized CAPEX
3\t
a Fr<eii O&M
I Ancrllãry iervrce revenue
I Ref'Jrb¡shrng cosÌ
I Ênergy gross cnargrn
I Capacltv brci
Refurbishing plants bid
r Ftxed 0&M I Lner'gy grç55 ¡rr3¡g¡¡
I Anailiary sÈrv¡cÊ l"€vÊr,llÊ l aapaclti- btci
E
3({,
Existing plants bid
3!r¡P
I Frxed 0&l'vj
¡ Alri,rllarv Sei!-rae revenue
I Anr'rul sad CAPEX
I Ënergy gross margrn
I fapacity ilro
New plants bid
CON4PASS LFXECON 3212
Appendix 2 Key assumptionsand defi nition of the reference
' . . .... oooscenanoCOMPASS LEXECON
aa.. ' ' . .a
a
CCIMPASS LEXECON 33
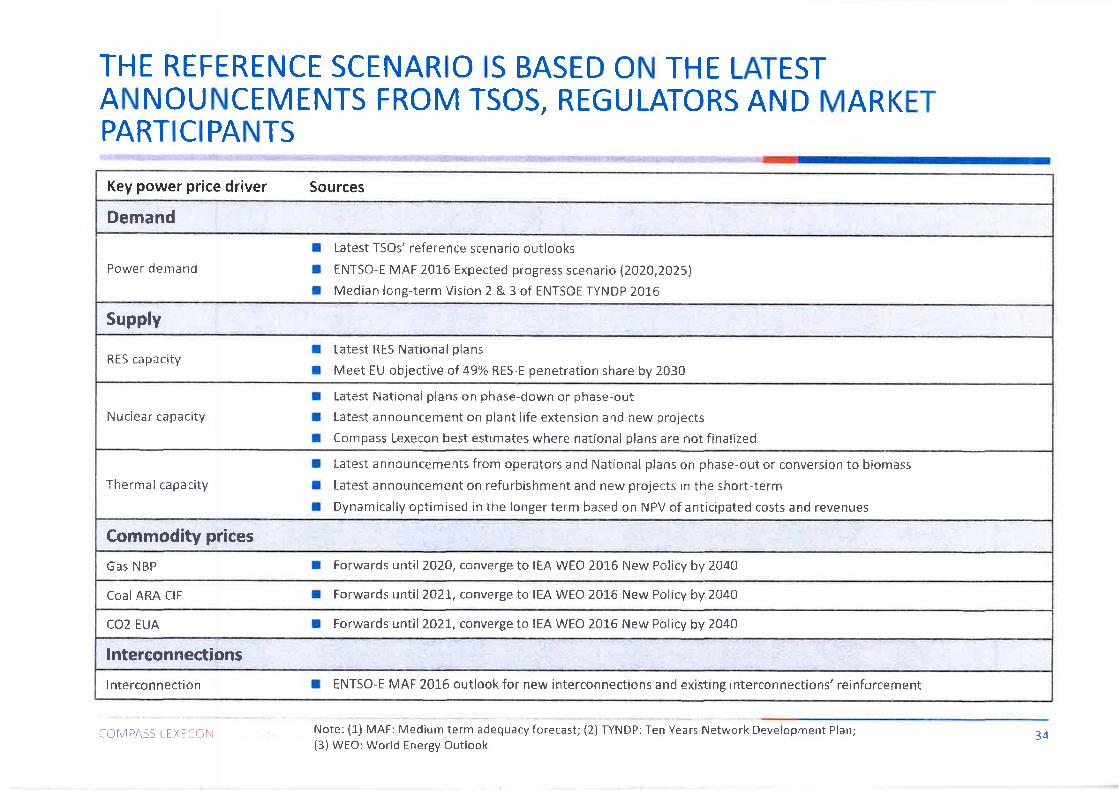
THE REFERENCE SCENARIO IS BASED ON THE LATESTANNOUNCEMENTS FROM TSOS, REGULATORS AND MARKETPARTICIPANTS
RES capacítyI Latest RES Nat¡onal plans¡ Meet EU objective ol 49% RES-Ë penetration share by 2030
Nuciear capacity¡ Latest Nationaf plans on phase-down or phase-outt Latest announcement on plant life extension and new projectsI Compass Lexecon best estimates where national plans are not finalized
Tltermal capacityI Latest annû¡Jncements from operators and National plans on phase-out or conversion to biomassI Latest announcement on refurbishment and new projects in the short-termI Dynamically optim¡sed in the longer term based on NPV of ant¡c¡pated costs and revenues
Commodity pricesGas NBP I Forwards until 2020, converge to lÊA WEO 2016 New Policy by 2040
CoalARA CIF I Forwards until 202L, converge to IEA WEO 20L6 New Policy by 2040
CCI2 EUA ¡ Forwards until202L, converge to IEA WECI 2016 New Policy by 2CI40
lntereonnectionslnterconnection I ENTSO-E MAF 2016 outlook for new interconnections and existing interconnections' reinforcement
Noter (i-) MAF: Medium term adequacy forecast; (2) TYNDP: Ten Years Network Development Plan;{3)WEO: World Energy Ouilook
COIIPASS t-FXFCOI\ 34
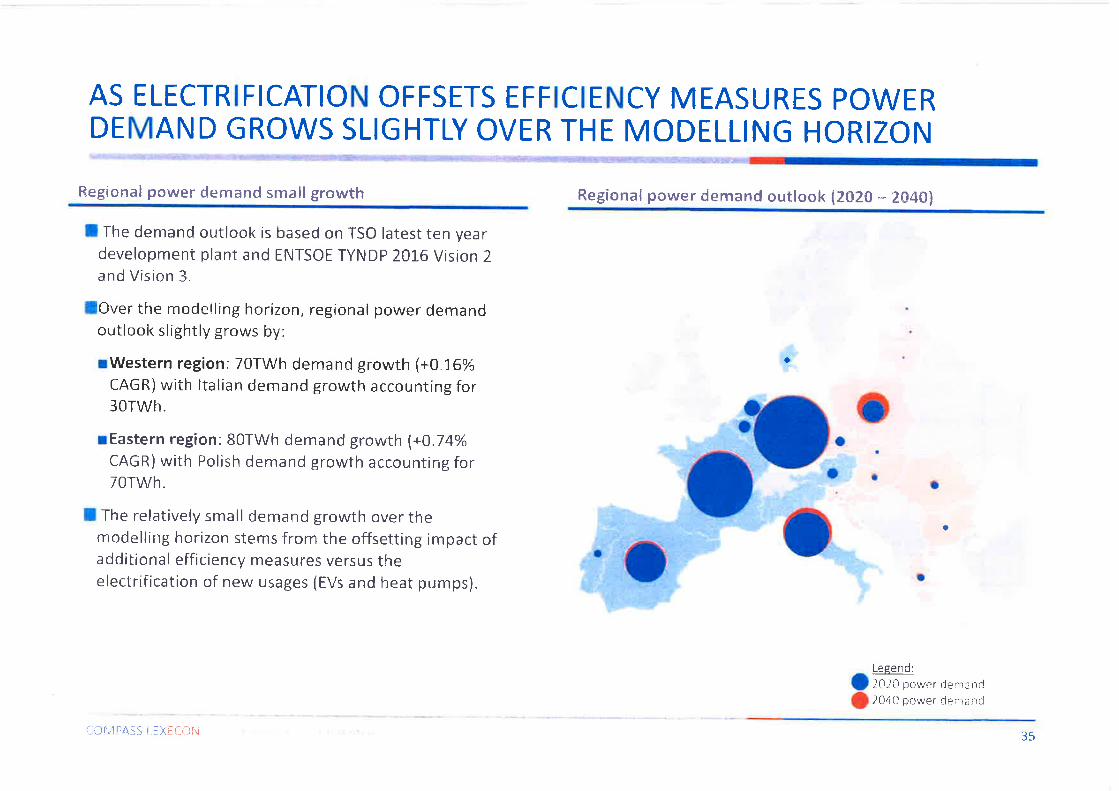
AS ELECTRIFICATION OFFSETS EFFICIENCY MEASURES POWERDEMAND GROWS SLIGHTLY OVER THE MODELLING HORIZON
Regional power dernand small growth
I The demand outlook is based on TSO latest ten yeardevelopment plant and TNTSOE TYNDP 20i-6 Vision 2and Vision 3.
lOver the modellÍng horizon, regional power demandoutlook slightly grows by:
I The relatively small demand growth over themodelling horizon stems from the offsetting impact ofadditional efficiency measures versus theelectrifícation of new usages (EVs and heat pumps).
Regional power demand outlook {Z0Zt * 2CI40}
a
oo
a tO.
oo
o
a
a
Legend:2020 iir:wer dem¿lrd2Û40 power derrrand
fo\,1pA.s5 LEXiCût',j 35
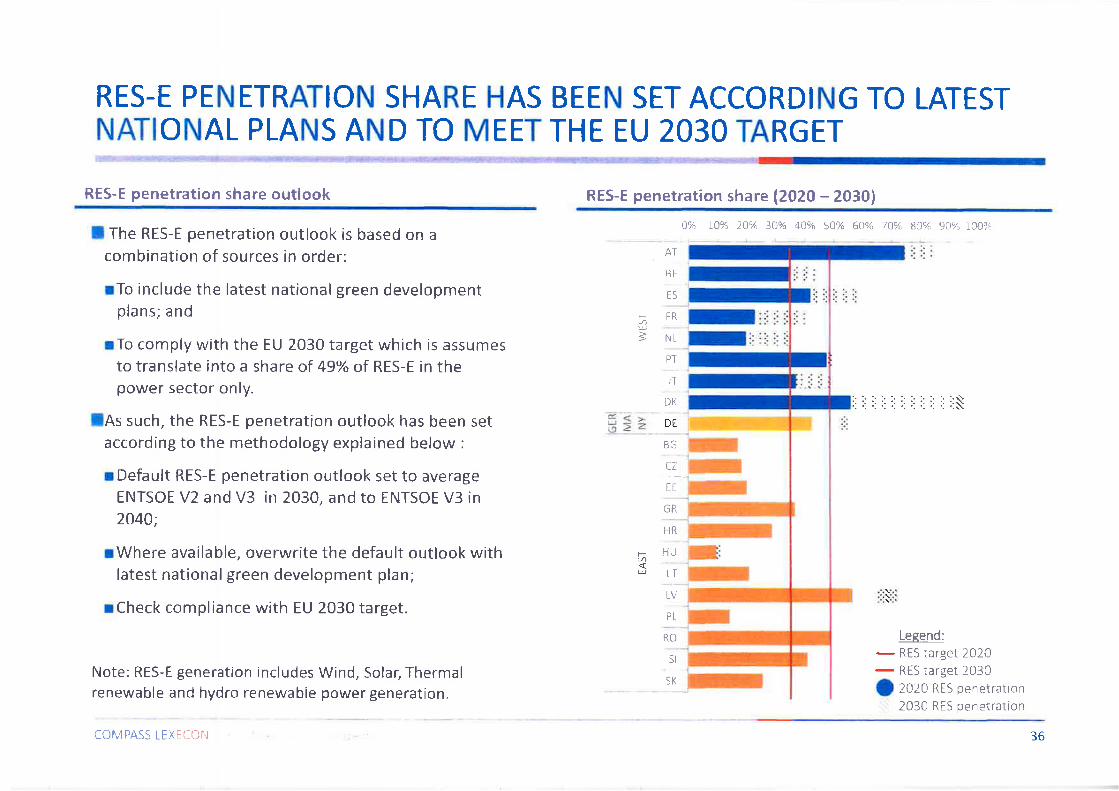
RES-E PENETRATION SHARE HAS BEEN SET ACCORDING TO LATESTNATIONAL PLANS AND TO MEET THE EU 2O3O TARGET
RES-E penetrat¡on share outlook RES-E penetration share (2020 - 20301
I The RES-E penetration outlook is based on acombination of sûurces in order:
rTo include the latest national green developmentplans; and
rTo comply with the EU 2030 target which is assumesto translate into a share af 49% of RES-F in thepower sector only.
lAs such, the RES-E penetration outlook has been setaccording to the methodology explained below :
rDefault RES-E penetration outlook set to averageENTSOE V2 and V3 in 2030, and to ENTSOE V3 ín2044;
rWhere available, overwrite the default outlook withlatest national green development plan;
rCheck compliance with EU 203t target.
Note: RE5-E generation includes Wind, Solar, Thermalrenewable and hydro renewabie power generation.
i--
3
f-
u
BE
tra
FR
N¡
pï
IT
DK
DÊ
BG
LZ
FË
GR
HR
HU
PL
RO
SI
SK
LT
L
Legend:
- RES target 2020
- RFS target 2030I zo:o RES penetration,', 2030 RES penetration
COMPASS LEXÊCON 36
THE NUCLEAR OUTLOOK IS BASED ON THE LATEST NATIONAL PHASEDOWN/OUT AND NEW BUILD PLANS
Nuclear capacity outlook
I Nuclear capacity outlook ís based on the latestnational phase down/out plans and new built project.
lWhere national plans are not available, the nuclearcapacity outlook is based on CUs best estimate, whichassumes a delay in implementing the proposedphase-down plan.
I0verall, the Western and the Eastern region showdifferent outlooks.
rThe Western Region shows a global phase-down ofnuclear capacity, led by France, Germany andBelgium.
rThe Eastern region shows a more stable outlook asillustrated by new projects in Poland or Hungary
Nuclear capacity outloak {GWl {202t - 4040}
4û
It
a
1j
rþt'"€' -I:.i3 ît?c túsJ
",1 l': rrli!,å Ei "'-\.
-1. !l.I o l
æ¡; æ4 :rø ç:II-Ei¡iff
:n:9 :;1Ð #
-, -.- -
COMPA.SS LÊXECON 37
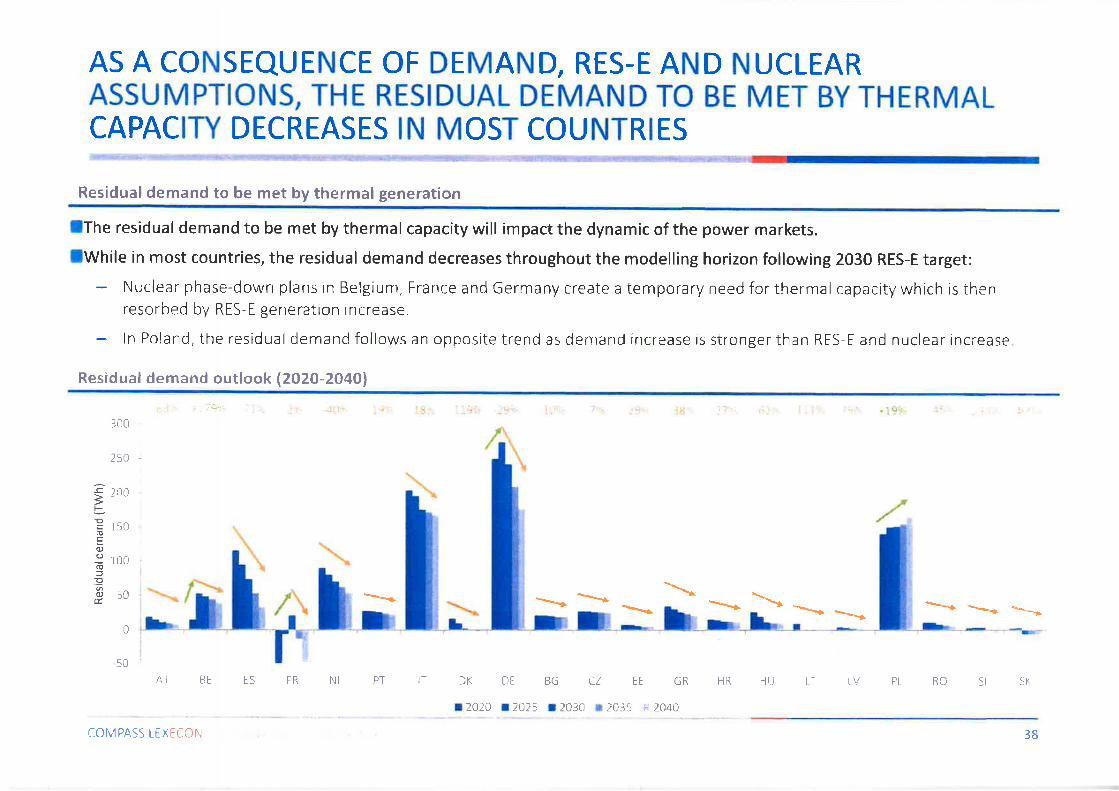
AS A CONSEQUENCE OF DEMAND, RES-E AND NUCLEARASSUMPTIONS, THE RESIDUAL DEMAND TO BE MET BY THERMALCAPACIW DECREASES IN MOST COUNTRIES
Residual demand to be met by thermal generation
lThe residual demand to be met by thermal capacity will impact the dynamic of the power markets.lWhile in most countries, the residual demand decreases throughout the modelling horizon following 2030 RES-E target:
Nuclear phase-down plans in Belgium, France ancl Germany create a temporary need for thermal capaciti/which is thenresorbed by RFS-E generation increase.
ln Poland, the residualdemand follows an oppcsite trend as demand increase is stronger than RES-E and nuclear increase
Residual demand outlook (2020-20i10)
't /- i :!.. :..:-,' -';r'| l,:' tl, .t :) : r', I ; ', '. r 19'),.-lûCI
Bt-ìo(oE(U
õ=poÉ
2 c0
150
100
50
250 -
cñ I
\* -"a
DK D[ BG CZ FÊ GR
aZA7O 12025 12030 12035 * 2040
**t - _*.\r -** ***.**... \*
0
AT BE ËS FR Nt PT I-Ì' HR H U LT L\./ PL RO 5I ST
COMPASS LEXËCÛN 38
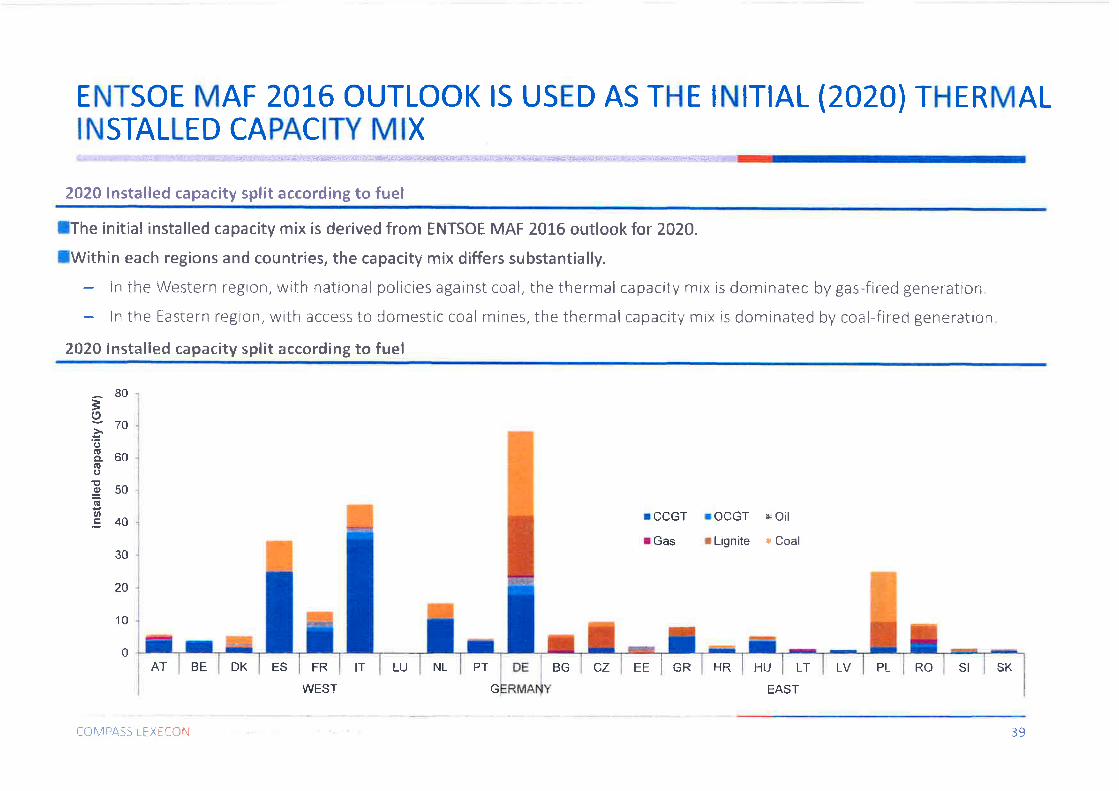
ENTSOE MAF 20L6 OUTLOOK rS USED AS THE rNrTrAL (2020) THERMALINSTALLED CAPACITY MIX
2O2O lnstalled capacity split according to fuel
lThe initial installed capacity mix is derived from ENTSOE MAF 20L6 outlook for 2020.
lWithin each regions and countries, the capacity mix differs substantially.ln the Western regron, with national policies against coai, the therrnal capacity mix is dominatec by gas-fired generation.
ln the [astern region, with access to domestic coal mines, the thermalcapacity mix is dominated by coal-fired generation
2020 lnstalled capacity split according to fuel
rCCGT
r Gas
80
=(9ã7tog" 60rÌt()
E50(t¡ul540
30
2A
¡OCGT
r Lignite
Þ Oil
r Coal
10
0AT FR
WESTHU LT
COMPASS LEXECÜN
BE DK ES IT LU NL PT
G
BG CZ EE GR HR
EAST
LV PL RO SI SK
39
THROUGHOUT THE MODELLING HORIZON THE THERMAL CAPACITYMIX IS OPTI MIZED TO ENSURE SECURITY OF SUPPLY
Security of supply and capacity mix optimization l{ey questions following preliminary adequacy analysis
lWe assume that the standard security of supplycriteria is set at 3 hours of Loss of Load expectation(LoLE).
IThe thermal capacity mix is optimized in order toensure that the model yields a maximum of 3 hours ofLoss of Load throughout the modelling horizon whiletaking into account:
r the operational reserve requirement {primary andsecondary reserve to be held in day ahead market);and
rThe weather risk above the Average Cold Spell (ACS)peak demand.
lWhile in the short term, the ENTSOE projectedztZAavailable capacity in some countries would lead toclosure of some existing plants, ensuring security ofsupply would require existing plant lifetime extensionor new build from 7A25 onwards in many countries.
r Note: This is in line with the MAF adequacyassessment which shows LoLE below 3 hrs in somecoyntries.
CCIMPASS LEXËCON
I Based on preliminary adequacy analysis, we haveidentified a number of countries in which the inítialcapacity mix set at ENTSOE MAF 2016 values wouldlead to old existing plant closure as non necessary toensure security of supply standard set at 3 hrs of LoLE
Country 2I¡¡0 overcãFacity lMWl Op€rational rêseruê lMWlAusttra
ihe Nellrå¡ lands
0enrnark
lr¿ ly
1 4il
110.)
400
1:r00
55]
751
t4i5
l1 i0Gern: afly l0rJo ¡ 120
Czech Bept.hlrc
Hungårl
Pcl år: ri
Romanr¿
?400
to:o
100i.i
t/ss -
7r)t)
340
!r4tì
I i:)
131û
a7a
ilolenr¿
Slovåkrã
40
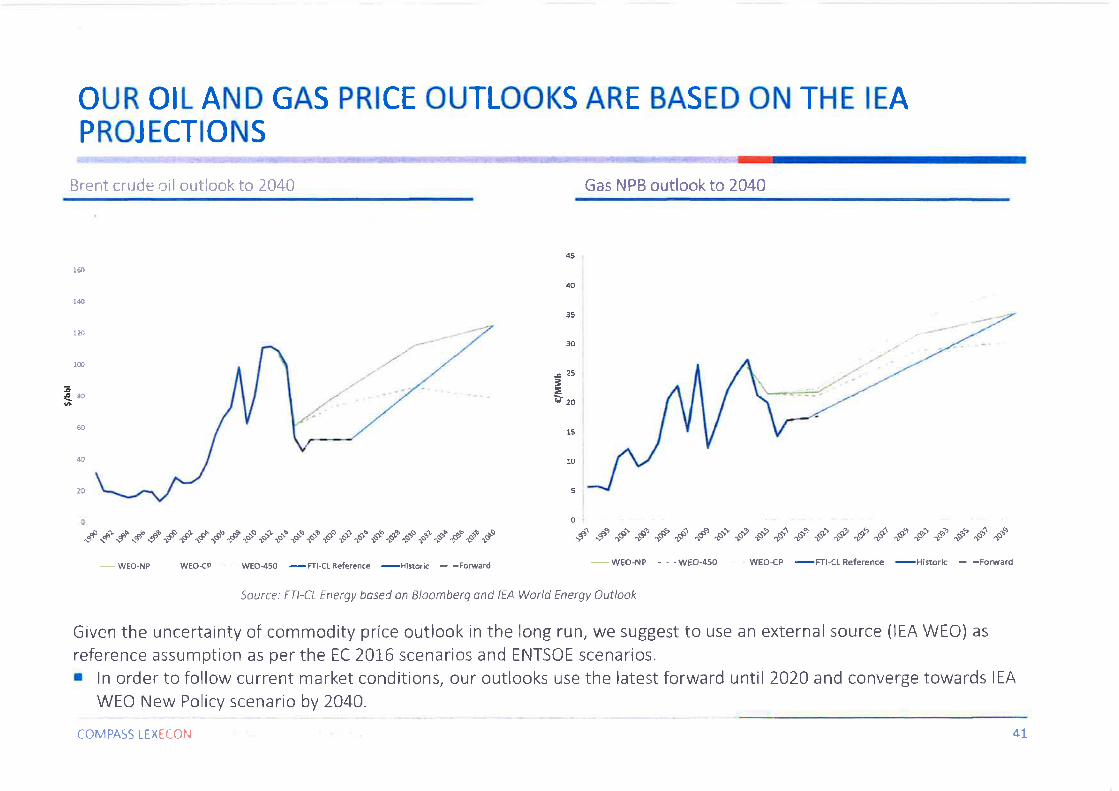
OUR OIL AND GAS PRICE OUTLOOKS ARE BASED ON THE IEAPROJECTIONS
Brent crude oil outlook to 2CI40 Gas NPB outlook to 2040
Source: FTI-CL Energy based on Bloomberg and IEA World Energy Auflook
Given the uncertainty of cornmodity price outlook in the long run, we suggest to use an external source {lEA WEO) asreference assumption as per the EC 2016 scenarios and ENTSOE scenarios,I ln order to follow current market cond¡tions, our outlooks use the latest forward until 2020 and converge towards IEA
WEO New Policy scenario by 2040.
CCIMPASS LEXECON 41
OUR COAL AND CO2 ETS PRICE OUTLOOKS ARE BASED ONTHE IEA PROJECTIONS
Csai AË.Å {-lF cutlook to 2ü40 CO2 EU ETS ourlook tCI 204CI
Source: FTI-CL Energy based an Eloomberg ond IEA Warld Energy Auiloak
Given the uncertainty of commodity price outlook in the long run, we suggest to use an external source (lEA WEO) asreference assumption as per the EC 201-6 scenarios and ENTSOE scenarios.I ln order to follow current market conditions, our outlooks use the latest forward until 2020 and converge tCIwards IEA
WEO New Pclicy scenario by 2O4A.
COMPASS LEXECCIN 42
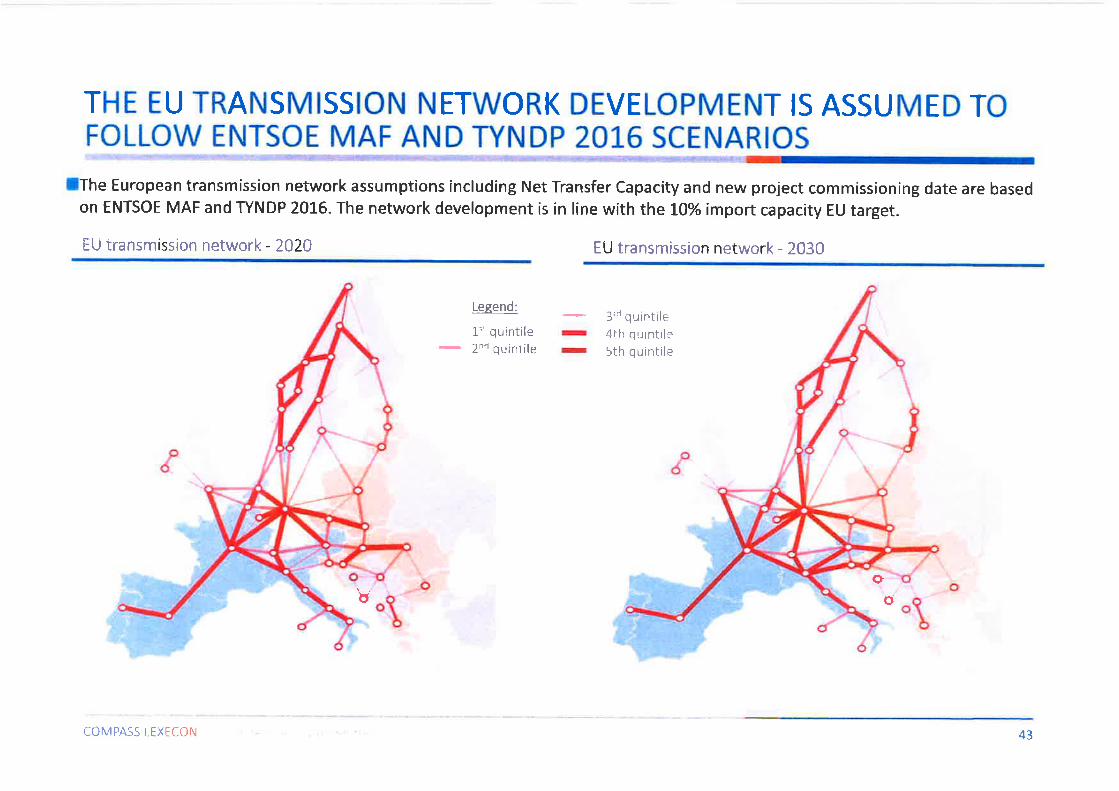
THE EU TRANSMISSION NETWORK DEVELOPMENT IS ASSUMED TOFOLLOW ENTSOE MAF AND TYNDP 2OL6 SCENARIOS
lThe European transmission network assumptions including Net Transfer Capacity and new project commissioning date are basedon ENTSOE MAF and TYNDP 2016. The network development is in line with the 10% import capacity EU target.
EU transmission network - 2AZA EU transmission network - 2030
Appendix 3- Competitiveness ofd iffere nt tech nol ogies
' o ¡ Ol
COf'V] PASS LEXECONÒ
ra. ' ' ' ' .,
COMPASS LEXECON 44
THE COMPETITIVENESS OF THE DIFFERENT TECHNOLOGIES IS A KEYPARAMETER FOR THE 550 EPS IMPACT'' 'É:- - "- {:-:
Ë;afiuilion cüsl i:r ai the crossrcads ûf ä number of assurflpi¡cns
I Two of the key drivers of the evolution of the costs of the electricity system are the relative cost of different technologies,as well as the rate of decornmissioning / new build throughout the modelling horizon,
I The 550 EPS impact will depend on the t¡m¡ng of its implementation (2025 or later) relative to the evolution of the costsof different generation technoiogies and investment / re-investment needs.
lThe relative competitiveness of each technologies combines:
rThe commodity assu mptions;
rThe technical features of each technologies; and
rThe cost and lífetime assumptions of each technologies.
fThe competitiveness of each technologies is assessed in our analysis through:
llThe Short Run Marginal Cost of production (SRMC) which combines the commodity assumptions with the technicalrfeatures (efficiency, VO&M, fuel CO2 content). lt indicates the marginal cost of each additional power produced unít.
E}- Levelised Cost of Energy (LCOE)which combines the fixed cost (CAPEX and FO&M) wíth the SRMC. lt indicates rhe
-full cost of each power produced unit. Note:the LOCE depends on the total production of the plant over its lifetime. Theless it produces, the highest would be the LCOE.
þfhe missing money calculated as the missing revenue once energy and ancillary revenues are accounted for to cover the-cost the plant would face when operating.
í-CMPASS LIXIiNI"J 45
SHORT AND LONG TERM PRODUCTION COST ASSUMPTIONS AREBASED ON ENTSOE DATA, DIW AND INDUSTRY SOURCES
-\lt )11 ':! lìt lr ..,i i, | 'i ¡-i:.ì,ti'ìi)'.ir,.
Efficiency HHVlY"l
CO2 content{tccz/Mwhf
0.336
0.336
0.336
0.336
0.185
0.185
0"185
0.185
0.r"85
0.185
0.185
N/A
N/A
VO&M(€/Mwhl
3
3
3
3
2
2
-)
2
3.5
35 ,3.5
5OO l/ r_000 *
Refurbishment// life ertension
- 10yrs{€/rw)
Zaa // 1ao
200 llßa
New build CAPEX(€/kwI
1600
80û
500
30 {year520 in 2020 to300 in 2040 **
FO&M{€/kwl
4A
4C
45
45
20
20
20
2CI
1û
10
1û
5
Lifetime(yearsI
wAccty"t
Hard Coalold 1
Hard Coalold 2
Hard Coal recent
New Hard coal
CCGT old 1
CCGT o|d 2
CCGT recent
New CCGT
OCGTold
OCGT recent
NewOCGT
DSR
Battery
33o/o
36%
41%
44%
33o/o
450/a
52%
560/o
27To
3B%
40+1040+10
40+1û40
25-)f-
25
lq.
25
25
25
+L0
+10
+ 1"0
9%
gola
9%
9o/a
8%
8%
8Ð/o
8o/o
8o/o
8o/o
L0%
10%
70%
41%
N/A
90%
N/A
l-0
' Ihe figures correspond to the activation cost on the wholesale day-ahead market.** l-he cost reduction is based on ETRI 2CI14 cost reductian (40% between 2020 and 2040), applied to Tesla PowerPack current cost.
COMPASS LËXICON 46
E THRoUGHoUT THE MODELLING HORIZON, COAL AND LIGNITESRMC REMAINS CHEAPER THAN GAS-FIRED GENERATION
Short run marginal cost of production (SRMC) - 2020 Short run marginal cost of production {SRMC} - 2t4ü
Note: Lignite SRMC is based on German lignite cost 47
THE LCOE SHOWS THAT RELATIVE COMPETITIVENESS OF EACHTECHNOLOGIES STRONGLY DEPENDS ON THE LOAD FACTOR
Relative competitiveness of technciogies
I The relative competitiveness of each technologies isstrongly correlated to the load factor.
rCoal vs Gas generation:
1. Above 4O%laad factor; existing coal plants aremore economic than new build CCGT regardless ofCCGTs load factor.
2. Above 80% load factor, new coal is more economicthan new CCGT.
¡Base load vs Peaking plant:
3. Peaking plants are more economic than CCGT at2O% laad factor.
4. Moreoveç the LCOE indicating the minimumaverage power price for the technology to beeconom¡c, it shows that:
* An OCGT running at 5% load factor capturing150€/MWh instead of 200 €/MWh would incur asmuch losses as a CCGT running at 50% load factorcapturing 70 €lMWh instead of 75 €/MWh.
Note: Lignite is not included in this chart.
Levelised Cost of Energy (LCOE) as a function of Load factor
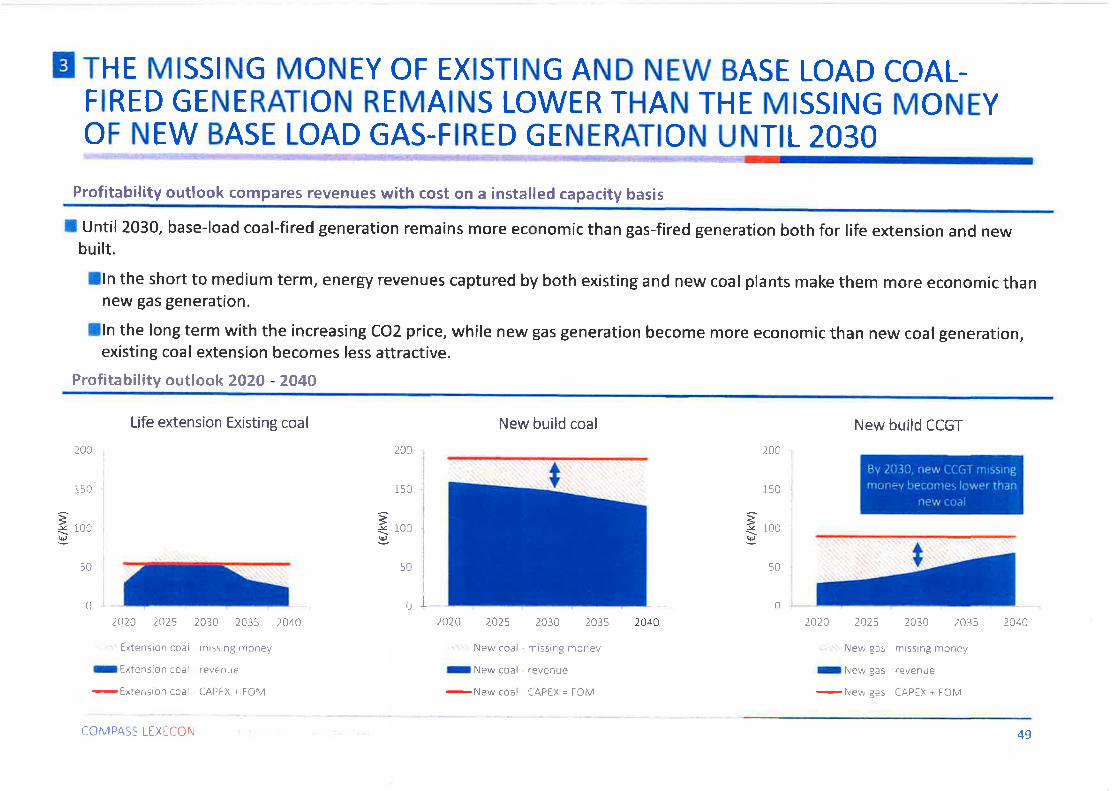
E rHr MtsstNG MoNEy oF EXrsrNG AND NEW BASE LoAD coAL-FIRED GENERATION REMAINS LOWER THAN THE MISSING MONEYOF NEW BASE LOAD GAS-FIRED GENERATION UNTIL 2O3O
Profitability outlook compares revenues with cost on a installed capacity basis
I Until 203CI, base-load coal-fired generation remains more economic than gas-fired generation both for life extension and newbuilt.
lln the short to medium term, energy revenues captured by both existing and new coal plants make them more economic thannew gas generation.
lln the long term with the increasing CO2 price, while new gas generation become more economic than new coal generation,existing coal extension becomes less attractive.
Prof¡tability outlookZA2O - 2040
Life extension Existing coal New build coal New build CCGT
00
150
10û
50
3vq¡,
inrl
150
10t
50
2 200
150
10c)
¡t,
J(Ë,
9xlfi,
0irl r'---nt
2020 2025 2030 2035 2û40
Êxtension coaì rn¡ssrng rnoney
I Êxtension coâl ¡pyg¡¡¿
-Extengion coal - CAPÊX + ËOM
2020 2025
. . New coal
INew coal
-New coal
2030 2035
missing mcney
revenue
CAPEX = FOM
2040 2020 2025 2030 2û35
New gas rnissing money
I New gas - revenue
-New gas CAPrX + FOM
2C40
COMPASS LEXTCON 49
IN THE SHORT TERM DSR AND OCGT ARE THE MOST ECONOMICPEAKING TECHNOLOGIES, BUT BATTERY COST REDUCTION MAKESTHEM MORE COMPETITIVE lN THE 2020s
--],.l.';.'.:':-.'¡',i.l..i-.]-:.:..'..-..,'.,
Capacity cost of peaking technologies
lWhile DSR potential remains limited, DSR volumes are more economic than new built OCGT.
lNew build OCGT capacity cost is assumed to remain stable throughout the modelling horizon,lw¡th battery cost reduction, battery becomes more competitive in the mid 2020s.
IThe competitiveness of the battery is strengthened by its capability to capture additional revenues from system servicesprovision
Capacity cost and rnissing money outloolc 2020 - 2040
lmpact of additionalancillary revenues Note: ihe irlustraîive
nissìng money cjoesn I
accoi.rrìi ior potentralenÊrgv reverrues wilcl.lsl-rou ld strengtherì thelornpetitiveness of OCGT¡rrd i,¡etierres vs DSR astheri' ,',RMC wouid belowe' ;nci there fore ietiheil capture rnf ra-nrargirìal rents.