Learning Alliance LRP Price Analysis March 2011 Local and Regional Procurement Technical Guidance: Price Monitoring and Analysis Erin C. Lentz 1 , Cornell University Copyright: March 2011: Local and Regional Procurement Learning Alliance: ACDI/VOCA, Catholic Relief Services, Cornell University, Land O’Lakes, Mercy Corps, and World Vision Introduction (ppt 11; slides 1-5) The objectives of this technical guidance document and the accompanying powerpoints are to assist country offices to (1) identify which prices change and by how much and (2) identify and interpret factors that can cause prices to change. This guidance is intended to supplement the Price Monitoring and Analysis powerpoints #11 & #12 and should be read either after reviewing the powerpoints or alongside the powerpoints. Definitional information and guidance on collecting prices are available in the LRP Price Collection Training powerpoints. Monitoring is ongoing in an information gathering, planning and analysis process. In the below figure, monitoring is depicted as the outer ring, feeding information into the planning and analysis and program implementation cycle. 1 Erin C. Lentz can be contacted at [email protected]1
Transcript
Learning Alliance LRP Price AnalysisMarch 2011
Local and Regional Procurement Technical Guidance: Price Monitoring and Analysis
Erin C. Lentz1, Cornell UniversityCopyright: March 2011: Local and Regional Procurement Learning Alliance: ACDI/VOCA, Catholic Relief Services, Cornell University, Land O’Lakes, Mercy Corps, and World Vision
Introduction (ppt 11; slides 1-5)The objectives of this technical guidance document and the accompanying powerpoints are to assist country offices to (1) identify which prices change and by how much and (2) identify and interpret factors that can cause prices to change.
This guidance is intended to supplement the Price Monitoring and Analysis powerpoints #11 & #12 and should be read either after reviewing the powerpoints or alongside the powerpoints. Definitional information and guidance on collecting prices are available in the LRP Price Collection Training powerpoints.
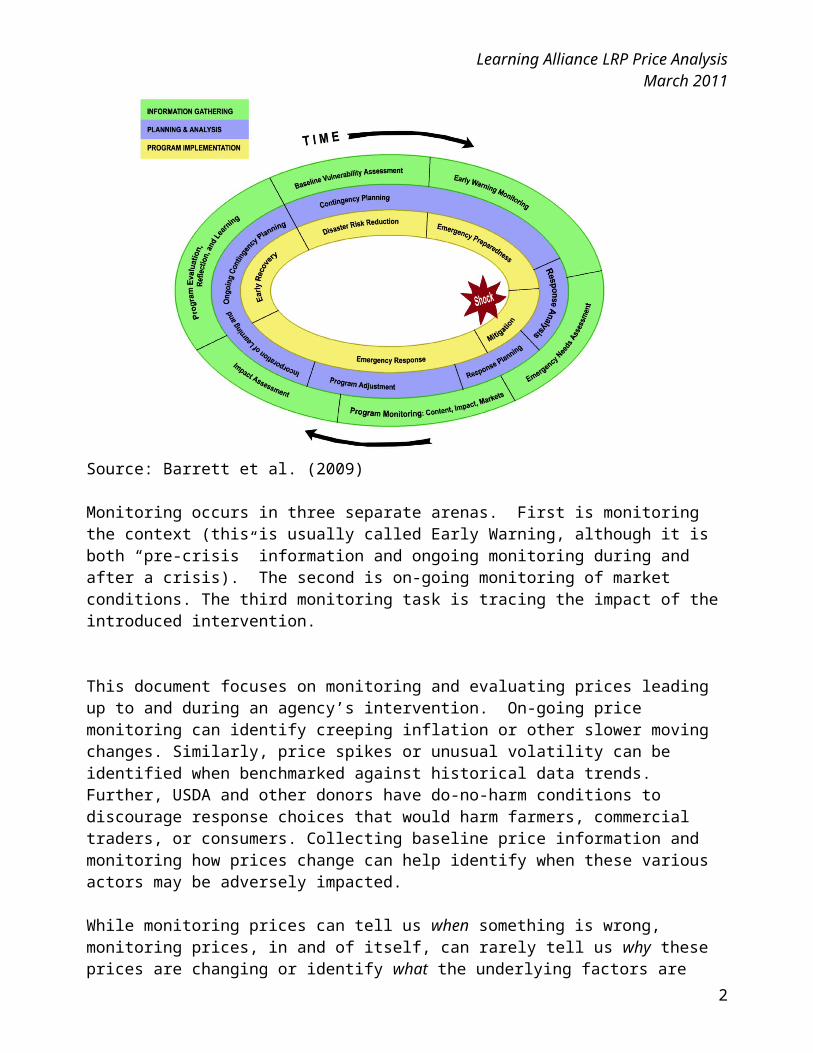
Monitoring is ongoing in an information gathering, planning and analysis process. In the below figure, monitoring is depicted as the outer ring, feeding information into the planning and analysis and program implementation cycle.
Source: Barrett et al. (2009)
Monitoring occurs in three separate arenas. First is monitoring the context (this is usually called Early Warning, although it is both “pre-crisis” information and ongoing monitoring during and after 1 Erin C. Lentz can be contacted at [email protected]
1
Learning Alliance LRP Price AnalysisMarch 2011
a crisis). The second is on-going monitoring of market conditions. The third monitoring task is tracing the impact of the introduced intervention.
This document focuses on monitoring and evaluating prices leading up to and during an agency’s intervention. On-going price monitoring can identify creeping inflation or other slower moving changes. Similarly, price spikes or unusual volatility can be identified when benchmarked against historical data trends. Further, USDA and other donors have do-no-harm conditions to discourage response choices that would harm farmers, commercial traders, or consumers. Collecting baseline price information and monitoring how prices change can help identify when these various actors may be adversely impacted.
While monitoring prices can tell us when something is wrong, monitoring prices, in and of itself, can rarely tell us why these prices are changing or identify what the underlying factors are that may be causing these price changes. When a price change occurs, we need to rule out and/or rule in possible factors that could contribute to a price change. A change in prices is not necessarily the result of an agency intervention. Therefore, price monitoring often includes identifying and assessing underlying factors that could cause price changes.
We first identify which prices change and by how much, in powerpoint #11. If prices are changing, we examine whether they are changing enough to warrant further investigation. Second, in powerpoint #12, we identify factors that frequently can cause prices changes. We provide possible data sources and a series of analytical tools that can help analysts evaluate the likelihood of each factor causing price changes. Analysts will need to evaluate each factor when analyzing a price change. Multiple factors may contribute to price changes.
Powerpoint #11 LPR Price Analysis – How are prices changing?
How are prices changing?To assess prices changes, follow four steps:
1. Convert prices2. Examine magnitude of price changes3. Determine when to investigate further4. Categorize price changes: Use analytical tools and data to identify possible sources of price
changes
(1) Convert prices (ppt 11; slides 6-9)Price data collection techniques are discussed more in the LRP Price Collection Technical Guidance.
Examine retail and wholesale prices separately.
For each commodity: To examine multiple retail (or wholesale) price points within the same market or across markets, establish that all prices are standardized to the same unit. For most commodities sold by retailers, this will be the price per kilogram or price per bag. For oil, this would be price per liter.
2
Learning Alliance LRP Price AnalysisMarch 2011
If some traders sell by the can or bucket, and others by the kilogram, converting them to the same unit will make them comparable. We cannot compare prices across traders if we look at prices per cups for some traders and prices per kilograms for others.
Example: In Haiti, a trader sells a cup of rice for 34.5 gourdes. It takes 5 cups of rice to equal 2.3 kilograms on the scale. To convert to price per kilogram, use the below formula:
Price/kg = (Price/unit * Number of units) / Weight in kgs on scale
Or, Price/kg = (Price/unit) / (units/kg)
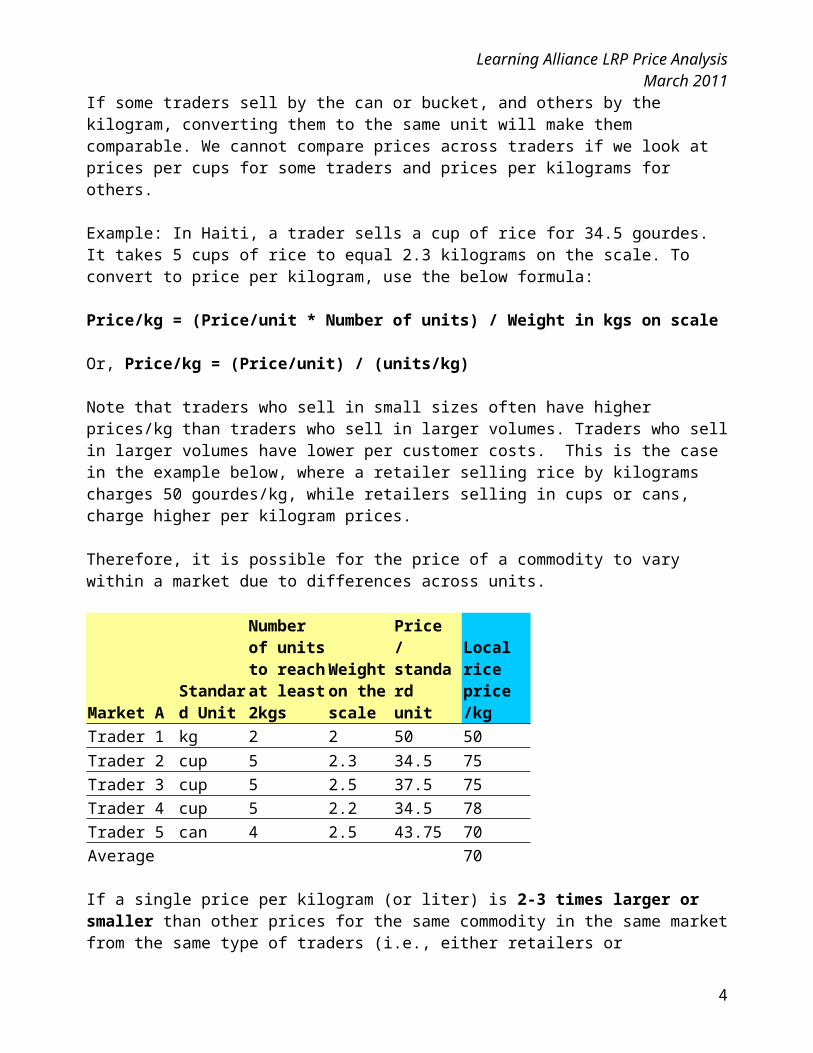
Note that traders who sell in small sizes often have higher prices/kg than traders who sell in larger volumes. Traders who sell in larger volumes have lower per customer costs. This is the case in the example below, where a retailer selling rice by kilograms charges 50 gourdes/kg, while retailers selling in cups or cans, charge higher per kilogram prices.
Therefore, it is possible for the price of a commodity to vary within a market due to differences across units.
Market AStandard Unit
Number of units to reach at least 2kgs
Weight on the scale
Price / standard unit
Local rice price /kg
Trader 1 kg 2 2 50 50Trader 2 cup 5 2.3 34.5 75Trader 3 cup 5 2.5 37.5 75Trader 4 cup 5 2.2 34.5 78Trader 5 can 4 2.5 43.75 70Average 70
If a single price per kilogram (or liter) is 2-3 times larger or smaller than other prices for the same commodity in the same market from the same type of traders (i.e., either retailers or wholesalers), the analyst should verify that the reported price is correct.
A number of different factors could cause this price difference. Rule out the following before proceeding with analysis:
Conversion error Misreporting or mismeasuring by enumerator Misunderstanding by trader
After ruling out the above factors, if a single converted price is still much higher than the others, speak with the trader about why his or her price seems much higher than competitors’ prices for the same commodity in the same market. Possible factors explaining higher prices are discussed below.
(2) Magnitude of price changes by commodity (ppt 11; slide 10)Continue to examine each commodity by each trader type.
3
Learning Alliance LRP Price AnalysisMarch 2011
As discussed above, prices for a particular commodity can vary by volume. Prices can also vary (a) across time and (b) across markets and time. We are most interested in understanding how prices change across time (e.g., price changes within a market before and after a procurement) or across markets and time (e.g., prices in markets where procurements occurred versus prices where procurements did not).
To understand these two types of effects, we compute within market, within period average prices for retailers and separately for wholesalers.
Graphing these series over time and across markets will help us identify triggers for further investigation.
(3) Triggers for further investigation (ppt 11; slide 11)For each commodity, we examine two questions (A) how prices differ within markets over time and (B) how prices differ across spatially distinct markets over time. For question A, further investigations are triggered when there are large changes in prices within a market. For question B, further investigations are triggered when there are large changes in price differences across markets over time.
To examine differences over time, we compute period-to-period prices changes. Prices often change over time in somewhat predictable patterns, due to seasonality and production cycles. When large prices changes deviate from these predictable patterns, we will need to investigate further.
To examine differences across markets over time, we compare changes in price differences. Prices across markets often vary due to different transportation costs and other factors. Therefore, we do not expect prices to be the same across markets. Rather, we expect that differences in prices across markets follow predictable patterns. We need to examine whether prices for a particular market seem to be outliers, that is, abnormal in comparison to what we would expect based on past price patterns.
A. How do prices differ within markets over time? (ppt 11; slides 12 - 19)Trigger = Large change in prices within a market
Investigate further if prices change more than 30 percent from one month to the next month Compute period-to-period differences in prices to determine how large the prices differences
are. If you are collecting prices more frequently than monthly, use 15 percent as a rule of thumb for biweekly data collection, and 7.5 percent for weekly price changes. Note that if prices jump one week by more than 7.5 percent but stabilize thereafter, that price jump should not necessarily trigger further investigation. However, if prices rise over several weeks such that the total month-on-month increase is greater than 30 percent investigate further.
Formula: (Current price – Last price) / Last price
The powerpoint slides provide an example of maize prices in Kenya. After confirming the prices are shillings per kilogram, we generate the average retail price per market. We also produce the average price across markets per month. Then, we graph the maize prices for each market over time. By inspection, we see that prices are much higher in July than in September. We then compute the period-to-period changes in maize prices per market. We find that in Eldoret, maize prices dropped by more than 30 percent between August and September.
4
Learning Alliance LRP Price AnalysisMarch 2011
This large price decrease warrants further investigation. We know that this price change occurred in Eldoret but not elsewhere. To investigate further, identify whether this change is (1) unique to Eldoret, (2) unique to maize, or (3) unique to this time period. Has infrastructure or some other community-level attribute suddenly changed, causing prices to fall in Eldoret? Is this drop in maize prices reflective of other commodities sold in Eldoret? Is this a normal seasonal price pattern for Eldoret?
Identifying whether this price change is unique by community, by commodity, or by time period will help narrow focus onto specific factors. Factors that are unique to the commodity or unique to the community are discussed in more detail below. In the Kenyan example, we continue analyzing prices to establish whether this price drop is consistent with previous years’ price patterns by computing (1) seasonal price index and (2) seasonal flow reversals.
Seasonal Price Index (ppt 11; slides 20-25)To examine the impact of seasonality on prices, we compute a seasonal price index, as described in the powerpoint. This index can be computed across all monitored markets, within an agro-ecological zone, or for a single market.
Comparing the all-Kenya seasonal price index to the Eldoret-specific seasonal price index, it becomes clear that maize prices in Eldoret are more variable than across averaged Kenya markets. However, as the seasonal price index also demonstrates, in Eldoret, while maize prices fall between August and September, these declines are not usually nearly as dramatic as our initial period-to-period change. Therefore, seasonality alone cannot fully explain the price decline.
A limitation of the seasonal price index is that it requires at least a few years of historical monthly price data. A complementary approach is creating a seasonal calendar. This could suffice when historical data are not available. Seasonal calendars are described in more detail in powerpoint #12.
Seasonal Flow Reversals (ppt 11; slides 26-27) While it is unlikely that seasonality alone can explain the sharp drop in Eldoret’s maize prices, it is worth investigating further the relationship between Eldoret, an outlying production area, and urban markets. Greater price variability in outlying production areas relative to urban areas is not uncommon in many countries. This is primarily due to seasonal flow reversals. During harvest times, outlying areas may have lower prices than urban areas. Traders from urban areas purchase harvests and evacuate them to urban areas for storage. During lean seasons, traders then move these products back to the outlying production areas, incurring transactions costs in both directions. During the lean season, these transactions costs drive prices in the outlying areas above urban market prices. Therefore, prices in rural areas may be more variable, and follow a different pattern than prices in urban areas.
To understand whether a seasonal flow reversal is responsible for greater price variability, compute a ratio between outlying area prices and urban prices. When prices are substantially above one, food is more expensive in the outlying area relative to the urban area (e.g., during a lean season). When prices are below one, food is less expensive in the outlying area relative to urban area (e.g., during a harvest season). The further the ratio is from one, the more variable are prices.
B. How do prices differ across spatially distinct markets, over time? (ppt 11; slides 28-31)Large change in price differences across markets over time
5
Learning Alliance LRP Price AnalysisMarch 2011
We are interested not only in how prices within a market vary over time, but also how price differences may vary across markets and across time. First, returning to the graph, we compare how prices vary by market. It is normal for prices to differ across markets. Different transportation, storage, and other costs will cause prices to differ market by market. In well-integrated markets, historical patterns of price variation by market will tend to be consistent across years (i.e., price differences between two markets will follow a pattern). When prices diverge from normal patterns (or when there is no discernible pattern), prices are likely not well integrated.
There is no firm trigger or rule-of-thumb when assessing changes in price differences across markets. Rather, analysts will need to compare current patterns to historical patterns and/or consider proportional changes. This is because the size of the price difference is not necessarily meaningful; distant markets may have large price differences, but may be well-integrated (i.e., their prices follow the same pattern and direction over time). Rather, we focus on changes to patterns of the price difference.
Comparing across markets, when an analyst identifies deviations from historical patterns, he or she will need to identify likely factors that could cause prices to vary in one or some markets but not in others.
How are prices changing: Categorize price changes (ppt 11; slides 32-34)Similar to evaluating price changes within a market over time, when examining price changes across markets identify (1) whether these changes are unique to this commodity, or whether all of the monitored commodities are changing in similar patterns, and (2) what the scale of the price change is.
Understanding how widespread the price changes are across commodities and across communities will help limit the range of possible factors that could lead to price changes.
For example, if all prices have increased much faster in one market than expected, there may be an issue unique to that market that is driving up prices. Perhaps traders are colluding, roads have been washed out, security in the area has deteriorated, etc. However, if only one price has increased faster in one market than expected, the factor causing the price increase could be more commodity-and-market specific. Infrastructural damage or security issues can likely be quickly ruled out. Rather, consider other factors. Perhaps the only wholesaler supplying this commodity has raised his or her prices or failed to restock quickly enough, the commodity is a festival food and demand spiked due to a celebration, or an agency locally procured more food than the market could manage, etc.
Assessing such factors will be discussed more systematically in the next section and next powerpoint presentation.
Introduction (ppt 12; slides 2-5)We now turn to identifying factors that frequently can cause prices to change and to presenting analytical tools that can help analysts evaluate the likelihood of each factor changing prices.
Country offices are well-situated to identify not only when price changes look abnormal but also to identify possible factors contributing to these changes. Throughout the monitoring process, a
6
Learning Alliance LRP Price AnalysisMarch 2011
common-sense understanding of the context of the crisis, how markets operate in local communities, what governmental and nongovernmental policies affecting food prices are, any supply or demand shocks, changes to inflation or fuel prices, seasonality, and traders’ expectations can help analysts interpret price changes and identify factors to investigate further. Key informant interviews, news reports, and reports from field staff can also alert analysts to factors that could be causing price impacts.
After determining that a price change warrants further investigation, identify those factors that could be causing prices to change. There are many possible factors that can cause price changes. We present the most frequent factors. Other factors may be more relevant in specific contexts. Discussions with key informants may assist in identifying additional factors to consider. Furthermore, limit the evaluation of candidate factors to only those that have changed. If a factor has not changed, do not investigate it further.
Frequent factors include:A. InflationB. Fuel pricesC. SeasonalityD. Demand shocksE. Supply shocksF. Trader collusionG. Government / nongovernment interventionsH. Food aid procurement or distribution
We first describe each of these factors. Second, we discuss approaches to selecting the best analytical tools for each these factors. Then, we describe the available analytical tools for assessing each of the above factors.
A. Inflation (ppt 12; slide 6)Inflation is the overall rise in prices of goods and services in an economy due to the decrease in the value of money. A fixed amount of funds can purchase less after inflation than before. There are two types of prices: nominal and real. Nominal prices are the prices observed in the market. Real prices are prices adjusted for inflation. The gap between real and nominal prices is inflation.
Inflation generally occurs across markets and across prices, but can be limited to specific regions, such as when a region is cut off from the rest of the economy.
B. Fuel prices (ppt 12; slide 7)Fuel prices increase both production costs and transportation costs. Increases in fuel prices may immediately lead to increased food prices, especially where transportation costs compose a major portion of the total food price.
Fuel price increases do not necessarily impact all commodity prices to the same degree. For example, the price of imported food that must travel long distances to remote markets may increase more rapidly than prices of foods that can be sourced locally. Furthermore, fuel prices can be highly variable, contributing to commodity price variability.
C. Seasonality (ppt 12; slide 8)
7
Learning Alliance LRP Price AnalysisMarch 2011
As discussed in powerpoint #11, prices vary by seasons. Following a harvest, food may be plentiful, driving prices down. During low production periods or leading up to the next harvest, food may be less plentiful, driving prices up. Seasonal price swings often have predictable patterns and can indicate appropriate times for interventions. Procuring food locally during a lean season increases demand, potentially exacerbating prices increases. Distributing food aid during a harvest could potentially drive down prices further. Weather patterns, production patterns, kidding and lambing patterns, etc. can predictably influence prices and are attributes of seasons.
Rural poor households often face transitory food insecurity, when they regularly cannot afford to purchase food during a particular time of year. Seasonal flow reversals may contribute to even greater price variability for rural households compared to urban households.
D. Demand shocks (ppt 12; slide 9)A demand shock occurs when demand suddenly increases, driving prices upwards. Demand shocks can be localized or can occur across entire regions or countries. They can be due to a single event (e.g., a flood) or to a longer-process (e.g., increasing global demand for grain). Demand shocks can take many forms. A few examples include: increased regional or global demand, access to certain markets eroding, increased local demand, short-term spikes in demand, and regular increases in demand. Demand can increase because of windfalls (e.g., increased remittances) or because own-production is not adequate for household needs.
Assessing local demand shocks generally requires some knowledge about livelihood strategies for local populations, and about how current situation differs from what is normal. News sources and key informants will likely be able to identify nation-wide or broader reaching demand shocks. Some shocks may cause prices to rise for a short period of time, and other shocks may cause price increases to persist. Establishing the expected duration for a demand shock can provide insight into whether changing an intervention strategy is warranted, or whether a demand shock is partially responsible for a prolonged price change.
E. Supply shocks (ppt 12; slides 10-11)Supply shocks can disrupt the movement of food along any point of the supply chain. For example, supply shocks can impact production through increased prices of inputs, production failures or shortfalls, changes in storage capacity, labor shortages, etc. Supply shocks can also occur following infrastructural damage, disruption to transportation, new regulations, conflict, and new trade policies.
Constructing a supply chainSupply chains can pinpoint how market actors may be affected by a supply shock. Supply chain analysis can also be useful for identifying points in a supply chain most at risk for non-competitive behavior. To link different types of traders to one another and to identify major and minor trade channels, ask major traders and market actors the following questions:
Ask traders: From whom and where do they buy? How many suppliers do they have? To whom and where do they sell? How many customers do they have? What prices are their buying and selling prices?
8
Learning Alliance LRP Price AnalysisMarch 2011
How frequently do they restock
If feasible, verify information by speaking with downstream and upstream traders.In order to adequately capture what the supply chain looks like, categorize traders based on:
Typical supply routes To whom they sell and from whom they buy Monthly volumes of sale Types of transport they own or have access to Credit they can leverage Food storage options Common constraints
Other information such as trader counts and volumes can be included as well.
When seeking to understand a supply shock, examine which segments of the supply chain are affected. Use the supply chain to ask key informants whether there are alternatives to these affected segments.
F. Trader collusion (ppt 12; slide 12)Competitive markets have the following elements: fungibility and divisibility of commodities, numerous firms, and few or small barriers to firm entry or expansion. Within commodity markets, (1) the number of firms and (2) the ease of entry and expansion are key indicators of supplier competitiveness. When these conditions are not met, it may be easy for traders to behave collusively, either to fix prices or control the supply of products.
Monopolies and oligopolies exist because other firms find it unprofitable or impossible to enter the market for some reason, in spite of the fact that the incumbent firm(s) earn(s) positive profits from trade. This implies the existence of entry and mobility barriers. An entry barrier keeps new firms from entering the business at all. Mobility barriers keep incumbent firms from expanding either the scale (i.e., volume) or scope (i.e., functions or products) of their existing business.
Barriers arise from any of several sources:1) Technical barriers arise when a significant minimum efficient scale of operation exists due
to declining marginal costs of operation (e.g., for motorized transport) 2) Legal barriers arise from state protections. 3) Informal barriers arise due to sociocultural restrictions that limit physical access to certain
areas or information access that may be essential to arbitrage or to contract enforcement. 4) Firm-created barriers emerge where firms actively work to exclude others from the market
through costly investments of their own, especially investments that are effectively irreversible (so-called “sunk costs”).
Use supply chain mapping to disaggregate the commodity value chain into distinct functions – e.g., farm-level collection and assembly, wholesaling, transport, milling, interseasonal storage, retailing – just as we commonly disaggregate the national market into distinct geographic locations. Then, look for entry or mobility barriers that inhibit growth in marketing intermediaries’ throughput volume and specific bottlenecks associated with noncompetitive behavior.
9
Learning Alliance LRP Price AnalysisMarch 2011
Some market segments are more susceptible to non-competitive behavior than others. Focusing on those segments meeting fewest competitive elements may decrease the data collection and time burden. For example, if many retailers are active and ease of entry and exit seem well-established, focus on other aspects of the supply chain where there are fewer competitors and higher barriers to entry, such as transportation, milling, and wholesaling.
If a market segment appears not to be competitive, ask traders who either sell or buy from the segment of interest about how easy or difficult it is to enter that market segment, what sorts of barriers exist, and how many new entrants there have been in the past few years.
Traders commonly closely guard information on market share, so it can be tough to collect precise data. One must often rely on qualitative assessments and indirect observations (e.g., all the lorries seem to belong to the same firm; there is only one large-scale commercial mill in the area for grinding grain into flour).
Even then, the implications for expected price changes are not immediately clear, although when markets are noncompetitive, the rate of price increases is typically half again higher or double the rate under perfect competition due to oligopolistic mark-ups.
G. Government and nongovernment interventions (ppt 12; slides 13-16)A food policy is one that affects trader, producer or consumer behaviors and decisions about food. Policies can affect food markets, transport capacity, competitive behavior in markets, imports, exports, demand, and production. International, regional, national and local policies can all affect food markets. Unofficial practices and informal policies can impact the ability of food to flow within a country or across borders. Corruption and other informal influences on trading behavior should be treated as policies, particularly if traders commonly face them.
Policies that change frequently can be a source of price volatility, increasing risk for market actors. Traders and producers facing risky market environments and highly uncertain prices may be less responsive to increased demand. The more accountable, stable, and transparent the policy making authority is, the less policy risk for traders, producers and consumers.
Not all policies-on-the-books are implemented. And, not all implemented policies are enforced, or even enforceable. Some policies may have competing or countervailing effects with one another.
Key policies affecting food market actors:
FEWs lists key policy parameters and their potential impacts on both markets and the population.
FEWs Policy Impacts (2009, Lesson 3, p. 24)
Policy Possible Impacts on Markets Possible Impacts on PopulationImport restrictions Reduced suppliers, slower and
more limited response, possible Reduced availability, higher prices, smuggling tends to push
10
Learning Alliance LRP Price AnalysisMarch 2011
smuggling and associated increased costs of trade
up prices
Price ceilings on food items Reduced returns, lower supply Reduced availability, lower pricesGrain reserves Good management leads to more
stable supplies; Poor management leads to great uncertainty and volatile market conditions for traders
Good management leads to more stable supplies with lower and more stable prices; Poor management leads to more erratic supplies and prices
Taxes along the market chain Depending on elasticity, higher costs of trade and reduced supply
Depending on elasticity, higher prices and less availability
Export ban Reduced market outlets, increased stocks, lower returns
Increased availability, reduced prices
Export ban in neighboring country
Reduced formal and informal flows in country, reduced supply, slower and insufficient response, possible smuggling and associated increased costs of trade
Reduced availability, higher prices, smuggling tends to push up prices
Import ban in neighboring country
Reduced market opportunities, lower returns and reduced incomes, more local supplies
Increased or excess availability, reduced access for those whose income is dependent on exports, lower prices
Support prices for producers Increased production and supply (sometimes a draw for cross border flows)
Better prices for producers, higher prices for consumers, tighter margins for traders
Subsidies to input imports Increased production Increased availability and lower prices
Food aid distribution Depending on elasticity, decreased demand for commodities, lower returns, less supply response
Increased availability, decreased prices
Cash transfers Depending on elasticity, increased demand for food; higher returns, greater supply response
Depending on elasticity, increased access to food; depending on elasticity, increased availability and higher prices
Sources of policy information Secondary sources on previous and current governmental policies can be found on
government websites, World Bank reports (e.g., the annual Cost of Doing Business report) and IMF reports. The effect of these policies may also be analyzed in the academic and gray literature.
For information on new policies, engage in key informant interviews with government officials, local NGOs, bankers, transporters, etc. as appropriate to the question being asked.
o Topics such as informal policies or sources of policy risk will be best answered by traders or key informants with knowledge of market actors.
o Discuss with key informants whether or how traders, consumers, and producers are likely to be influenced by a policy change.
Key informant discussion topics:Discuss the duration of the policy, the policy objectives, what the policy authority monitors, whether the policy is likely to change.
11
Learning Alliance LRP Price AnalysisMarch 2011
Subsidies:o Are imports, inputs (e.g., fuel) or retail food subsidized? By how much?
Price floors and ceilings:o Does the government set wholesale prices for staples or substitutes? Are there price
ceilings or fixed producer prices? Taxes and tariffs:
o Are staple products taxed? Do importers pay tariffs on staple products? Non-tariff barriers:
o Does the government require trader licensing? Is it difficult, time-consuming or expensive for traders to gain these licenses?
o Do local bureaucratic bottlenecks due to non-tariff barriers such as sanitary and phytosanitary standards, fumigation policies, certification requirements, or biosafety controls – especially important with respect to genetically modified foods exist?
Import restrictions:o Does the government / local authority control or restrict imports?
Export restrictions:o Does the government / local authority control or restrict exports?
Public stockholding and sales:o Does the government have large grain reserves? Does it plan to release reserve
stocks? Will that decision be made known to traders beforehand? Transfers:
o Does the government or other agencies provide food aid transfers, income transfers, and local procurement?
Exchange Rates:o Are exchange rates fixed or floating? If the exchange rate for domestic currency is
fixed, is it properly valued, overvalued or undervalued?
Policy outcomes depend on the policy-making authority’s enforcement ability. To assess the degree of policy risk for food market actors consider:
Does the government / local authority frequently change its food and trade policies? Is there speculation about significant policy change? Historically, has the policy-making authority announced policy changes with adequate
warning? Are policies generally implemented, and if so, are they enforced evenly across populations
and regions? Has popular protest changed policy-implementation? Is corruption pervasive?
H. Procurement or distribution (ppt 12; slide 17)Creating price risk for consumers, producers and traders is an often-cited concern for all food assistance programs. The size and timing of the intervention influence the likelihood that procurement or distribution will have market effects.
Identify the size of the program relative to the local economy. If the program is small relative to the economy (e.g., 10% or less of cash flows locally during the relevant period), the program is less likely to have adverse effects on the local economy. Similarly, timing matters. Procuring food
12
Learning Alliance LRP Price AnalysisMarch 2011
during a lean season can create greater price pressure than procuring food during harvest. Planning distributions and procurements with seasonal prices in mind can help agencies avoid creating or contributing to price variability.
Often, multiple factors impact prices (ppt 12; slides 18-19)The Malawi example shows that price changes may occur due to a combination of factors. Therefore, analysts ought to consider all plausible factors when examining a price change. It can be extremely difficult to assign relative weights to different factors. However, factors that are hard to anticipate, that are extremely disruptive, or large in magnitude may exert stronger influences on prices than factors that deviate only slightly from their normal patterns.
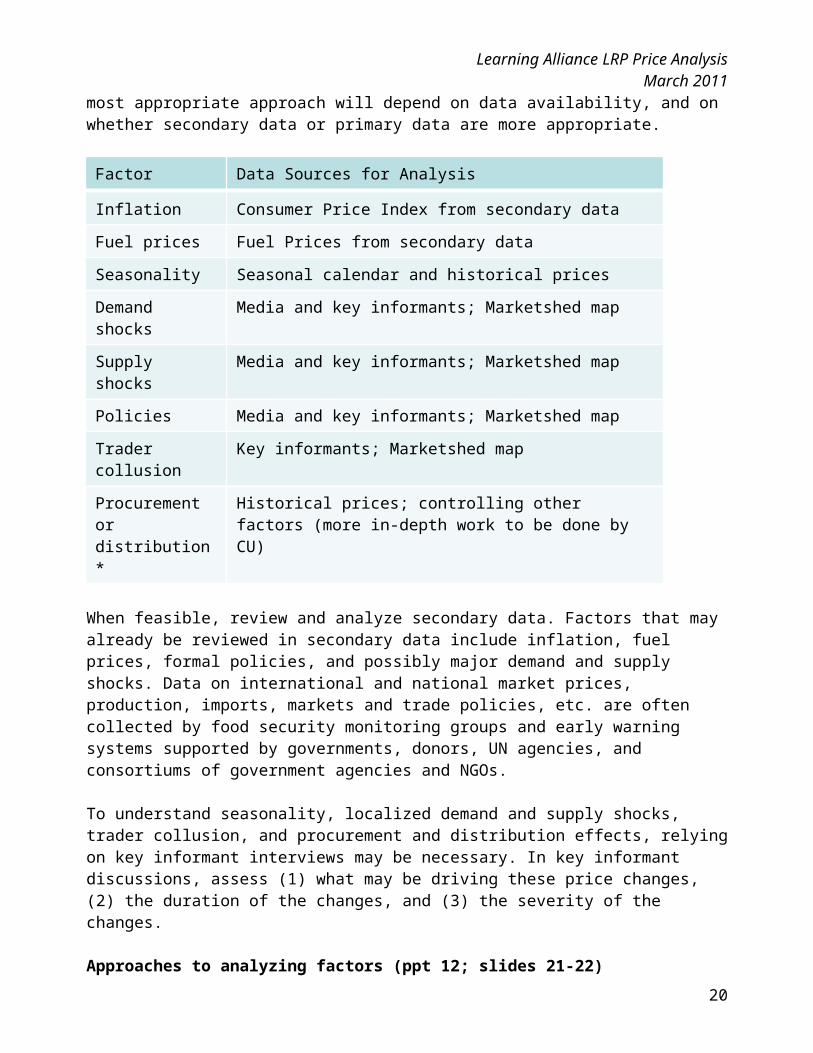
Data sources for analyzing factors (ppt 12; slide 20)The below table links factors with data sources and analytical approaches. For some factors, it is possible to employ a single analytical tool to evaluate the prospective impact of a particular factor. For other factors, multiple approaches can be used. The most appropriate approach will depend on data availability, and on whether secondary data or primary data are more appropriate.
Factor Data Sources for Analysis
Inflation Consumer Price Index from secondary data
Fuel prices Fuel Prices from secondary data
Seasonality Seasonal calendar and historical prices
Demand shocks Media and key informants; Marketshed map
Supply shocks Media and key informants; Marketshed map
Policies Media and key informants; Marketshed map
Trader collusion Key informants; Marketshed map
Procurement or distribution*
Historical prices; controlling other factors (more in-depth work to be done by CU)
When feasible, review and analyze secondary data. Factors that may already be reviewed in secondary data include inflation, fuel prices, formal policies, and possibly major demand and supply shocks. Data on international and national market prices, production, imports, markets and trade policies, etc. are often collected by food security monitoring groups and early warning systems supported by governments, donors, UN agencies, and consortiums of government agencies and NGOs.
To understand seasonality, localized demand and supply shocks, trader collusion, and procurement and distribution effects, relying on key informant interviews may be necessary. In key informant discussions, assess (1) what may be driving these price changes, (2) the duration of the changes, and (3) the severity of the changes.
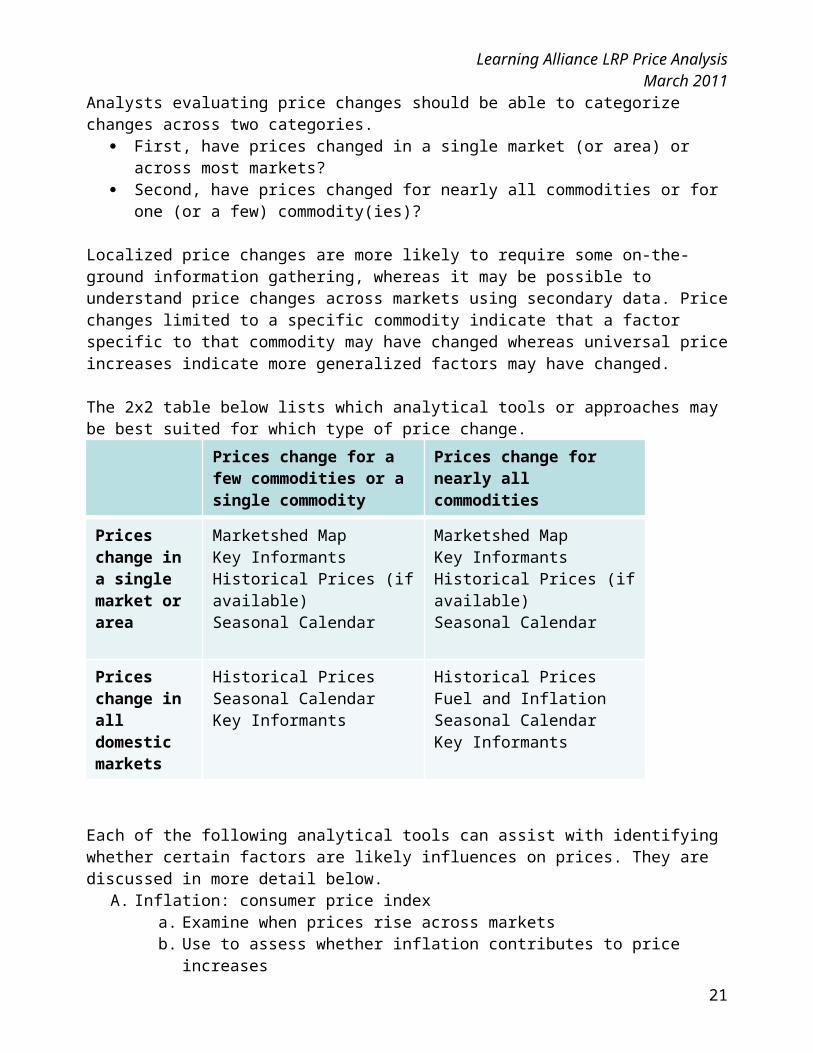
Approaches to analyzing factors (ppt 12; slides 21-22)Analysts evaluating price changes should be able to categorize changes across two categories.
First, have prices changed in a single market (or area) or across most markets?
13
Learning Alliance LRP Price AnalysisMarch 2011
Second, have prices changed for nearly all commodities or for one (or a few) commodity(ies)?
Localized price changes are more likely to require some on-the-ground information gathering, whereas it may be possible to understand price changes across markets using secondary data. Price changes limited to a specific commodity indicate that a factor specific to that commodity may have changed whereas universal price increases indicate more generalized factors may have changed.
The 2x2 table below lists which analytical tools or approaches may be best suited for which type of price change.
Prices change for a few commodities or a single commodity
Historical PricesFuel and Inflation Seasonal CalendarKey Informants
Each of the following analytical tools can assist with identifying whether certain factors are likely influences on prices. They are discussed in more detail below.
A. Inflation: consumer price indexa. Examine when prices rise across marketsb. Use to assess whether inflation contributes to price increases
B. Fuel pricesa. Examine when prices rise across marketsb. Use to assess whether changing fuel prices contribute to price changes
C. Historical prices a. Use to identify seasonal price trendsb. Use to identify price trends across markets over timec. Use to benchmark current price trendsd. Use to assess impacts of procurement and distribution
D. Key informant interviews and news sourcesa. Use to assess possible impact of government or nongovernment interventionsb. Use to assess impacts of demand or supply shocksc. Use to assess trader collusiond. Use to assess impacts of procurement and distribution
E. Seasonal calendara. Use to assess seasonalityb. Use to anticipate directions of future price changes
F. Marketshed mappinga. Best for price changes limited to specific areas
14
Learning Alliance LRP Price AnalysisMarch 2011
b. Use to assess possible impacts of local demand and supply shocksc. Use to assess local trader collusion
A. Inflation: consumer price index (ppt 12; slides 23-24) Inflation can cause prices to rise and tends to occur nationwide for most commodities. Adjusting prices by the CPI can help explain changes in prices over time and can inform analysts about the real value of cash transfers. In high inflation areas, the value of a cash distribution, if not indexed, will erode over time. However, it is possible for localized inflation to occur, for example, after a shock that cuts some regions off from others.
The consumer price index (CPI) is one common way to measure inflation. CPI measures changes in prices for a basket of consumer goods and services over time. Each country’s CPI is a country-specific basket of heavily used goods and services. The base of the index is set equal to 100. To deflate nominal prices, divide the commodity prices series by the CPI for that same period. Deflate any available historical data as well. Note that some governments recalculate their CPIs, making earlier periods using the older CPI not comparable to newer CPI values. Use price data starting in the same period or after the new CPI.
Data sources: Most countries’ central banks or finance ministries collect and report monthly CPI or
inflation rates. The International Monetary Fund’s International Financial Statistics service (IMF IFS) also
reports this information: http://www.imfstatistics.org/IMF/imfbrowser.aspx?branch=ROOT B. Fuel prices (ppt 12; slides 25-26)A major component of food costs can be fuel costs. Therefore, increases in fuel prices often lead to increases in food prices. A fuel-price increase usually results in nation-wide higher prices for all commodities, with bulkier commodities, imports, or commodities with long internal transport routes possibly increasing more relative to other commodities. In rare cases, a localized shock could increase fuel prices in a particular region. Key informant discussions should be able to identify any rapid fuel price changes occurring in one area but not in others.
To use fuel price information, graph fuel prices alongside commodity prices. If commodity prices trend with fuel prices, this indicates that changing fuel prices may be contributing to price changes. Computing the ratio of food to fuel price can help analysts to understand what happens to food prices as fuel prices change. Data sources:
Most countries’ central banks or finance ministries collect fuel prices for use in their CPI computations. Look there for historical and current fuel prices. Usually fuel prices are only available for one location. Therefore, relying on secondary data will not alert analysts to region specific fuel price spikes or declines.
C. Historical prices (ppt 12; slides 27-29)As discussed in powerpoint #11, examining historical prices can provide information on seasonal prices trends, on cross-market differences in prices, and can help analysts benchmark current price trends. Seasonal price indices, seasonal flow reversal, and month-to-month price changes can all be computed using historical prices.
Examining price changes can also provide information on the possible impact of procurement and distribution. This can be crudely assessed through computation of month-to-month differences over time (more complex approaches are required to establish causality). If current price changes are similar to historical price changes, it is unlikely that a new procurement or distribution is strongly influencing current prices. However, if the pattern of current price changes differs from historical changes, then further investigation into contributing factors will be required.
Historical prices may not be available for all monitored markets.
D. Key informants and news sources (ppt 12; slides 30-32)Key informant interviews can be a helpful source of information on both what factors could be causing prices to change but also what factors are most likely to cause these prices changes. Key informants can help to assess the (1) duration (2) severity and (3) direction of price changes associated with policy changes, demand shocks, supply shocks, and trader collusion.
Based on whether price changes occur within a single market or area or across all domestic markets, target which key informants to approach. Local-level discussions at distribution or procurement sites will be most helpful when price changes are limited to these locations whereas discussions with individuals knowledgeable about the wider economy may be more effective when prices change across markets. Government officials, individuals familiar with policies and/or macroeconomic climate When a single commodity price across markets or many prices across markets change, discussions with department (or ministry) or agriculture officials, other government officials, or individuals familiar with policies and the macro-economic climate can inform an analyst about cross-cutting factors that could be driving price changes. Large traders or importers may also be able to provide insights into factors causing national level price changes. Collect information on:
Import parity prices at destination markets, and possible source markets if food aid local and regional procurement is ongoing
Production estimates and current stocks Trade volumes Policy changes Other potential shocks to market systems
Traders, local market actors, or field staff:When price changes are localized or just affecting a few markets, traders, local market actors and field staff may be able to provide information on contributing factors and the expected duration and the direction of a price change. Trader expectations, historic trends, and projections (e.g., of production) may provide information on whether the current situation is expected to improve or deteriorate, and for how long. This may be helpful when assessing whether observed changes are one-off anomalies or indicative of longer-term or systemic changes.
Collect primary information on: Changes in any major trader costs: transport, storage, leakages Trader reports in changes in availability: transport, storage, leakages Volume and changes in volume
16
Learning Alliance LRP Price AnalysisMarch 2011
Informal discussion with traders about how business is compared to average for this time of year, any new or current constraints, and expectations
Changes in market characteristics, such as the number of type of traders operating, changes in products offered, changes in infrastructure
Any other observed changes in how markets are functioning
Smaller traders are typically able to provide information on general market functioning, competition levels, supply chains, volumes and prices in markets, seasonal differences, costs, and any constraints on their trade.
17
Learning Alliance LRP Price AnalysisMarch 2011
E. Seasonal calendar (ppt 12; slides 33-34): Worksheet
Why Seasonality Matters:
(1) Surplus producing areas and importing areas Below is an example of the seasonal calendar of maize production in Tanzania. Maize production in Tanzania is either bimodal and unimodal, depending on the location. Note when the harvest seasons are. The seasonal calendar by region is then mapped, showing commodity flows and production levels. If a production shortfall were to occur in one area, an analyst could identify whether such a shortfall would impact neighboring areas or markets.
(2) Seasonal price variationsSeasonality also matters because prices can change with the season. This intra-season price variability is particularly strong in countries or locations with weak or highly centralized storage and poor credit markets. For example, in Mozambique, with unimodal maize production, the hunger season peaks in December and January, while harvests run April through June.
The following are guiding topics that may be important to include in a seasonal calendar. Some issues, may not be relevant.
a. Major weather patternsb. Production cycles of the major consumption crops, and the major cash crop or livestock growth
cycle, if relevanti. Track more than one if necessary
c. Lean periods / hungry seasons (e.g., in which months of the year do households not have enough food to eat)
d. Major regular shocks (e.g., flooding) Market activityi. Seasons when markets are most active (what is sold or bought by whom)
ii. Seasons when markets are most quiet and whye. Procurement or distribution activityf. Regular ceremonies or holidays that increase demand (e.g., Eid)g. Others as appropriate (e.g., quality if it varies over the year or migration)
Different areas within a country may have a different seasonal calendar. Seasonal calendars are most helpful when paired with analysis of historical price data. Focus on the calendars relevant for distribution and procurement sites. If price data are not available for relevant distribution and procurement sites, generate seasonal calendar for major production zone and use historical price data for urban areas or for major production zone.
18
Learning Alliance LRP Price AnalysisMarch 2011
First create an annual timeline similar to the one below. Then, overlay the seasonal calendar onto a marketshed map, using key informants to understand trade flows across markets or regions and production levels within regions.
Month Weather Production of key staple2
Price of staple3
Production of cash crop or livestock1
Hungry/ lean season4
Regular shocks / major holidays
Market Activity5
Procurement or distribution activity
Major Holidays
Jan Feb March April May June July August Sept Oct Nov Dec
2 No activity, Planting, or Harvest3 Within a year, when are prices average=A, higher than average=H, lower than average=L?4 Indicate months that are associated with increased food insecurity.5 Low volume sold to traders = LVS; high volume sold to traders= HVS; low volume bought by traders=LVB; high bought from traders = HVB
19
Learning Alliance LRP Price AnalysisMarch 2011
Example of Seasonal Calendar from FEWS for Tanzania
The FEWS map below identifies how maize production flows within the region of northern Tanzania, western Kenya and eastern Uganda throughout the year. This map identifies prospective surplus producing regions as well as regions that tend to be importers. Note that maize flows from border areas in Tanzania into Kenya match with the unimodal Masika maize harvest time in the above seasonal calendar. A maize production failure in a surplus region could adversely affect neighboring importing regions. Determining whether neighboring markets have linkages to other surplus markets or to import markets will assist in understanding market integration and traders’ abilities to respond to increases in demand.
FEWS: Maize Production and Market Flows
Source: Awuor, T. (2007) “Review of Trade and Markets Relevant to Food Security in the Greater Horn of Africa: A special report by the Famine Early Warning Systems Network (FEWS NET).” P. 24.
21
Learning Alliance LRP Price AnalysisMarch 2011
F. Marketshed map (ppt 12; slides 35-37): Worksheet
1. What is a marketshed?
A marketshed is the geographical area and population that has actual or potential trade relationships with a market center. Marketsheds are composed of a network of markets and trading partners.
2. What is a market?• Markets are composed of:
– Buyers and sellers – Institutions and infrastructure– Others behind the scenes: importers, processors, storage owners, wholesalers,
credit suppliers, government officials and policies • Relative functioning of a market depends on:
– Number, size, independence of buyers and sellers– Formation of prices– Availability of information on prices and costs– Ease of entry and exit
• Relative functioning of a market system depends on:– Reliability of contract enforcement– Integration across markets– Institutional framework (infrastructure, government policies, etc.)
3. What is a marketshed map?A local, regional, or national map plotted with information collected during key informant interviews and focus group discussions. At the local level, market characteristics can be assessed quickly using market mapping. Basic market maps identify which physical areas are facing market constraints and can be updated as more information becomes available (Adams and Harvey, 2006).
• Can identify:– Surplus areas– Potential weak market functioning– Major marketing hubs– Import and export centers– Trade routes and seasonal flow– Infrastructural constraints– Estimates of the number of wholesalers and retailers in each market
Can be augmented with additional information on volume, market integration, transaction costs, transportation routes, etc. as it becomes available (i.e., from traders, from supply chain and margin analyses, from policies and practices, and from market integration analysis).
4. What can a marketshed map contribute to price analysis?
22
Learning Alliance LRP Price AnalysisMarch 2011
At the local level, market characteristics can be assessed quickly and visually using market mapping. If price changes are limited to a specific market or a specific area, mapping that area and noting any changes to that area can help to identify factors that may be causing the price changes.
Furthermore, in distribution and procurement areas, mapping markets can provide insight into how the markets used by food insecure households link with larger markets and how procurement areas may link with larger markets, respectively. The more inter-connected a smaller marketshed is with larger markets, the more likely that the smaller market will be able to increase supply.
5. Generating a marketshed map Map
o The level of detail will depend on what geographic area the map is trying to capture. For example, it can be hand-drawn for a community market map.
First assess whether seasonality affects trade routes, source markets, number of traders operatingo If so, create maps by seasono Different regions may have different seasons (e.g., unimodal versus bimodal)
Then, use key informant discussions to include information regarding:o Main market hubs utilized frequently by food insecure populationo Smaller markets also utilized by the same populationo Storage facilities or centers o Major supply markets used by wholesalers and retailers in the marketshed
Secondary data may already be collected for larger markets that link to affected marketsheds
o Market routes and roadso Any infrastructural damage in the markets or along main route o Prices of key commodities in each of the marketso Approximate number of retailers and wholesalers
As data becomes available, it is possible to incorporate supply chains, policies and practices, and market integration.
For prospective local and regional procurement source markets, as data become available also consider including:o Production and food supply estimates (FAO /GIEWS; food balance sheets). o Estimated procurement (IPP) and transport costs for source market.o Routes prone to disruptions, e.g., due to flooding, conflict, customs delays
6. Usages and limitations of the analytic:A quick mapping of markets focusing on key attributes can identify those most at risk poor functioning (e.g., isolated regions with fewer roads and limited linkages to major surplus or import markets). However, if a response will be geographically disperse, a detailed mapping of all markets may not be feasible.
In cases where infrastructure has been damaged or routes or markets are blocked, market
23
Learning Alliance LRP Price AnalysisMarch 2011
mapping is a rapid way to assess the existence of alternative routes and alternate, secondary markets. Mapping the market may provide basic, but limited, context, particularly in regions of chronic food insecurity.
If prices have changed within a distribution zone or procurement zone, market mapping may usefully identify (or rule out) any market-specific factors that may be causing price changes (e.g., infrastructural damage, breakages in supply chains, out-migrations of traders, localized production failures, increased reliance on markets by households within the marketshed, local security threats).
FEWS Key Components of a Market Relation:
Source: FEWs (2008) Market Analysis and Assessment. Lesson 1, p. 12.
24
Learning Alliance LRP Price AnalysisMarch 2011
Early warning triggers and shocks (ppt 12; slide 38)Tracking sources of instability (e.g., conflict, fuel prices, inflation rates, or productivity forecasts) can provide some early warning.
Shocks can include demand shocks, supply shocks, and policy changes. Consider shocks that may affect market actors and were unexpected, such as production shocks or rapidly deteriorating food security. Also consider policy changes that affect staple foods, livelihoods, or food trade. Changes to market access of traders, producers, and / or households can also disrupt market functioning, such as conflict, or infrastructural damage. Any major shock should trigger a new assessment of the market.
Putting the pieces together (ppt 12; slide 39)Applying the above analytical approaches should allow analysts to rule in or rule out particular factors. It may not be possible to analyze or evaluate all factors that may influence prices. However, by focusing only on factors that have changed and by limiting the analytical approaches to those that reflect the types of price changes occurring (i.e., (1) across markets vs. a single or few market and (2) across all commodities vs. a single commodity), analysts should be able to generate a likely list of candidates.
Analysts should contact their regional or headquarter offices or Cornell University if a month-to-month change in a commodity price is above 30 percent or if the analyst believes that the change is due to an intervention. Local analysts are best-positioned to understand the local context and markets. Country-based analysis the likelihood of possible factors’ impact on prices will provide crucial information for further analysis either at agency headquarters or at Cornell University.
Lastly, if agencies have plans to procure but are now in the midst of large price changes that appear persistent or appear unaccountable, they may want to reconsider their procurement strategies, commodity choice, timing, and / or location.