LOCAL IMPACTS OF GLOBAL MARKETS Tasks, Skills, and Wages in an Open Economy Marc Muendler UC San Diego based on joint research with Sascha O. Becker, Hartmut Egger, Karolina Ekholm, and Michael Koch WTO 2017, Geneva: March 22, 2017
Transcript
LOCAL IMPACTS OF GLOBAL MARKETS
Tasks, Skills, and Wagesin an Open Economy
Marc MuendlerUC San Diego
based on joint research withSascha O. Becker, Hartmut Egger, Karolina Ekholm, and Michael Koch
• Human resource practices . Management quality (Bloom, van Reenen 11) or hi-erarchies (Caliendo, Monte, Rossi-Hansberg 15) and effort incentives (Cunat, Gua-dalupe 09)
• Between-firm matching . Trade-induced changes in match quality (Davidson, Hey-man, Matusz, Sjoholm, Zhu 14; Helpman, Itskhoki, Muendler, Redding 17)
• Within-firm matching . Lazear, Shaw 09: Wage structure more dependent onemployer-internal sorting to occupations than on sorting to employers.Bombardini, Orefice, Tito (15): Permanent wage component in firm-worker sortingmodel based on Eeckhout, Kircher (11)
• German Qualifications and Career survey 1979, 1985-86, 1991-92,1998-99, 2005-06, 2012
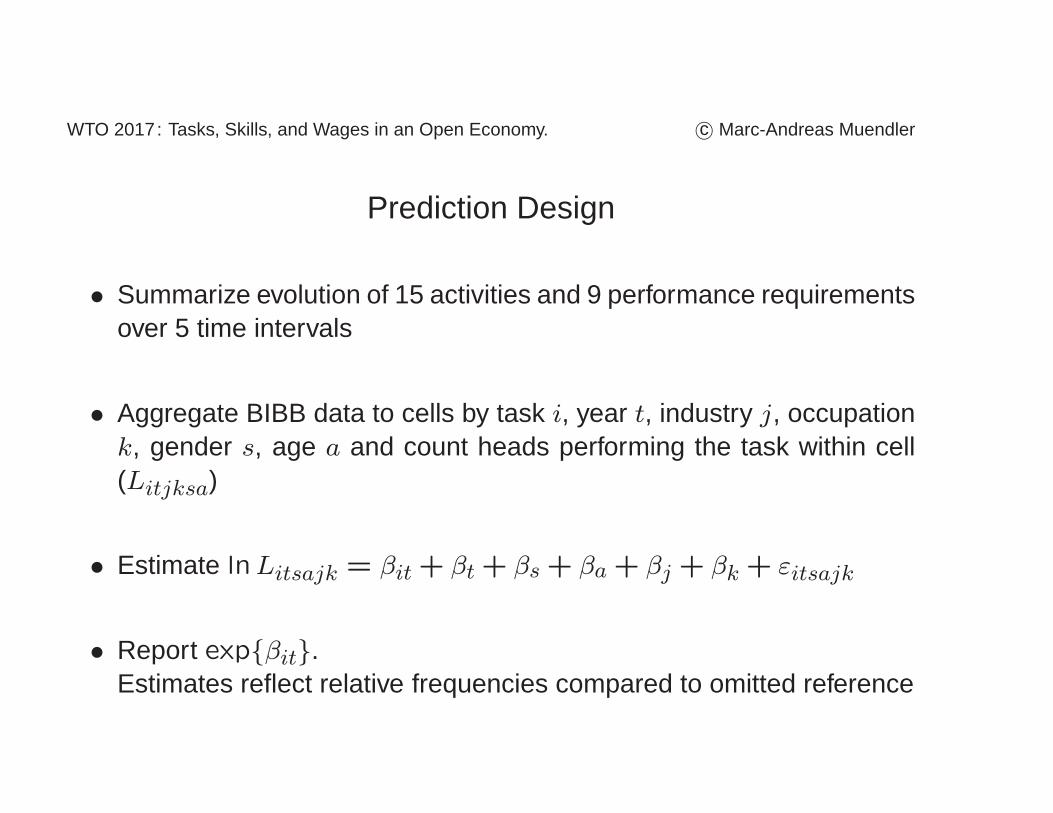
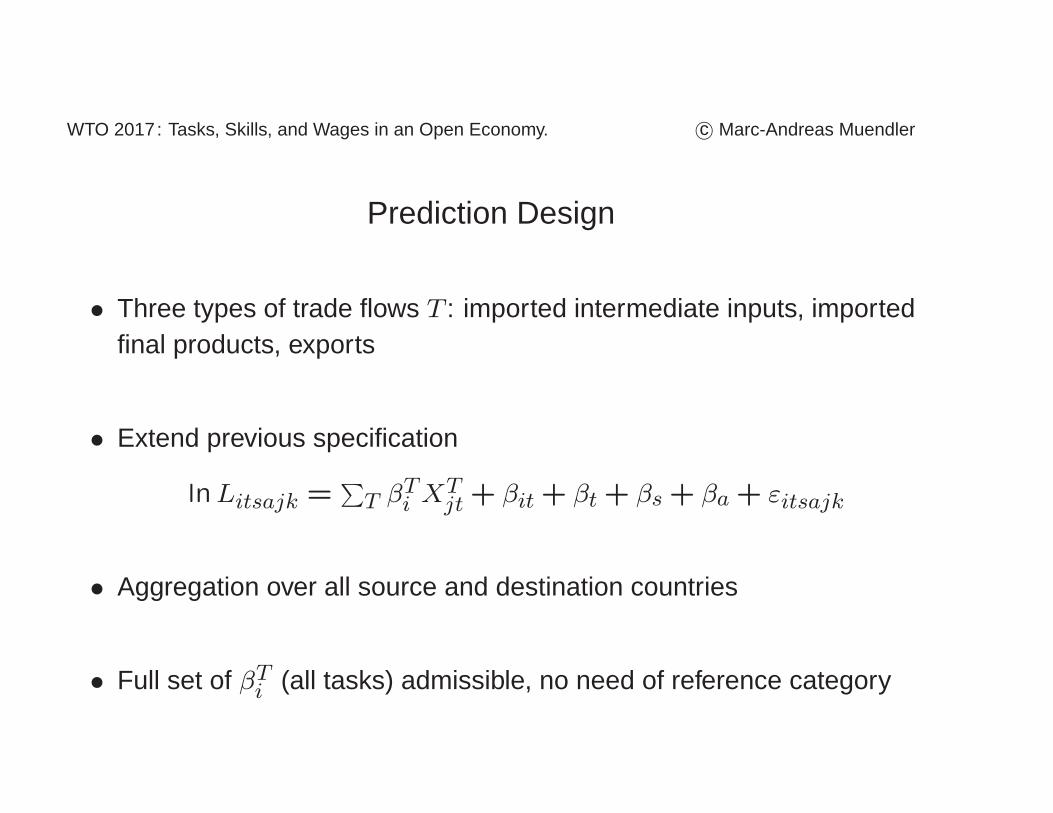
– “What?” 15 Activities (performed/not): e.g. Produce Goods; De-velop, Research, Construct ; Organize, Plan; or Oversee, Control
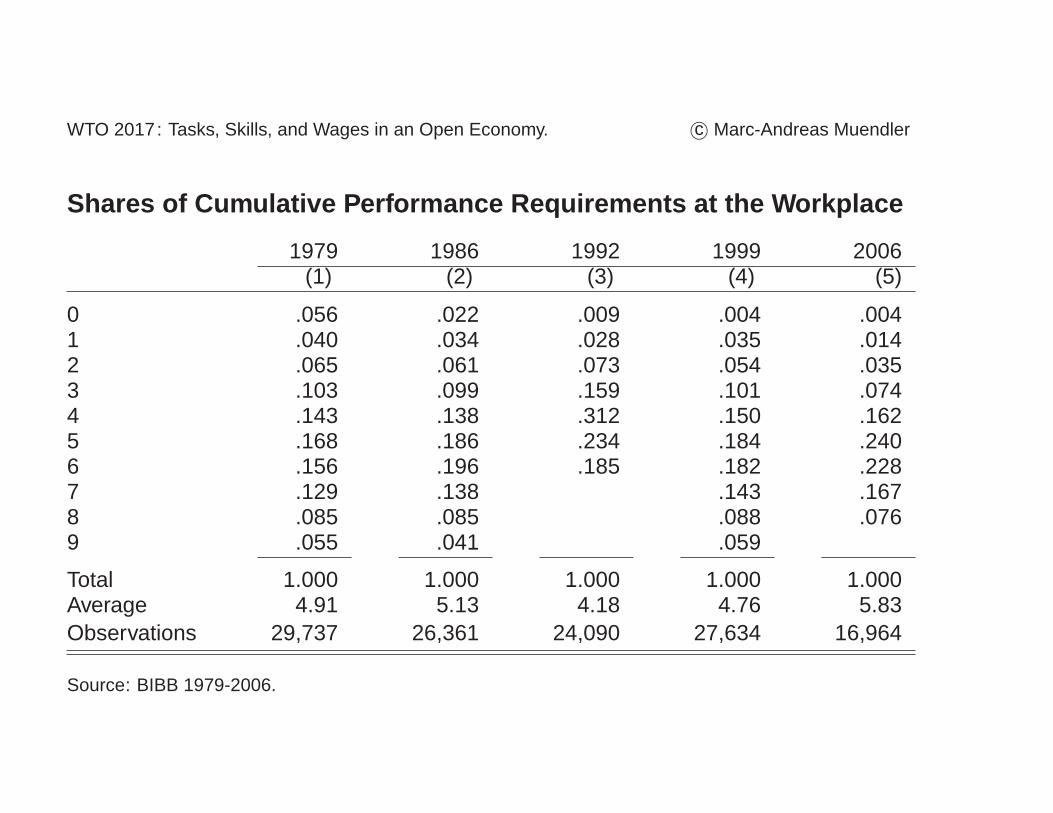
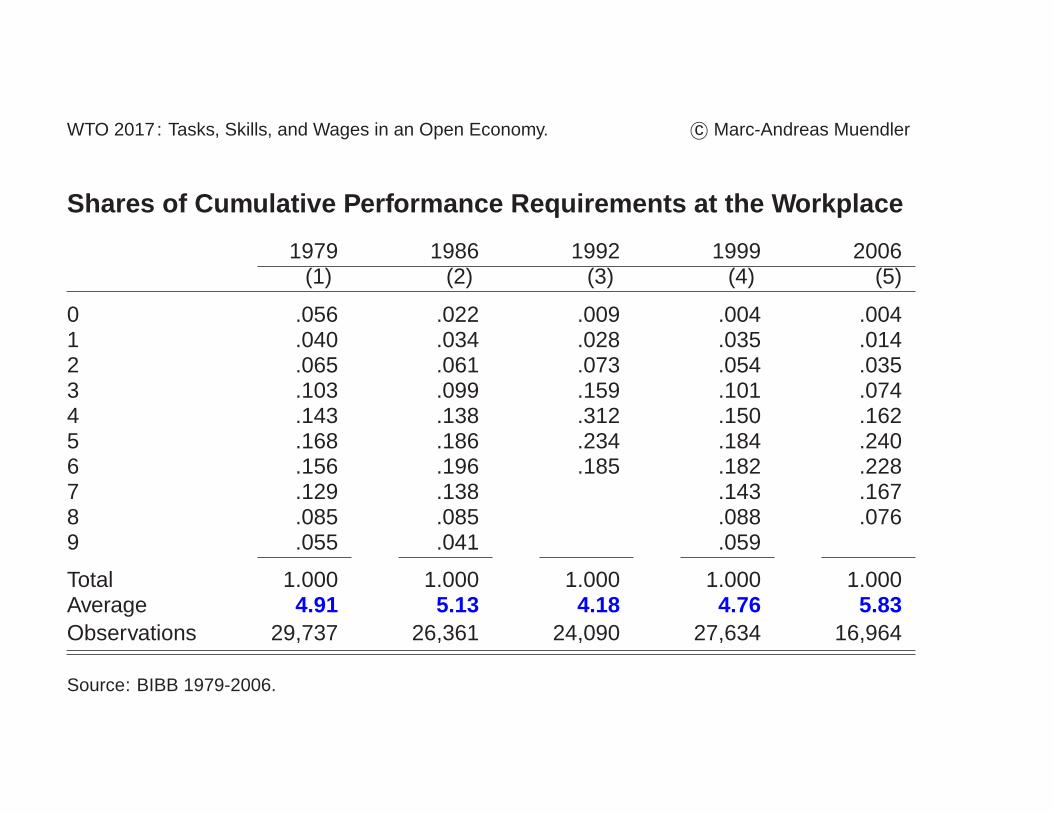
– “How?” 9 Performance requirements (frequent/not): e.g. Workprocedures prescribed in detail; Deadlines/pressure; Improve/adopttechniques; New situations/activities
• Around one-tenth of percent of German labor force (≥20 hours work)
Source: BIBB-BAuA 1979-2012 and Cortes, Jaimovich & Siu (2016).Note: For Germany shares of worker observations that indicate frequent requirements of routineness(Repeated work steps) and codifiability (Work procedures prescribed in detail); for United States sharesof occupations with imputed task frequencies from the Dictionary of Occupational Titles (DOT) 1977 and1991, for 1979, 1989, 1999, 2009, 2014. For German indicators we transform reported frequency into anindicator of frequent (intensity of 3 or 4—occasionally, frequently or almost always) or infrequent require-ments (intensity of 1 or 2—never or almost never, or rarely).
Source: BIBB-BAuA 1979-2012. Note: Prediction of number of activities by plant employment category,controlling for year, industry, region, occupation and worker characteristics. Results are differences tosmallest plant-size category 1 to 4 workers). Thick, medium, and thin lines represent the 99, 95, and 90percent confidence intervals of the point estimates.
Source: BIBB-BAuA 1979. Note: Share of workers per activity count who also report performance re-quirement or main tool use. Computerization indicates that the main tool is a computer, workstation, orCAD equipment. Automation indicates that the main tool is a robot or fully automated equipment.
Source: BIBB-BAuA 1986-2006. Note: Share of workers per activity count who also report performancerequirement or main tool use. Computerization indicates that the main tool is a computer, workstation, orCAD equipment. Automation indicates that the main tool is a robot or fully automated equipment.
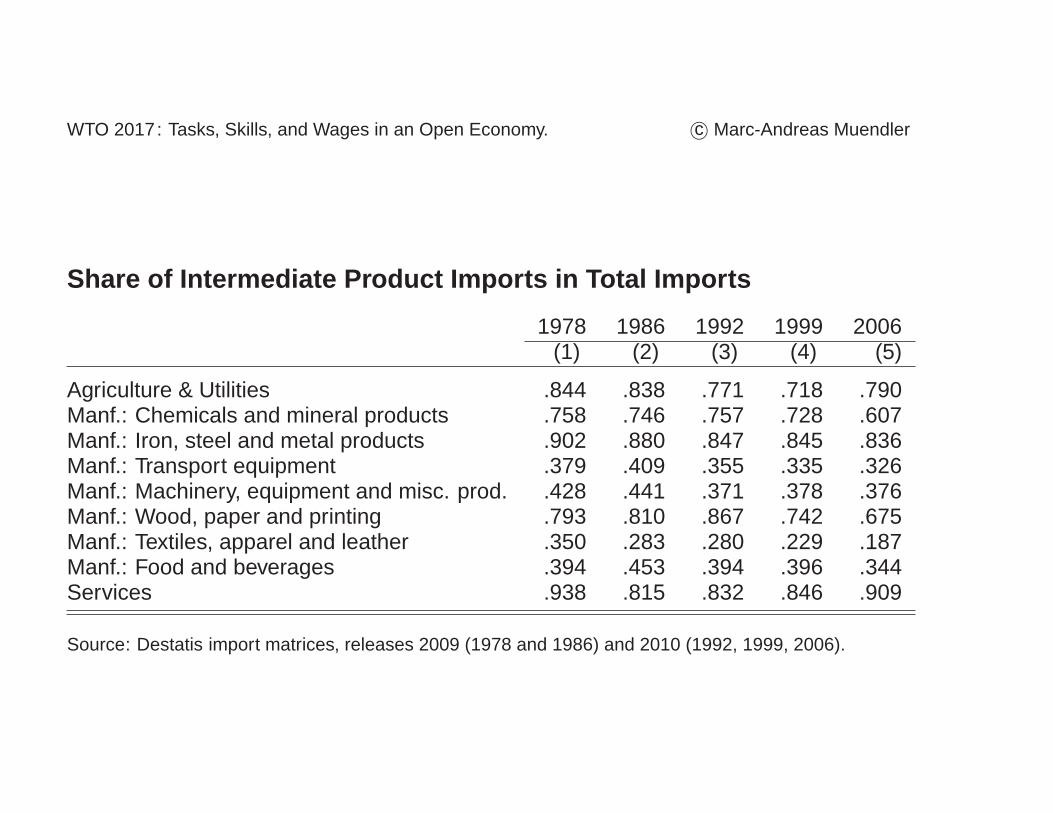
Intermediate Imports in Total Intermediate Input .143 .149 .156 .176 .217× Total Intermediate Input in Production Value .510 .513 .471 .473 .512= Intermediate Imports in Production Value .073 .077 .074 .083 .111
Source: Destatis import matrices, releases 2009 (1978 and 1986) and 2010 (1992, 1999, 2006).
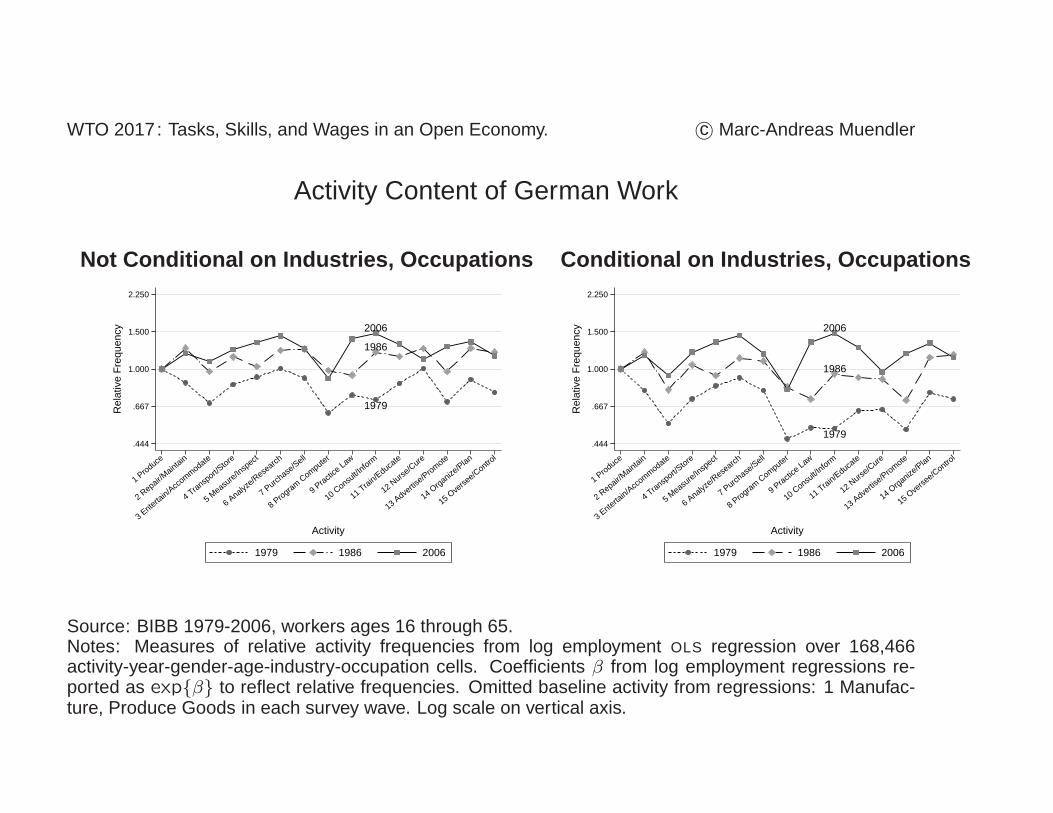
Not Conditional on Industries, Occupations Conditional on Industries, Occupations
1979
1986
2006
.444
.667
1.000
1.500
2.250
Rel
ativ
e F
requ
ency
1 Produce
2 Repair/M
aintain
3 Enterta
in/Acc
ommodate
4 Transport/S
tore
5 Measu
re/Insp
ect
6 Analyz
e/Rese
arch
7 Purch
ase/S
ell
8 Program C
omputer
9 Practi
ce Law
10 Consu
lt/Inform
11 Train/Educa
te
12 Nurse
/Cure
13 Adve
rtise/P
romote
14 Organize
/Plan
15 Ove
rsee/C
ontrol
Activity
1979 1986 2006
Source: BIBB 1979-2006, workers ages 16 through 65.Notes: Measures of relative activity frequencies from log employment OLS regression over 168,466activity-year-gender-age-industry-occupation cells. Coefficients β from log employment regressions re-ported as exp{β} to reflect relative frequencies. Omitted baseline activity from regressions: 1 Manufac-ture, Produce Goods in each survey wave. Log scale on vertical axis.
Not Conditional on Industries, Occupations Conditional on Industries, Occupations
1979
1986
2006
.810
.900
1.000
1.111
1.235
1.372
Rel
ativ
e F
requ
ency
A Deadlin
es
B Improve
tech
niques
C New si
tuations
D Repeat w
ork
E Presc
ribed w
ork
F Losses i
f mist
ake
G Multi
activit
ies
H Conce
ntratio
n
I Minim
um perform
Performance Requirement
1979 1986 2006
1979
1986
2006
.810
.900
1.000
1.111
1.235
1.372
Rel
ativ
e F
requ
ency
A Deadlin
es
B Improve
tech
niques
C New si
tuations
D Repeat w
ork
E Presc
ribed w
ork
F Losses i
f mist
ake
G Multi
activit
ies
H Conce
ntratio
n
I Minim
um perform
Performance Requirement
1979 1986 2006
Source: BIBB 1979-2006, workers ages 16 through 65.Notes: Measures of relative performance requirement frequencies from log employment OLS regressionover 180,022 requirement-year-gender-age-industry-occupation cells. Coefficients β from log employmentregressions reported as exp{β} to reflect relative frequencies. Omitted baseline performance requirementfrom regressions: E Work procedures prescribed in detail in each survey wave. Performance requirementsF-H missing in 1992, requirement I missing in 2006. Log scale on vertical axis.
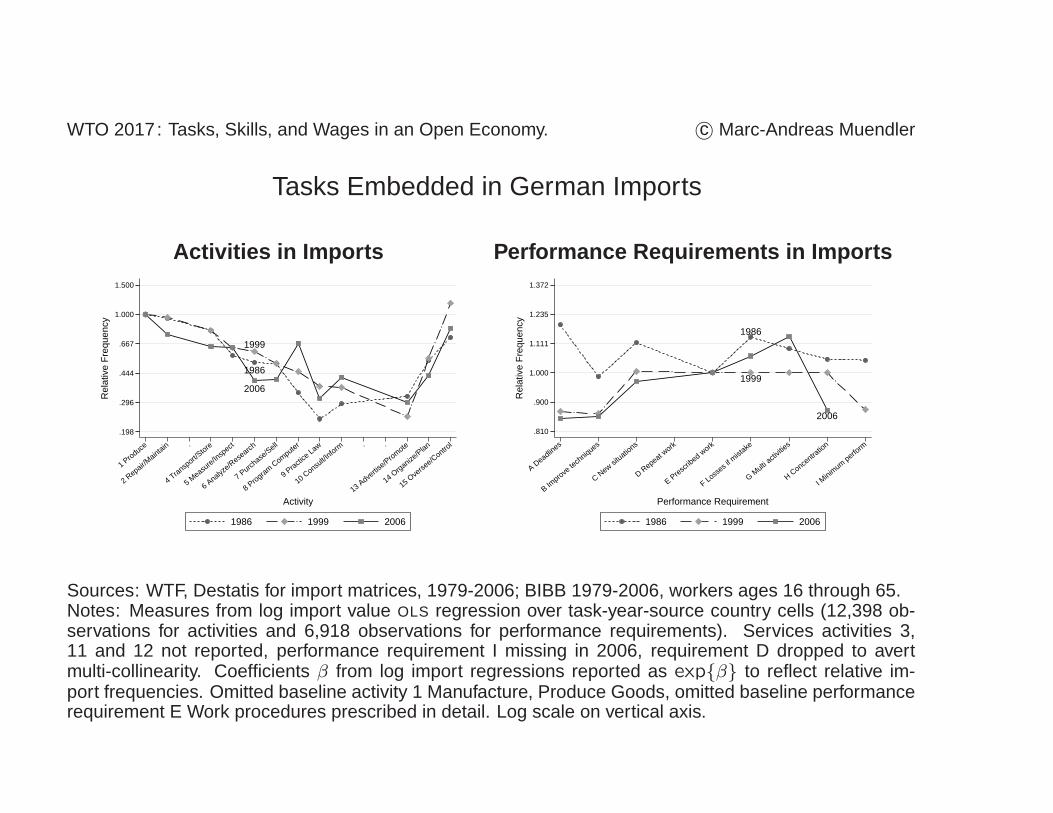
Activities in Imports Performance Requirements in Imports
1986
1999
2006
.198
.296
.444
.667
1.000
1.500
Rel
ativ
e F
requ
ency
1 Produce
2 Repair/M
aintain .
4 Transport/S
tore
5 Measu
re/Insp
ect
6 Analyz
e/Rese
arch
7 Purch
ase/S
ell
8 Program C
omputer
9 Practi
ce Law
10 Consu
lt/Inform . .
13 Adve
rtise/P
romote
14 Organize
/Plan
15 Ove
rsee/C
ontrol
Activity
1986 1999 2006
1986
1999
2006
.810
.900
1.000
1.111
1.235
1.372
Rel
ativ
e F
requ
ency
A Deadlin
es
B Improve
tech
niques
C New si
tuations
D Repeat w
ork
E Presc
ribed w
ork
F Losses i
f mist
ake
G Multi
activit
ies
H Conce
ntratio
n
I Minim
um perform
Performance Requirement
1986 1999 2006
Sources: WTF, Destatis for import matrices, 1979-2006; BIBB 1979-2006, workers ages 16 through 65.Notes: Measures from log import value OLS regression over task-year-source country cells (12,398 ob-servations for activities and 6,918 observations for performance requirements). Services activities 3,11 and 12 not reported, performance requirement I missing in 2006, requirement D dropped to avertmulti-collinearity. Coefficients β from log import regressions reported as exp{β} to reflect relative im-port frequencies. Omitted baseline activity 1 Manufacture, Produce Goods, omitted baseline performancerequirement E Work procedures prescribed in detail. Log scale on vertical axis.
Trade Predictors: Not Conditional on Industries, Occupations
Activities Performance Requirements
0.75
0.87
1.00
1.15
1.33
Rel
ativ
e C
hang
e in
Fre
quen
cy
1 Produce
2 Repair/M
aintain
3 Enterta
in/Acc
ommodate
4 Transport/S
tore
5 Measu
re/Insp
ect
6 Analyz
e/Rese
arch
7 Purch
ase/S
ell
8 Program C
omputer
9 Practi
ce Law
10 Consu
lt/Inform
11 Train/Educa
te
12 Nurse
/Cure
13 Adve
rtise/P
romote
14 Organize
/Plan
15 Ove
rsee/C
ontrol
Imported Inputs Product Imports Product Exports
0.75
0.87
1.00
1.15
1.33
Rel
ativ
e C
hang
e in
Fre
quen
cy
A Deadlin
es
B Improve
tech
niques
C New si
tuations
D Repeat w
ork
E Presc
ribed w
ork
F Losses i
f mist
ake
G Multi
activit
ies
H Conce
ntratio
n
I Minim
um perform
Imported Inputs Product Imports Product Exports
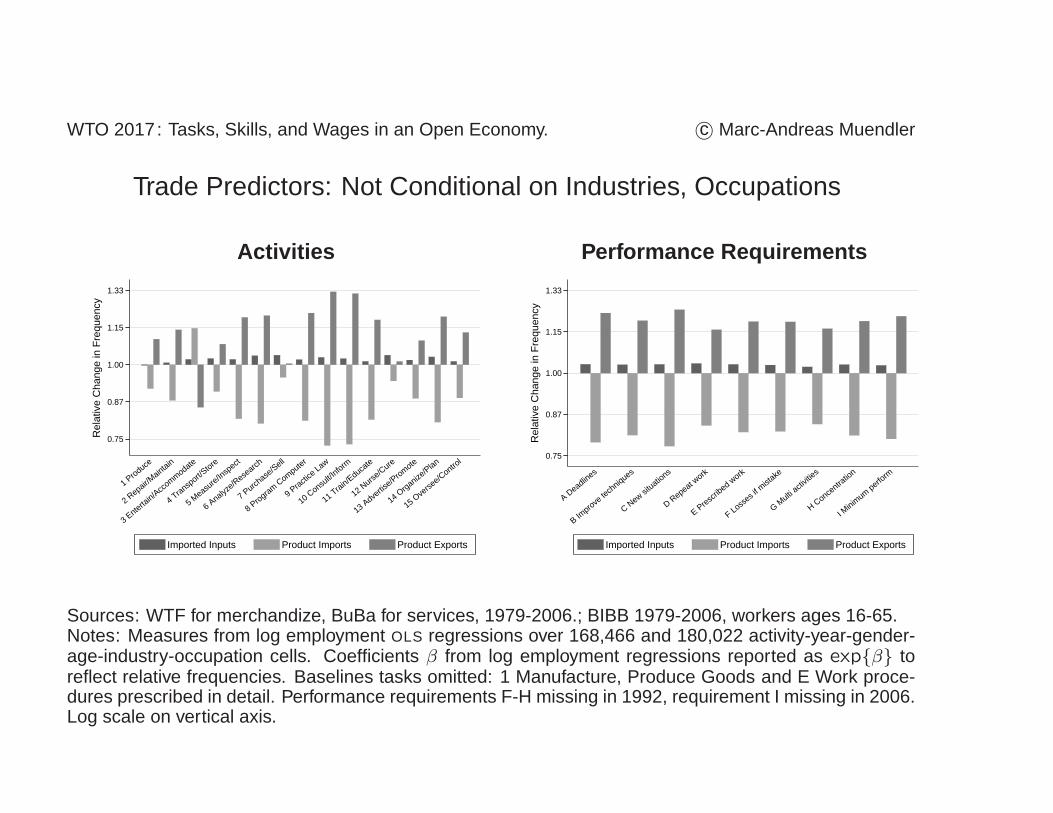
Sources: WTF for merchandize, BuBa for services, 1979-2006.; BIBB 1979-2006, workers ages 16-65.Notes: Measures from log employment OLS regressions over 168,466 and 180,022 activity-year-gender-age-industry-occupation cells. Coefficients β from log employment regressions reported as exp{β} toreflect relative frequencies. Baselines tasks omitted: 1 Manufacture, Produce Goods and E Work proce-dures prescribed in detail. Performance requirements F-H missing in 1992, requirement I missing in 2006.Log scale on vertical axis.
Trade Predictors: Conditional on Industries, Occupations
Activities Performance Requirements
0.75
0.87
1.00
1.15
1.33
Rel
ativ
e C
hang
e in
Fre
quen
cy
1 Produce
2 Repair/M
aintain
3 Enterta
in/Acc
ommodate
4 Transport/S
tore
5 Measu
re/Insp
ect
6 Analyz
e/Rese
arch
7 Purch
ase/S
ell
8 Program C
omputer
9 Practi
ce Law
10 Consu
lt/Inform
11 Train/Educa
te
12 Nurse
/Cure
13 Adve
rtise/P
romote
14 Organize
/Plan
15 Ove
rsee/C
ontrol
Imported Inputs Product Imports Product Exports
0.75
0.87
1.00
1.15
1.33
Rel
ativ
e C
hang
e in
Fre
quen
cy
A Deadlin
es
B Improve
tech
niques
C New si
tuations
D Repeat w
ork
E Presc
ribed w
ork
F Losses i
f mist
ake
G Multi
activit
ies
H Conce
ntratio
n
I Minim
um perform
Imported Inputs Product Imports Product Exports
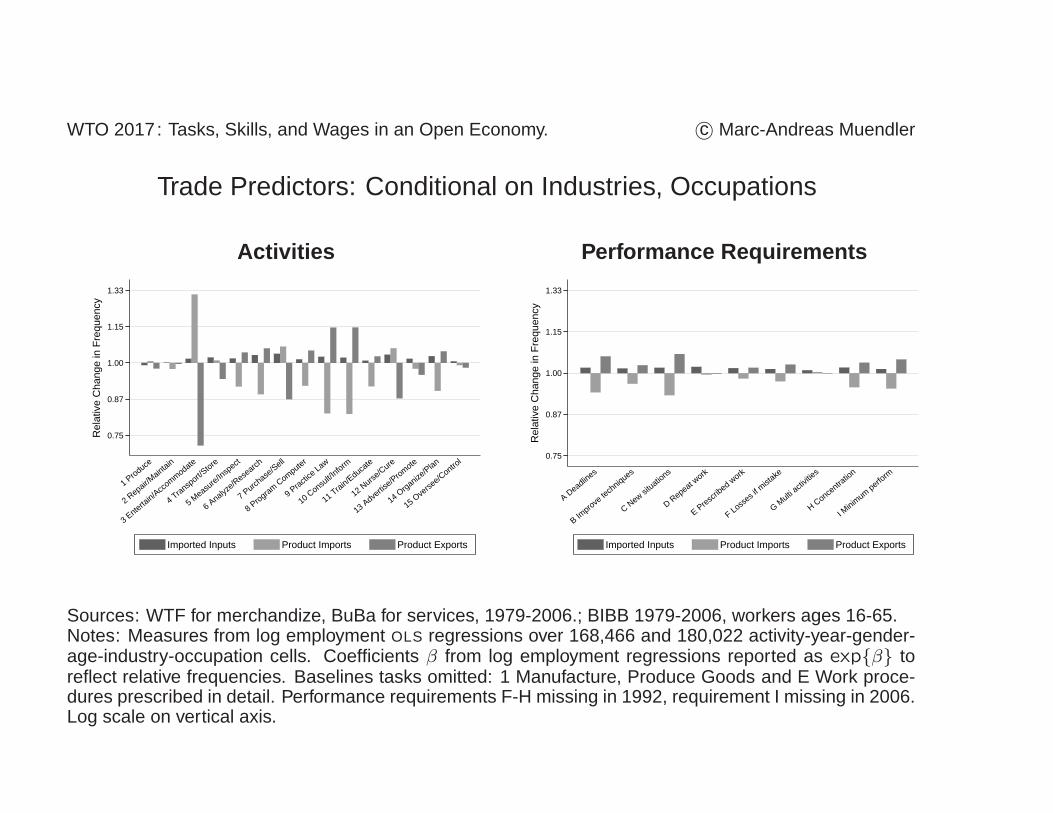
Sources: WTF for merchandize, BuBa for services, 1979-2006.; BIBB 1979-2006, workers ages 16-65.Notes: Measures from log employment OLS regressions over 168,466 and 180,022 activity-year-gender-age-industry-occupation cells. Coefficients β from log employment regressions reported as exp{β} toreflect relative frequencies. Baselines tasks omitted: 1 Manufacture, Produce Goods and E Work proce-dures prescribed in detail. Performance requirements F-H missing in 1992, requirement I missing in 2006.Log scale on vertical axis.
• Across industries and occupations, exports and imported inputs ex-hibit mostly same signs, raising task frequencies.
• Relatively weak effect of intermediate-input trade.
• Within industries and occupations, positively affected by exports andimported inputs are coordination related tasks: 8 Program Computer,10 Consult/Inform, 14 Organize/Plan, A Deadlines, C New situations.
Labour Market Tightness: Perf. Req. Within Industries and Occupations
Industries Exposed to High Tightness Industries Exposed to Low Tightness
1979
1986
2006
.810
.900
1.000
1.111
1.235
1.372
Rel
ativ
e F
requ
ency
A Deadlin
es
B Improve
tech
niques
C New si
tuations
D Repeat w
ork
E Presc
ribed w
ork
F Losses i
f mist
ake
G Multi
activit
ies
H Conce
ntratio
n
I Minim
um perform
Performance Requirement
1979 1986 2006
1979
1986
2006
.810
.900
1.000
1.111
1.235
1.372
Rel
ativ
e F
requ
ency
A Deadlin
es
B Improve
tech
niques
C New si
tuations
D Repeat w
ork
E Presc
ribed w
ork
F Losses i
f mist
ake
G Multi
activit
ies
H Conce
ntratio
n
I Minim
um perform
Performance Requirement
1979 1986 2006
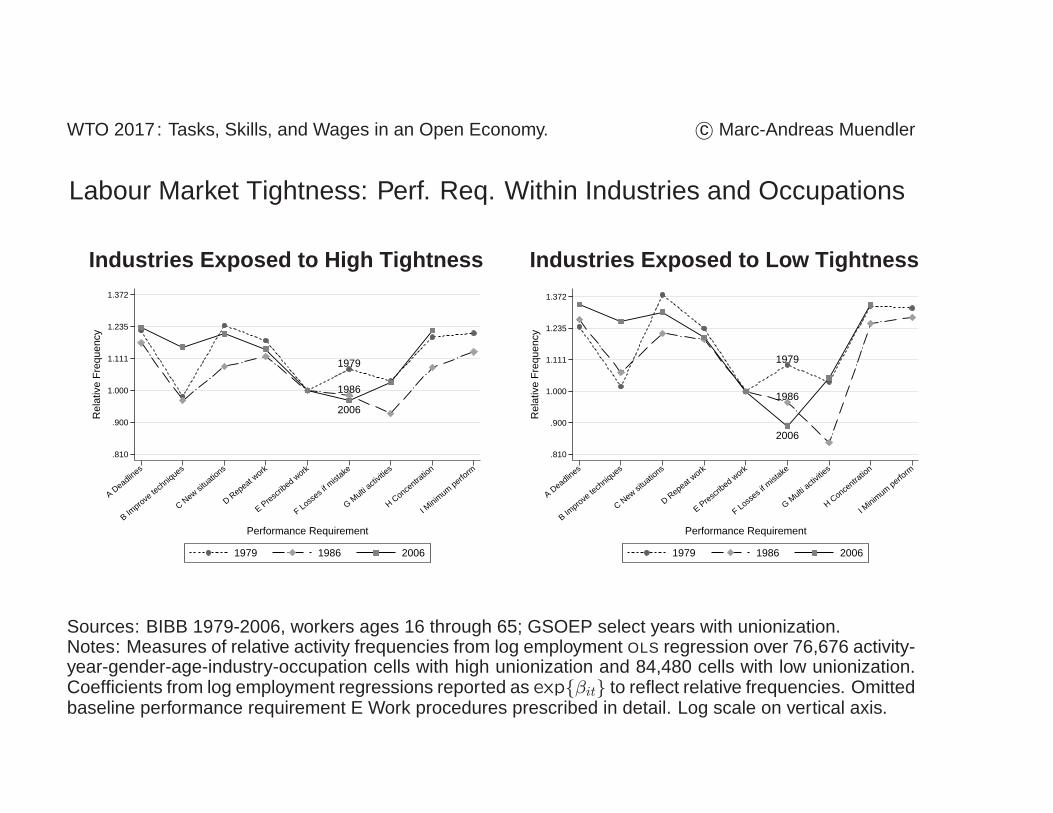
Sources: BIBB 1979-2006, workers ages 16 through 65; GSOEP select years with unionization.Notes: Measures of relative activity frequencies from log employment OLS regression over 76,676 activity-year-gender-age-industry-occupation cells with high unionization and 84,480 cells with low unionization.Coefficients from log employment regressions reported as exp{βit} to reflect relative frequencies. Omittedbaseline performance requirement E Work procedures prescribed in detail. Log scale on vertical axis.
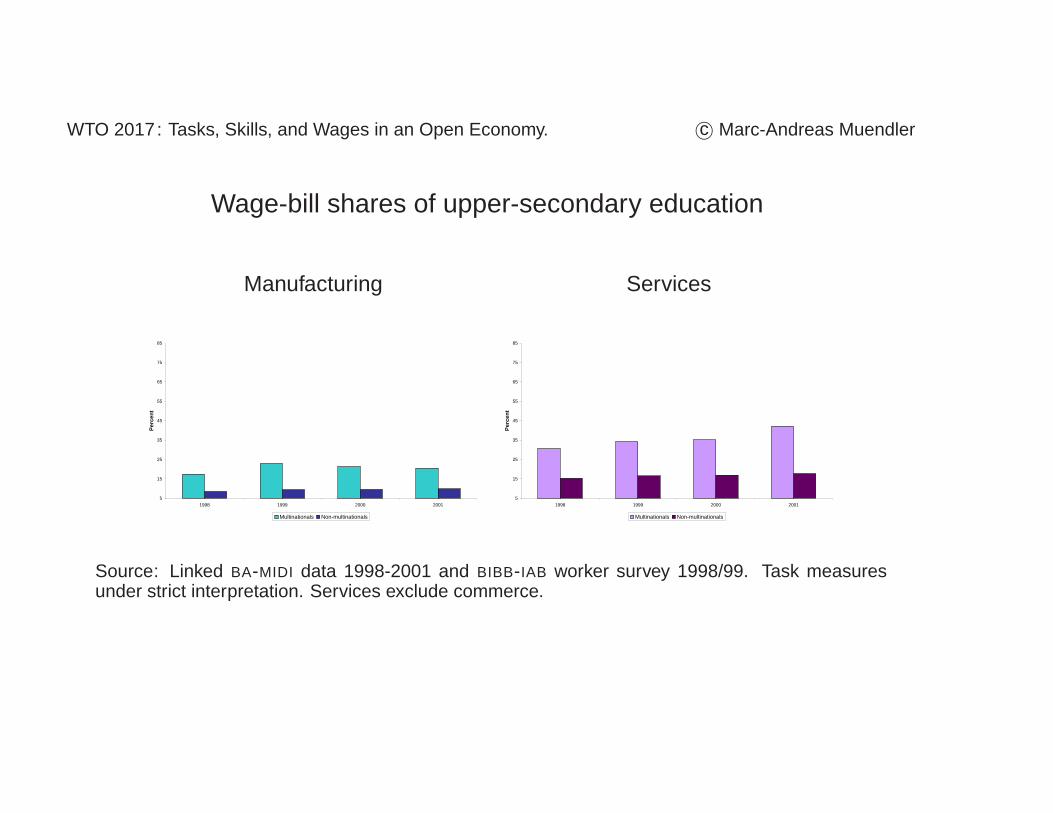
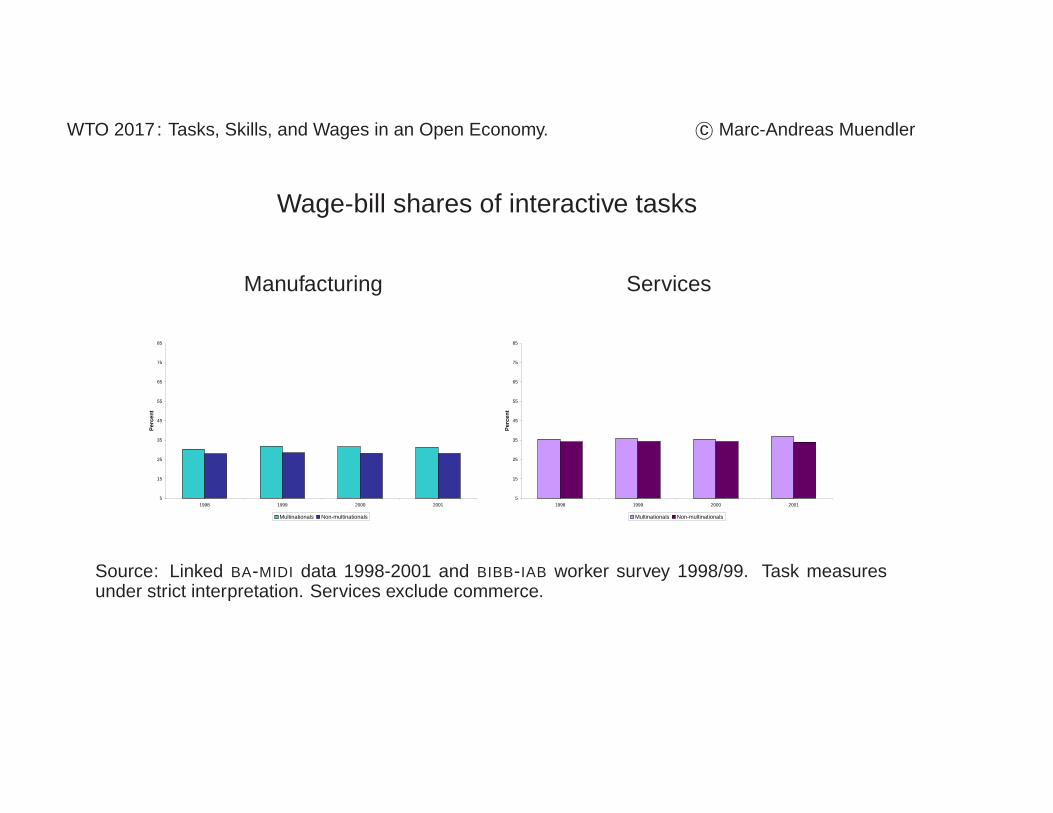
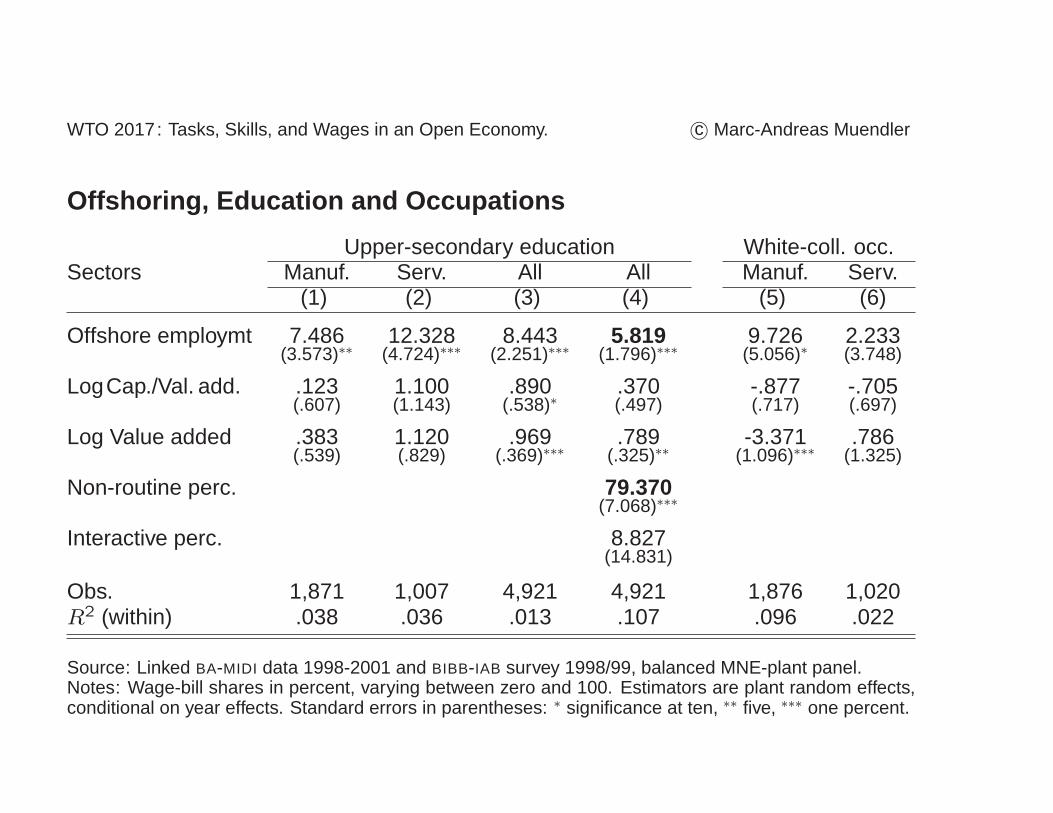
Source: Linked BA-MIDI data 1998-2001 and BIBB-IAB survey 1998/99, balanced MNE-plant panel.Notes: Wage-bill shares in percent, varying between zero and 100. Estimators are plant random effects,conditional on year effects. Standard errors in parentheses: ∗ significance at ten, ∗∗ five, ∗∗∗ one percent.
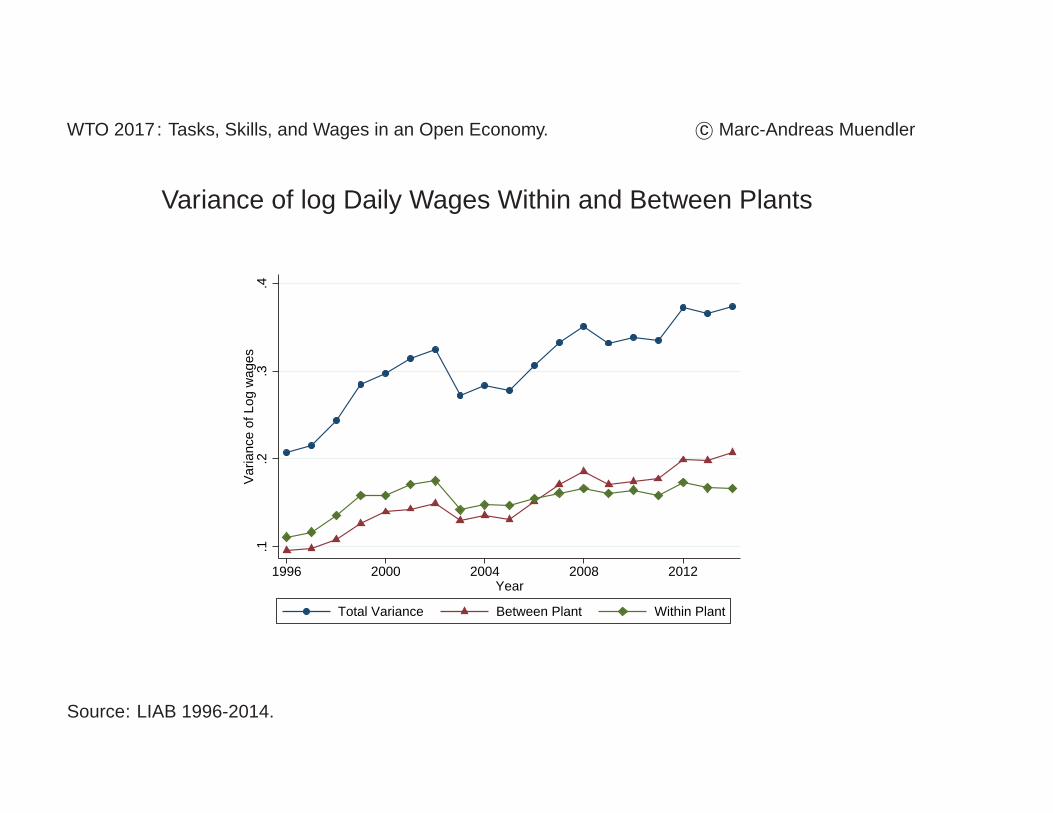
Source: LIAB 1996-2014. Residual from log daily wage Mincer regression on age, gender, education, andpotential labor-market experience. Hierarchical layers defined as in Caliendo, Monte, Rossi-Hansberg(2015).
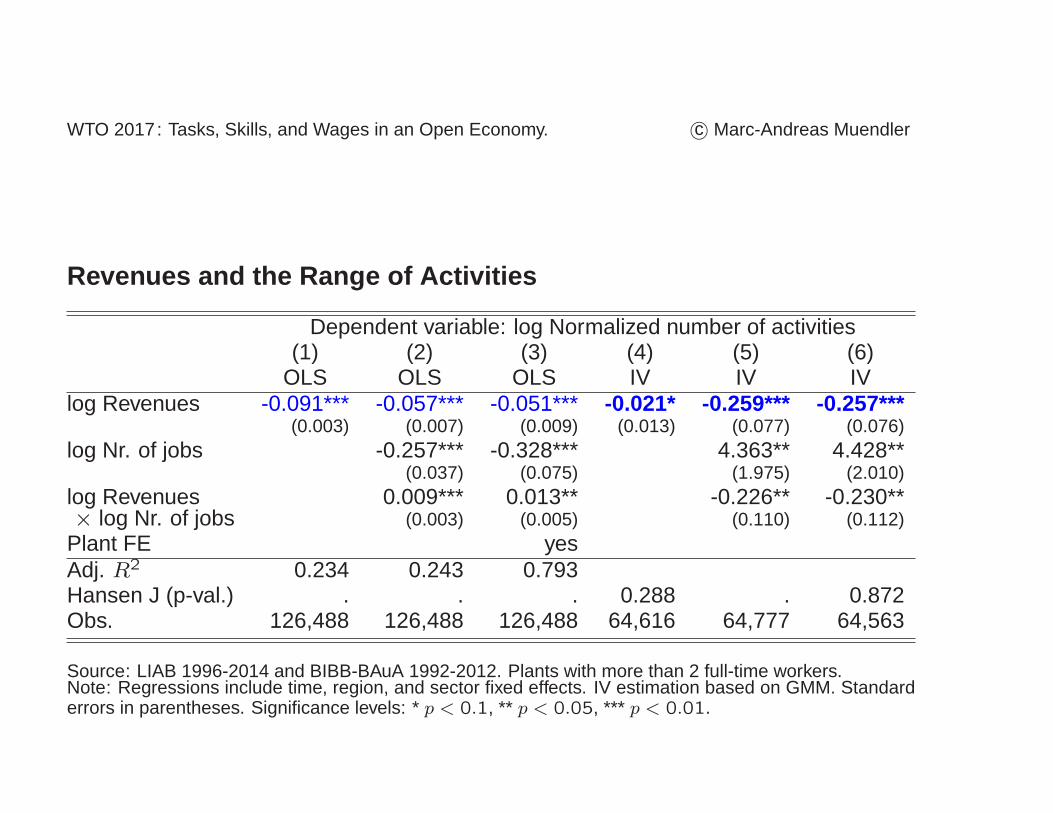
1. Larger plants and exporters offer more occupations.
2. Workers at larger plants perform fewer tasks within occupations.
3. Overall and residual wages are more dispersed at larger plants.
• Hypothesis: Workers at larger plants are more specialized in fewertasks. Their abilities are better matched to these tasks, and wagestherefore more dispersed.
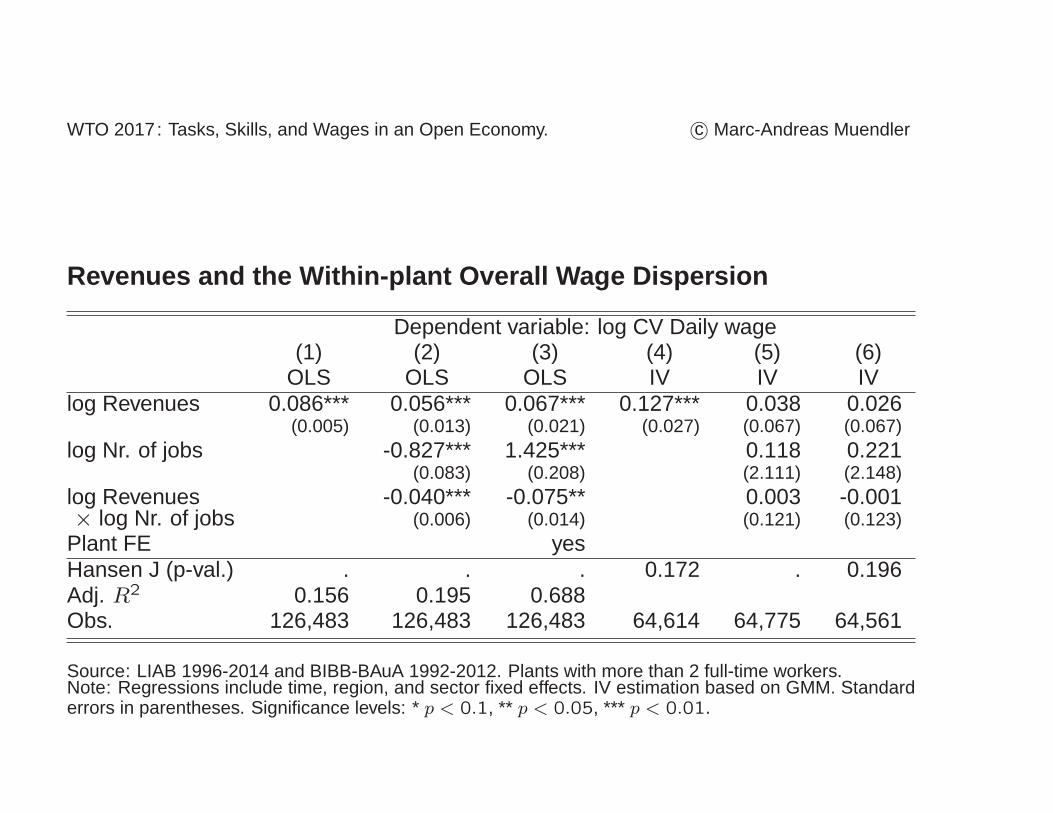
Source: LIAB 1996-2014 and BIBB-BAuA 1992-2012. Plants with more than 2 full-time workers.Note: Regressions include time, region, and sector fixed effects. IV estimation based on GMM. Standarderrors in parentheses. Significance levels: * p < 0.1, ** p < 0.05, *** p < 0.01.
Source: LIAB 1996-2014 and BIBB-BAuA 1992-2012. Plants with more than 2 full-time workers.Note: Regressions include time, region, and sector fixed effects. IV estimation based on GMM. Standarderrors in parentheses. Significance levels: * p < 0.1, ** p < 0.05, *** p < 0.01.
• Increasing importance of “high end” tasks in Germany.Organizing and consulting activities under deadlines, changing busi-ness conditions and tougher performance standards
• Significant offshoring since 1979, predicts observed task frequencies
• Task ranges within occupations narrower at large plants and exporters
• Globalization can raise within-plant wage dispersion in all economies
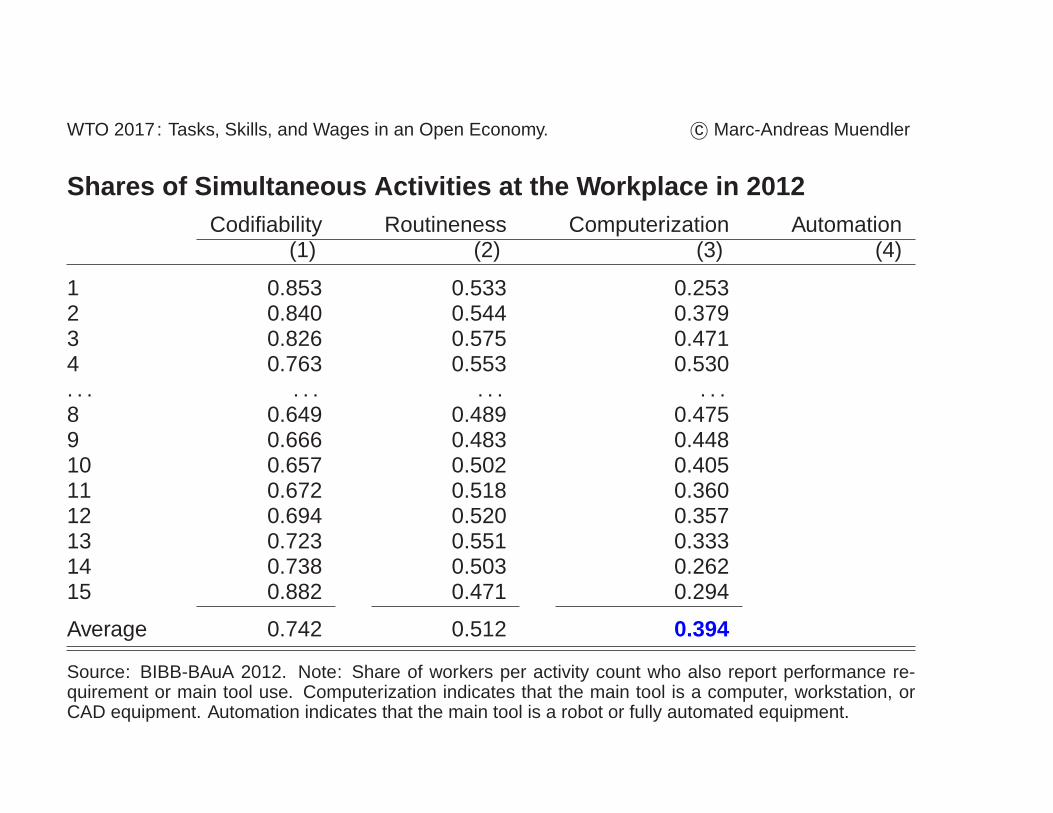
Source: BIBB-BAuA 2012. Note: Share of workers per activity count who also report performance re-quirement or main tool use. Computerization indicates that the main tool is a computer, workstation, orCAD equipment. Automation indicates that the main tool is a robot or fully automated equipment.
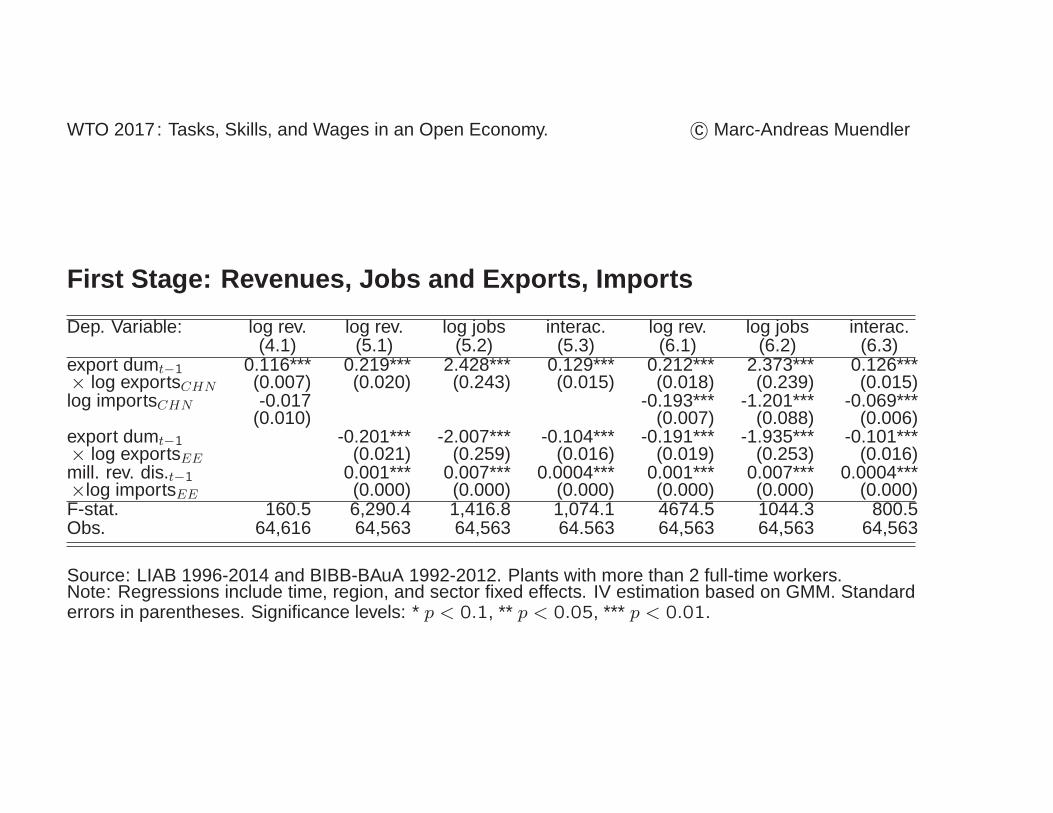
Source: LIAB 1996-2014 and BIBB-BAuA 1992-2012. Plants with more than 2 full-time workers.Note: Regressions include time, region, and sector fixed effects. IV estimation based on GMM. Standarderrors in parentheses. Significance levels: * p < 0.1, ** p < 0.05, *** p < 0.01.
Source: LIAB 1996-2014 and BIBB-BAuA 1992-2012. Plants with more than 2 full-time workers.Note: Regressions include time, region, and sector fixed effects. IV estimation based on GMM. Standarderrors in parentheses. Significance levels: * p < 0.1, ** p < 0.05, *** p < 0.01.