Management Summary Hartley McMaster Ltd MS-1 29/06/2015 Local Pollution Control Statistical Survey 2013/14: Headlines Permitted installations 17,787 [17,930] Part B and 355 [361] A2 permitted installations as of 31st March 2014 169 [175] local authorities regulate A2 installations Applications and decisions 481 [424] Part B applications received and 484 [434] decided 6 [6] A2 applications made and 9 [8] decided with 8 [10] revoked 72% [80%] of all decisions made on standard fee Part B applications decided within 4 months 56% [38%] of all A2 new installation/substantial change decisions made within 6 months Notices 64 [78] Part B enforcement and prohibition notices served 1,863 [1,259] variation notices served on Part B installations 5 [3] successful prosecutions (total fines £130k [£19k] ) and 1 [3] pending 8 [5] A2 enforcement and prohibition notices served 38 [59] A2 variation notices served Inspections Average of 1.1 [1.4] inspections per Part B installation at application stage Average of 2.2 [4.5]] inspections per A2 installation at application stage Average of 1.40 [1.34] inspections per group I* permitted Part B installation Average of 0.52 [0.59] inspections per group II + III* permitted Part B installation Average of 2.4 [2.8] inspections per permitted A2 installation Risk Assessment 2,987 [4,190] risk-assessed Part B installations in group I*: 3.7% [3.0%] high risk, 29.7% [24.2%] medium risk and 66.6% [72.8%] low risk 13,594 [12,526] risk-assessed Part B installations in groups II + III*: 0.6% [1.0%] high risk, 6.4% [6.4%] medium risk, and 93.0% [92.6%]low risk 351 [351] risk-assessed A2 installations: 11.1% [8.0%] high risk, 31.9% [36.5%] medium risk and 57.0% [55.6%]low risk Risk Assessed Inspections 9,499 [10,770] full Part B inspections, 1,208 [1,534] check, and 560 [635] extra 374 [418] full A2 inspections, 158 [163] check, and 293 [386] extra 30% [34%] of authorities with group I Part B installations carried out fewer full inspections than expected on these installations. 25% [23%] of authorities with high or medium risk group II* Part B installations carried out fewer full inspections than expected. 31% [38%] of local authorities with high or medium risk group III installations carried out fewer full inspections than expected. All but one authority report back to operators after inspections (88% both orally and in writing) Risk Assessed Inspections and Monitoring 51% [36%] of standard fee Part B installations provide authorities with monitoring data 83% [83%] of A2 installations provide authorities with monitoring data Charging Total income of £4.9m [£5.5m] from charges levied on Part B installations Total income of £683k [£546k] from charges levied on A2 installations 91% [91%] of authorities have cost accounts for Part B work There is no obvious correlation between local authorities’ direct and indirect costs. no change/change <1% increase >5% increase ≤5% decrease >5% decrease ≤5% ‘group I’ = more complex Part B installations, ‘group II’ = less complex, ‘group III’ = least complex Last year’s figures in brackets; data on Part A2 permits in blue; data on Part B permits in black. Note: During 2013 a large number of B installations were reclassified as reduced fee rather than standard fee which has had a significant impact on several of the reported percentages
Transcript
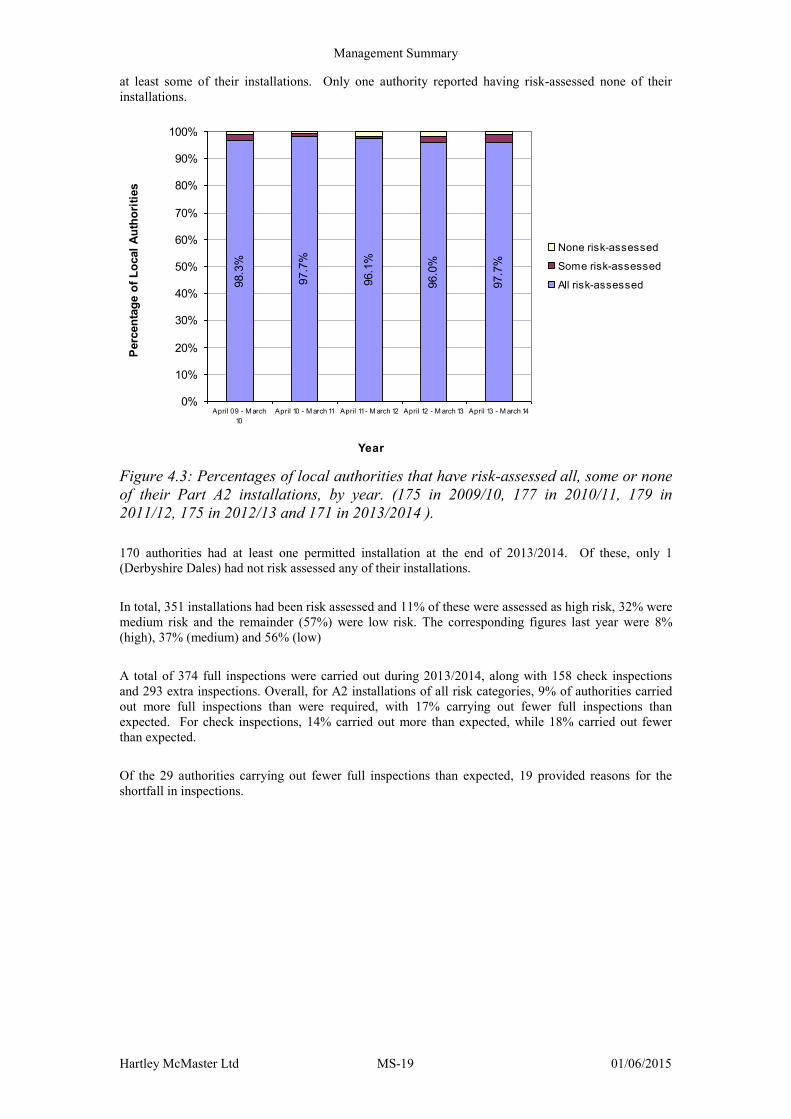
Management Summary
Hartley McMaster Ltd MS-1 29/06/2015
Local Pollution Control Statistical Survey 2013/14: Headlines
Permitted installations
17,787 [17,930] Part B and 355 [361] A2 permitted installations as of 31st March 2014
169 [175] local authorities regulate A2 installations
Applications and decisions
481 [424] Part B applications received and 484 [434] decided
6 [6] A2 applications made and 9 [8] decided with 8 [10] revoked
72% [80%] of all decisions made on standard fee Part B applications decided within 4 months
56% [38%] of all A2 new installation/substantial change decisions made within 6 months
Notices
64 [78] Part B enforcement and prohibition notices served
1,863 [1,259] variation notices served on Part B installations
5 [3] successful prosecutions (total fines £130k [£19k] ) and 1 [3] pending
8 [5] A2 enforcement and prohibition notices served
38 [59] A2 variation notices served
Inspections
Average of 1.1 [1.4] inspections per Part B installation at application stage
Average of 2.2 [4.5]] inspections per A2 installation at application stage
Average of 1.40 [1.34] inspections per group I* permitted Part B installation
Average of 0.52 [0.59] inspections per group II + III* permitted Part B installation
Average of 2.4 [2.8] inspections per permitted A2 installation
Risk Assessment
2,987 [4,190] risk-assessed Part B installations in group I*: 3.7% [3.0%] high risk, 29.7%
[24.2%] medium risk and 66.6% [72.8%] low risk
13,594 [12,526] risk-assessed Part B installations in groups II + III*: 0.6% [1.0%] high
risk, 6.4% [6.4%] medium risk, and 93.0% [92.6%] low risk
‘group I’ = more complex Part B installations, ‘group II’ = less complex, ‘group III’ = least complex
Last year’s figures in brackets; data on Part A2 permits in blue; data on Part B permits in black.
Note: During 2013 a large number of B installations were reclassified as reduced fee rather than standard fee which has had a significant impact on several of the reported percentages
Management Summary
Hartley McMaster Ltd MS-2 29/06/2015
1 About the Local Pollution Control Statistical Survey
1.1 Background
Local authorities (i.e. councils, unitary authorities and port health authorities) across England & Wales
are responsible for regulating a number of industrial processes whose emissions could have a
detrimental effect upon the atmosphere.
The processes regulated by local authorities are partitioned into two types:
Part A2 activities; and
Part B activities.
A local authority’s regulatory role encompasses:
the initial authorisation or “permitting” of processes;
inspecting operational installations;
amending or revoking permits, where necessary; and
prosecuting operators in those cases where processes fail to comply with regulations.
Defra’s Local Pollution Control Statistical Survey (LPCSS) provides quantitative insight into each of
these aspects of local authorities’ regulatory roles.
Defra has commissioned its annual Local Pollution Control Statistical Survey (LPCSS) since 1991. The
survey provides an annual snapshot of local authorities’ regulation performance during the previous
twelve months. The Department publishes the findings from the LPCSS in a form intended for several
distinct groups:
the general public;
industry;
policy groups within Defra; and
the European Union.
This year’s survey questionnaire consists of three distinct parts:
a Part B sub-survey captures information about installations regulated under the Local
Authority Pollution Prevention Control (LAPPC) regime;
a Part A2 sub-survey captures information about installations regulated under the Local
Authority Integrated Pollution Prevention and Control (LA-IPPC) regime; and
a Common Questions sub-survey collects information that is common to, or independent of,
the types of installation.
Three years ago, Defra adopted a new set of regions for analysing the returns from the LPCSS; it also
made use of an updated set of indices of multiple deprivation (IMD) from the Department for
Communities and Local Government (DCLG). As a result, readers are advised to take care when
comparing the figures from recent years' survey, where broken down by region or deprivation quartile,
with the corresponding figures from reports more than three years ago.
1.2 Changes to this year’s survey
The bulk of this year’s survey questionnaire is the same as that used last year. The main differences are
as follows:
Introduction of a new Section 18, collecting data relating to the operation of the Industrial
Emission Directive (IED)
Management Summary
Hartley McMaster Ltd MS-3 29/06/2015
Reduced fee status was extended to new applications (in most cases) for 10 activities in October
2012 and set out in Parts 2 and 3 of the Schedule to the Part B Charging Scheme which now
form subsets of sections 3.1, 3.5 and 3.6 of tables 5.3 and 5.5, and, 9 further activities in
December 2013 and set out in Part 4 of the Schedule to the Part B Charging Scheme which now
form subsets of sections 4.1, 6.3, 6.4 and 6.8..
1.3 Response rate (Table 24, Annex A)
Defra asked all three hundred and fifty seven (357) local authorities and port health authorities in
England and Wales to take part in the survey. The Department received a completed questionnaire
from all but five (5) authorities: Bristol City UA; Bristol PHA; Wolverhampton; Falmouth & Truro
PHA; and Liverpool.
Bristol City UA, Bristol PHA and Liverpool had submitted a completed questionnaire in the previous
year’s survey. Wolverhampton and Falmouth and Truro PHA last submitted in 2009/10.
The response rate for the survey as a whole was 99%.
1.4 Format of returns (Tables 4a and 4b, Annex B)
All authorities that submitted a questionnaire completed the web-based version of the survey. As in
previous years, Defra asked authorities to record the time that it took them to complete the survey
questionnaire. It took the authorities an average of 6.6 hours, some 1.3 hours shorter than last year’s
average of 7.9 hours.
1.5 Inconsistencies and grossing
As in previous years, members of the Defra and Hartley McMaster project teams contacted authorities
and resolved inconsistencies by e-mail or over the ‘phone.
Given that Falmouth & Truro PHA, Kettering, Kingston upon Thames and Wolverhampton represented
less than 2% of the total (B and A2) permits from the survey between them, there was no need to
estimate the likely content of missing survey returns, i.e. there was no need for “grossing”.1
1
Grossing is a technique for estimating the likely contents of an authority’s survey form given
(a) the contents of its submission from in previous years and (b) the changes in “similar” authorities’
submissions over the same period.
Management Summary
Hartley McMaster Ltd MS-4 29/06/2015
2 Key findings from analysis of Part B installations
2.1 Applications and decisions (Tables 1 – 2 and 7 – 8, Annex A)
The numbers of applications received and decided for new Part B installations in 2013/2014 both
increased this year, in contrast to the downward trend seen in recent years. The number of withdrawn
applications decreased, again reversing the decline seen in recent years.
Authorities across England & Wales received 481 applications for new B installations in 2013/2014, a
13% increase from the 424 applications received during the previous year but still 16% less than the
573 received in 2011/2012. Authorities made decisions on 484 applications during 2013/2014, a 12%
increase from last year’s figure of 434 though still 17% lower than the corresponding 2011/2012 figure
of 581 decisions.
The number of applications that authorities had on hand at the end of 31st March 2014 (viz. 119) was
11% below last year’s figure of 133 and 6% lower than the 127 reported in 2011/2012.
The time taken to make a decision is defined as the time from an application being received to a permit
being granted. During 2013/2014, authorities made 358 decisions for the categories of waste oil
burners (<0.4MW), service stations, dry cleaners and vehicle refinishing: 72% of these applications
were decided in under two months, 21% were decided in two to four months, while the remaining 7%
took over four months to decide.
0%
10%
20%
30%
40%
50%
60%
70%
80%
90%
100%
April 09 - M arch 10 April 10 - M arch 11 April 11 - M arch 12 April 12 - M arch 13 April 13 - M arch 14
Year
Perc
en
tag
es o
f D
ecis
ion
s M
ad
e
>4 months
2-4 months
< 2 months
Figure 2.1: Percentages of decisions made within specified times on applications for
reduced fee Part B installations, by year. (457 decisions in 2009/10, 420 in 2010/11,
359 decisions in 2011/12,263 decisions in 2012/2013 and 358 decisions in 2013/14)
Management Summary
Hartley McMaster Ltd MS-5 29/06/2015
Between them, the remaining (standard) categories of installation accounted for 126 applications: of
these, 69% took less than four months for a decision, 16% took between four and six months, while the
remaining 15% of these applications took more than six months for a decision.
0%
10%
20%
30%
40%
50%
60%
70%
80%
90%
100%
April 09 - M arch 10 April 10 - M arch 11 April 11 - M arch 12 April 12 - M arch 13 April 13 - M arch 14
Year
Perc
en
tag
es o
f D
ecis
ion
s M
ad
e
> 6 months
4-6 months
< 4 months
Figure 2.2: Percentages of decisions made within specified times on applications for
standard (full) fee Part B installations, by year. (265 decisions in 2009/10, 228 in
2010/11, 222 in 2011/12, 171 decisions in 2012/13and 126 decisions in 2013/2014).
2.2 Permitted installations (Tables 3 – 6, Annex A)
There were 17,787 permitted Part B installations throughout England and Wales in 2013/2014. This
figure represents a small (2.5%) decrease from the corresponding figure (17,930) in last year's survey
and a 3.4% drop from the level (18,236) recorded in 2011/2012.
2.3 Notices (Table 11, Annex A)
Authorities across England & Wales served 1,927 notices (excluding revocations) on Part B
installations in 2013/2014, an increase of 44% from the corresponding figure of 1,337 in 2012/2013.
Amongst the 1,927 notices served this year, 1,838 were variation notices; the latter figure has increased
by 50% from 1,222 in 2012/2013. The number of enforcement and prohibition notices served decreased
by 18% during the same period (from 78 in 2012/2013 to 64 in 2013/2014).
2.4 Enforcement policies (Table 13, Annex A)
98.3% of authorities reported that their LAPPC enforcement complies with the Regulators Compliance
Code. This represents a 1.4% increase relative to last year's figure of 96.9%. Three (3) of the six (6)
non-compliant authorities had between 21 and 50 installations; five (5) belonged to the English shire
districts local authority group. All of the non-compliant authorities fell into the East Anglia, South East
or South West regions.
One of the authorities that reported compliance with the regulators Compliance Code last year reported
non-compliance this year – Basildon.
Management Summary
Hartley McMaster Ltd MS-6 29/06/2015
2.5 Inspections (Tables 15 - 16, Annex A)
Inspections – General Data
Before the 2010/2011 survey, the LPCSS asked authorities to account separately for
the numbers of applications that they had received for new installations and
the number of inspections carried out in support of these applications.
At the same time, authorities were asked to distinguish between
applications for new installations under Part B and
applications for substantial changes to existing installations under Part B.
The pre-2010/2011 surveys then reported on the ratio of total (i.e. both new and substantial change)
inspections to total applications. Since the 2010/2011 survey, Defra has continued to collect data
separately for the number of inspections carried out in support of both types of application; however,
the Department no longer asks authorities to specify the number of applications received for substantial
changes to existing installations. With only the numbers of applications for new installations available,
reports since 2010/2011 have quoted the ratio of:
the number of inspections carried out in support of applications for new installations to
the number of applications for new installations.
Given this difference in definition of the inspection rate, the reader is discouraged from comparing the
2010/2011 or subsequent years' ratios with those from previous years.
In 2013/2014, authorities carried out an average of 1.07 inspections on a new installation prior to a
decision being made.
The average number of inspections per permitted, full fee installation (excluding such processes as
waste oil burners (<0.4MW), service stations, dry cleaning and vehicle refinishing) increased again this
year to 1.32; it was 1.22 last year and 1.31 in 2011/2012. This inspection rate had previously fallen
steadily since the introduction of risk-based assessments for Part B installations in 2003. The average
number of inspections for reduced fee activities (i.e. waste oil burners (<0.4MW), service stations, dry
cleaning and vehicle refinishing) was 0.50; this rate is lower that both last year’s figure of 0.54 and the
corresponding figure of 0.58 in 2011/2012.
For inspections not in connection with applications, the majority (72%) of inspections last between half
an hour and two hours. There was at least one installation requiring inspections over two hours for all
process types except Gasification, Bulk Chemicals, and Reduced fee using PG6/12 or PG6/36 only.
Two process types incurred inspections lasting longer than two hours for all inspections: Asbestos and
Reduced fee using PG6/19 only.
Risk Assessment
Installations are classified into three groups:
Group I – Standard installations
Group II – Vehicle refinishing (PG6/34b only) and mobile plant
Group III – Other reduced fee activities (small waste oil burners, dry cleaners, petrol stations
(PVRI and II))
269 authorities reported that they had risk assessed all of their installations during 2013/2014. In
2012/2013, the corresponding figure was 273 authorities. Three (3) authorities reported having risk
assessed none of their installations; last year, only one authority had risk assessed none of their
installations.
Management Summary
Hartley McMaster Ltd MS-7 29/06/2015
0%
10%
20%
30%
40%
50%
60%
70%
80%
90%
100%
April 09 - M arch
10
April 10 - M arch 11 April 11 - M arch 12 April 12 - M arch 13 April 13 - M arch 14
Year
Perc
en
tag
e o
f L
ocal
Au
tho
riti
es
None risk-assessed
Some risk-assessed
All risk-assessed
Figure 2.3: Percentage of local authorities, by year, that have risk-assessed all, some
or none of their Part B installations. (346 local authorities in 2009/10, 354 in
2010/11, 353 in 2011/12, 351 in 2012/2013 and 350 local authorities in 2013/2014)
16,581 installations had been risk assessed by the end of 2013/2014; this represents 93.2% of all
permitted Part B installations, the same fraction as seen in 2012/2013.
0%
10%
20%
30%
40%
50%
60%
70%
80%
90%
100%
April 09 - M arch 10 April 10 - M arch 11 April 11 - M arch 12 April 12 - M arch 13 April 13 - M arch 14
Year
Perc
en
tag
e o
f R
isk-A
ssessed
In
sta
llati
on
s
High
Medium
Low
Figure 2.4: Percentages of risk-assessed Part B installations classified as high,
medium or low risk, by year. (17,741 risk-assessed installations in 2009/10; 17,166 in
2010/11; 17,190 in 2011/2012; 16,716 in 2012/13; and 16,581 in 2013/2014)
Management Summary
Hartley McMaster Ltd MS-8 29/06/2015
Amongst risk-assessed installations in 2013/2014, 18% (2,987) were standard installations (Group I),
20% (3,244) were vehicle refinishers or mobile plant (Group II), while the remaining 62% (10,350)
were other reduced fee activities (Group III). The breakdown of risk-assessed installations by category
of risk is shown in the following table:
Group I
(previous years in brackets)
Group II Group III
High 3.7%
(3.0% in 2012/2013,
3.3% in 2011/12,
3.5% in 2010/2011,
3.4% in 2009/2010,
3.3% in 2008/2009,
3.0% in 2007/2008 and
4.0% in 2006/2007)
0.8%
(1.1% in 2012/2013,
0.7% in 2011/2012,
0.9% in 2010/2011,
1.2% in 2009/2010)
0.6%
(1.0% in 2012/2013,
1.1% in 2011/2012,
1.2% in 2010/2011,
1.4% in 2009/2010)
Medium 29.7%
(24.2% in 2012/2013,
24.5% in 2011/2012,
25.7% in 2010/2011,
28.6% in 2009/2010,
29.2% in 2008/2009,
32.8% in 2007/2008 and
36.3% in 2006/2007)
8.2%
(7.4% in 2012/2013,
7.7% in 2011/2012,
9.2% in 2010/2011,
11.1% in 2009/2010)
5.8%
(6.2% in 2012/2013,
6.7% in 2011/2012,
6.7% in 2010/2011,
8.7% in 2009/2010)
Low 66.9%
(72. 8% in 2012/2013,
72.2% in 2011/2012,
70.8% in 2010/2011,
68.0% in 2009/2010,
67.5% in 2008/2009,
63.2% in 2007/2008 and
59.3% in 2006/2007)
91.0%
(91.5% in 2012/2013,
91.6% in 2011/2012,
89.9% in 2010/2011,
87.6% in 2009/2010)
93.6%
(92.8% in 2012/2013,
92.2% in 2011/2012,
92.1% in 2010/2011,
89.9% in 2009/2010)
For standard (Group I) installations, this year’s figures reverse the previous years' trend towards a
lower fraction of medium risk assessments.
Inspections – Risk-based Data
Authorities carried out a total of 11,267 inspections on risk-assessed installations this year. Of these
9,499 were full inspections, 1,208 were check inspections and the remaining 560 were extra
inspections.
Defra and WAG’s guidance stipulates that a high-risk, standard (i.e. Group I) installation should
receive two full inspections and one check inspection per year, while all other groups (i.e. Groups II
and III) of high risk installation should receive one full inspection and one check inspection per year.
A medium risk group I installation should receive one full and one check inspection per year; all other
medium risk installations should receive one full inspection per year. The inspection frequency for a
low-risk installation also depends on the group, with standard (Group I) installations requiring one full
inspection per year, Group II installations requiring one full inspection every two years and Group III
installations requiring one full inspection every three years. The inspection performance cannot be
assessed for low-risk installations in Groups II and III as there is no fixed number of inspections
required in any specific year.
Management Summary
Hartley McMaster Ltd MS-9 29/06/2015
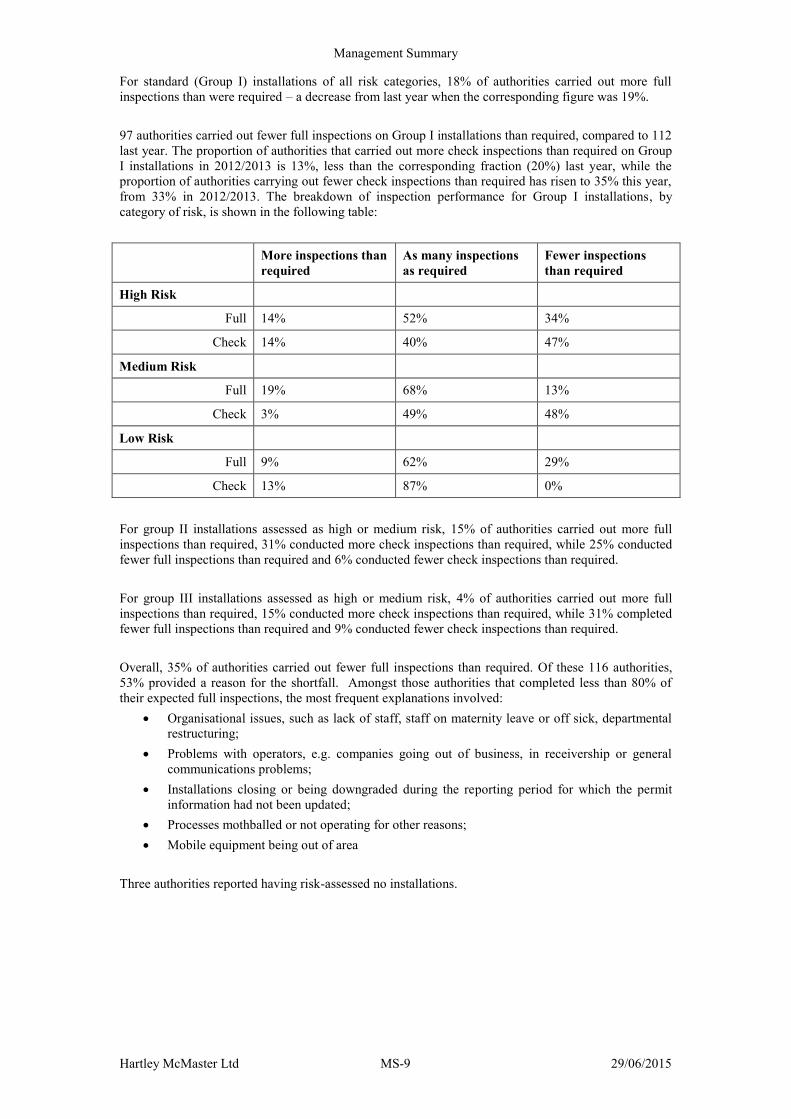
For standard (Group I) installations of all risk categories, 18% of authorities carried out more full
inspections than were required – a decrease from last year when the corresponding figure was 19%.
97 authorities carried out fewer full inspections on Group I installations than required, compared to 112
last year. The proportion of authorities that carried out more check inspections than required on Group
I installations in 2012/2013 is 13%, less than the corresponding fraction (20%) last year, while the
proportion of authorities carrying out fewer check inspections than required has risen to 35% this year,
from 33% in 2012/2013. The breakdown of inspection performance for Group I installations, by
category of risk, is shown in the following table:
More inspections than
required
As many inspections
as required
Fewer inspections
than required
High Risk
Full 14% 52% 34%
Check 14% 40% 47%
Medium Risk
Full 19% 68% 13%
Check 3% 49% 48%
Low Risk
Full 9% 62% 29%
Check 13% 87% 0%
For group II installations assessed as high or medium risk, 15% of authorities carried out more full
inspections than required, 31% conducted more check inspections than required, while 25% conducted
fewer full inspections than required and 6% conducted fewer check inspections than required.
For group III installations assessed as high or medium risk, 4% of authorities carried out more full
inspections than required, 15% conducted more check inspections than required, while 31% completed
fewer full inspections than required and 9% conducted fewer check inspections than required.
Overall, 35% of authorities carried out fewer full inspections than required. Of these 116 authorities,
53% provided a reason for the shortfall. Amongst those authorities that completed less than 80% of
their expected full inspections, the most frequent explanations involved:
Organisational issues, such as lack of staff, staff on maternity leave or off sick, departmental
restructuring;
Problems with operators, e.g. companies going out of business, in receivership or general
communications problems;
Installations closing or being downgraded during the reporting period for which the permit
information had not been updated;
Processes mothballed or not operating for other reasons;
Mobile equipment being out of area
Three authorities reported having risk-assessed no installations.
Management Summary
Hartley McMaster Ltd MS-10 29/06/2015
0 5,000 10,000 15,000 20,000
Hig
hM
ediu
mLow
Level
of
Ris
k
Number of Inspections or Processes
Installations that have been assessed
Extra Inspections
Check Inspections
Full Inspections
Figure 2.5: Inspections performed on risk-assessed Part B installations, broken down
by level of risk. (11,267 inspections; 16,581 risk-assessed Part B installations)
2.6 Monitoring (Table 17, Annex A)
Data is reported in only two groupings: standard installations, and reduced fee activities. 51% of the
3,375 standard installations provided monitoring information, with the data from 18.6% of these
requiring more than two hours to examine. Among the remaining 14,412 reduced fee activities, 20%
provided monitoring information, with authorities having to spend more than two hours examining the
monitoring data from just 7.1% of them.
2.7 Fees and charges (Tables 19 – 20, Annex A)
Authorities reported their total income received in 2013/2014 as £4.9m. The corresponding figures in
2012/2013 and 2011/2012 were £5.5m and £5.7m respectively. The 2013/2014 figure represents an
average of £13,883 for each of the 352 authorities that reported their income.
Management Summary
Hartley McMaster Ltd MS-11 29/06/2015
£0
£1
£2
£3
£4
£5
£6
£7
April 09 - M arch 10 April 10 - M arch 11 April 11 - M arch 12 April 12 - M arch 13 April 12 - M arch 14
Mil
lio
ns
Year
Lo
cal
Au
tho
riti
es' T
ota
l in
co
me
Figure 2.6: Total income from application fees and annual charges for Part B
installations for local authorities across England & Wales, by year (2009-2014)
2.8 Cost accounting (Table 22, Annex A)
322 (91%) authorities accounted separately for costs and income associated with LAPPC by 31st
March 2014. The corresponding figures in previous years were as follows: 91% of authorities in
2012/2013, 92% of authorities in 2011/2012, 90% in 2010/2011, 90% in 2009/2010, 91% in
2008/2009, 86% in 2007/2008, 82% in 2006/2007 and 83% in 2005/2006.
Management Summary
Hartley McMaster Ltd MS-12 29/06/2015
3 Key findings from analysis of the Common Questions
3.1 Prosecutions and cautions (Tables 1a and 1b, Annex B)
During 2012/2013, six (6) prosecutions were reported and four (4) formal cautions were issued. As of
31st March 2014, there was just one (1) prosecution pending, while the other five (5) prosecutions had
all been successful. The successful prosecutions had fines totalling £130,000; the largest being for
£120,000. This is an increase from last year’s figure of £18,948 for total fines; in 2011/2012 the
corresponding total fines figure was £66,276.
3.2 EU Legislation Data (Tables 2a-2e, Annex B)
Almost all (99%) authorities think that their installations comply completely or substantially with the
legislation on Minimum Inspection Criteria. 159 (45%) authorities carried out more inspections during
2013/2014 than they had planned, whereas 91 (26%) carried out fewer than planned.
As in recent years’ surveys, over nine tenths (95%) of authorities reported that they draw up an
inspection plan at the beginning of the reporting year. However, just 16% of authorities carry out visits
that are co-ordinated with other agencies.
The majority (88%) of authorities communicate their inspection reports to the site operators both orally
and in writing. A further 8% of authorities communicate their inspection reports just in writing. 88% of
authorities now make their inspection reports available to the public.
3.3 Solvents Emissions Directive (Table 3a, Annex B)
There were 2,495 Solvent Emissions Directive (SED) installations holding permits, with a further eight
(8) having been withdrawn. 26.6% of SED installations holding a permit use the reduction scheme, 7%
did not submit a solvent management plan and 6% of operators are breaching SED requirements.
3.4 Paints Directive (Table 3b, Annex B)
There were five (5) instances of non-compliance with the Paints Directive during 2013/2014. All of
these were due to mislabelling. In total, there were forty-one (41) litres of non-compliant paint.
3.5 Costs of running the service
This question investigated whether there was any relationship between direct and indirect costs; it was
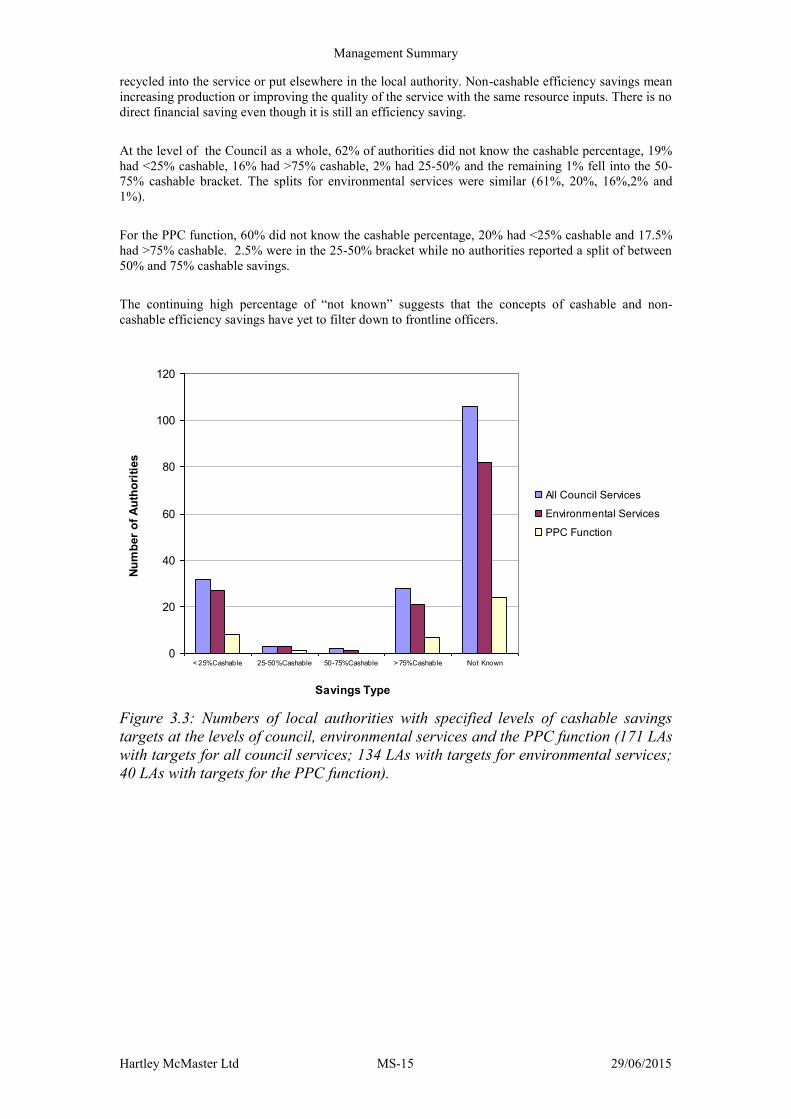
suspected that indirect costs in particular may not be recorded correctly. Figure 3.1 shows (non-zero)
direct costs plotted against (non-zero) indirect costs, excluding a single outlier with very large costs. If
a correlation exists, the data would lie roughly on a straight line. Given how scattered the points on the
chart are, it can clearly be seen that there is no obvious correlation between direct and indirect costs.
This informal conclusion is reinforced by the regression line shown superposed on the data points; the
relatively low value of the accompanying R2 indicates that the straight-line relationship is a poor fit to
the data. [R2 values close to one indicate a good fit; values closer to zero indicate a poor fit.]
A second graph provides and expanded view of the region closest to the origin of the graph. Again,
there appears to be little evidence for a linear relationship between direct and indirect costs.