56
1 Local Wireline Telecoms -Market Underperform- Launching Coverage Of Christopher M. Larsen, CFA (212) 778-8420

1
Local Wireline Telecoms
-Market Underperform-
Launching Coverage Of
Christopher M. Larsen, CFA (212) 778-8420
2
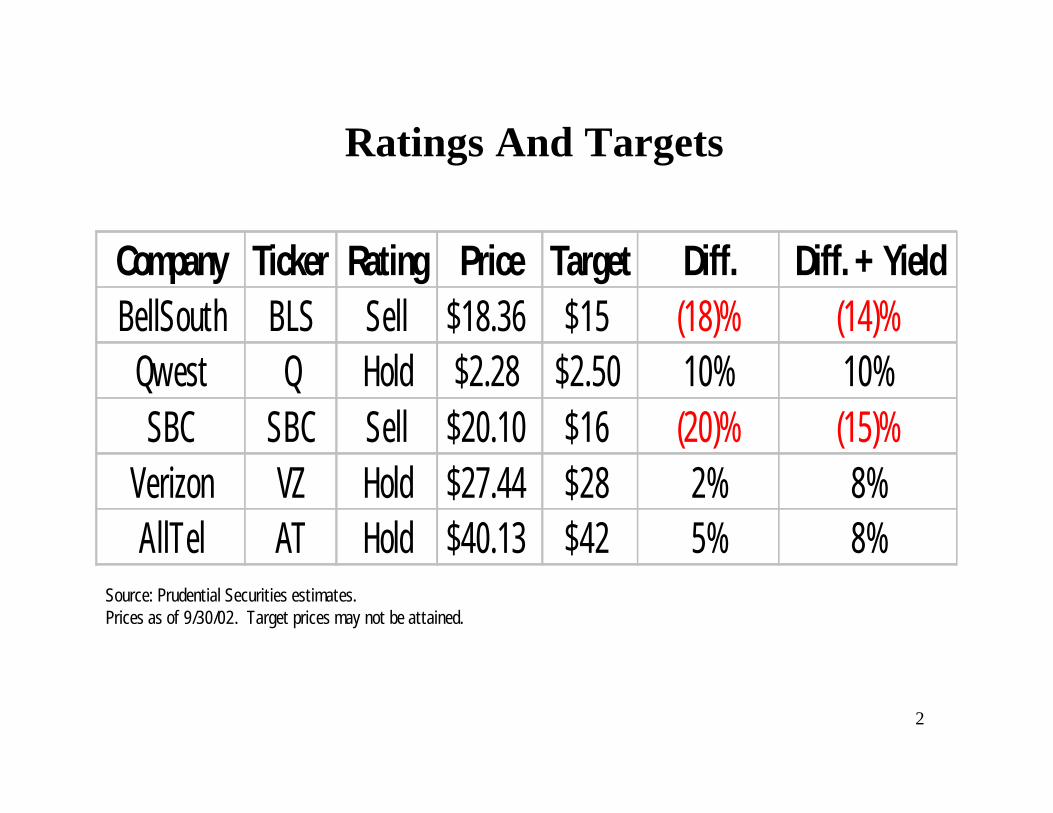
Ratings And Targets
Company Ticker Rating Price Target Diff. Diff. + YieldBellSouth BLS Sell $18.36 $15 (18)% (14)%
Qwest Q Hold $2.28 $2.50 10% 10%SBC SBC Sell $20.10 $16 (20)% (15)%
Verizon VZ Hold $27.44 $28 2% 8%AllTel AT Hold $40.13 $42 5% 8%
Source: Prudential Securities estimates.Prices as of 9/30/02. Target prices may not be attained.

3
Wireline ComparablesCompany Ticker Price Rating
Market Value
Est '02 Net Debt Adjusted TEV* 2001 2002E 2003E 2001 2002E 2003E
Access Lines
TEV/ Access Lines#
BellSouth BLS $18.36 Sell $34,979 $14,857 $55,360 $13,504 $12,717 $12,513 4.1x 4.4x 4.4x 24.8 $2,229Qwest Q $2.28 Hold $3,819 $22,211 $21,730 $7,353 $4,336 $4,886 3.0x 5.0x 4.4x 17.0 $1,275SBC SBC $20.10 Sell $68,565 $22,291 $99,143 $22,291 $21,477 $20,176 4.4x 4.6x 4.9x 56.6 $1,752Verizon VZ $27.44 Hold $74,657 $52,463 $124,909 $26,803 $26,528 $26,098 4.7x 4.7x 4.8x 58.6 $2,131ALLTEL AT $40.13 Hold $12,624 $5,384 $18,008 $2,925 $3,097 $3,369 6.2x 5.8x 5.3x 3.2 $5,603
Company Ticker Price Rating 2001 2002E 2003E 2001 2002E 2003E YieldBellSouth BLS $18.36 Sell $2.34 $2.07 $1.95 7.8x 8.9x 9.4x 4.3%Qwest Q $2.28 Hold $0.03 ($0.51) ($0.44) 69.2x NM NM 0.0%SBC SBC $20.10 Sell $2.35 $2.24 $2.02 8.6x 9.0x 9.9x 5.4%Verizon VZ $27.44 Hold $3.00 $3.01 $2.92 9.1x 9.1x 9.4x 5.6%ALLTEL AT $40.13 Hold $2.84 $3.16 $3.25 14.1x 12.7x 12.3x 3.4%
$ millions
#Note: Enterprise Values include varying portions attributable to non-wireline assets (ie, wireless), so these figures may not be directly comparable.
Source: Company data and Prudential Securities estimates.
*BellSouth and SBC Enterprise Values include proportional net debt from Cingular Wireless. Verizon EBITDA and Enterprise Value are adjusted for Vodafone's interest in Verizon Wireless. Qwest EV and EBITDA adjusted for the sale of QwestDex.
TEV/EBITDAAdjusted EBITDA*
EPS P/E
Prices as of 9/30/02.
4
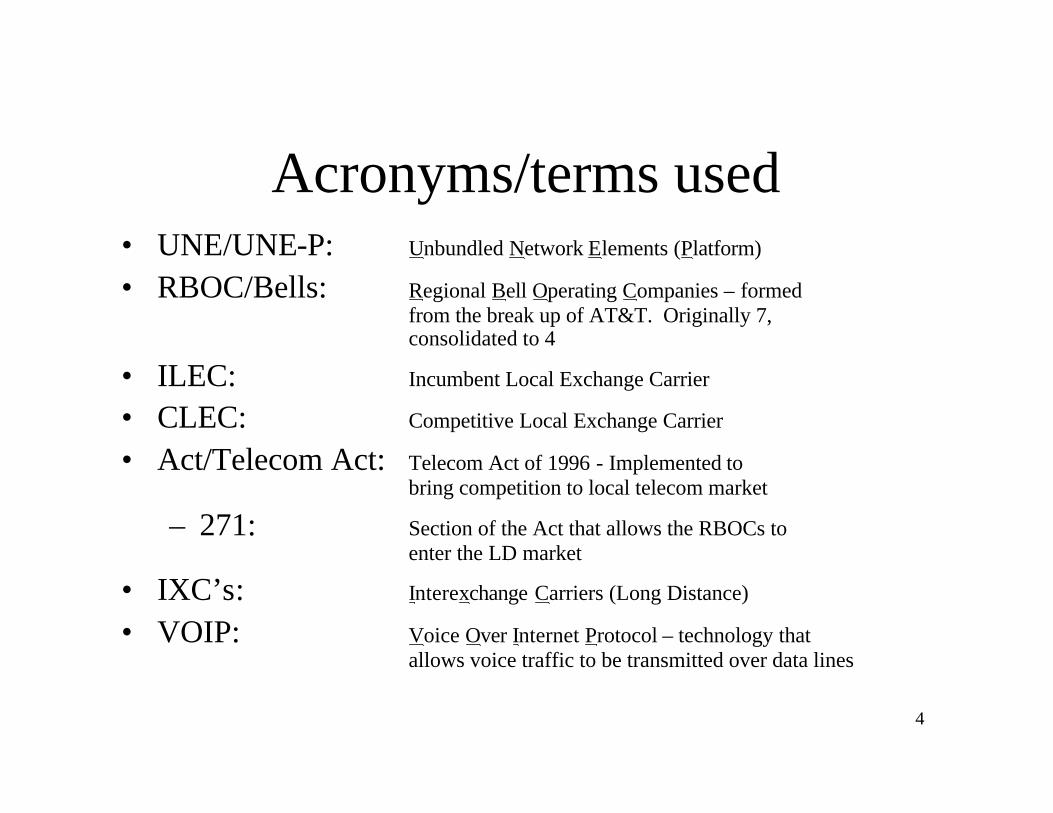
Acronyms/terms used• UNE/UNE-P: Unbundled Network Elements (Platform)
• RBOC/Bells: Regional Bell Operating Companies – formed from the break up of AT&T. Originally 7, consolidated to 4
• ILEC: Incumbent Local Exchange Carrier
• CLEC: Competitive Local Exchange Carrier
• Act/Telecom Act: Telecom Act of 1996 - Implemented to bring competition to local telecom market
– 271: Section of the Act that allows the RBOCs to enter the LD market
• IXC’s: Interexchange Carriers (Long Distance)
• VOIP: Voice Over Internet Protocol – technology that allows voice traffic to be transmitted over data lines

5
Launching With Market Underpeform
• Regulation– UNE-Ps, 271
• Economy– less demand for business and
data
• Technology substitution– wireless, cable modem, DSL
• Competition– CLECs, IXCs, including
bankrupt players
• Pensions• Recurring “One-time
charges”• Costs of UNE-P• 40-50% of costs are
employee-related
Cost IssuesTop Line Concerns
Which should put pressure on the bottom line -
and we believe Street estimates do not reflect that.

6
“By any stretch of the imagination, this is a unique environment. It’s not just the economy. It’s not just the technology. It’s not just the volume of competitors. It’s all of them together.” - Ron Dykes, BellSouth CFO
“Instead of subsidizing prices for average consumers, we now subsidize competitors who in turn siphon revenues out of the market.” – Ed Whitacre, SBC Chairman and CEO
“[UNE-P] depends entirely on ILEC’s ability to absorb all margin pressures and make all capital investments.” - Randall Stephenson, SBC CFO
According to Verizon, 2.5 million lines had been lost to technology substitution by mid-2002, and it expects this number to double by 2004.
-In [Central Offices] where we have seen cable telephony competition, Verizon has experienced a 15% residential access line loss over the last two years.
-UNE discounts cannot be offset by cost reductions.
-Wholesale receivables and uncollectible expense continue to increase dramatically.
– Ivan Seidenberg, Verizon CEO in a presentation to the FCC
Don’t Just Take My Word For It
7
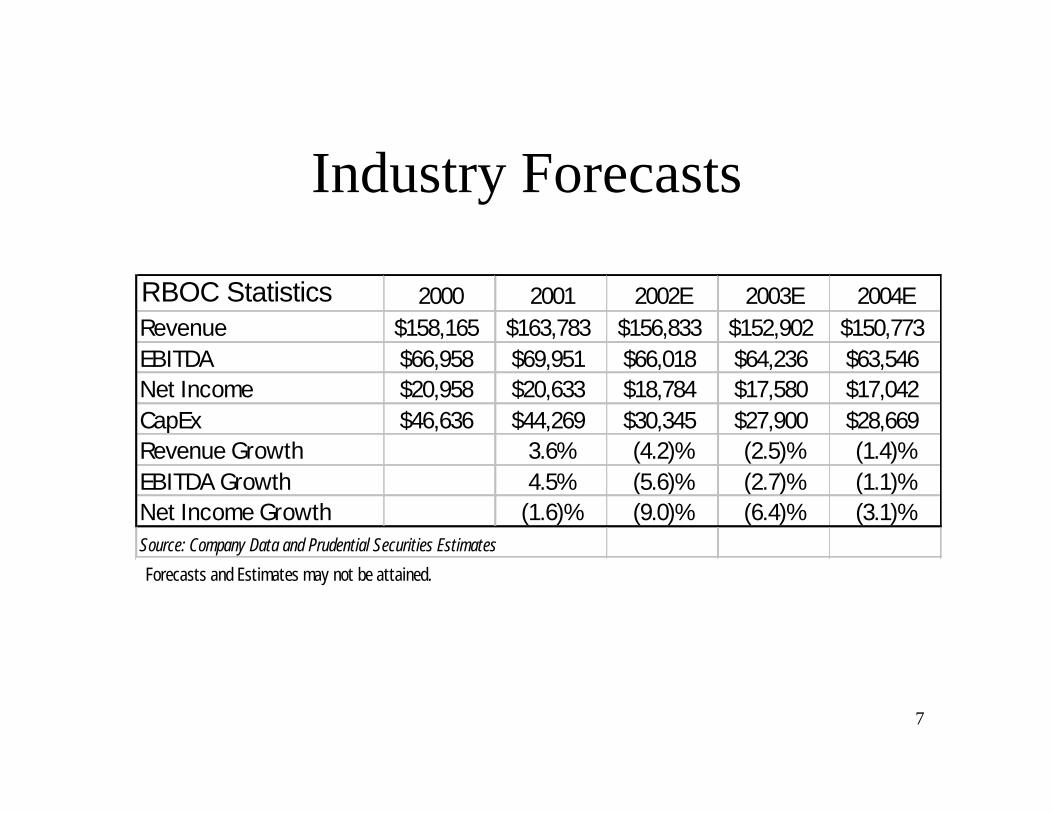
Industry Forecasts
RBOC Statistics 2000 2001 2002E 2003E 2004ERevenue $158,165 $163,783 $156,833 $152,902 $150,773EBITDA $66,958 $69,951 $66,018 $64,236 $63,546Net Income $20,958 $20,633 $18,784 $17,580 $17,042CapEx $46,636 $44,269 $30,345 $27,900 $28,669Revenue Growth 3.6% (4.2)% (2.5)% (1.4)%EBITDA Growth 4.5% (5.6)% (2.7)% (1.1)%Net Income Growth (1.6)% (9.0)% (6.4)% (3.1)%Source: Company Data and Prudential Securities Estimates
Forecasts and Estimates may not be attained.

8
Old Growth Drivers Drying Up
• Vertical Services– Caller ID, Voicemail
• Wireless• Second Phone Lines
– Dial-Up
Forecasts may not be attained.

9
Top Line Impacts• UNE-P: Involuntary
Wholesale• Technology Substitution
-4.0%
-3.0%
-2.0%
-1.0%
0.0%
1.0%
2.0%
3.0%
4.0%
'00 Ja
n MarMay Ju
lySe
pt Nov
'01 Ja
n MarMay Ju
lySe
pt Nov
'02 Ja
n MarMay Ju
ly
• Economy• Facilities-based
Competition
Verizon Monthly Line GrowthRBOC Retail Access Lines (mm)
135
140
145
150
155
160
1Q01 2Q01 3Q01 4Q01 1Q02 2Q02 3Q02E 4Q02E
Source: Company Data and Prudential Securities estimates
10
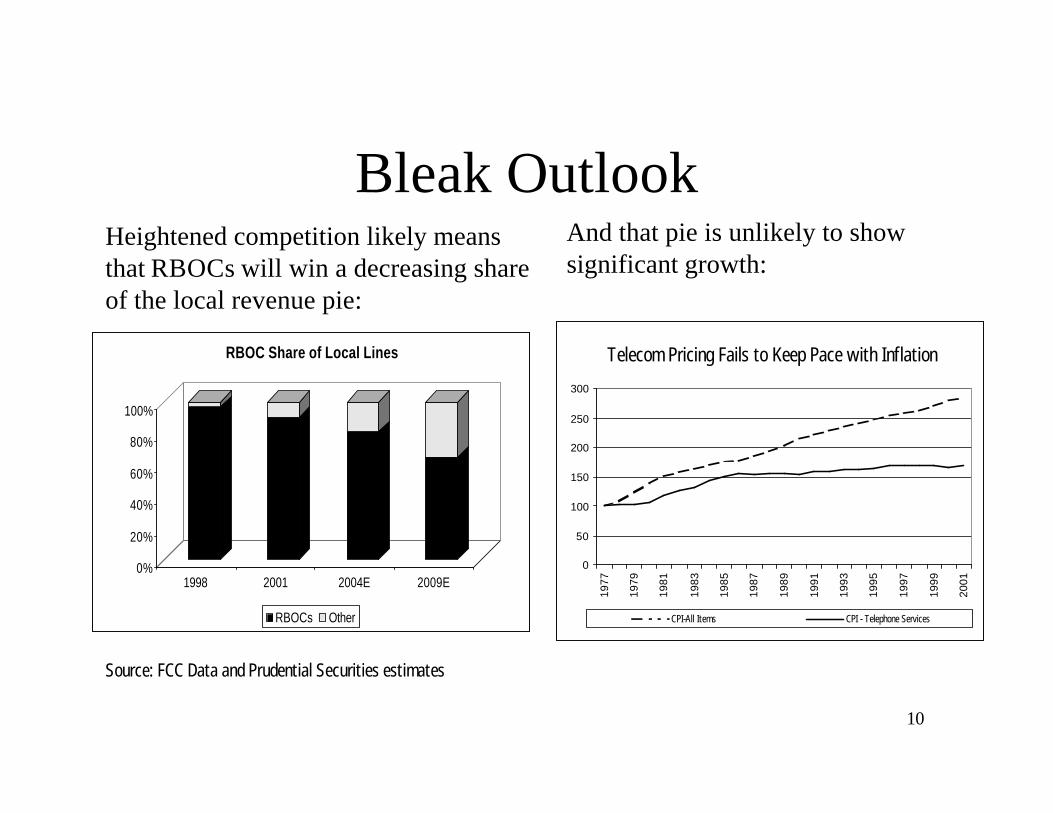
Bleak OutlookHeightened competition likely means that RBOCs will win a decreasing share of the local revenue pie:
And that pie is unlikely to show significant growth:
0
50
100
150
200
250
300
1977
1979
1981
1983
1985
1987
1989
1991
1993
1995
1997
1999
2001
CPI-All Items CPI - Telephone Services
Telecom Pricing Fails to Keep Pace with Inflation
0%
20%
40%
60%
80%
100%
1998 2001 2004E 2009E
RBOC Share of Local Lines
RBOCs Other
Source: FCC Data and Prudential Securities estimates
11
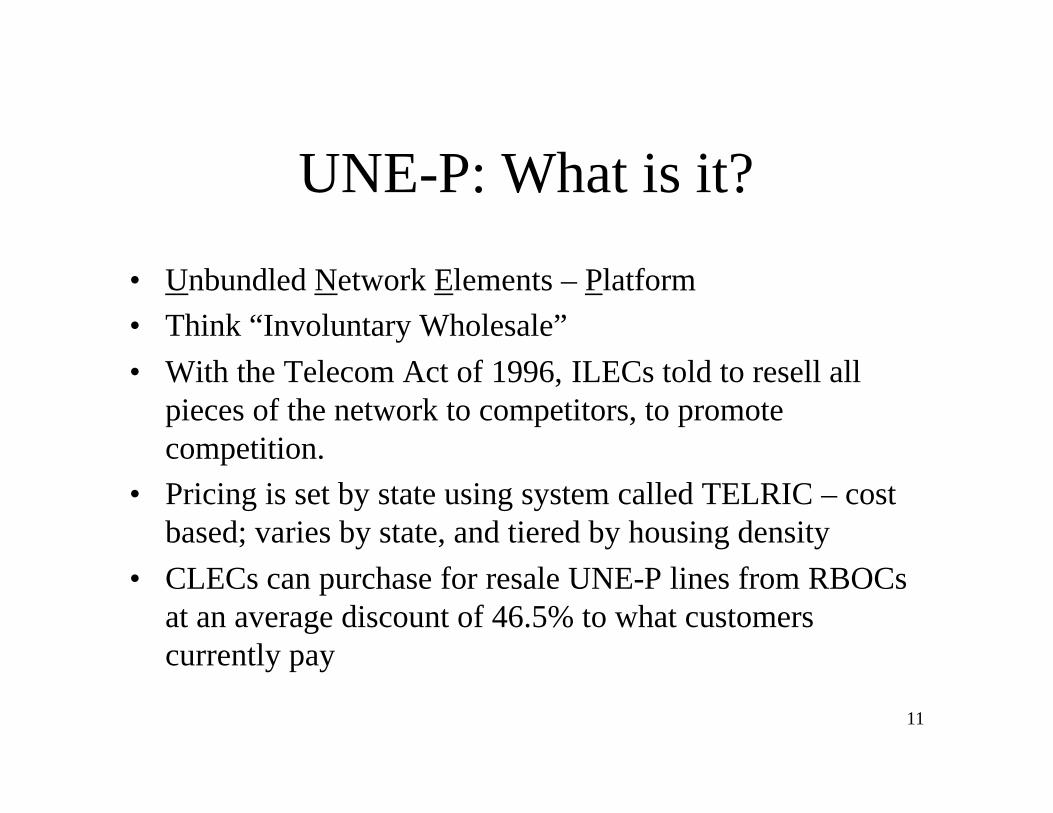
UNE-P: What is it?
• Unbundled Network Elements – Platform• Think “Involuntary Wholesale”• With the Telecom Act of 1996, ILECs told to resell all
pieces of the network to competitors, to promote competition.
• Pricing is set by state using system called TELRIC – cost based; varies by state, and tiered by housing density
• CLECs can purchase for resale UNE-P lines from RBOCs at an average discount of 46.5% to what customers currently pay

12
UNE-P has great economics … for the Reseller, i.e. the CLECs
Who are the big CLECs? AT&T & MCI WorldCom• Virtually no capital• High Margins (40%+ gross)• Exact same service customers already have
– It’s like switching long distance service
• LD carriers gaining lots of customers• Economics are not so good for the RBOCs –
maintain ~90% of original costsPrudential Securities Research Department does not follow MCI WorldCom and therefore has no opinion on it.
13
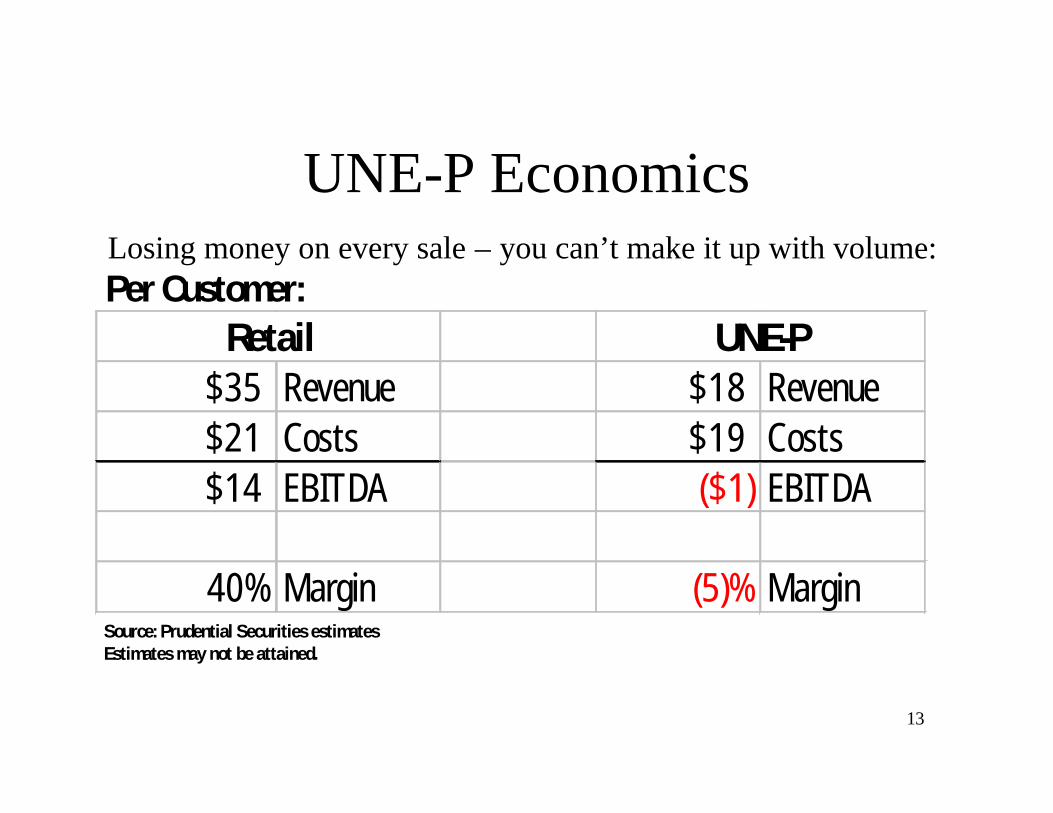
UNE-P EconomicsLosing money on every sale – you can’t make it up with volume:Per Customer:
$35 Revenue $18 Revenue$21 Costs $19 Costs$14 EBITDA ($1) EBITDA
40% Margin (5)% Margin
Retail UNE-P
Source: Prudential Securities estimatesEstimates may not be attained.

14
UNE-P Is Here For the Time Being
• Regulatory environment suggests that UNE-P is unlikely to go away
• Prudential Securities analyst Susan Lynner & I believe there may be some changes in Dec.-Feb. time frame:
– May limit UNE-P for business lines (likely)– May provide a “sunset date” in the future for residential (uncertain)
• RBOCs lobbying hard to win relief• Reality is RBOCs are losing lines to UNE-P at a rapid clip:
– Incremental losses in the last 2 ½ Years: SBC 6.5% of linesBLS 4.5%VZ 1.0%Wholesale represents 3% at Q
Forecasts may not be attained.
15
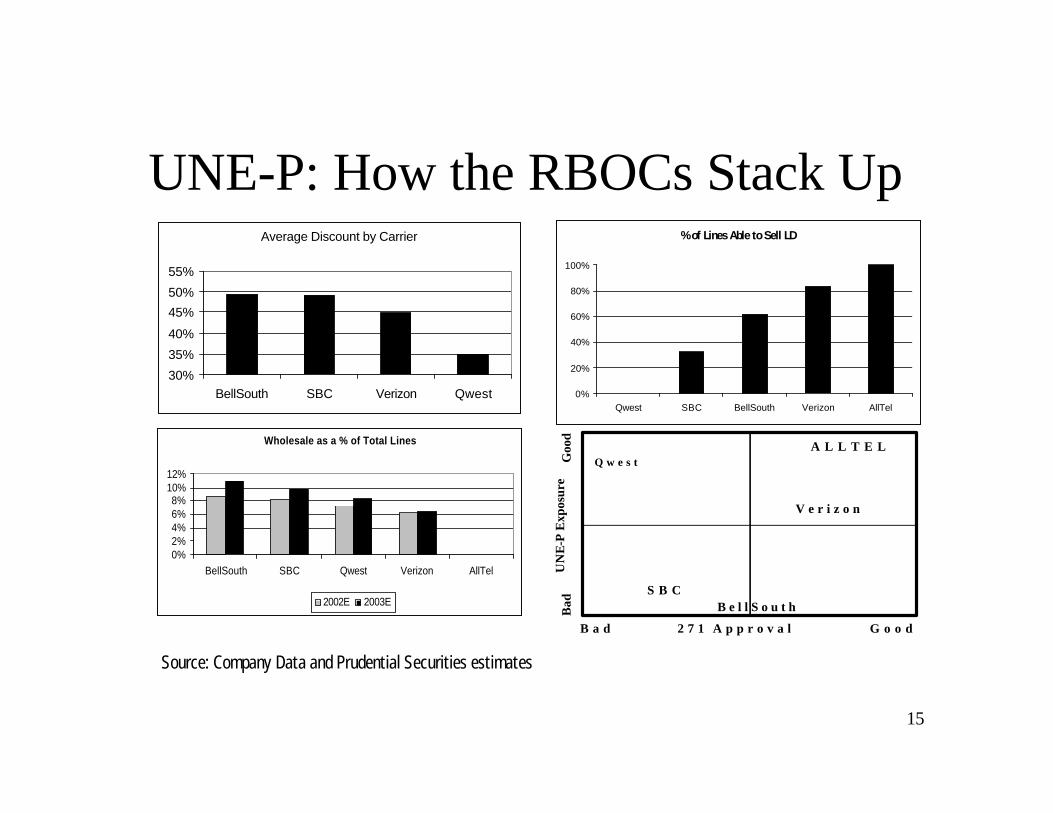
UNE-P: How the RBOCs Stack Up
Q w e s t
S B CB e l l S o u t h
V e r i z o n
A L L T E L
Goo
d
B a d G o o d
Bad
UN
E-P
Exp
osur
e
2 7 1 A p p r o v a l
Wholesale as a % of Total Lines
0%2%4%6%8%
10%12%
BellSouth SBC Qwest Verizon AllTel
2002E 2003E
Average Discount by Carrier
30%
35%
40%
45%
50%
55%
BellSouth SBC Verizon Qwest
% of Lines Able to Sell LD
0%
20%
40%
60%
80%
100%
Qwest SBC BellSouth Verizon AllTel
Source: Company Data and Prudential Securities estimates

16
Technology Substitution
• Wireless– 10 million people have cut the cord– MOUs migrating to wireless (impacts LD & Local)
• Cable Modems & DSL– 12+ mm high-speed subs in U.S.; dial-up subs beginning to decline
• Cable Telephony– VZ has lost 1.5% of residential subscribers
• E-mail/IM– No lost lines, but lost usage
17
Economy
• The economy may be to blame for decreased revenues – particularly business– Slower growth in data spending– Fewer employees = fewer voice lines– Less business = fewer phone calls being made
• However, historical correlation analysis suggests that annual change in line counts & annual change in GDP are not correlated
Past performance is not indicative of future trends.

18
The RBOCs’ Competitors Are Well Positioned
• Long Distance companies: AT&T and WorldCom– Focused on consumer/protecting LD– Taking 70% of incremental UNE lines
• Cable: Deploying circuit switching now– Video, phone & Internet– w/VOIP technology should accelerate (’04/’05)
• CLECs: They’re not dead yet– Even bankruptcy does not stop them– Sometimes Ch. 11 makes them more competitive (eg, McLeod)
Prudential Securities Research Department does not follow MCI WorldCom and therefore has no opinion on it.

19
Facilities-based competition:
• Between 7% and 11% of lines in the U.S. are served by facilities based CLECs
• There are 1300 competitive switches in the US– CLECs got low cost money to build in ‘98-’00– Their network have low capacity utilization
• Facilities based is harder/slower/more capital-intensive– Harder to provision/maintain service– Physical equipment/cable must be put in place– Switches, lines, etc. cost capital
• But this is the kind of competition the Act was trying to stimulate
The RBOC loses virtually all revenue when a customer goes to a facilities-based competitor

20
Revenue Pressure Only Somewhat Offset by Long Distance
• Once RBOCs show they have opened their markets to competition, they can enter the long distance market– Need “271” approval from FCC– RBOCs are likely to have 35 states (collectively) with
271 by the end of 1Q03• The long distance market is incremental to the
RBOCs• Pricing and competition make the margins lower
for long distance than for monopoly local service
21
Importance of 271 (Long Distance)
• Section 271 approval allows RBOCs to sell LD in the states in which they are the incumbent– Don’t need for non RBOC states, like GTE
• Selling the LD bundle improves revenues, and can also be a churn reducer, especially in residential
• In order to effectively target the enterprise market ($25B+), an RBOC needs 271 in all states
• Non-RBOCs (like AllTel) don’t need 271 approval
22
Cost Pressures• Pensions – Pension income accounted for ~15% of 2001 pre-tax
income and is declining and should continue doing so barring a full recovery of the stock market
• Recurring “One Time” charges– 3 of the 4 RBOCs have taken charges covering each of the last six
quarters; the other has “only” taken three.
• UNE-P: Substantial loss of revenues, but very little cost reduction– 90% of costs remain with conversion to UNE-P
Cost Savings? Head count reduction– 40-60% of operating costs are costs of employees– Carriers are trimming work force

23
Benefits from Pensions Likely to Decline
Pension Income as a % of Pre-Tax Income
0%
5%
10%
15%
20%
25%
Verizon Qwest BellSouth SBC AllTel
2000 2001
51%
Pension benefits have contributed significantly to net income in recent years …
But this is unlikely to continue given sharply lower returns. This year’s returns impact next year’s EPS.
Source: Company data and Prudential Securities estimates
Forecasts may not be attained.
24
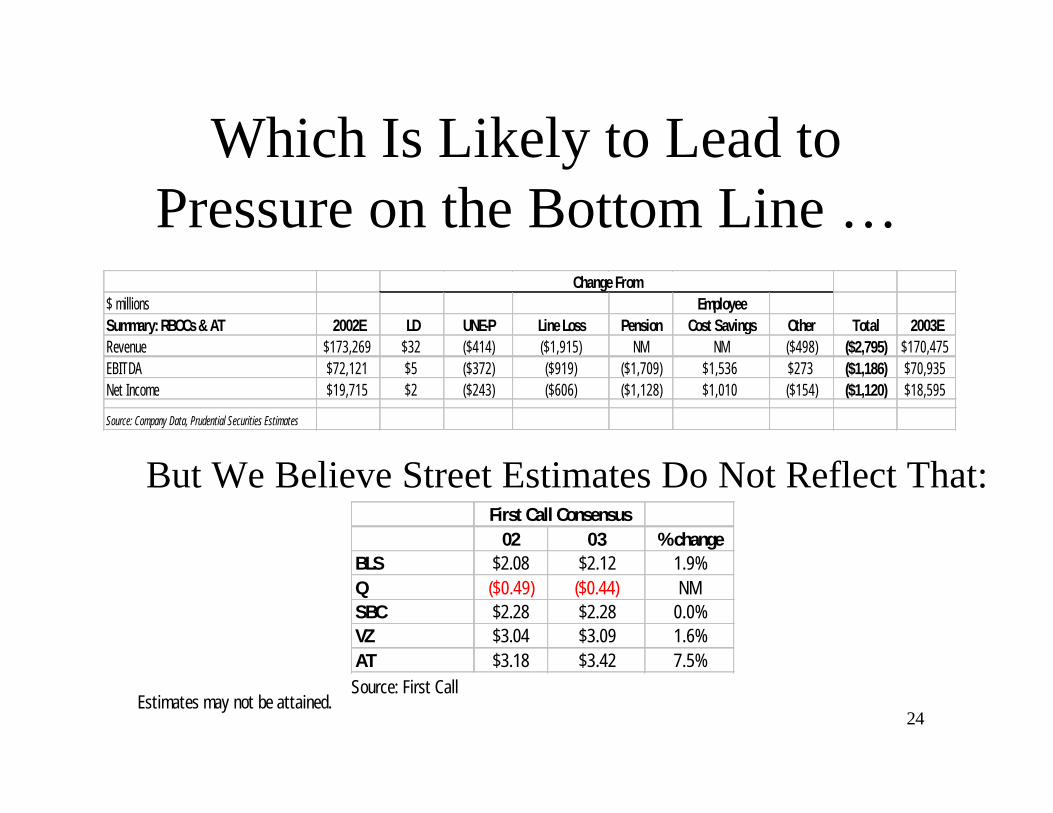
Which Is Likely to Lead to Pressure on the Bottom Line …
But We Believe Street Estimates Do Not Reflect That:
02 03 % changeBLS $2.08 $2.12 1.9%Q ($0.49) ($0.44) NMSBC $2.28 $2.28 0.0%VZ $3.04 $3.09 1.6%AT $3.18 $3.42 7.5%
First Call Consensus
Source: First Call
$ millions EmployeeSummary: RBOCs & AT 2002E LD UNE-P Line Loss Pension Cost Savings Other Total 2003ERevenue $173,269 $32 ($414) ($1,915) NM NM ($498) ($2,795) $170,475EBITDA $72,121 $5 ($372) ($919) ($1,709) $1,536 $273 ($1,186) $70,935Net Income $19,715 $2 ($243) ($606) ($1,128) $1,010 ($154) ($1,120) $18,595
Source: Company Data, Prudential Securities Estimates
Change From
Estimates may not be attained.

25
What’s the Bull Case?• But They’re Cheap
– Historically low P/E– Historically low EV/EBITDA– Good dividend yield
• Lots of Free Cash Flow• They’re Survivors• Playing the Economic Rebound• “It’s In the Stocks”• Regulatory Relief• LD Opportunity
26
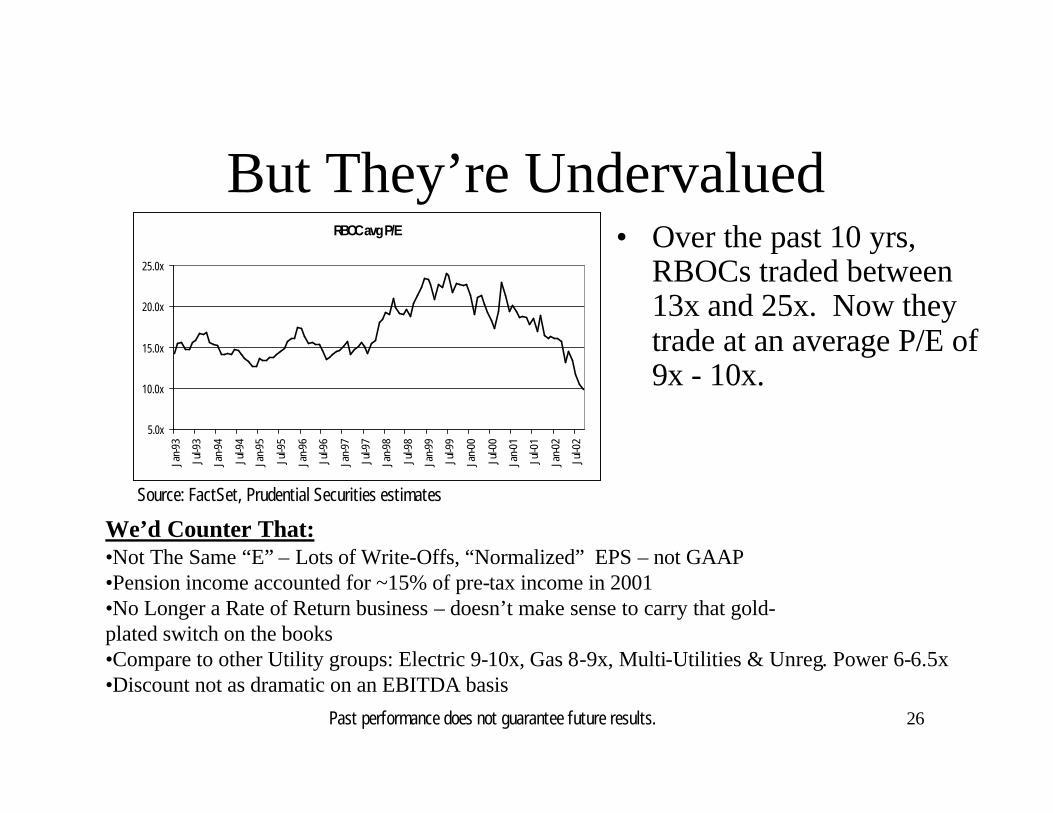
But They’re Undervalued• Over the past 10 yrs,
RBOCs traded between 13x and 25x. Now they trade at an average P/E of 9x - 10x.
We’d Counter That:•Not The Same “E” – Lots of Write-Offs, “Normalized” EPS – not GAAP•Pension income accounted for ~15% of pre-tax income in 2001•No Longer a Rate of Return business – doesn’t make sense to carry that gold-plated switch on the books•Compare to other Utility groups: Electric 9-10x, Gas 8-9x, Multi-Utilities & Unreg. Power 6-6.5x•Discount not as dramatic on an EBITDA basis
RBOC avg P/E
5.0x
10.0x
15.0x
20.0x
25.0x
Jan-
93
Jul-9
3
Jan-
94
Jul-9
4
Jan-
95
Jul-9
5
Jan-
96
Jul-9
6
Jan-
97
Jul-9
7
Jan-
98
Jul-9
8
Jan-
99
Jul-9
9
Jan-
00
Jul-0
0
Jan-
01
Jul-0
1
Jan-
02
Jul-0
2
Source: FactSet, Prudential Securities estimates
Past performance does not guarantee future results.

27
But They’re Undervalued• Excluding the
“hyper” telecom years of ’98-’00, RBOCs have historically traded at 6-6.5x EBITDA. Now they trade at ~5.5x
We’d Counter That:nn Times Have ChangedTimes Have Changed
nn No longer a monopoly business No longer a monopoly business –– full competitionfull competitionnn EBITDA not growing, but shrinkingEBITDA not growing, but shrinkingnn Regulatory environment is toughRegulatory environment is tough
RBOC EV/EBITDA
5.0X
5.5X
6.0X
6.5X
7.0X
7.5X
8.0X
8.5X
9.0X
Jan-
93
Jul-9
3
Jan-
94
Jul-9
4
Jan-
95
Jul-9
5
Jan-
96
Jul-9
6
Jan-
97
Jul-9
7
Jan-
98
Jul-9
8
Jan-
99
Jul-9
9
Jan-
00
Jul-0
0
Jan-
01
Jul-0
1
Jan-
02
Jul-0
2
Source: FactSet, Prudential Securities estimates
Past performance does not guarantee future results.

28
But They’re Undervalued• RBOC yields
have actually been higher than their current 5%
nn Yes, they pay healthy dividends that are safe, but:Yes, they pay healthy dividends that are safe, but:nn Nothing to say yield can’t go upNothing to say yield can’t go upnn They have been higher in the pastThey have been higher in the past
nn One concern about underOne concern about under--weighting these high yielding companies would be a tax weighting these high yielding companies would be a tax change on dividend incomechange on dividend income
RBOC Yield
0%
1%
2%
3%4%
5%
6%
7%
1992 1993 1994 1995 1996 1997 1998 1999 2000 2001 2002Note:ex-Qwest
Source: FactSet, Prudential Securities estimates

29
Lots of Free Cash Flow
• Yes, They Have Lots of FCF, but:– The big growth in it comes from cost cutting– The year-over-year comps look so good
because they overspent in ’99 & ’00
• We would concede that the strong FCF does make the dividend yields & stock buy-back programs rather secure
30
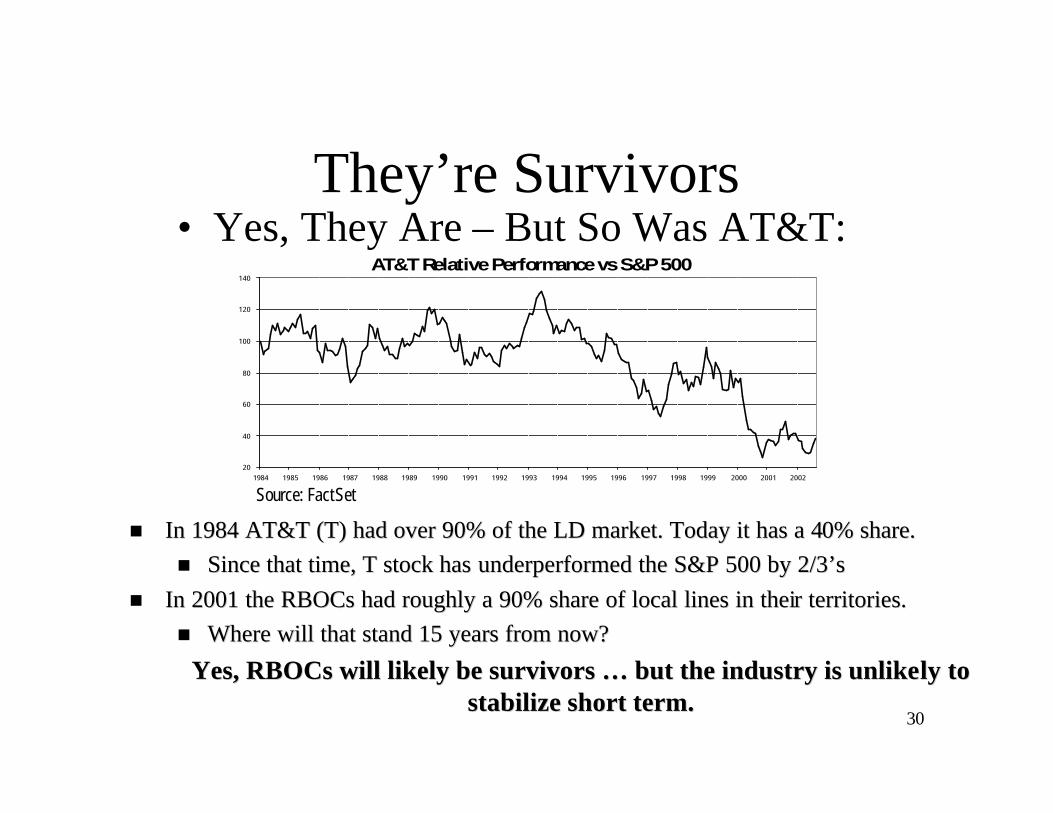
They’re Survivors• Yes, They Are – But So Was AT&T:
nn In 1984 AT&T (T) had over 90% of the LD market. Today it has a 4In 1984 AT&T (T) had over 90% of the LD market. Today it has a 40% share.0% share.nn Since that time, T stock has Since that time, T stock has underperformed underperformed the S&P 500 by 2/3’sthe S&P 500 by 2/3’s
nn In 2001 the RBOCs had roughly a 90% share of local lines in theiIn 2001 the RBOCs had roughly a 90% share of local lines in their territories.r territories.nn Where will that stand 15 years from now?Where will that stand 15 years from now?
Yes, RBOCs will likely be survivors … but the industry is unlikeYes, RBOCs will likely be survivors … but the industry is unlikely to ly to stabilize short term.stabilize short term.
AT&T Relative Performance vs S&P 500
20
40
60
80
100
120
140
1984 1985 1986 1987 1988 1989 1990 1991 1992 1993 1994 1995 1996 1997 1998 1999 2000 2001 2002
Source: FactSet

31
Economic Rebound• The economy is probably to blame for some of the lost lines & slower data
revenue growth.• But, an economic rebound may not help the RBOCs all that much.
-4%
-2%
0%
2%
4%
6%
8%
1980 1982 1984 1986 1988 1990 1992 1994 1996 1998
0%
1%
1%
2%
2%
3%
3%
4%
4%
5%
5%
% GDP Local Loops
n The correlation between annual GDP growth & line growth since 1981 is almost non-existent:
n R-squared (R2) of change in current GDP to change in local loops: less than 1%. Lagging one year (to allow time for economic impact to take hold): R2=11%.
n This means almost 90% of the annual change in local loops can be attributed to something other than GDP.
There are likely other sectors that would be better plays on an economic rebound
Source: FCC Data

32
It’s In The Stocks
• Maybe the bad news is “in the stocks,” but we would argue it’s not in the ’03 Street consensus estimates:
2001 2002E 2003EConsensus Prudential Consensus Prudential Low High
BellSouth $2.34 $2.08 $2.07 $2.12 $1.95 ($0.01) ($0.17) $2.00 $2.22Qwest $0.03 ($0.49) ($0.51) ($0.44) ($0.44) ($0.02) $0.00 ($0.71) ($0.19)SBC $2.35 $2.28 $2.24 $2.28 $2.02 ($0.04) ($0.26) $2.04 $2.50Verizon $3.00 $3.04 $3.01 $3.09 $2.92 ($0.03) ($0.17) $2.94 $3.20AllTel $2.84 $3.18 $3.16 $3.42 $3.25 ($0.02) ($0.17) $3.31 $3.59Source: FirstCall and Prudential Securities Estimates
2002E 2003E"Normalized" EPS
Difference03E Street Range
Estimates may not be attained/realized.
33
Regulatory Relief• The RBOCs are looking for relief on 3 main areas:
– DSL/Broadband– UNE-P– Receivables/Chapter 11
• Prudential Securities analyst Susan Lynner and I believe: – DSL/Broadband: May get some regulatory clarity, but probably not
enough to turn the stocks around.– UNE-P: The FCC is completing a review of UNE regulations, and thus
RBOCs are likely to get some immediate relief in business UNE-P, but residential relief may be years away.
– Receivables/Ch. 11: The Bells want protection for bankrupt companies to pay their bills (client receivable exposure) but also want to avoid fierce competition with a raft of restructured companies facing $0 debt. (WCOM)

34
Long Distance Opportunity
• Long Distance is a ~$95B market and the Bells are going after it.
nn However, they are not However, they are not going after all of it:going after all of it:
nn If the RBOCs generate a 1:1 ratio of UNEIf the RBOCs generate a 1:1 ratio of UNE--P lines lost to P lines lost to LD lines gained, they can maintain a flat revenue line.LD lines gained, they can maintain a flat revenue line.
nn However, they need to gain more than 4 LD lines for every However, they need to gain more than 4 LD lines for every UNEUNE--P line lost to maintain flat EBITDA.P line lost to maintain flat EBITDA.
$ billions$95
intraLATA $18Enterprise $27
Addressable mkt: ~$50
Toll Service Provider Revs.

35
Valuation: How Did We Arrive at our Price Targets?
1. DCF: Free Cash Flow to the Firm, WACC, based on Beta and 4% Risk free, 6.5% risk premium & a terminal multiple of (1+g)/(k-g)
2. PE/PEG: Looked at the S&P 500 utilities, which currently trade at 6-10x earnings and have implied EPS growth of 2-5%. Then used mid-range 8-10x to arrive at a target P/E to apply to ’03 EPS.
3. Dividend Discount Model: ’03 Dividend/(k-g) Where k = cost of equity & g = dividend growth
4. Sum of the Parts: using comparable multiples, valued each piece individually to arrive at a total. This analysis gives a consistently higher valuation; however, we believe it is less meaningful as these companies are unlikely to break up.

36
Risks: What Could Go Wrong With a Market Underperform?
• In other words, “What could make these stocks go up?”– BTE Regulatory Change – particularly UNE-P– Dividend taxation eliminated– The economy does improve line growth– Large player, e.g. WorldCom, exits the market– Bundling becomes effective

37
RBOC Territories
US West
SBCBLS
VZ
Source: Company data

38
• BellSouth (BLS–Sell; $18.36) – only Bell in its original form. Operates in Southeast U.S. Heavy exposure to UNE-Ps. Has authority to offer LD in 7 of 9 states. Wireless (Cingular) is slower growth than industry. Exposure to LatAm. Bundling efforts to date have not staved off line losses.
• SBC (SBC–Sell; $20.10) – has acquired PacBell, Ameritech and SNET to make 2nd
largest Bell by lines, with local in Midwest, Southwest, CA and CT. Heavy exposure to UNE-Ps and slow in getting 271 approval. Wireless (Cingular) is slower growth than industry average. Bundling efforts to date have not staved off line losses.
• Verizon (VZ–Hold; $27.44) – formed from RBOCs Bell Atlantic and Nynex, plus ILEC GTE. Most markets are on East coast, with properties from GTE thoughout U.S., including lines in CA & FL. An early line loser to wholesaling, VZ has steadied those losses and is selling telecom bundles to stablize revenues. Hold due to industry concerns, but has best RBOC metrics, in our view.
• Qwest (Q–Hold; $2.28) – formed from merger of RBOC US West and fiber co Qwest. Lots of rural access lines means less UNE-P competition, but undergoing lots of gov’t scrutiny for past deeds. Operates local in Western states & LD nationwide. Lots of uncertainty makes for a volatile name; speculative hold.
• AllTel (AT–Hold; $40.13) – only non-RBOC; operates wireless & wireline in Southeast U.S. Rural states and less regulation offer limited downside. Would look to revisit valuation if Street expectations lowered to reflect business conditions.
Stocks and Our Ratings
Prices as of 9/30/02. Target prices may not be attained.
Target
$15
$16
$28
$2.50
$42

39
BellSouth – BLS - Sell
$0
$10
$20
$30
$40
$50
$60
2002200220012001200020001999
Net Debt/Year Revenues EBITDA EPS Consensus Access Lines Wireless Subs* Net Debt EBITDA2001 $29,589 $13,504 $2.34 25.423 8.638 $24,404 1.8x2002E $28,664 $12,756 $2.07 $2.08 24.841 8.973 $20,909 1.6x2003E $28,324 $12,537 $1.95 $2.14 24.414 9.363 $15,987 1.3x
Other Financial Data: 2001Shares Out 1,905 Communications group 63.6%Avg. Daily Volume 5.04mm Domestic wireless 19.1%Market Cap $37.4B Latin America 9.8%YTD Performance -48.6% Domestic advert & publishing 7.0%
All other 0.5%* Proportionate for 40% share of Cingular.
Current Price $18.36Target $15% change to target -18.3%2002E Dividend $0.79Yield 4.3%Target + Dividend -14.0%
Source: Company data, Prudential Securities estimateTarget price and earnings estimates may not be attained.
Price as of 9/30/02
40
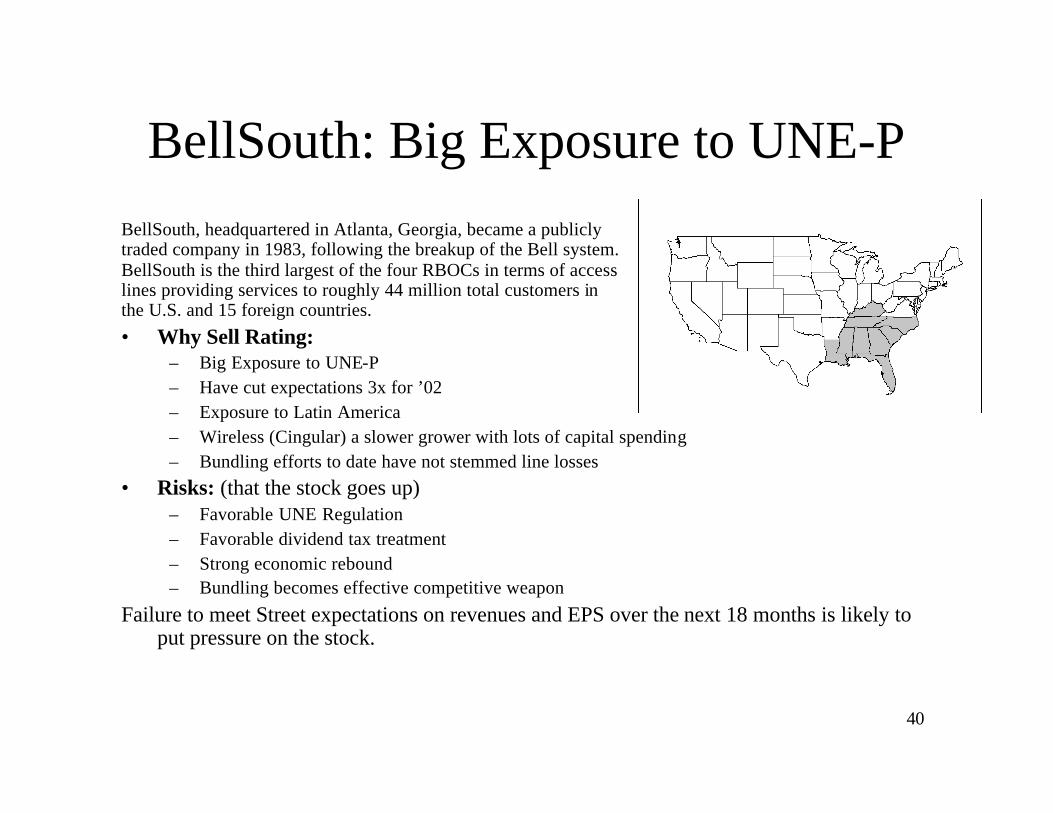
BellSouth: Big Exposure to UNE-PBellSouth, headquartered in Atlanta, Georgia, became a publicly traded company in 1983, following the breakup of the Bell system. BellSouth is the third largest of the four RBOCs in terms of access lines providing services to roughly 44 million total customers in the U.S. and 15 foreign countries.
• Why Sell Rating:– Big Exposure to UNE-P– Have cut expectations 3x for ’02– Exposure to Latin America– Wireless (Cingular) a slower grower with lots of capital spending– Bundling efforts to date have not stemmed line losses
• Risks: (that the stock goes up)– Favorable UNE Regulation– Favorable dividend tax treatment– Strong economic rebound– Bundling becomes effective competitive weapon
Failure to meet Street expectations on revenues and EPS over the next 18 months is likely to put pressure on the stock.

41
SBC – SBC - Sell
$0
$10
$20
$30
$40
$50
$60
$70
27-S
ep-2
002
28-A
ug-2
002
30-J
ul-2
002
28-J
un-2
002
30-M
ay-2
002
30-A
pr-2
002
01-A
pr-2
002
28-F
eb-2
002
29-J
an-2
002
27-D
ec-2
001
27-N
ov-2
001
26-O
ct-2
001
27-S
ep-2
001
22-A
ug-2
001
24-J
ul-2
001
22-J
un-2
001
23-M
ay-2
001
24-A
pr-2
001
23-M
ar-2
001
22-F
eb-2
001
23-J
an-2
001
20-D
ec-2
000
20-N
ov-2
000
20-O
ct-2
000
21-S
ep-2
000
22-A
ug-2
000
24-J
ul-2
000
22-J
un-2
000
23-M
ay-2
000
24-A
pr-2
000
23-M
ar-2
000
23-F
eb-2
000
24-J
an-2
000
22-D
ec-1
999
22-N
ov-1
999
22-O
ct-1
999
Net Debt/Year Revenues EBITDA EPS Consensus Access Lines Wireless Subs* Net Debt EBITDA2001 $54,301 $22,291 $2.35 59.532 12.958 $31,593 1.4x2002E $51,941 $21,477 $2.24 $2.28 56.599 13.460 $31,826 1.5x2003E $50,319 $20,176 $2.02 $2.32 53.673 14.045 $23,627 1.2x
Other Financial Data: 2001Shares Out 3,411 Voice 49.0%Avg. Daily Volume 8.90mm Long-Distance Voice 4.7%Market Cap $68.7B Data 17.7%YTD Performance -48.6% Domestic wireless 13.5%
Directory advertising 8.3%Other 6.8%
* Proportionate for 60% share of Cingular.
Current Price $20.10Target $16% change to target -20.4%2002E Dividend $1.08Yield 5.4%Target + Dividend -15.0%Price as of 9/30/02
Source: Company data, Prudential Securities estimatesTarget price and earnings estimates may not be attained
42
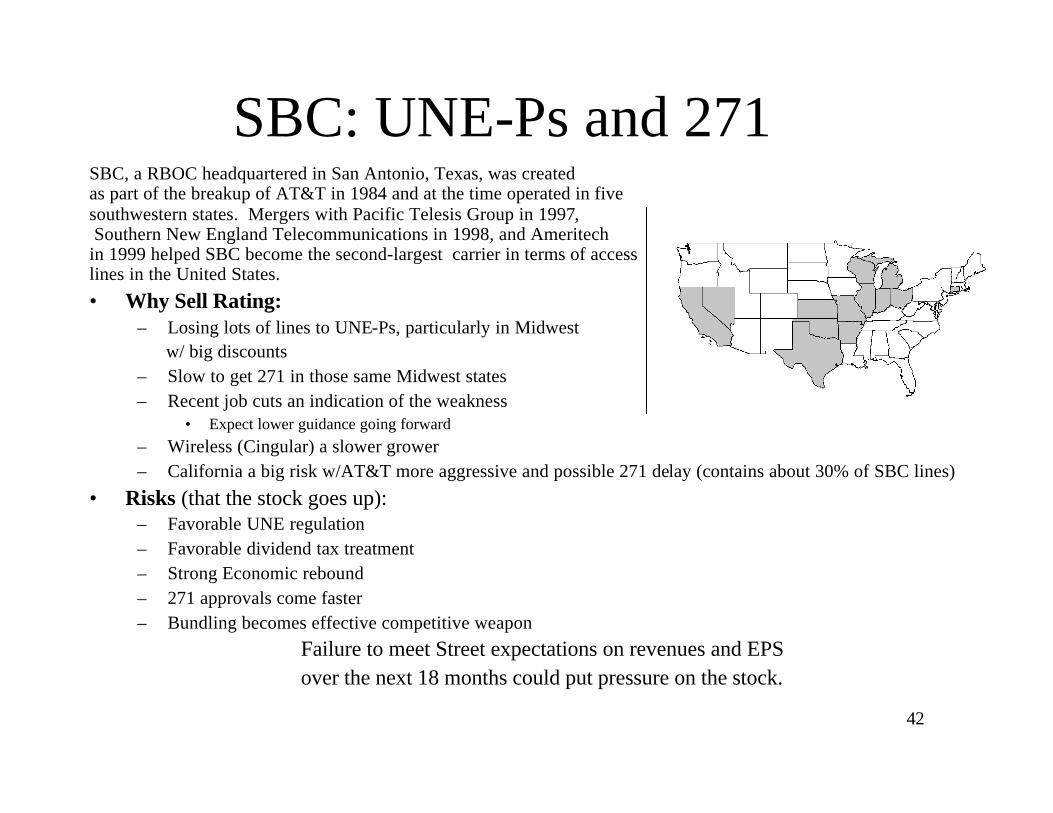
SBC: UNE-Ps and 271SBC, a RBOC headquartered in San Antonio, Texas, was created as part of the breakup of AT&T in 1984 and at the time operated in five southwestern states. Mergers with Pacific Telesis Group in 1997,Southern New England Telecommunications in 1998, and Ameritech
in 1999 helped SBC become the second-largest carrier in terms of access lines in the United States.
• Why Sell Rating:– Losing lots of lines to UNE-Ps, particularly in Midwest
w/ big discounts– Slow to get 271 in those same Midwest states– Recent job cuts an indication of the weakness
• Expect lower guidance going forward– Wireless (Cingular) a slower grower– California a big risk w/AT&T more aggressive and possible 271 delay (contains about 30% of SBC lines)
• Risks (that the stock goes up):– Favorable UNE regulation– Favorable dividend tax treatment– Strong Economic rebound– 271 approvals come faster– Bundling becomes effective competitive weapon
Failure to meet Street expectations on revenues and EPS over the next 18 months could put pressure on the stock.

43
Verizon – VZ - Hold
Net Debt/Year Revenues EBITDA EPS Consensus Access Lines Wireless Subs* Net Debt EBITDA2001 $68,025 $29,509 $3.00 60.947 17.639 $63,347 2.1x2002E $67,451 $29,535 $3.01 $3.04 57.213 19.660 $52,816 1.8x2003E $67,561 $29,428 $2.92 $3.10 55.404 20.890 $47,050 1.6x
Other Financial Data: 2001Shares Out 2,721 Domestic wireline 63.3%Avg. Daily Volume 8.17mm Domestic wireless 25.6%Market Cap $76.4B International 4.7%YTD Performance -40.8% Information services 6.3%
Other 0.1%* Proportionate for 55% share of Verizon Wireless.
$0
$10
$20
$30
$40
$50
$60
$70
$80
27-Sep-200207-May-200211-Dec-200116-Jul-200121-Feb-200127-Sep-200005-May-200013-Dec-1999
Current Price $27.44Target $28% change to target 2.0%2002E Dividend $1.54Yield 5.6%Target + Dividend 7.7%Price as of 9/30/02
Source: Company data, Prudential Securities estimatesTarget price and earnings estimates may not be attained
44
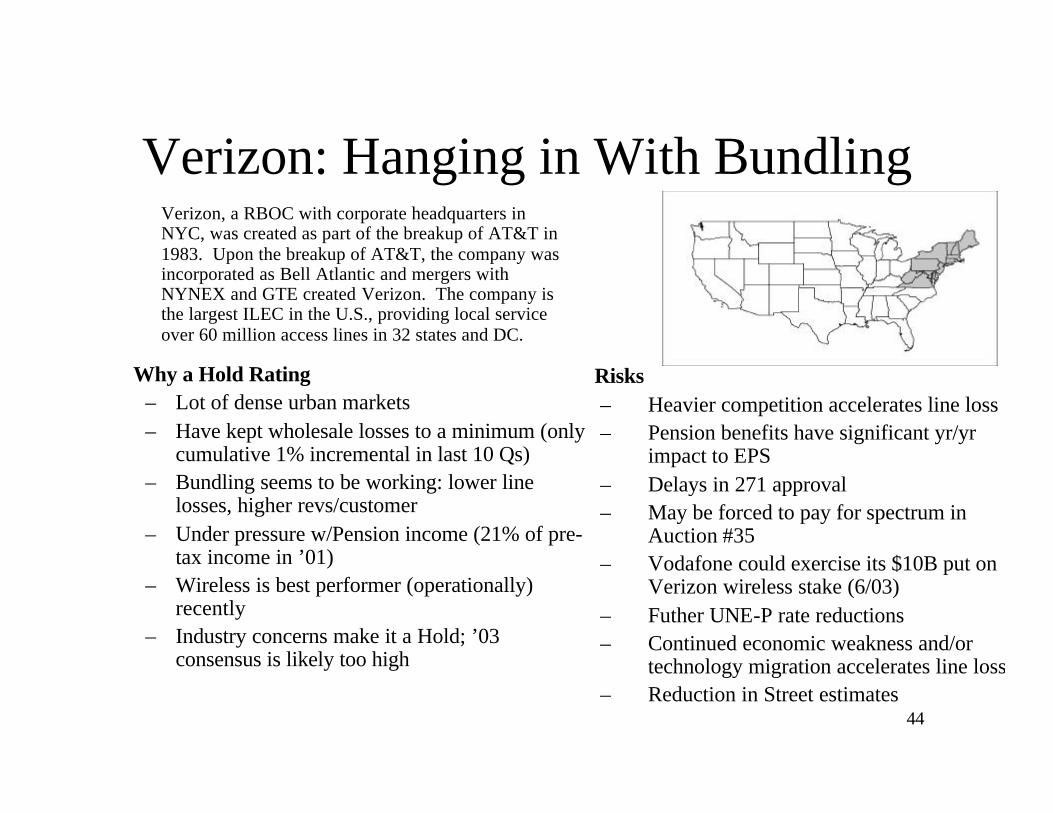
Verizon: Hanging in With Bundling
Why a Hold Rating– Lot of dense urban markets– Have kept wholesale losses to a minimum (only
cumulative 1% incremental in last 10 Qs)– Bundling seems to be working: lower line
losses, higher revs/customer– Under pressure w/Pension income (21% of pre-
tax income in ’01)– Wireless is best performer (operationally)
recently– Industry concerns make it a Hold; ’03
consensus is likely too high
Verizon, a RBOC with corporate headquarters in NYC, was created as part of the breakup of AT&T in 1983. Upon the breakup of AT&T, the company was incorporated as Bell Atlantic and mergers with NYNEX and GTE created Verizon. The company is the largest ILEC in the U.S., providing local service over 60 million access lines in 32 states and DC.
Risks– Heavier competition accelerates line loss– Pension benefits have significant yr/yr
impact to EPS– Delays in 271 approval– May be forced to pay for spectrum in
Auction #35– Vodafone could exercise its $10B put on
Verizon wireless stake (6/03)– Futher UNE-P rate reductions– Continued economic weakness and/or
technology migration accelerates line loss– Reduction in Street estimates

45
Q – Qwest - Hold
$0
$10
$20
$30
$40
$50
$60
$70
27-Sep-200205-Jun-200208-Feb-200215-Oct-200115-Jun-200121-Feb-200125-Oct-200003-Jul-200009-Mar-200012-Nov-1999
Net Debt/Year Revenues EBITDA EPS Consensus Access Lines Wireless Subs Net Debt EBITDA2001 $19,695 $7,353 $0.03 17.787 1.114 $24,746 3.4x2002E $17,291 $5,295 ($0.51) -$0.49 17.045 1.117 $22,211 4.2x2003E $15,793 $5,449 ($0.44) -$0.42 16.666 1.129 $16,736 3.1x
Other Financial Data: 2001Shares Out 1,675 Business services 33.0%Avg. Daily Volume 21.29mm Consumer services 30.8%Market Cap $3.8B Wholesale services 27.7%YTD Performance -84.0% Directory services 8.1%
Network services and other 0.3%
Current Price $2.28Target $2.50% change to target 9.6%2002E Dividend $0.00Yield 0.0%Target + Dividend 9.6%Price as of 9/30/02
Source: Company data, Prudential Securities estimatesTarget price and earnings estimates may not be attained

46
Qwest: Rural RBOC, National LD
Why a Hold:– Significant legal risk from accounting issues with “side-
deals” to competitors– Less wireline competition due to rural nature of lines– Less wireless exposure, but a free cash flow drain– Have no states w/ 271 approval– Opportunity for upside on execution of cost reductions:
• Identified ~$1B in opex and capex cuts• New mgmt team looking to do what’s right for the
company• Opportunity to financially rebalance to benefit of
equity shareholders– National fiber asset
• Drain on yr/yr but could be valuable in future w/ 271 approval
Qwest, an operator of fiber-optic networks, with corporate headquarters in Denver, Colorado, gained RBOC status when it acquired US West. US West was created as part of the breakup ofAT&T in 1983 and provides local service in 14 states in the western and northwestern U.S. and is the fourth-largest ILEC in terms of access lines with 17.4 million.
Risks–Increased wireline competition–UNE rates could be lowered–Approval for Dex sale could be denied/ delayed–Most heavily levered puts financial risk on equity shareholders–Company intends to restate historical financials –the ultimate size & impact is currently unknown
This is a speculative investment; in particular, Qwest has significant financial leverage and a legal overhang; our Hold rating stems less from “fair value” and more from the high degree of risk.

47
ALLTEL: – AT - Hold
$0.00
$10.00
$20.00
$30.00
$40.00
$50.00
$60.00
$70.00
$80.00
$90.00
$100.00
27-S
ep-2
002
27-A
ug-2
002
26-J
ul-2
002
25-J
un-2
002
23-M
ay-2
002
23-A
pr-2
002
21-M
ar-2
002
19-F
eb-2
002
16-J
an-2
002
13-D
ec-2
001
12-N
ov-2
001
11-O
ct-2
001
05-S
ep-2
001
03-A
ug-2
001
03-J
ul-2
001
01-J
un-2
001
01-M
ay-2
001
29-M
ar-2
001
27-F
eb-2
001
25-J
an-2
001
21-D
ec-2
000
20-N
ov-2
000
19-O
ct-2
000
19-S
ep-2
000
17-A
ug-2
000
18-J
ul-2
000
15-J
un-2
000
15-M
ay-2
000
12-A
pr-2
000
13-M
ar-2
000
09-F
eb-2
000
07-J
an-2
000
07-D
ec-1
999
04-N
ov-1
999
05-O
ct-1
999
Net Debt/Year Revenues EBITDA EPS Consensus Access Lines Wireless Subs Net Debt EBITDA2001 $7,506 $2,925 $2.84 2.612 6.683 $3,828 1.3x2002E $7,922 $3,097 $3.16 $3.18 3.214 7.723 $5,506 1.8x2003E $8,478 $3,369 $3.25 $3.43 3.222 7.973 $4,936 1.5x
Other Financial Data: 2001Shares Out 315 Wireless 52%Avg. Daily Volume 1.28mm Wireline 27%Market Cap $13.5B Comm Support Svcs 10%YTD Performance -30.5% Info services 13%
Current Price $40.13Target $42% change to target 4.7%2002E Dividend $1.42Yield 3.5%Target + Dividend 8.2%Price as of 9/30/02
Source: Company data, Prudential Securities estimatesTarget price and earnings estimates may not be attained

48
ALLTEL – Less Wireline Competition; Wireless 50% of Revs
• Risks:– Telecom investors flock to stock w/ less exposure to negatives– Increased wireline competition– Worsening economy– Integration of recent acquisitions goes poorly– Increased competition, particularly in wireless– Street consensus comes down
• Why Hold:– Premium valuation to RBOCs– Less wireline competition– Management has made prescient moves in the past– Large Wireless exposure
• National footprint via VZW network, while only owning properties in the mid-US. Low dependence on roaming revenues
ALLTEL, headquartered in Little Rock, Arkansas, provides wireless, wireline, and information services to a wide selection of customers. The telecommunications group serves a customer base of over 12 million.
What could make us rethink our valuation? Street estimates and guidance lower to reflect the business outlook.

49
DISCLOSURESThe research analyst(s) or a member of the research analyst’s household has a financial interest in _____ and does not have a financial interest in any stocks mentioned in this report .
Prudential Securities has no knowledge of any material conflict of interest involving the companies mentioned in this report and our firm.
Prudential Securities Incorporated makes a market in the shares of _____.
Prudential Securities Incorporated and/or its affiliates have managed or comanaged a public offering of securities in the past 12 months, have received compensation for investment banking services in the past 12 months, or expect to receive or intend to seek compensation for investment banking se rvices in the next 3 months from BLS,VZ.
The research analyst or a member of the team does have an actual material conflict of interest relative to _____ and does not have an actual material conflict of interest relative to any stocks mentioned in this report .
The research analyst has received compensation that is based upon (among other factors) the firm’s investment banking revenues as it relates to _____ and has not received compensation that is based upon (among other factors) the firm’s investment banking revenues as it relates to any stocks mentioned in this report.
The research analyst, a member of the team, or a member of the household serves as an officer, director, or advisory board member of _____ and does not serve as an officer, director, or advisory board member of any stocks mentioned in this report. Prudential Securities Incorporated makes a market in the foreign shares of _____. When we assign a Buy rating, we mean that we believe that a stock of average or below average risk offers the potential for total return of 15% or more over the next 12 to 18 months. For higher risk stocks, we may require a higher potential return to assign a Buy rating. When we reiterate a Buy rating, we are stating our belief that our price target is achievable over the next 12 to 18 months.
When we assign a Sell rating, we mean that we believe that a stock of average or above average risk has the potential to decline 15% or more over the next 12 to 18 months. For lower risk stocks, a lower potential decline may be sufficient to warrant a Sell rating. When we reiterate a Sell rating, we are stating our belief that our price target is achievable over the next 12 to 18 months.
A Hold rating signifies our belief that a stock does not present sufficient upside or downside potential to warrant a Buy or Sell rating, either because we view the stock as fairly valued or because we believe that there is too much uncertainty with regard to key variables for us to rate the stock a Buy or Sell.
Rating distribution
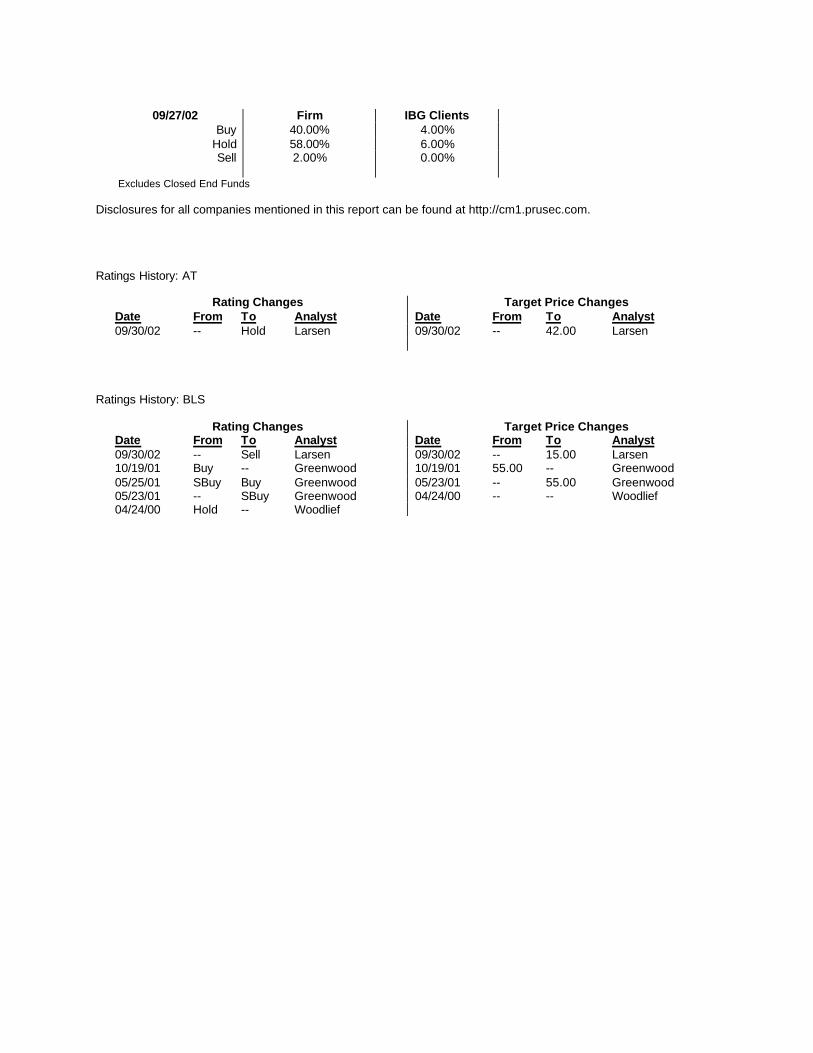
09/27/02 Firm IBG Clients
Buy 40.00% 4.00%
Hold 58.00% 6.00%
Sell 2.00% 0.00%
Excludes Closed End Funds
Disclosures for all companies mentioned in this report can be found at http://cm1.prusec.com.

BellSouth (BLS-$18.36, Sell) is the only Bell that is still operating in its original form. BellSouth operates largely in the Southeast U.S. It has heavy exposure to UNE-Ps, but has received federal approval to provide long-distance in all but two states (Tennessee and Florida). Why a Sell? We believe BellSouth’s significant exposure to UNE-P will cause access lines and revenue to continue to erode; earnings and revenue targets have already been reduced three times this year by management. Qwest (Q-$2.28, Hold) was formed from a merger between RBOC US West and the broadband fiber company Qwest. Due to Qwest’s large percentage of rural access lines, the carrier faces less UNE-P competition. However, Qwest is undergoing significant government scrutiny for potential past misdeeds. Qwest operates locally in fourteen western states and offers long-distance nationwide. Why a Hold? Upside could come from delivering a turn-around, Qwest has less wireline competition due to the rural nature of its access lines, less wireless exposure (although it is a free cash flow drain), and has a national fiber asset. However, Qwest has no states with 271 approval and there is still some legal and financial uncertainty that needs to be resolved; as a result, the high degree of uncertainty precludes us from giving it a Buy rating. SBC Communications (SBC-$20.10, Sell) was formed from RBOC mergers of SBC (southwest U.S.), Ameritech (Midwest U.S.) and PacTel (west coast). SBC has heavy exposure to UNE-P and several of its large states have not received 271 approval yet. Why a Sell? SBC (with BellSouth) has the largest exposure to potential UNE-P losses based on average discounts to retail. Coupled with what we anticipate to be a long process to get 271 approval, SBC should be particularly vulnerable in those states. Verizon Communications (VZ-$27.44, Hold) was formed from the combination of RBOCs Bell Atlantic and NYNEX and ILEC GTE. The majority of Verizon’s markets are located on the east coast, with properties from GTE located throughout the U.S., including California and Florida. Verizon was an early access line loser to wholesale but has steadied those line losses and is selling telecom bundles in order to stabilize revenues. Why a Hold? While its big markets do open up Verizon to competition, we believe the company has stabilized line losses to wholesalers and has been relatively effective in selling bundles. However, industry concerns and cost and revenue risk prevent us from assigning a Buy. DISCLOSURES
The research analyst(s) or a member of the research analyst’s household does not have a financial interest in any of the stocks mentioned in this report . Prudential Securities has no knowledge of any material conflict of interest involving the companies mentioned in this report and our firm. Prudential Securities Incorporated and/or its affiliates have managed or comanaged a public offering of securities in the past 12 months, have received compensation for investment banking services in the past 12 months, or expect to receive or intend to seek compensation for investment banking services in the next 3 months from BLS,VZ. The research analyst or a member of the team does not have an actual material conflict of interest relative to any of the stocks mentioned in this report . The research analyst has not received compensation that is based upon (among other factors) the firm’s investment banking revenues as it relates to any of the stocks mentioned in this report . The research analyst, a member of the team, or a member of the household does not serve as an officer, director, or advisory board member of any of the stocks mentioned in this report . Rating distribution
09/27/02 Firm IBG Clients
Buy 40.00% 4.00% Hold 58.00% 6.00% Sell 2.00% 0.00%
Excludes Closed End Funds
Disclosures for all companies mentioned in this report can be found at http://cm1.prusec.com.
Ratings History: AT
Rating Changes Target Price Changes Date From To Analyst Date From To Analyst 09/30/02 -- Hold Larsen 09/30/02 -- 42.00 Larsen
Ratings History: BLS
Rating Changes Target Price Changes Date From To Analyst Date From To Analyst 09/30/02 -- Sell Larsen 09/30/02 -- 15.00 Larsen 10/19/01 Buy -- Greenwood 10/19/01 55.00 -- Greenwood 05/25/01 SBuy Buy Greenwood 05/23/01 -- 55.00 Greenwood 05/23/01 -- SBuy Greenwood 04/24/00 -- -- Woodlief 04/24/00 Hold -- Woodlief

Price History: BLS
Ratings History: Q
Rating Changes Target Price Changes Date From To Analyst Date From To Analyst 09/30/02 -- Hold Larsen 09/30/02 -- 2.50 Larsen 10/19/01 Buy -- Greenwood 10/19/01 25.00 -- Greenwood 05/25/01 SBuy Buy Greenwood 09/10/01 40.00 25.00 Greenwood 07/06/00 Accu SBuy Greenwood 07/25/01 50.00 40.00 Greenwood 03/30/00 -- Accu Greenwood 04/24/01 73.00 50.00 Greenwood 03/30/00 -- 73.00 Greenwood
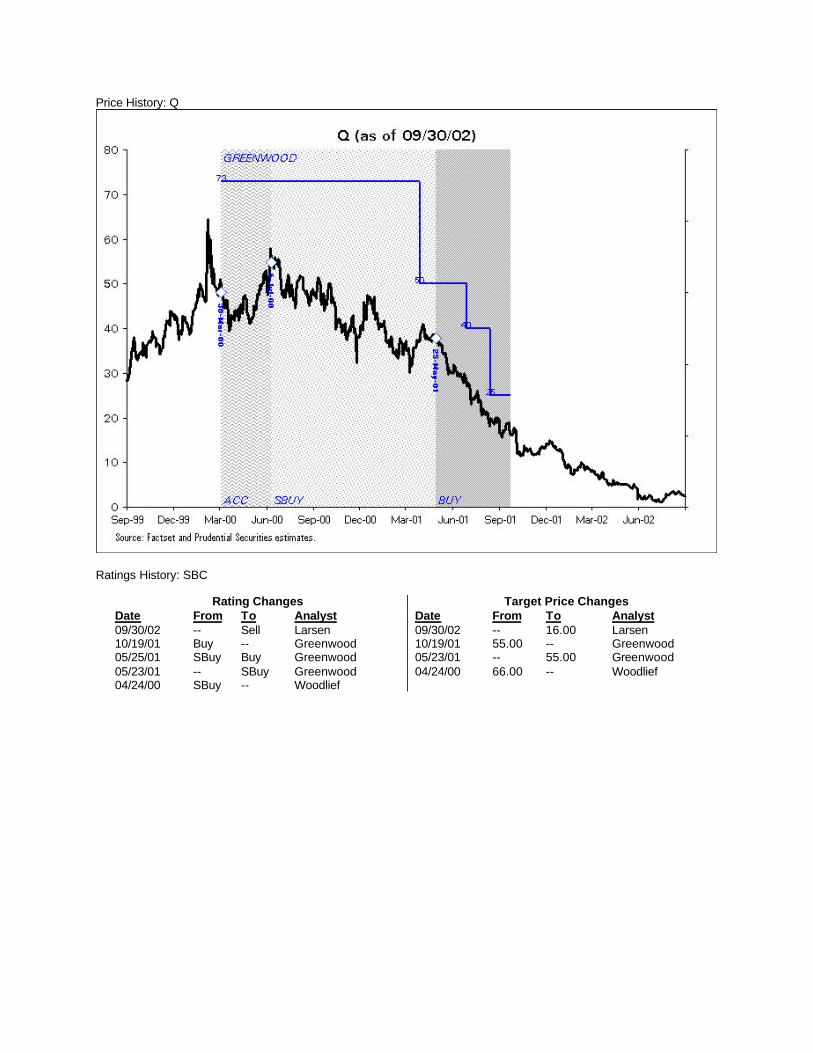
Price History: Q
Ratings History: SBC
Rating Changes Target Price Changes Date From To Analyst Date From To Analyst 09/30/02 -- Sell Larsen 09/30/02 -- 16.00 Larsen 10/19/01 Buy -- Greenwood 10/19/01 55.00 -- Greenwood 05/25/01 SBuy Buy Greenwood 05/23/01 -- 55.00 Greenwood 05/23/01 -- SBuy Greenwood 04/24/00 66.00 -- Woodlief 04/24/00 SBuy -- Woodlief
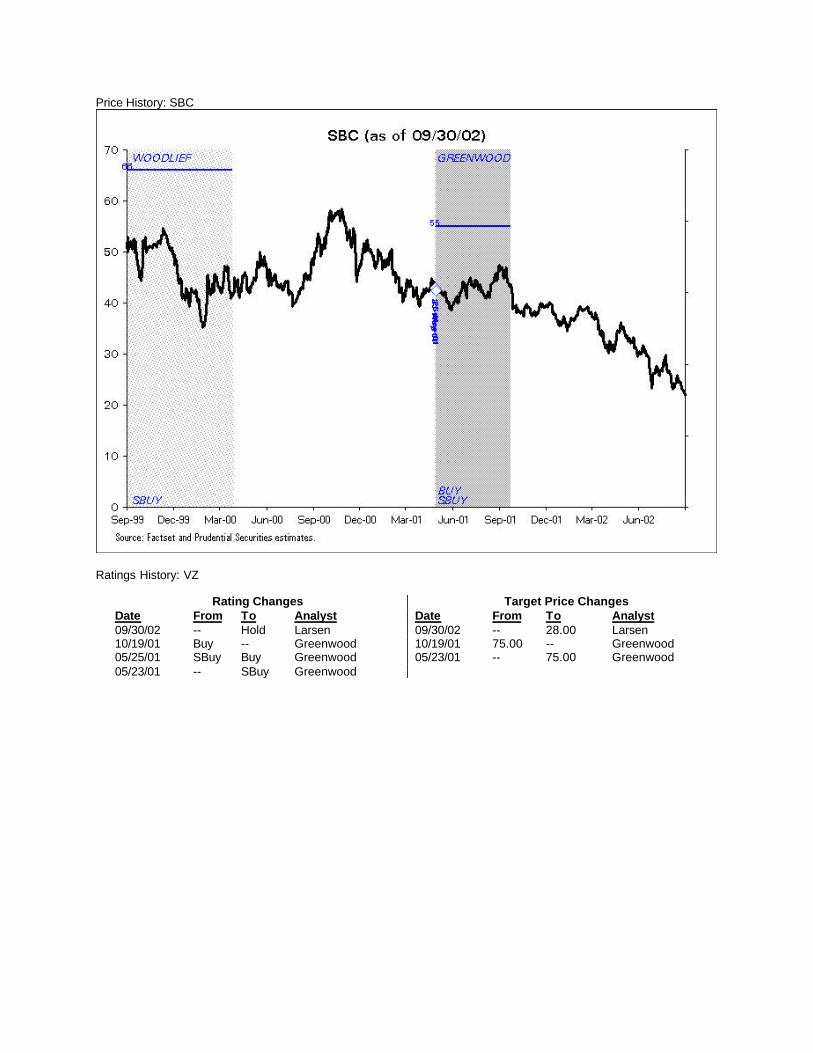
Price History: SBC
Ratings History: VZ
Rating Changes Target Price Changes Date From To Analyst Date From To Analyst 09/30/02 -- Hold Larsen 09/30/02 -- 28.00 Larsen 10/19/01 Buy -- Greenwood 10/19/01 75.00 -- Greenwood 05/25/01 SBuy Buy Greenwood 05/23/01 -- 75.00 Greenwood 05/23/01 -- SBuy Greenwood

Price History: VZ
Any OTC-traded securities or non-U.S. companies mentioned in this report may not be cleared for sale in all states.
Securities products and services are offered through Prudential Securities Incorporated, a Prudential company.
©Prudential Securities Incorporated, 2002, all rights reserved. One Seaport Plaza, New York, NY 10292 Prudential Financial is a service mark of The Prudential Insurance Company of America, Newark, NJ, and its affiliates.
Information contained herein is based on data obtained from recognized statistical services, issuer reports or communications, or other sources, believed to be reliable. However, such information has not been verified by us, and we do not make any representations as to its accuracy or completeness. Any statements nonfactual in nature constitute only current opinions, which are subject to change. Prudential Securities Incorporated (or one of its affiliates or subsidiaries) or their officers, directors, analysts, employees, agents, independent contractors, or consultants may have positions in securities or commodities referred to herein and may, as principal or agent, buy and sell such securities or commodities. An employee, analyst, officer, agent, independent contractor, a director, or a consultant of Prudential Securities Incorporated, its affiliates, or its subsidiaries may serve as a director for companies mentioned in this report. Neither the information nor any opinion expressed shall constitute an offer to sell or a solicitation of an offer to buy any securities or commodities mentioned herein. There may be instances when fundamental, technical, and quantitative opinions may not be in concert. This firm (or one of its affiliates or subsidiaries) may from time to time perform investment banking or other services for, or solicit investment banking or other business from, any company mentioned in this report.
There are risks inherent in international investments, which may make such investments unsuitable for certain clients. These include, for example, economic, political, currency exchange rate fluctuations, and limited availability of information on international securities. Prudential Securities Incorporated, its affiliates, and its subsidiaries make no representation that the companies which issue securities which are the subject of their research reports are in compliance with certain informational reporting requirements imposed by the Securities Exchange Act of 1934. Sales of securities covered by this report may be made only in those jurisdictions where the security is qualified for sale. The contents of this publication have been approved for distribution by Prudential-Bache International Limited, which is regulated by The Securities and Futures Authority Limited. We recommend that you obtain the advice of your Financial Advisor regarding this or other investments.
Additional information on the securities discussed herein is available upon request.

Any OTC-traded securities or non-U.S. companies mentioned in this report may not be cleared for sale in all states.
Securities products and services are offered through Prudential Securities Incorporated, a Prudential company.
©Prudential Securities Incorporated, 2002, all rights reserved. One Seaport Plaza, New York, NY 10292 Prudential Financial is a service mark of The Prudential Insurance Company of America, Newark, NJ, and its affiliates.
Information contained herein is based on data obtained from re cognized statistical services, issuer reports or communications, or other sources, believed to be reliable. However, such information has not been verified by us, and we do not make any representations as to its accuracy or completeness. Any statements nonfactual in nature constitute only current opinions, which are subject to change. Prudential Securities Incorporated (or one of its affiliates or subsidiaries) or their officers, directors, analysts, employees, agents, independent contractors, or consultants may have positions in securities or commodities referred to herein and may, as principal or agent, buy and sell such securities or commodities. An employee, analyst, officer, agent, independent contractor, a director, or a consultant of Prudential Securi ties Incorporated, its affiliates, or its subsidiaries may serve as a director for companies mentioned in this report. Neither the information nor any opinion expressed shall constitute an offer to sell or a solicitation of an offer to buy any securities or commodities mentioned herein. There may be instances when fundamental, technical, and quantitative opinions may not be in concert. This firm (or one of its affiliates or subsidiaries) may from time to time perform investment banking or other services for, or solicit investment banking or other business from, any company mentioned in this report.
There are risks inherent in international investments, which may make such investments unsuitable for certain clients. These include, for example, economic, political, currency exchange rate fluctuations, and limited availability of information on international securities. Prudential Securities Incorporated, its affiliates, and its subsidiaries make no representation that the companies which issue securities which are the subject of their research reports are in compliance with certain informational reporting requirements imposed by the Securities Exchange Act of 1934. Sales of securities covered by this report may be made only in those jurisdictions where the security is qualified for sale. The contents of this publication have been approved for distribution by Prudential -Bache International Limited, which is regulated by The Securities and Futures Authority Limited. We recommend that you obtain the advice of your Financial Advisor regarding this or other investments.
Additional information on the securities discussed herein is available upon request.


