EPA-454/R-97-003 LOCATING AND ESTIMATING AIR EMISSIONS FROM SOURCES OF DIOXINS AND FURANS Office of Air Quality Planning And Standards Office of Air And Radiation U.S. Environmental Protection Agency Research Triangle Park, North Carolina 27711 May 1997
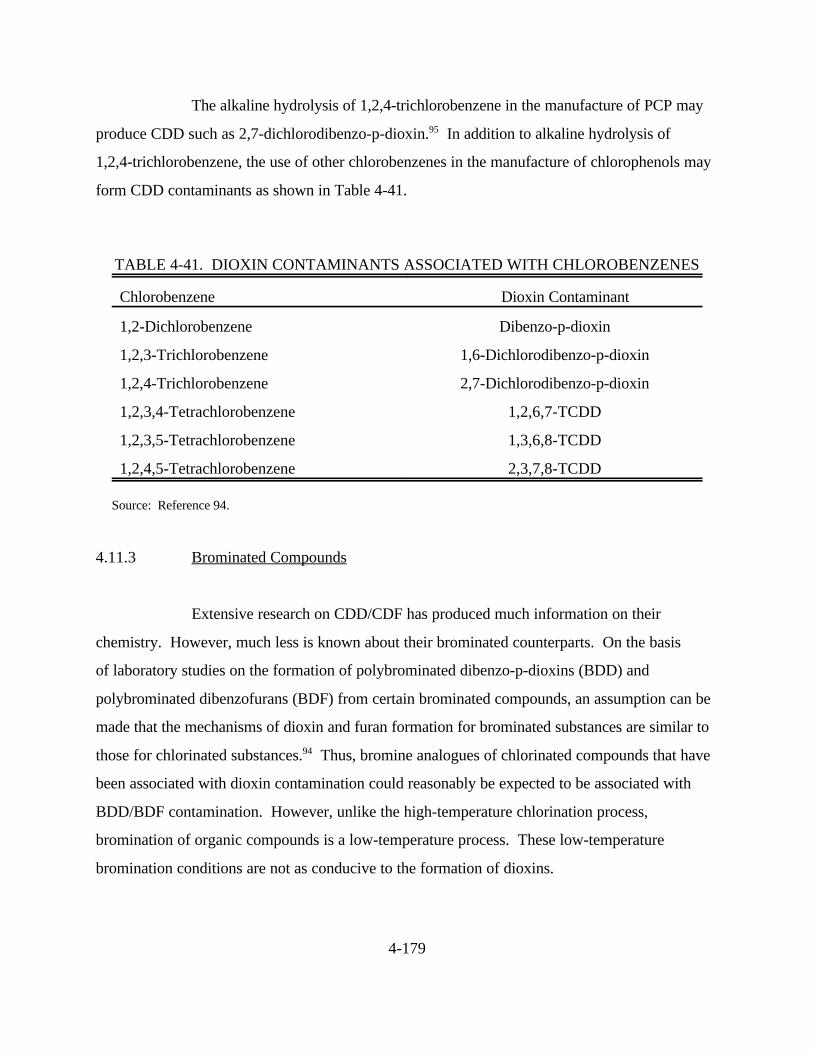
Transcript
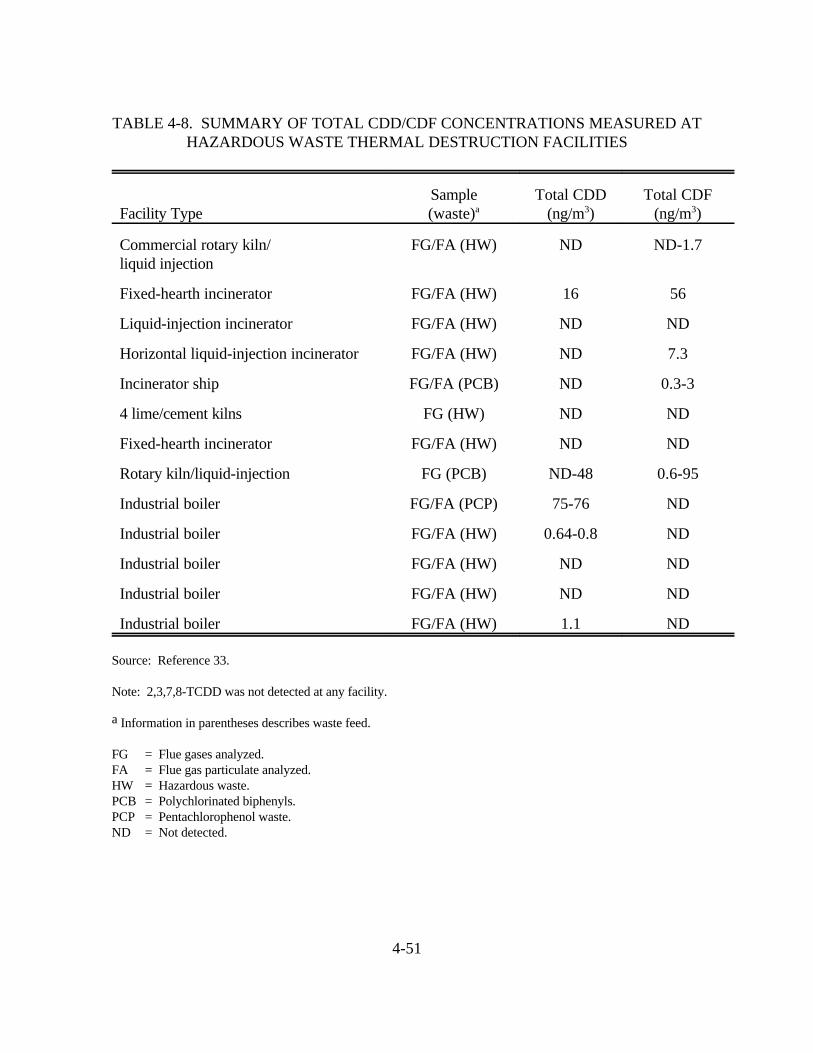
EPA-454/R-97-003
LOCATING AND ESTIMATING AIR EMISSIONS
FROM SOURCES OFDIOXINS AND FURANS
Office of Air Quality Planning And StandardsOffice of Air And Radiation
U.S. Environmental Protection AgencyResearch Triangle Park, North Carolina 27711
May 1997
ii
Disclaimer
This report has been reviewed by the Office Of Air Quality Planning And Standards, U.S.Environmental Protection Agency, and has been approved for publication. Any mention of tradenames or commercial products is not intended to constitute endorsement or recommendation foruse.
EPA-454/R-97-003
Caprolactam was delisted from the list of HAPs (Federal Register Volume 61, page 30816,a
June 18, 1996).
iii
EXECUTIVE SUMMARY
The 1990 Clean Air Act Amendments contain a list of 189 hazardous air pollutants
(HAPs) which the U.S. Environmental Protection Agency (EPA) must study, identify sources of,
and determine if regulations are warranted. Two of these HAPs, chlorinated dibenzo-p-dioxinsa
(CDD) and chlorinated dibenzofurans (CDF), are the subject of this document. This document
describes the properties of dioxins and furans as air pollutants, defines their origin, identifies
source categories of air emissions, and provides dioxin and furan emissions data in terms of
emission factors and national emissions estimates. This document is a part of an ongoing EPA
series designed to assist the general public at large, but primarily to assist State/local air
regulatory agencies in identifying sources of HAPs and determining emission estimates.
A dioxin is any compound that contains the dibenzo-p-dioxin nucleus, and a furan
is any compound that contains the dibenzofuran nucleus. The term isomers refers to compounds
with the same empirical formulas. The term homologues refers to compounds within the same
series (e.g., CDD or CDF), but with a different number of chlorine atoms (tetra-CDD,
penta-CDF, etc.). The 2,3,7,8-TCDD and 2,3,7,8-TCDF compounds represent the most toxic
compounds of their respective families. The nationwide emissions estimate of dioxins and furans
presented in this document are based on the two 2,3,7,8 compounds and, to the extent
practicable, the base year 1990. In a limited number of cases where more recent data were
available (e.g., on-road mobile sources), a different base year was used (1991 or 1992) for
estimating nationwide emissions.
CDD and CDF have no known technical use and are not intentionally produced.
They are formed as unwanted byproducts of certain chemical processes during the manufacture of
chlorinated intermediates and in the combustion of chlorinated materials. Dioxins and furans are
emitted into the atmosphere from a wide variety of processes such as waste incineration,
iv
combustion of solid and liquid fuels in stationary sources for heat and power generation,
crematories, iron and steel foundries/scrap metal melting, combustion-aided metal recovery, kraft
pulp and paper production/black liquor combustion, internal combustion engines, carbon
regeneration, forest fires, organic chemical manufacture and use, and Portland cement
manufacture.
The toxicity equivalency factor (TEF) method is an interim procedure for assessing
the risks associated with exposures to complex mixtures of CDD/CDF. This method relates the
toxicity of the 210 structurally related pollutants (135 CDF and 75 CDD), and the toxicity of the
most highly studied dibenzo-p-dioxin, 2,3,7,8-TCDD. The TEF method is used as a reference in
relating the toxicity of the other 209 compounds (i.e., in terms of equivalent amounts of
2,3,7,8-TCDD). This approach simplifies risk assessments, including assessments of exposure to
mixtures of CDD and CDF such as incinerator flyash, hazardous wastes, contaminated soils, and
biological media. In 1989, as a result of the active involvement of EPA in an international effort
aimed at adopting a common set of TEFs, a set of TEFs were agreed upon and implemented and
were called International TEFs/89 (I-TEFs/89). Toxicity estimates, expressed in terms of toxic
equivalents (TEQs), or equivalent amounts of 2,3,7,8-TCDD, are generated by using the TEF to
convert the concentration of a given CDD/CDF into an equivalent concentration of
2,3,7,8-TCDD. The I-TEQs/89 are obtained by applying the I-TEFs/89 to the congener-specific
data and summing the results. Some emission factors and the national emission totals in this
document are presented as TEQs.
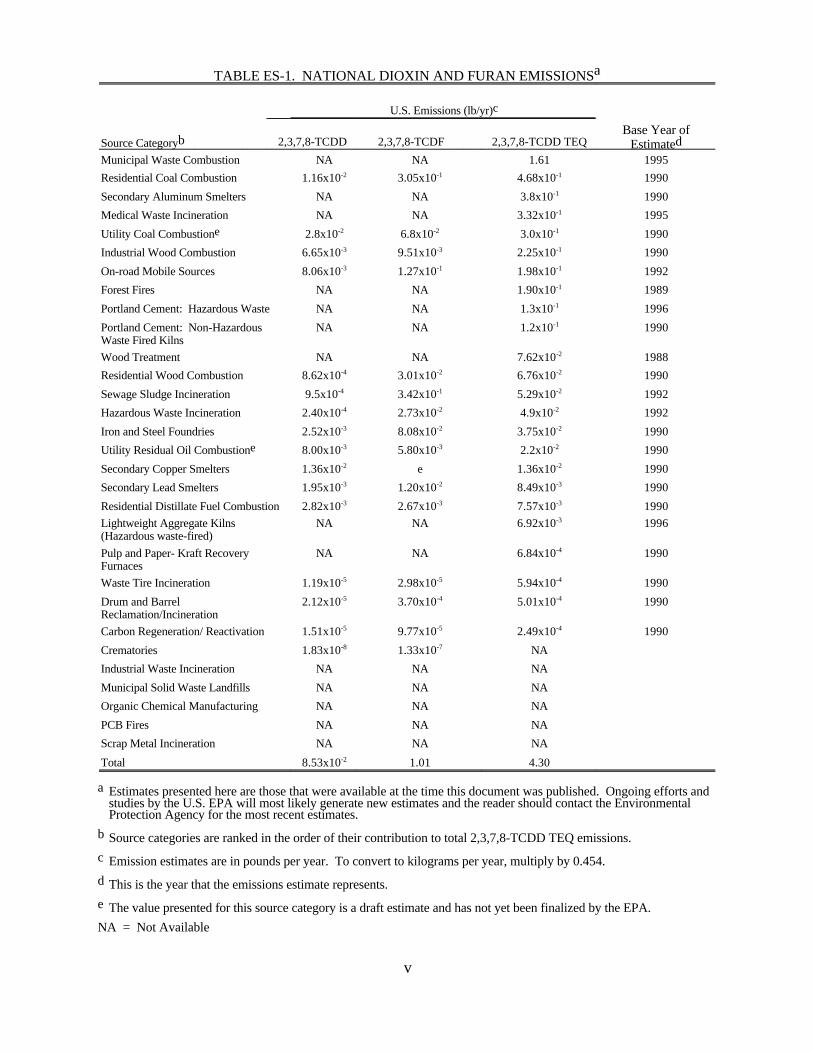
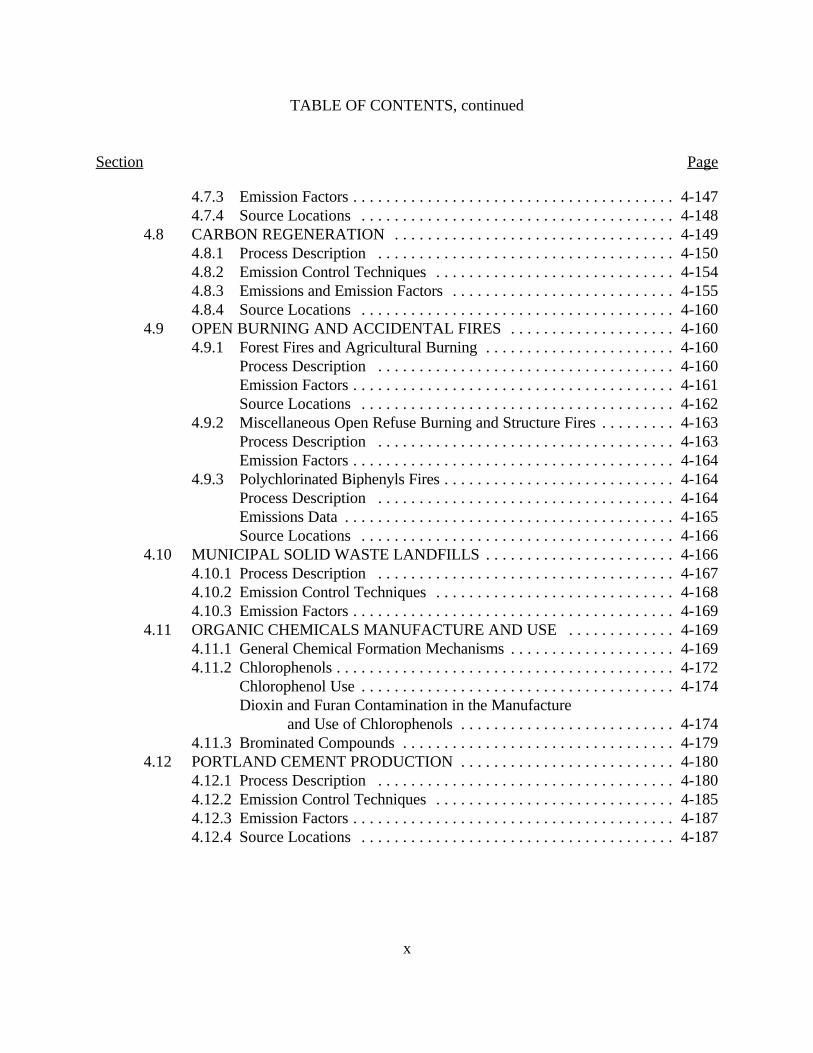
Table ES-1 presents national emissions estimates of 2,3,7,8,-TCDD,
2,3,7,8-TCDF, and 2,3,7,8-TCDD toxic equivalent (TEQs). As shown in the table, national
emissions for 2,3,7,8-TCDD, 2,3,7,8-TCDF, and 2,3,7,8-TCDD TEQ are estimated to be
0.085 pounds, 1.01 pounds, and 4.30 pounds, respectively.
v
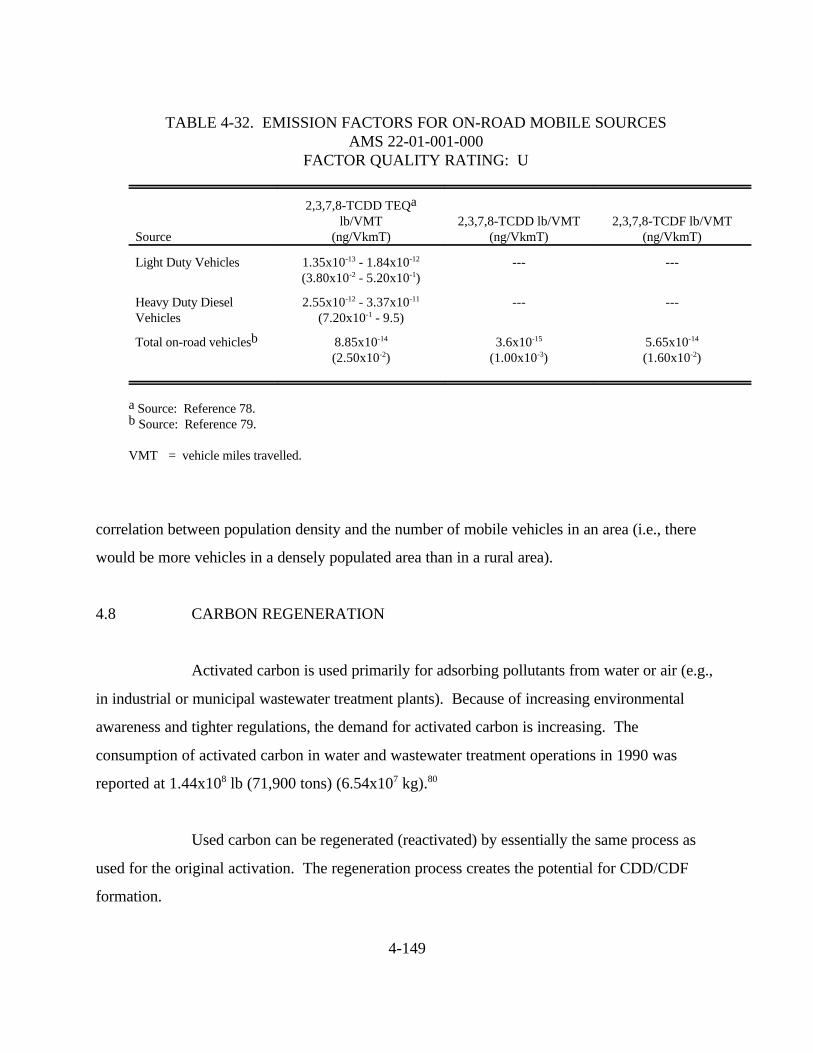
TABLE ES-1. NATIONAL DIOXIN AND FURAN EMISSIONSa
U.S. Emissions (lb/yr)c
Source Categoryb 2,3,7,8-TCDD 2,3,7,8-TCDF 2,3,7,8-TCDD TEQBase Year of
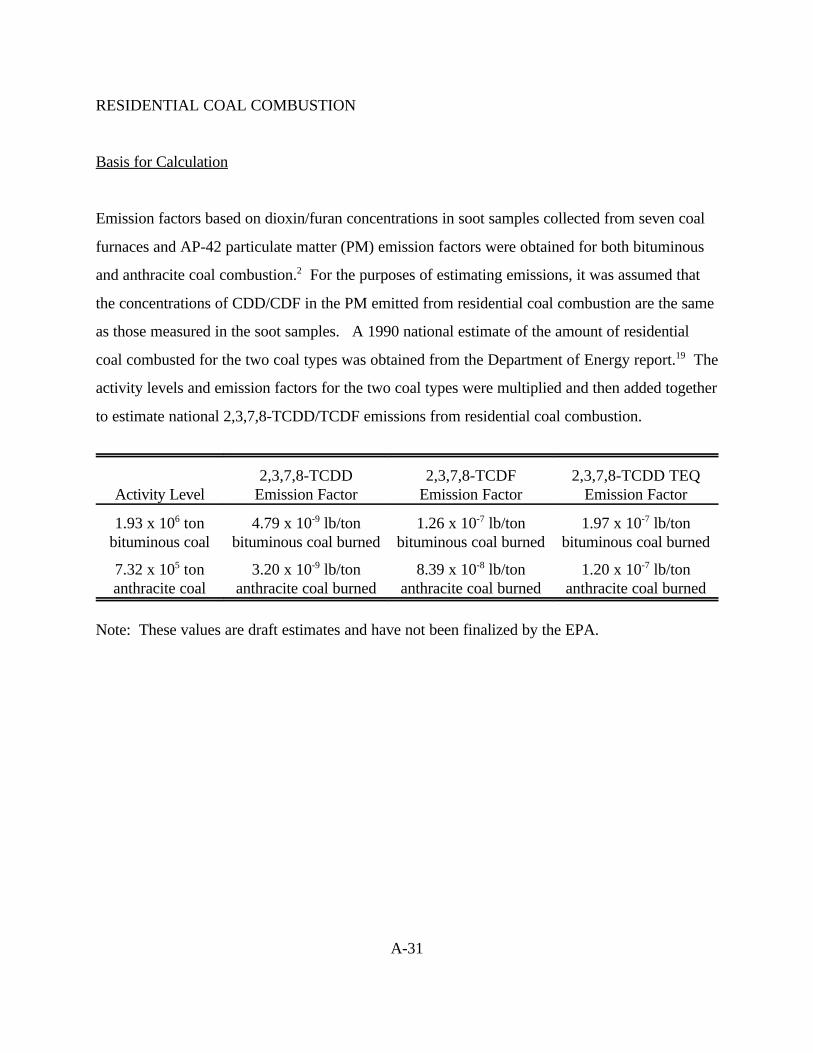
EstimatedMunicipal Waste Combustion NA NA 1.61 1995Residential Coal Combustion 1.16x10 3.05x10 4.68x10 1990-2 -1 -1
Estimates presented here are those that were available at the time this document was published. Ongoing efforts andastudies by the U.S. EPA will most likely generate new estimates and the reader should contact the EnvironmentalProtection Agency for the most recent estimates.
b Source categories are ranked in the order of their contribution to total 2,3,7,8-TCDD TEQ emissions.c Emission estimates are in pounds per year. To convert to kilograms per year, multiply by 0.454.d This is the year that the emissions estimate represents.e The value presented for this source category is a draft estimate and has not yet been finalized by the EPA.NA = Not Available
vi
Some of the estimates for the non-fuel combustion sources were obtained from
reports submitted under the Superfund Amendment and Reauthorization Act (SARA), Title III,
Section 313. Other estimates were either calculated from national activity data and the best
available emission factor, or taken from other existing EPA inventories such as those prepared
under a Maximum Achievable Control Technology (MACT) standard development program (e.g.,
the national emissions estimate for municipal waste combustors).
In addition to dioxin and furan source and emissions information, several sampling
and analytical methods are provided that have been employed for determining CDD and CDF
This document deals specifically with chlorinated dibenzo-p-dioxins (CDD) and
chlorinated dibenzofurans (CDF). Its intended audience includes federal, state and local air
pollution personnel and others who are interested in locating potential emitters of dioxins and/or
furans and in making gross emissions estimates.
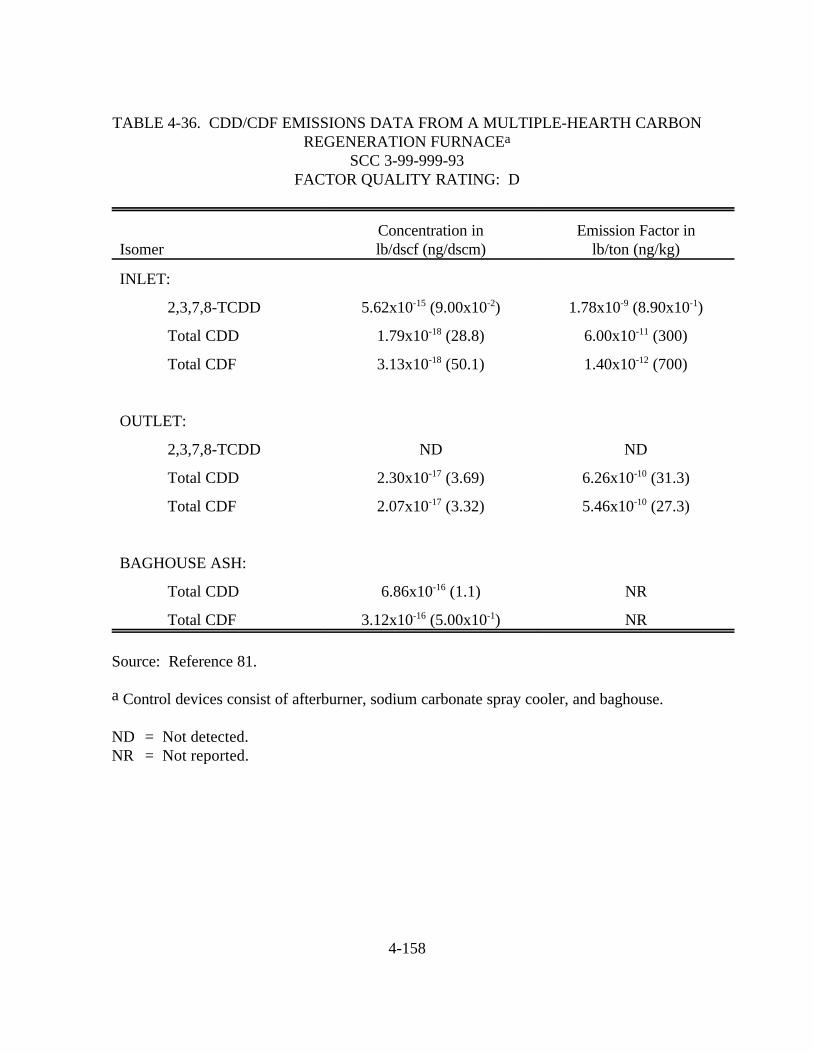
The available data on some potential sources of CDD/CDF emissions are limited
and the configurations of many sources will not be the same as those described here. Therefore,
this document is best used as a primer to inform air pollution personnel about: (1) the types of
sources that may emit CDD/CDF, (2) process variations that may be expected within these
sources, and (3) available emissions information that indicates the potential for CDD/CDF to be
released into the air from each operation.
The reader is strongly cautioned against using the emissions information contained
in this document to try to develop an exact assessment of emissions from any particular facility.
Available data are insufficient to develop statistical estimates of the accuracy of these emission
factors, so no estimate can be made of the error that could result when these factors are used to
calculate emissions from any given facility. It is possible, in some cases, that order-of-magnitude
differences could result between actual and calculated emissions, depending on differences in
source configurations, control equipment, and operating practices. Thus, in situations where an
accurate assessment of CDD/CDF emissions is necessary, source-specific information should be
obtained to confirm the existence of particular emitting operations, the types and effectiveness of
control measures, and the impact of operating practices. A source test should be considered as
the best means to determine air emissions directly from a facility or operation.
An effort was made during the development of this report to compare information
and data with recently published reports, collectively referred to as the Dioxin Reassessment
Reports by the Office of Health and Environmental Assessment ([OHEA]; this office is now
named the National Center for Environmental Assessment), U.S. Environmental Protection
Agency, Washington, DC. The data presented in this document were, for the most part,
1-4
developed from the same information sources and are consistent between the two reports as well
as with the most recent version of EPA's Compilation of Air Pollutant Emission Factors
(AP-42).1
As standard procedure, L&E documents are sent to government, industry, and
environmental groups wherever EPA is aware of expertise. These groups are given the
opportunity to review a document, comment, and provide additional data where applicable.
Although this document has undergone extensive review, there may still be shortcomings.
Comments subsequent to publication are welcome and will be addressed in future revisions and in
related products based on available time and resources. In addition, any comments on the
contents or usefulness of this document are welcome, as is any information on process
descriptions, operating practices, control measures, and emissions information that would enable
EPA to update and improve the document's contents. All comments should be sent to:
Dallas SafrietEmission Factor and Inventory Group (MD-14)Office of Air Quality Planning and StandardsU. S. Environmental Protection AgencyResearch Triangle Park, North Carolina 27711
2-1
SECTION 2.0
OVERVIEW OF DOCUMENT CONTENTS
As noted in Section 1.0, the purpose of this document is to assist federal, state,
and local air pollution agencies and others who are interested in locating potential air emitters of
CDD/CDF and making preliminary estimates of air emissions therefrom. Because of the limited
background data available, the information summarized in this document does not and should not
be assumed to represent the source configuration or emissions associated with any particular
facility.
This section provides an overview of the contents of this document. It briefly
outlines the nature, extent, and format of the material presented in the remaining sections.
Section 3.0 of this document provides a brief summary of the physical and
chemical characteristics of CDD/CDF, their basic formation mechanisms, a brief discussion of
toxic equivalency (TEQ) concepts and methodology, and a summary of national CDD/CDF
emissions expressed as TEQs.
Section 4.0 focuses on major sources of CDD/CDF air emissions. The following
groups of emission sources are presented: waste incineration; combustion of solid and liquid fuels
in stationary sources for heat and power generation; crematories; iron and steel foundries;
combustion-aided metal recovery; kraft pulp and paper production - black liquor combustion;
internal combustion engines; carbon regeneration; open burning and accidental fires; municipal
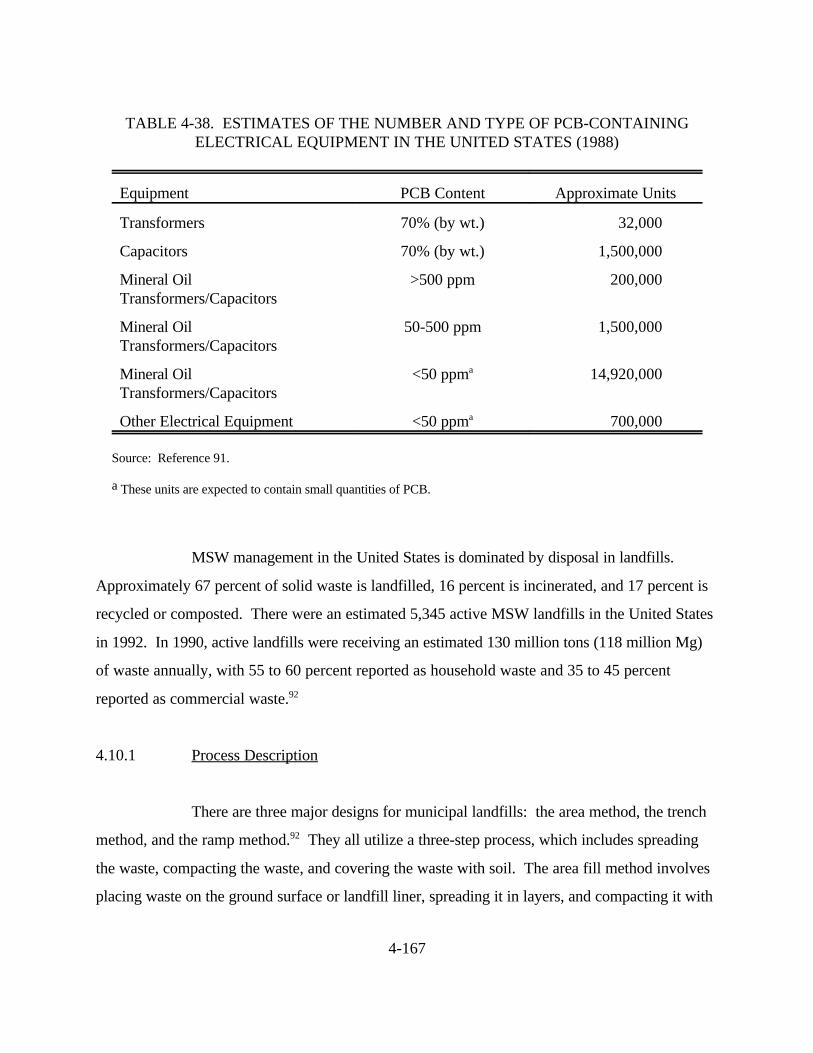
solid waste landfills; organic chemicals manufacture and use; and Portland cement production.
2-2
Within each group, there may be several unique but related sources. For each air emission source
described in Section 4.0, a discussion of the process, potential emission control techniques,
available emission factor information, and source location information are summarized. Because
of limited information, emission factors could not be developed for all the air emission sources
presented. Further, those emission factors presented vary in their representativeness of the air
emission source they describe. Each section should be read carefully to ensure an understanding
of the basis for the emission factors presented.
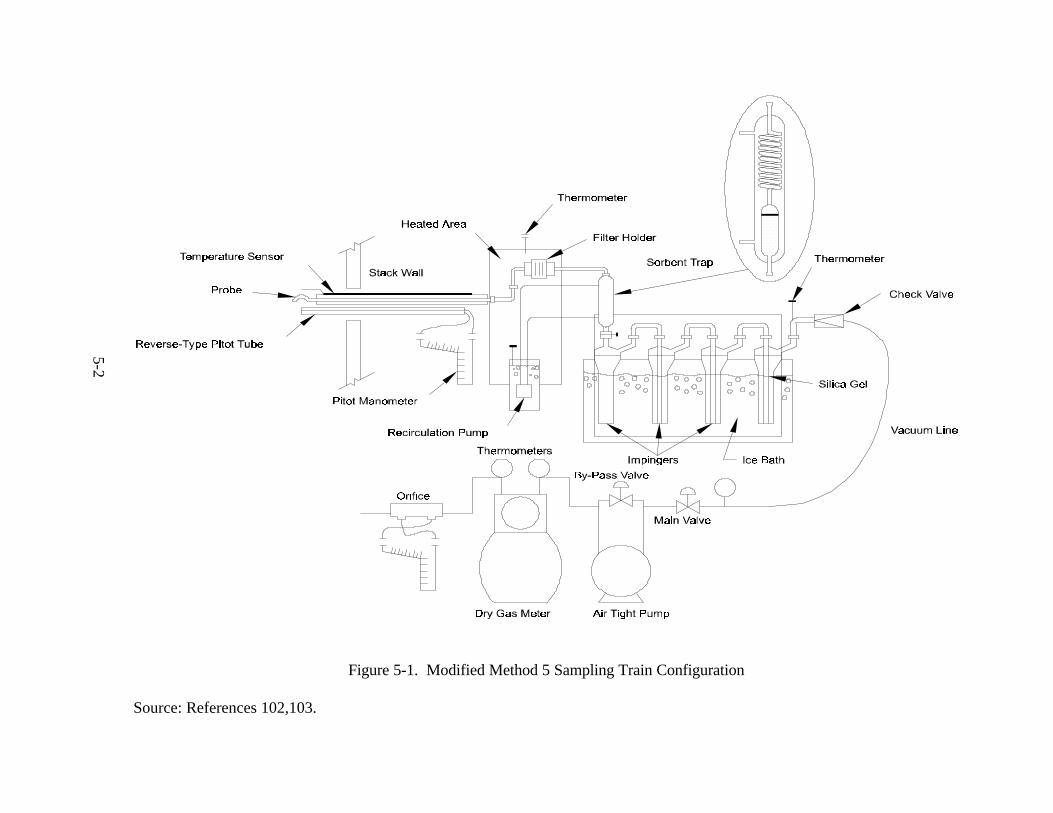
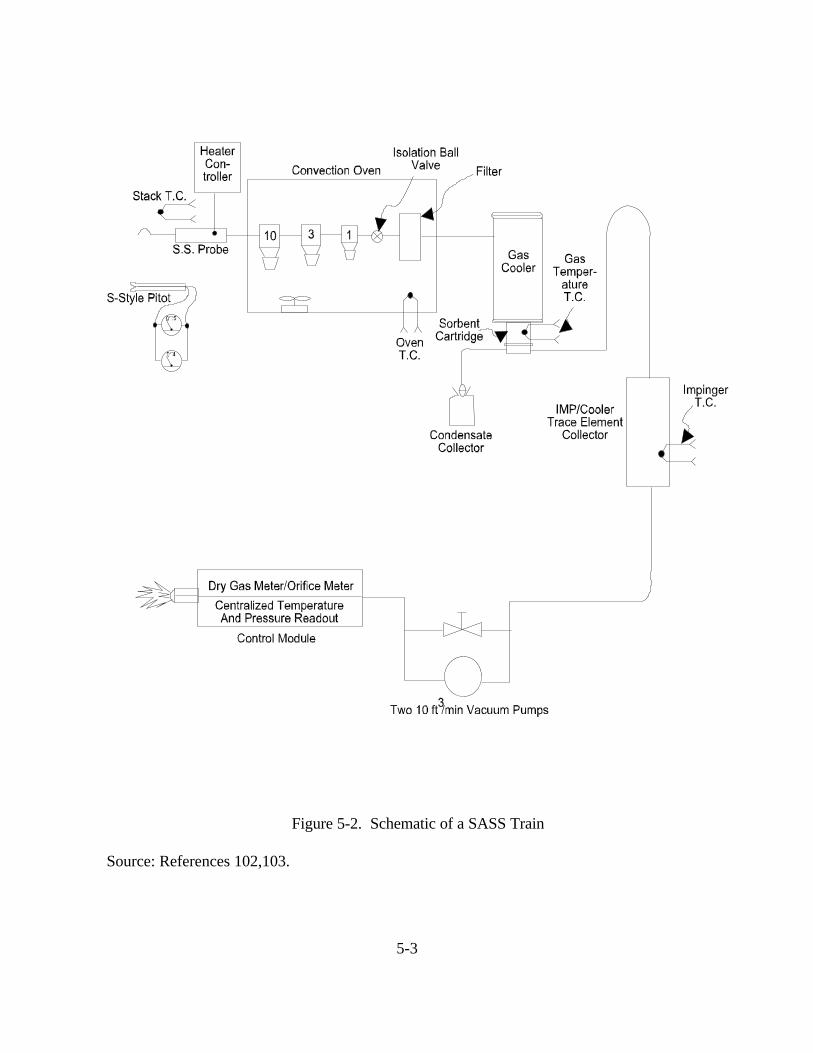
Section 5.0 summarizes available procedures for source sampling and analysis of
CDD/CDF. EPA does not prescribe nor endorse any non-EPA sampling or analytical procedure
presented in Section 5.0. Consequently, this document merely provides an overview of applicable
source sampling procedures, citing references for those interested in conducting source tests.
References are listed in Section 6.0.
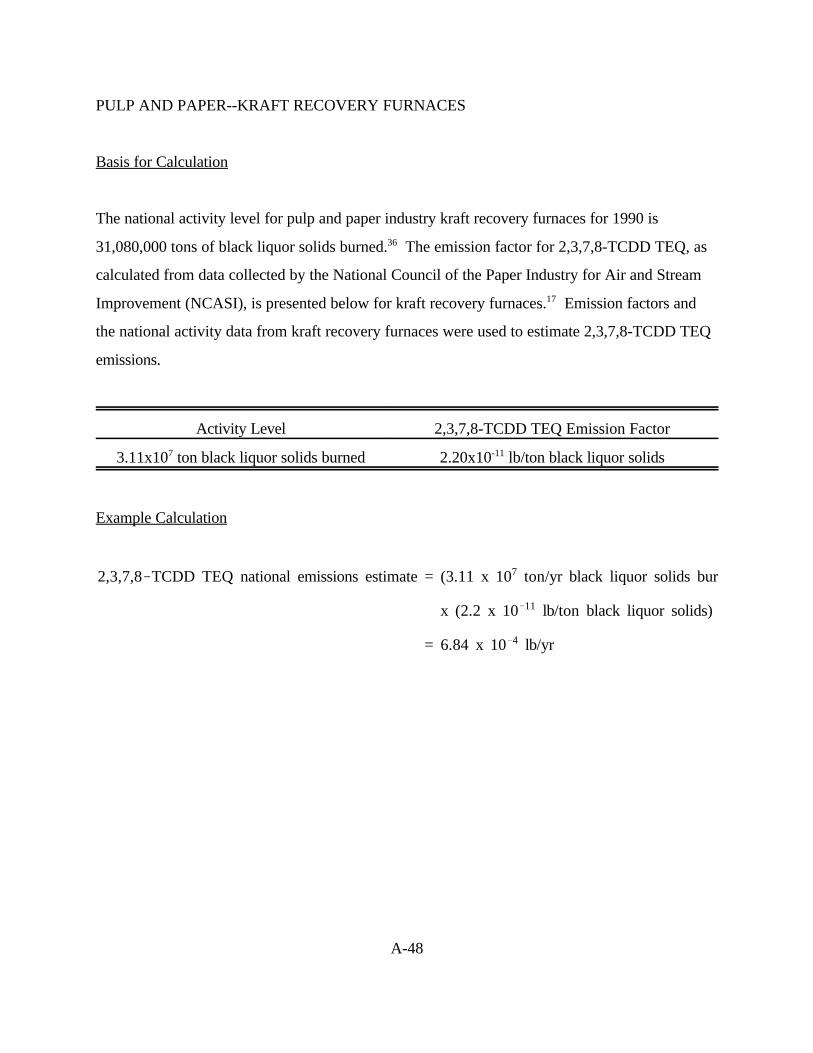
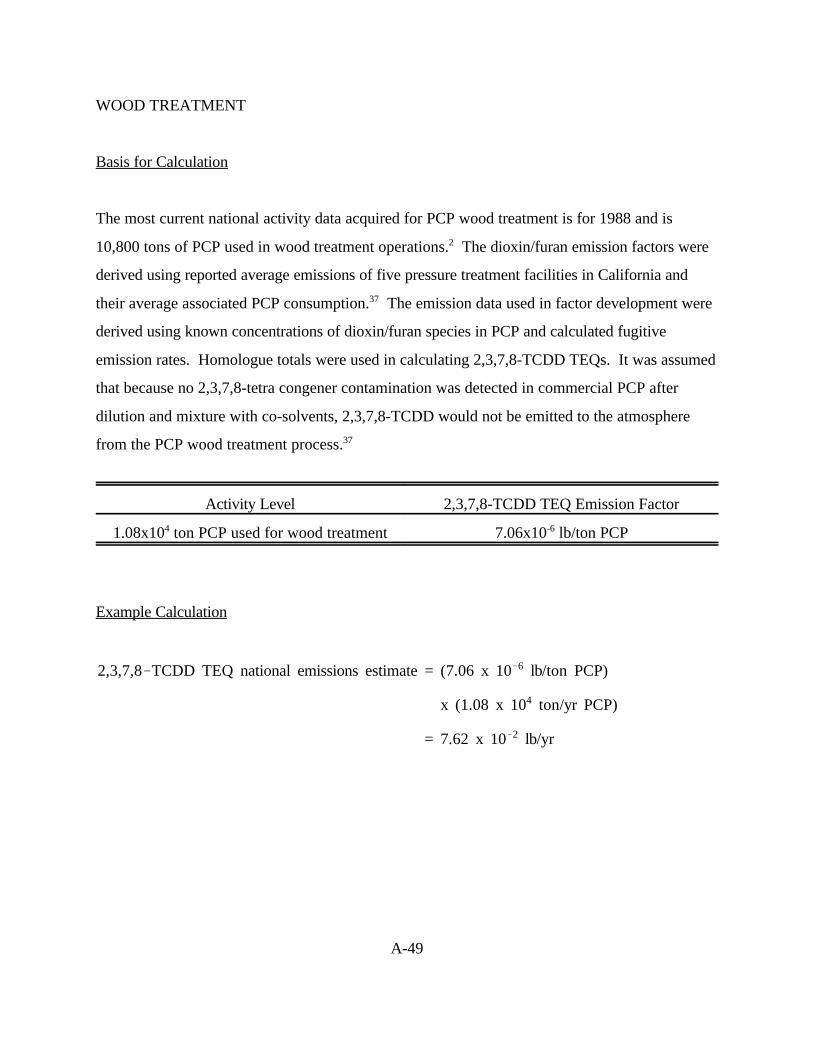
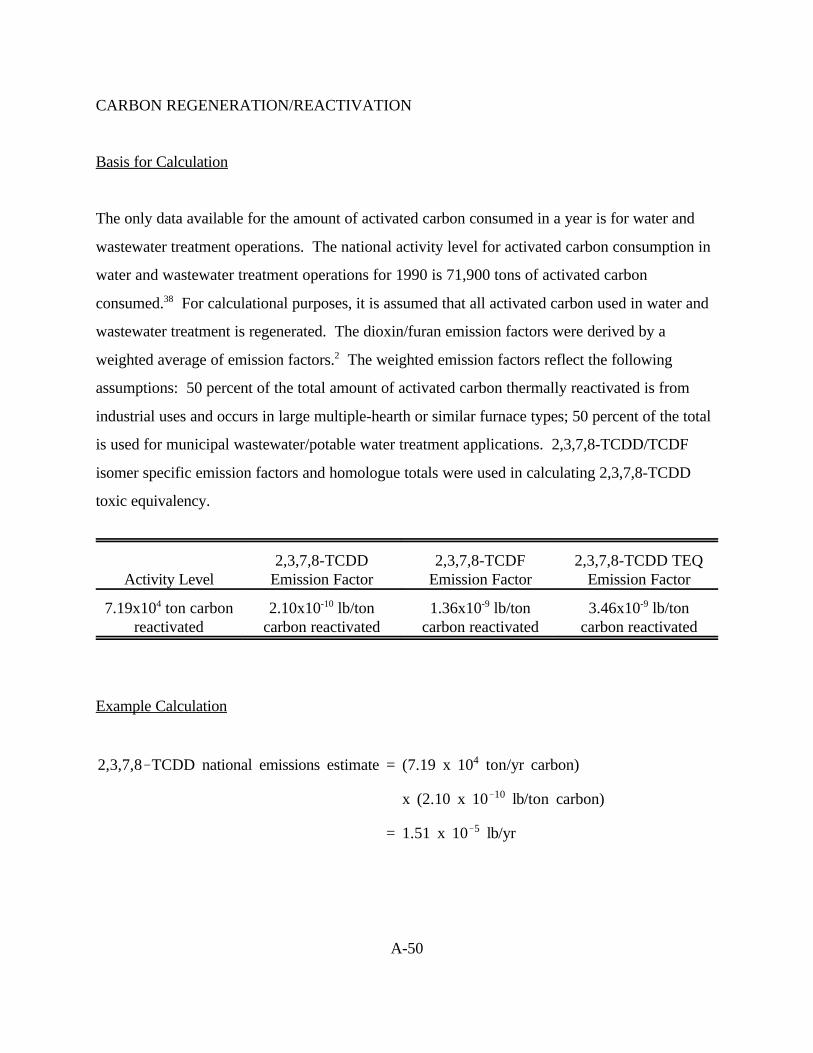
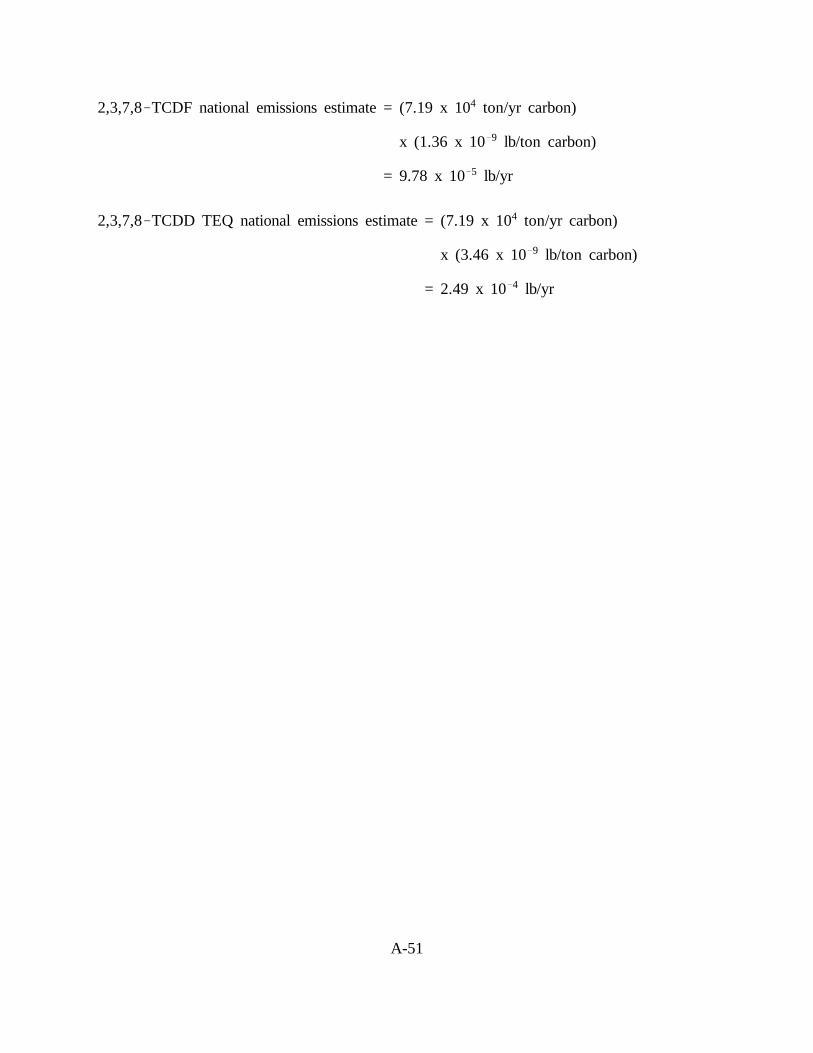
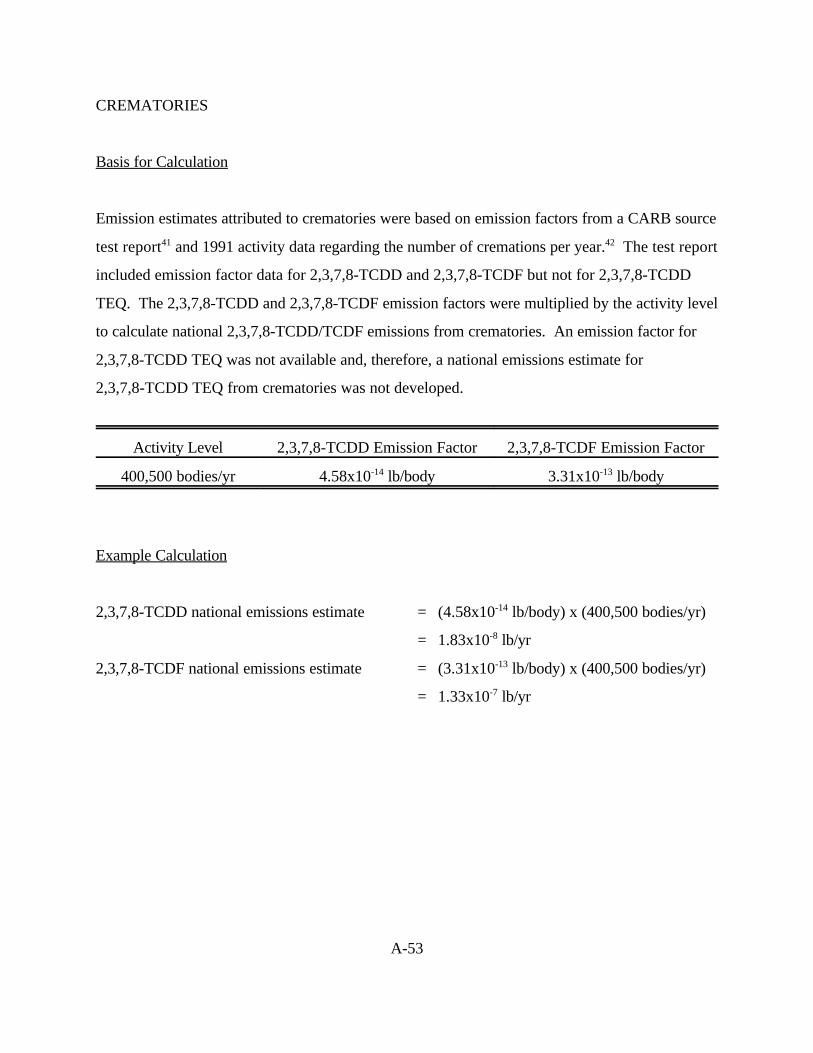
Appendix A provides a brief description of the basis for the national emission
estimates appearing in Section 3.0. For each source, the emission estimation technique is
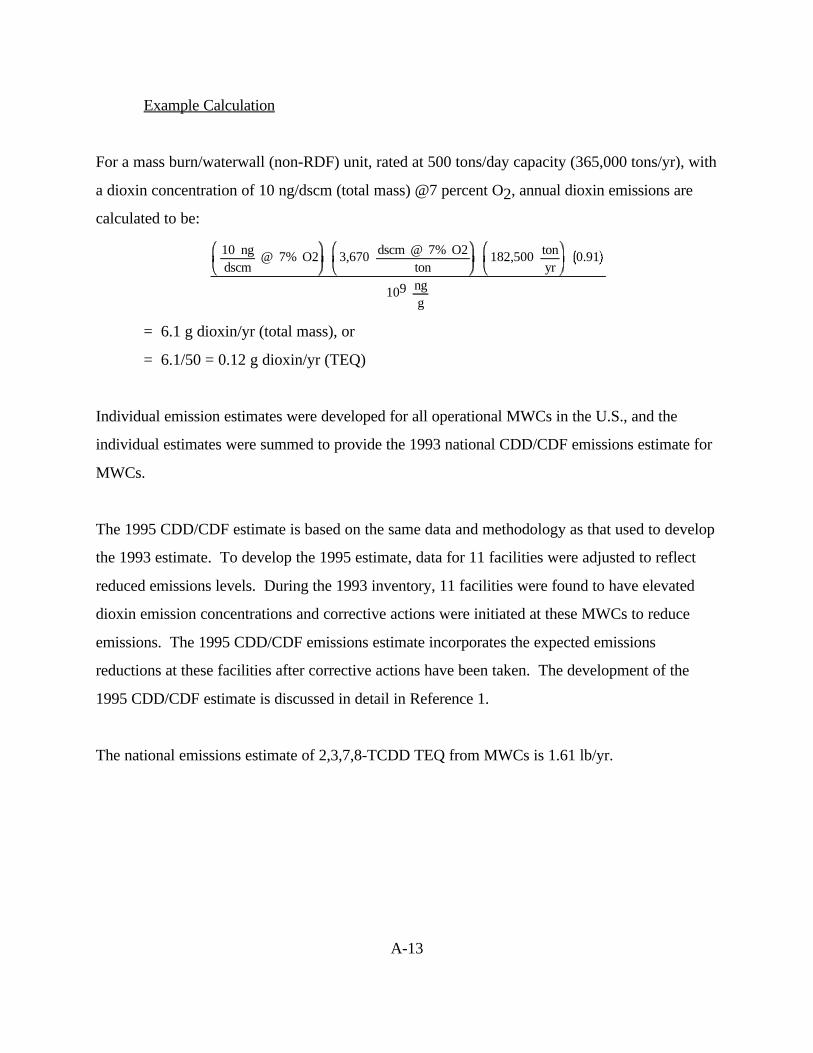
described and an example calculation, if applicable, is included.
Each emission factor listed in Section 4.0 was assigned an emission factor quality
rating (A, B, C, D, E, or U) based on the criteria for assigning data quality ratings and emission
factor ratings as required in the document Technical Procedures for Developing AP-42 Emission
Factors and Preparing AP-42 Sections. The criteria for assigning the quality ratings to source2
test data are as follows:
A - Rated. Test(s) was performed by a sound methodology and reported inenough detail for adequate validation. These tests are not necessarily EPAreference test methods, although such reference methods are certainly to be usedas a guide.
B - Rated. Test(s) was performed by a generally sound methodology but lackedenough detail for adequate validation.
2-3
C - Rated. Test(s) was based on a nonvalidated or draft methodology or lacked asignificant amount of background data.
D - Rated. Test(s) was based on a generally unacceptable method but may providean order-of-magnitude value for the source.
Once the (data) quality ratings for the source tests had been assigned, these ratings
along with the number of source tests available for a given emission point were evaluated.
Because of the almost impossible task of assigning a meaningful confidence limit to industry-
specific variables (e.g., sample size versus sample population, industry and facility variability,
method of measurement), the use of a statistical confidence interval for establishing a
representative emission factor for each source category was not practical. Therefore, some
subjective quality rating was necessary. The following rating system was used to describe the
quality of emission factors in this document.
A - Excellent. The emission factor was developed only from A-rated test datataken from many randomly chosen facilities in the industry population. The sourcecategory is specific enough to minimize variability within the source categorypopulation.
B - Above average. The emission factor was developed only from A-rated testdata from a reasonable number of facilities. Although no specific bias is evident, itis not clear if the facilities tested represent a random sample of the industry. Aswith the A rating, the source category is specific enough to minimize variabilitywithin the source category population.
C - Average. The emission factor was developed only from A- and B-rated testdata from a reasonable number of facilities. Although no specific bias is evident, itis not clear if the facilities tested represent a random sample of the industry. Aswith the A rating, the source category is specific enough to minimize variabilitywithin the source category population.
D - Below average. The emission factor was developed only from A- and B-ratedtest data from a small number of facilities, and there may be reason to suspect thatthese facilities do not represent a random sample of the industry. There also maybe evidence of variability within the source category population.
2-4
E - Poor. The emission factor was developed from C- and D-rated test data, andthere may be reason to suspect that the facilities tested do not represent a randomsample of the industry. There also may be evidence of variability within the sourcecategory population.
U - Unrated or Unratable. The emission factor was developed from suspect datawith no supporting documentation to accurately apply an A through E rating. A"U" rating may be applied in the following circumstances:3
U1 = Mass Balance (for example, estimating air emissions basedon raw material input, product recovery efficiency, andpercent control).
U2 = Source test deficiencies (such as inadequate qualityassurance/quality control, questionable source test methods,only one source test).
This document does not contain any discussion of health or other environmental
effects of CDD/CDF emissions, nor does it include any discussion of ambient air levels of
CDD/CDF.
3-1
SECTION 3.0
BACKGROUND
This section discusses the nature of dioxins and furans, their formation
mechanisms, and toxic equivalency concepts and methodology. A summary of national emissions
levels, expressed as TEQs, is also included in this section.
3.1 NATURE OF POLLUTANT
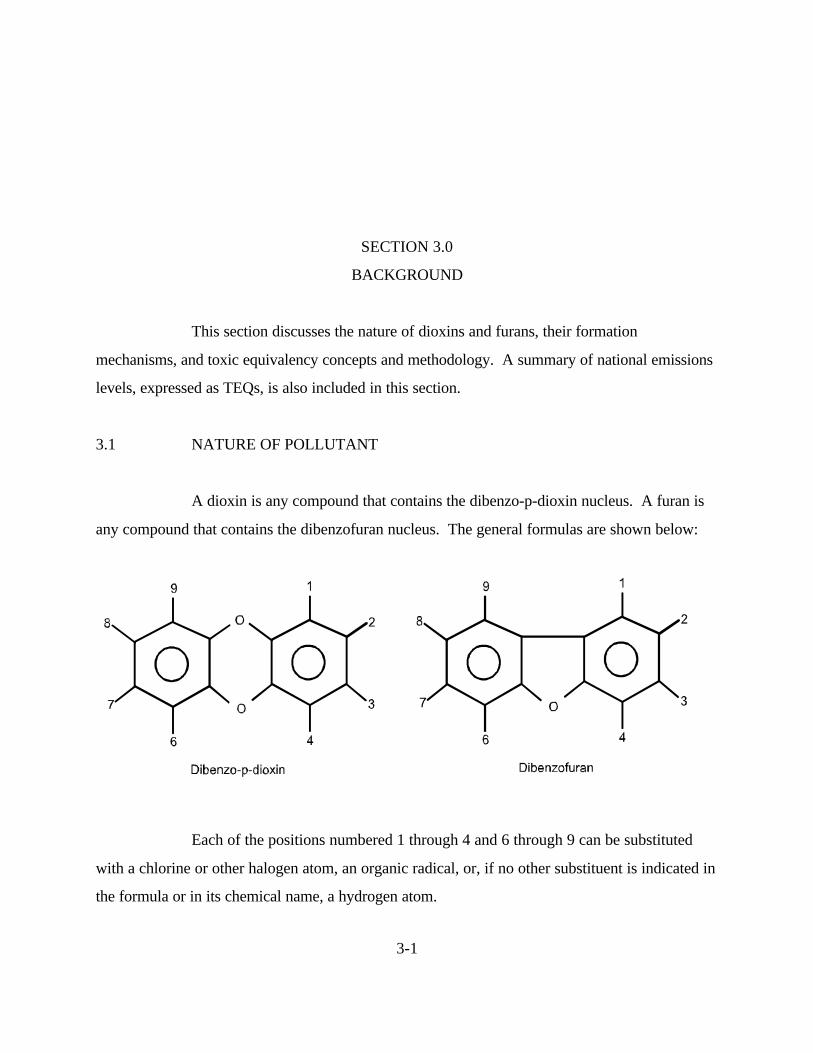
A dioxin is any compound that contains the dibenzo-p-dioxin nucleus. A furan is
any compound that contains the dibenzofuran nucleus. The general formulas are shown below:
Each of the positions numbered 1 through 4 and 6 through 9 can be substituted
with a chlorine or other halogen atom, an organic radical, or, if no other substituent is indicated in
the formula or in its chemical name, a hydrogen atom.
3-2
The only differences between members within a dioxin or a furan family are in the
nature and position of substituents. Most environmental interest is with the chlorinated species of
dioxins and furans which have very similar chemical properties.4
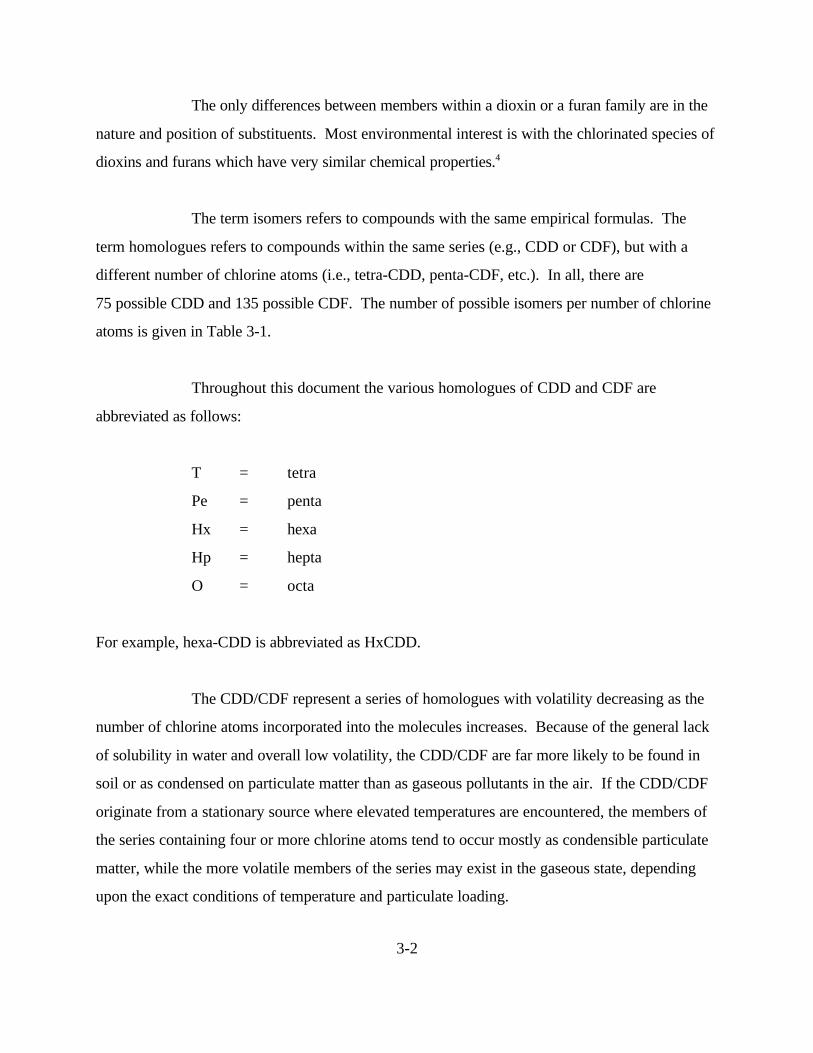
The term isomers refers to compounds with the same empirical formulas. The
term homologues refers to compounds within the same series (e.g., CDD or CDF), but with a
different number of chlorine atoms (i.e., tetra-CDD, penta-CDF, etc.). In all, there are
75 possible CDD and 135 possible CDF. The number of possible isomers per number of chlorine
atoms is given in Table 3-1.
Throughout this document the various homologues of CDD and CDF are
abbreviated as follows:
T = tetra
Pe = penta
Hx = hexa
Hp = hepta
O = octa
For example, hexa-CDD is abbreviated as HxCDD.
The CDD/CDF represent a series of homologues with volatility decreasing as the
number of chlorine atoms incorporated into the molecules increases. Because of the general lack
of solubility in water and overall low volatility, the CDD/CDF are far more likely to be found in
soil or as condensed on particulate matter than as gaseous pollutants in the air. If the CDD/CDF
originate from a stationary source where elevated temperatures are encountered, the members of
the series containing four or more chlorine atoms tend to occur mostly as condensible particulate
matter, while the more volatile members of the series may exist in the gaseous state, depending
upon the exact conditions of temperature and particulate loading.
3-3
Number of Chlorine AtomsNumber of Possible CDD
IsomersNumber of Possible CDF
Isomers
1 2 4
2 10 16
3 14 28
4 22 38
5 14 28
6 10 16
7 2 4
8 1 1
75 135
Source: Reference 4.
TABLE 3-1. POSSIBLE CDD AND CDF ISOMERS
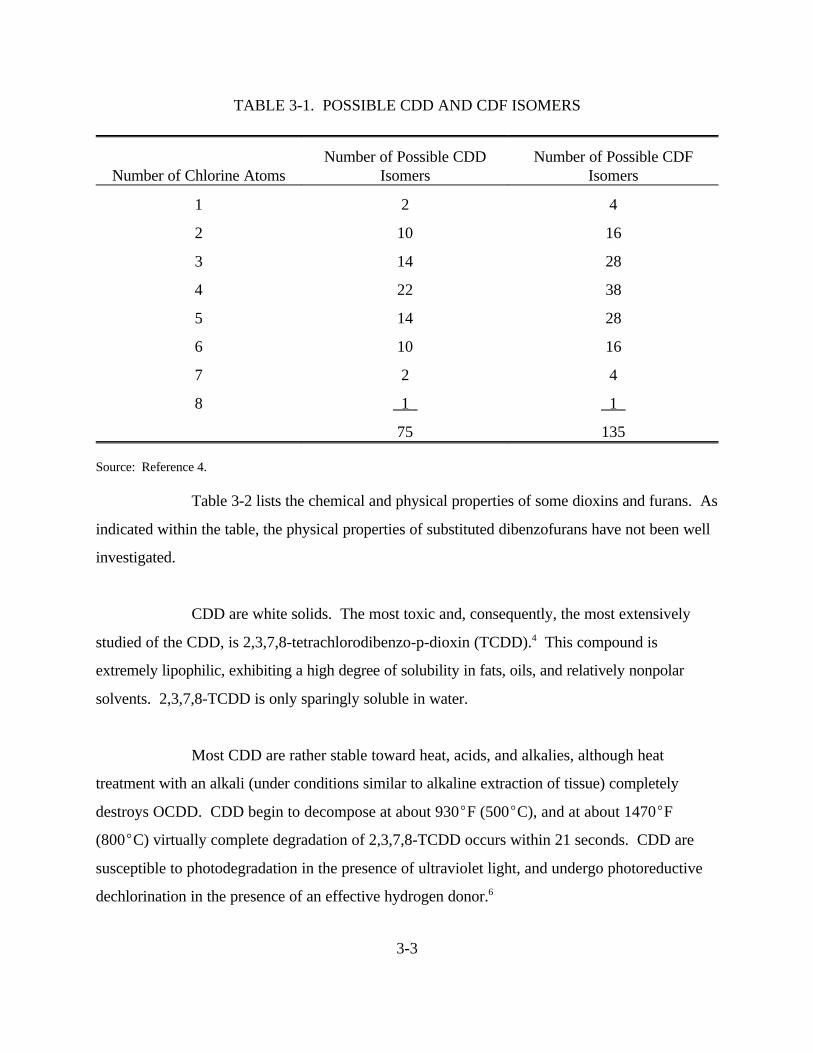
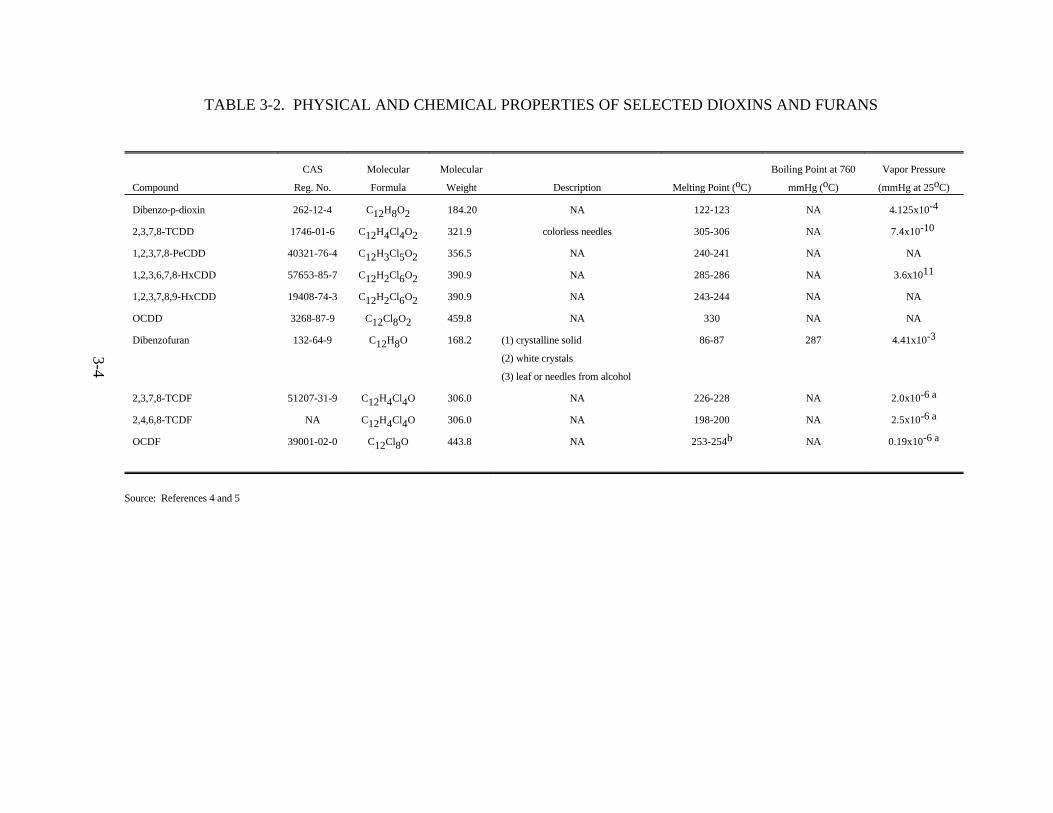
Table 3-2 lists the chemical and physical properties of some dioxins and furans. As
indicated within the table, the physical properties of substituted dibenzofurans have not been well
investigated.
CDD are white solids. The most toxic and, consequently, the most extensively
studied of the CDD, is 2,3,7,8-tetrachlorodibenzo-p-dioxin (TCDD). This compound is4
extremely lipophilic, exhibiting a high degree of solubility in fats, oils, and relatively nonpolar
solvents. 2,3,7,8-TCDD is only sparingly soluble in water.
Most CDD are rather stable toward heat, acids, and alkalies, although heat
treatment with an alkali (under conditions similar to alkaline extraction of tissue) completely
destroys OCDD. CDD begin to decompose at about 930 F (500 C), and at about 1470 F
(800 C) virtually complete degradation of 2,3,7,8-TCDD occurs within 21 seconds. CDD are
susceptible to photodegradation in the presence of ultraviolet light, and undergo photoreductive
dechlorination in the presence of an effective hydrogen donor.6
3-4
TABLE 3-2. PHYSICAL AND CHEMICAL PROPERTIES OF SELECTED DIOXINS AND FURANS
Compound Reg. No. Formula Weight Description Melting Point ( C) mmHg ( C) (mmHg at 25 C)
CAS Molecular Molecular Boiling Point at 760 Vapor Pressureo o o
Dibenzo-p-dioxin 262-12-4 C H O 184.20 NA 122-123 NA 4.125x10¹² 8 2-4
2,3,7,8-TCDD 1746-01-6 C H Cl O 321.9 colorless needles 305-306 NA 7.4x10 12 4 4 2-10
1,2,3,7,8-PeCDD 40321-76-4 C H Cl O 356.5 NA 240-241 NA NA12 3 5 2
1,2,3,6,7,8-HxCDD 57653-85-7 C H Cl O 390.9 NA 285-286 NA 3.6x10¹² 2 6 211
1,2,3,7,8,9-HxCDD 19408-74-3 C H Cl O 390.9 NA 243-244 NA NA12 2 6 2
OCDD 3268-87-9 C Cl O 459.8 NA 330 NA NA12 8 2
Dibenzofuran 132-64-9 C H O 168.2 (1) crystalline solid 86-87 287 4.41x10¹² 8(2) white crystals
(3) leaf or needles from alcohol
-3
2,3,7,8-TCDF 51207-31-9 C H Cl O 306.0 NA 226-228 NA 2.0x10¹² 4 4-6 a
2,4,6,8-TCDF NA C H Cl O 306.0 NA 198-200 NA 2.5x10¹² 4 4-6 a
OCDF 39001-02-0 C Cl O 443.8 NA 253-254 NA 0.19x10¹² 8b -6 a
Source: References 4 and 5
3-5
TABLE 3-2. PHYSICAL AND CHEMICAL PROPERTIES OF SELECTED DIOXINS AND FURANS (CONTINUED)
Compound Density Density (g/mL) (nm)Vapor (chloroform)
maxc
1/Ec Solubilities Other Chemical/Physical Properties
Dibenzo-p-dioxin NA NA 293 199.8 1 ppm at 25 C NAo
2,3,7,8-TCDD NA NA 310 173.6 1.4 g/L in 0-dichlorobenzene TCDD can be formed by pyrolysis0.72 g/L in chlorobenzene at 500 C for 5 hr of sodium alpha-0.57 g/L in benzene (2,4,5-trichlorophenoxy) proprionate0.37 g/L in chloroform0.11 g/L in acetone0.048 g/L in n-Octanol0.01 g/L in methanol
water2x10-7g/L in
o
1,2,3,7,8-PeCDD NA NA 308 171.4 NA NA
1,2,3,6,7,8-HxCDD NA NA 316 152 NA NA
1,2,3,7,8,9-HxCDD NA NA 317 104 NA NA
OCDD NA NA NA NA 1.83 g/L in o-dichlorobenzene NA0.56 g/L in chloroform0.38 g/L in dioxane
Dibenzofuran 5.8 1.0886 (at 99 C) 217 (alcohol) 4.5 (log E) 10 ppm in H O (25 C) NAo2
oSoluble in hot benzene, alcohol,acetone, ether, acetic acid
2,3,7,8-TCDF NA NA 257,294,310,323 NA 4.38 g/L(H O) 2,3,7,8-TCDF (in trichloromethane soln.)2e
exhibits ultraviolet absorption maxs at 309 and 316 nm
2,4,6,8-TCDF NA NA 259,309,316 NA NA NA
OCDF NA NA NA NA NA NA
Source: References 4 and 5
Calculated value.a
b Experimental value.
c This is the wavelength of maximum absorption.
d -1 m-1 ne-tenth of theThis is the absorption coefficient for a 1% chloroform solution of substrate in l cm cell at the max. To convert this to the molar absorption coefficient (M c ), multiply by o molecular weight.
e Estimated value.
NA = Not Available
3-6
Dibenzofuran is relatively stable toward alkalies and acids. The pyrolysis of this
compound for 1.4 seconds in nitrogen at 0.6 atmosphere and 1536 F (830 C) caused only
4.5 percent decomposition, and no decomposition is observed below 1536 F (830 C). The5
products of decomposition are toluene, styrene, indene, durene, naphthalene, water, hydrogen,
carbon, o-ethylphenol and polyphenyl ether. Alkyl- or halogen-substituted dibenzofurans are
expected to be less soluble in water and more soluble in organic solvents than dibenzofuran
because these compounds are less polar than dibenzofuran.
3.2 FORMATION OF CHLORINATED DIBENZO-p-DIOXINS ANDCHLORINATED DIBENZOFURANS
CDD and CDF have no known technical use and are not intentionally produced.
They are formed as unwanted byproducts of certain chemical processes during the manufacture of
chlorinated intermediates and in the combustion of chlorinated materials. The chlorinated7
precursors include polychlorinated biphenyls (PCB), polychlorinated phenols, and polyvinyl
chloride (PVC).
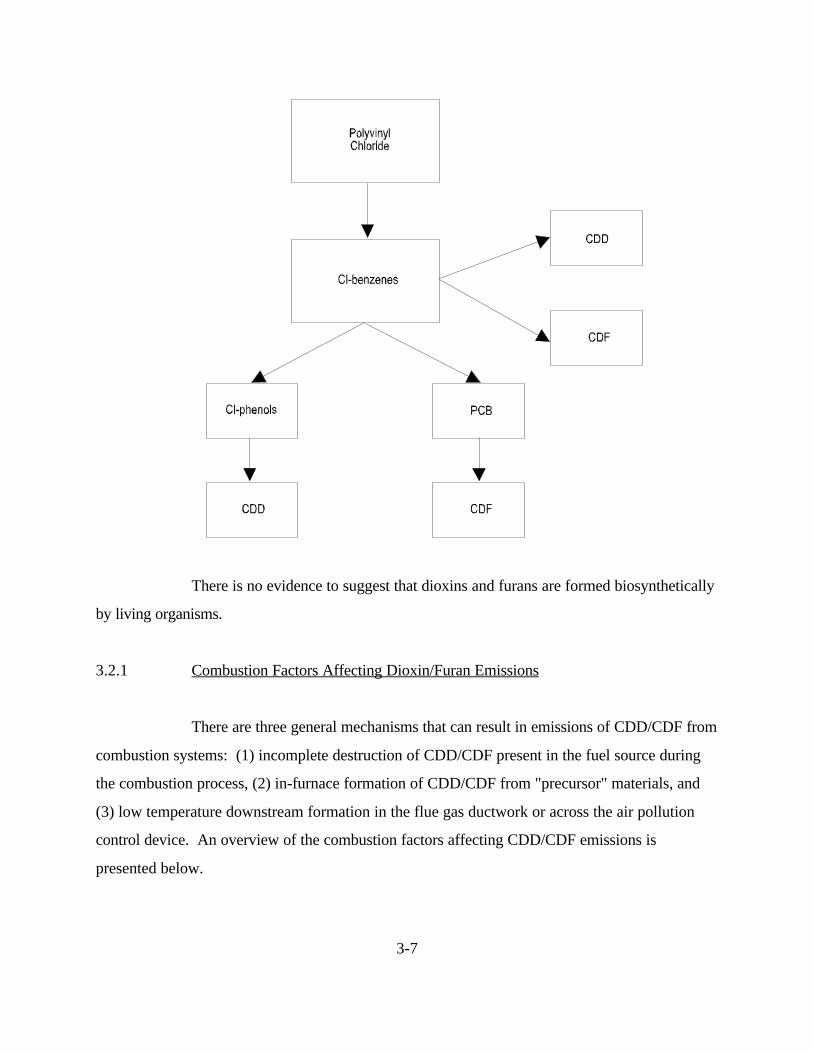
The manufacture of chlorophenols and the reaction of chlorophenols with
chlorobenzenes yield CDD as byproducts. Polyvinyl chloride is known to give a small yield of
chlorobenzene on pyrolysis, and chlorobenzenes themselves pyrolize in the presence of air to yield
CDD and CDF. Polychlorinated phenols give CDD at high temperatures, and PCB produce CDF
on laboratory pyrolysis in the presence of air. Possible routes of formation of CDD and CDF are8
illustrated in the diagram on the next page.
In the case of pyrolysis or combustion of chlorinated phenols, the absence of
oxygen stimulates the production of CDD, indicating that the yield of CDD is the net
result of thermal decomposition of polychlorinated phenols to water, carbon dioxide, etc., and the
thermal formation of CDD precursors. 8
3-7
There is no evidence to suggest that dioxins and furans are formed biosynthetically
There are three general mechanisms that can result in emissions of CDD/CDF from
combustion systems: (1) incomplete destruction of CDD/CDF present in the fuel source during
the combustion process, (2) in-furnace formation of CDD/CDF from "precursor" materials, and
(3) low temperature downstream formation in the flue gas ductwork or across the air pollution
control device. An overview of the combustion factors affecting CDD/CDF emissions is
presented below.
3-8
Incomplete Destruction of CDD/CDF in Fuel
CDD/CDF have been detected in several materials (fuels) during combustion. If
the combustion process is inefficient, a portion of the CDD/CDF in these materials can escape
from the combustion system and be emitted into the atmosphere. However, the fuel-and-air
mixing processes and temperatures in most combustion systems are sufficient to destroy most of
the CDD/CDF that may be in the original material. Exceptions to this are structural fires in which
CDD/CDF contaminated building materials exist, or small combustors (e.g., wood stoves or fire
places) where combustion conditions may be non-ideal. Based on the operating characteristics of
most combustion systems and the low levels of CDD/CDF in most materials, emissions of
CDD/CDF due to incomplete destruction during combustion are expected to be small compared
to the other two mechanisms.
In-Furnace Formation
In-furnace formation refers to the formation of CDD/CDF during the combustion
process. During combustion, various ring-structure hydrocarbon species (referred to as
"precursors") are formed as intermediate reaction products. If chlorine is also present, these
species can react with each other to form CDD/CDF. The most frequently identified precursors
are chlorobenzenes, chlorophenols, and chlorinated biphenyls. CDD/CDF may also be formed9
from the reaction of complex organic molecules and chlorine. Several studies have identified
strong correlations between chlorine content and CDD/CDF emissions during combustion tests.9
In-furnace formation of CDD/CDF is also related to combustion practices.
CDD/CDF are generally formed in greater quantities during combustion upsets or when mixing of
air and combustible hydrocarbon is poor, since higher levels of organics can escape the furnace at
these times. Good correlations exist between CO and CDD/CDF when CO emissions are high, as
CO generally indicates poor combustion. Insufficient mixing among air, fuel, and combustion
products has been identified as an important cause of increased CDD/CDF formation. The
3-9
potential for release of CDD/CDF from the combustion chamber is minimized by operating the
furnace to achieve low CO levels.9,10
Downstream Formation
Recent studies have shown that CDD/CDF also forms downstream of the furnace
in ductwork or in air pollution control devices. Available data indicate that aromatic structures
associated with carbon in the fly ash can be converted to CDD/CDF through reactions with
inorganic chlorine. This process is referred to as "de novo" synthesis. CDD/CDF are generally
formed through de novo synthesis at temperatures ranging from 392 F to 932 F (200 C to
500 C), with maximum formation rates occurring near 572 F (300 C). Several studies have
been conducted on CDD/CDF downstream formation in MWCs and are discussed in greater
detail in Section 4.1 of this report.
3.3 TOXIC EQUIVALENCY CONCEPTS AND METHODOLOGY
The toxicity equivalency factor (TEF) method is an interim procedure for assessing
the risks associated with exposures to complex mixtures of CDD/CDF. This method relates the
toxicity of the 210 structurally related chemical pollutants (135 CDF and 75 CDD) and is based
on limited data available from in vivo and in vitro toxicity testing. The toxicity of the most highly
studied dibenzo-p-dioxin, 2,3,7,8-TCDD, is used as a reference in relating the toxicity of the other
209 compounds (i.e., in terms of equivalent amounts of 2,3,7,8-TCDD). This approach simplifies
risk assessments, including assessments of exposure to mixtures of CDD and CDF such as
incinerator flyash, hazardous wastes, contaminated soils, and biological media. In 1989, as a11
result of the active involvement of EPA in an international effort aimed at adopting a common set
of TEFs, International TEFs/89, or I-TEFs/89, were implemented. The concepts and11
methodologies are presented in this document only because some emission factors and national
emission totals were found in the literature as TEQs.
3-10
A strong structure-activity relationship exists between the chemical structure of a
particular CDD/CDF homologue and its ability to elicit a biological/toxic response in various
in vivo and in vitro test systems. Congeners in which the 2,3,7, and 8 lateral positions are
occupied with chlorines (the "2,3,7,8-substituted homologues") are much more active than the
other homologues (the "non-2,3,7,8-substituted homologues").11
Available data on short-term in vitro toxicity studies for CDD/CDF are used to
supplement the lack of long-term in vivo results for these compounds. These toxicity estimates,
expressed in terms of toxic equivalents (TEQs), or equivalent amounts of 2,3,7,8-TCDD, are
generated by using the TEF to convert the concentration of a given CDD/CDF into an equivalent
concentration of 2,3,7,8-TCDD. The I-TEQs/89 are obtained by applying the I-TEFs/89 to the
congener-specific data and summing the results. In assigning TEFs, priority is normally given to
the results from long-term studies followed by the results from short-term, whole-animal studies.
Among the remaining short-term in vivo and in vitro data, the results of enzyme induction studies
take high priority because a good correlation has generally been observed between enzyme
induction activity and short-term, whole-animal results.11
The I-TEF/89 approach expresses the TEFs as a rounded order of magnitude
because, with the exception of the I-TEF/89 for PeCDF, the I-TEFs/89s are only crude
approximations of relative toxicities. A value of 0.5 is assigned to 2,3,4,7,8-PeCDF;
1,2,3,7,8-PeCDF is assigned a value of 0.05. This higher value for the 2,3,4,7,8-PeCDF is
supported by data from in vivo and in vitro studies and is the only instance in which the
I-TEFs/89s depart from the guiding principle of simplicity in which TEFs are expressed as
rounded orders of magnitude. The I-TEF/89 scheme assigns a value of zero to
non-2,3,7,8-substituted homologues.
In general, an assessment of the human health risk of a mixture of CDD and CDF
using the TEF approach involves the following steps:11
1. Analytical determination of the CDD and CDF in the sample.
3-11
2. Multiplication of homologue concentrations in the sample by TEFs toexpress the concentration in terms of 2,3,7,8-TCDD equivalents.
3. Summation of the products in Step 2 to obtain the total 2,3,7,8-TCDDequivalents in the sample.
4. Determination of human exposure to the mixture in question, expressed interms of 2,3,7,8-TCDD equivalents.
5. Combination of exposure from Step 4 with toxicity information on2,3,7,8-TCDD (usually carcinogenicity and/or reproductive effects) toestimate risks associated with the mixture.
In cases where the concentrations of homologues are known:
2,3,7,8-TCDD Equivalents = (TEF of each 2,3,7,8-CDD/CDF homologue)
x the concentration of the respective homologue
+ (TEF of each non-2,3,7,8-CDD/CDF homologue)
x the concentration of the respective homologue
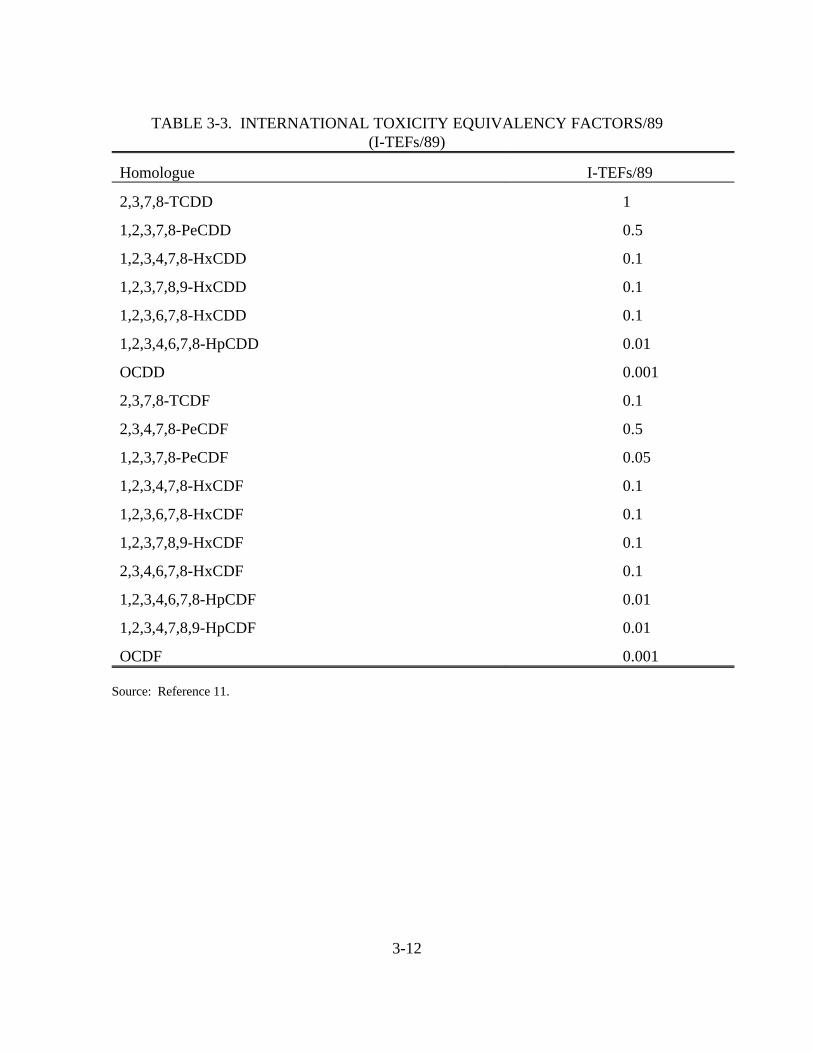
Table 3-3 lists I-TEFs/89s for some CDD and CDF.
3.4 OVERVIEW OF EMISSIONS
CDD and CDF are not chemically manufactured but are byproducts of certain
chemical processes during the manufacture of chlorinated intermediates and in the combustion of
chlorinated materials. Sources of CDD/CDF emissions include waste incineration, stationary fuel
combustion, crematories, metal foundries and recovery facilities, kraft pulp and paper production,
internal combustion engines, carbon regeneration, biomass burning, organic chemical
manufacture, and Portland cement manufacture. These sources of CDD/CDF emissions are
described in Section 4.0 of this document.
3-12
Homologue I-TEFs/89
2,3,7,8-TCDD 1
1,2,3,7,8-PeCDD 0.5
1,2,3,4,7,8-HxCDD 0.1
1,2,3,7,8,9-HxCDD 0.1
1,2,3,6,7,8-HxCDD 0.1
1,2,3,4,6,7,8-HpCDD 0.01
OCDD 0.001
2,3,7,8-TCDF 0.1
2,3,4,7,8-PeCDF 0.5
1,2,3,7,8-PeCDF 0.05
1,2,3,4,7,8-HxCDF 0.1
1,2,3,6,7,8-HxCDF 0.1
1,2,3,7,8,9-HxCDF 0.1
2,3,4,6,7,8-HxCDF 0.1
1,2,3,4,6,7,8-HpCDF 0.01
1,2,3,4,7,8,9-HpCDF 0.01
OCDF 0.001
Source: Reference 11.
TABLE 3-3. INTERNATIONAL TOXICITY EQUIVALENCY FACTORS/89(I-TEFs/89)
3-13
National emission estimates for each category/subcategory were developed using
one of two basic approaches. The first, and preferred approach was to utilize emission estimates
developed by the Emission Standards Division (ESD)/ Office of Air Quality Planning and
Standards (OAQPS) project teams responsible for developing Maximum Achievable Control
Technology (MACT) standards, or other EPA projects where in-depth evaluation and
characterization of the source categories were conducted (e.g., Secondary Lead Smelting
NESHAP Program). The second approach was to use category-specific national activity data
(throughput, production, fuel use, etc.), emission factors, and available information on industry
characteristics and control levels to develop a national emission estimate. The availability and
overall quality of national activity data varies by category. Preferred sources of national activity
data are trade associations and statistics compiled by various government entities (the EPA,
Department of Energy, Energy Information Administration [EIA]). Emission factors derived
from actual source test data were used wherever possible. An attempt was made to utilize
emission factors that reflect the standard emission control methods used by each source category.
In addition, supplemental information on three source categories was included based on findings
in a recent OHEA (now named the National Center for Environmental Assessment) study.
Several national emission estimates were taken from recent studies by the Office of
Air Quality Planning and Standards, and some of the results are expressed in units of EPA-TEQs.
The EPA adopted the International Methodology in 1989; thus, any data presented as an
EPA-TEQ should be equivalent to an International (I)-TEQ value.
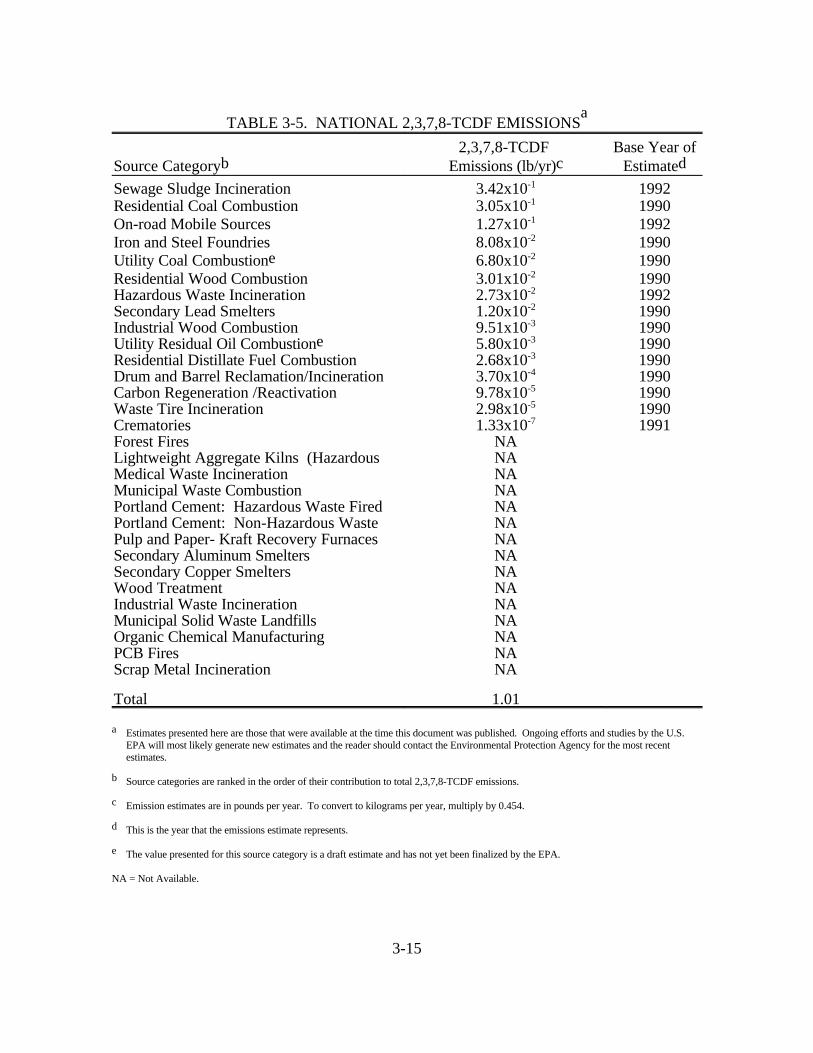
Estimates of national CDD/CDF emissions are shown in Tables 3-4 through 3-6.
Tables 3-4 through 3-6 present the national emissions of 2,3,7,8-TCDD, 2,3,7,8-TCDF, and
2,3,7,8-TCDD TEQ for each source category, respectively. The source categories are presented
in the order of their relative contributions to the total pollutant emissions. Appendix A describes
the basis for the estimates. For some source categories discussed in this document, data were not
available to estimate national emissions, and are so noted within Tables 3-4 through 3-6 and in
Estimates presented here are those that were available at the time this document was published. Ongoing efforts and studies by the U.S.aEPA will most likely generate new estimates and the reader should contact the Environmental Protection Agency for the most recentestimates.
Source categories are ranked in the order of their contribution to total 2,3,7,8-TCDD emissions.b
Emission estimates are in pounds per year. To convert to kilograms per year, multiply by 0.454. c
This is the year that the emissions estimate represents.d
The value presented for this source category is a draft estimate and has not yet been finalized by the EPA.e
Estimates presented here are those that were available at the time this document was published. Ongoing efforts and studies by the U.S.aEPA will most likely generate new estimates and the reader should contact the Environmental Protection Agency for the most recentestimates.
Source categories are ranked in the order of their contribution to total 2,3,7,8-TCDF emissions.b
Emission estimates are in pounds per year. To convert to kilograms per year, multiply by 0.454.c
This is the year that the emissions estimate represents.d
The value presented for this source category is a draft estimate and has not yet been finalized by the EPA.e
Estimates presented here are those that were available at the time this document was published. Ongoing efforts and studies by the U.S.aEPA will most likely generate new estimates and the reader should contact the Environmental Protection Agency for the most recentestimates.
Source categories are ranked in the order of their contribution to total 2,3,7,8-TCDD TEQ emissions.b
Emission estimates are in pounds per year. To convert to kilograms per year, multiply by 0.454.c
This is the year that the emissions estimate represents.d
The value presented for this source category is a draft estimate and has not yet been finalized by the EPA.e
NA = Not Available.
TABLE 3-6. NATIONAL 2,3,7,8-TCDD TEQ EMISSIONSa
3-17
It should also be noted that estimates for some source categories were available for
2,3,7,8-TCDD TEQ only (see Tables 3-4, 3-5, and 3-6) due to the limited amount of information
(such as activity data or an emission factor in non-TEQ units) available at the time this document
was prepared.
For the municipal waste combustion and medical waste incineration categories,
results from recent EPA MACT standard development studies are presented. The new estimates
identify a baseline dioxin level for estimated dioxin emissions for 1995. The new estimates for
these categories are based on an extensive database and are considered by EPA to be the most
accurate estimates available at this time.12,13
EPA's Office of Research and Development (ORD) has received emissions data for
on-road mobile sources that are more current than the data presented in this document and is in
the process of developing emission factors from the data. When ORD completes their evaluation
of the data, the emission factors will be publicly available.
4-1
SECTION 4.0
EMISSIONS SOURCES
Sources of atmospheric emissions of CDD/CDF are described in this section.
Many of the source categories discussed in this section emit CDD/CDF from a fuel combustion
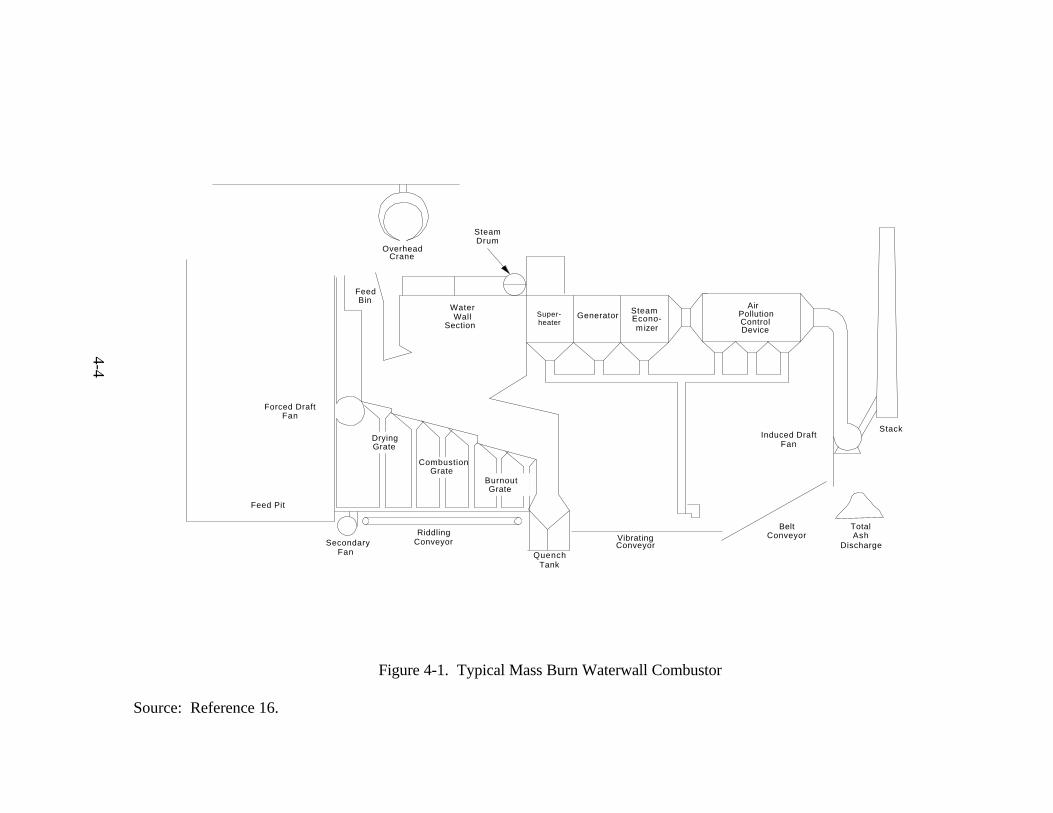
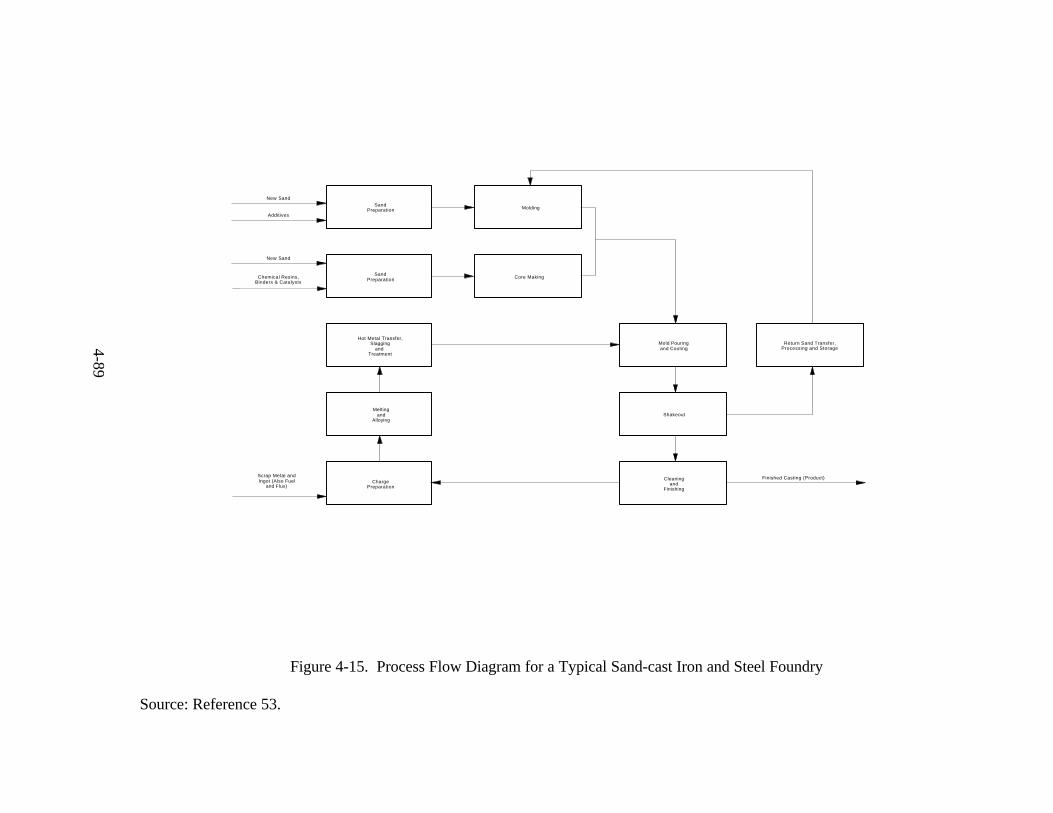
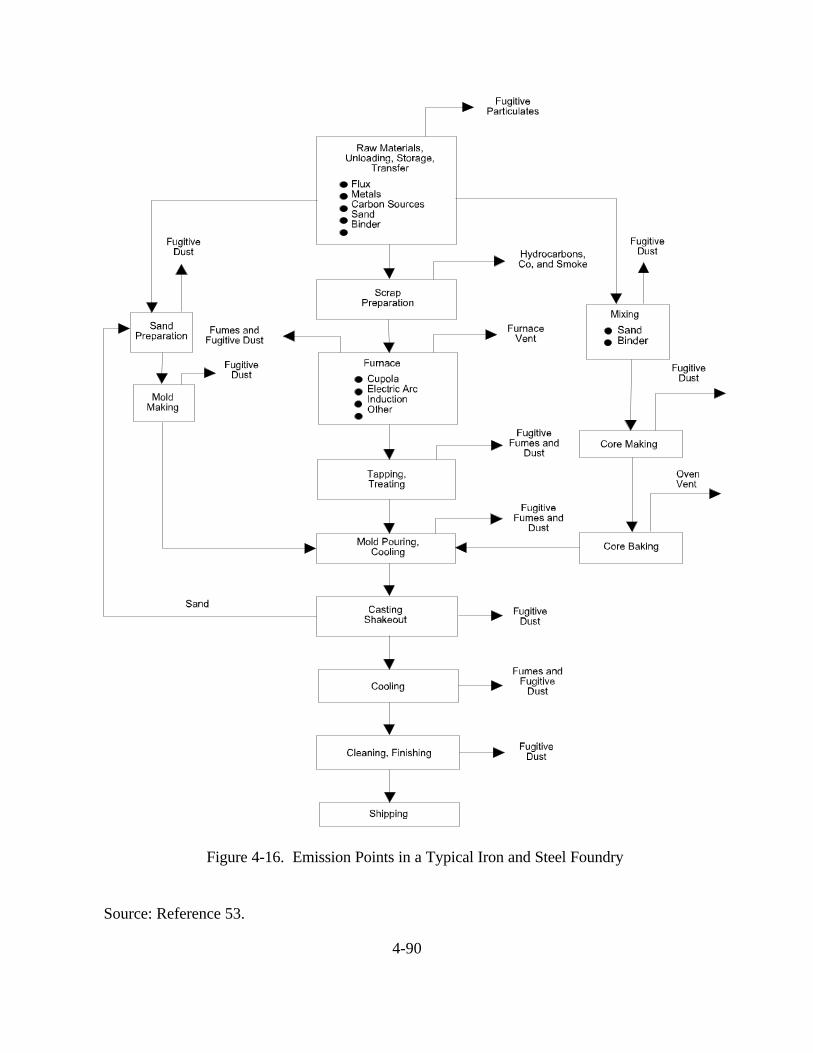
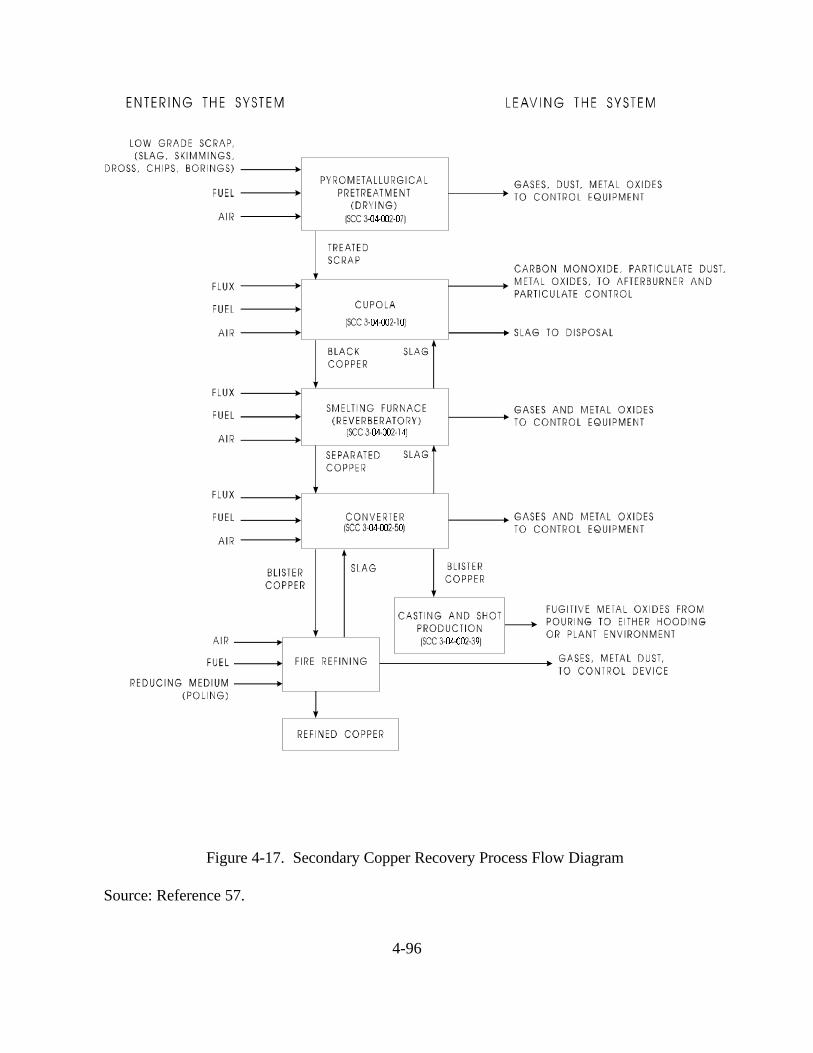
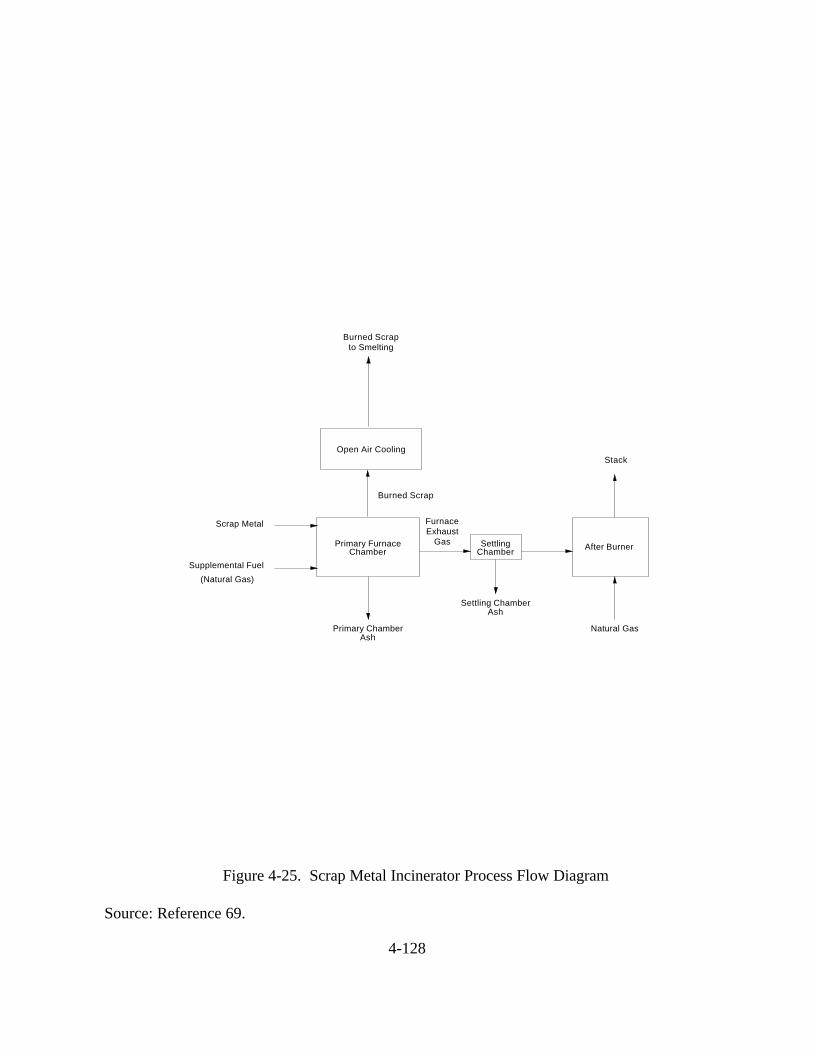
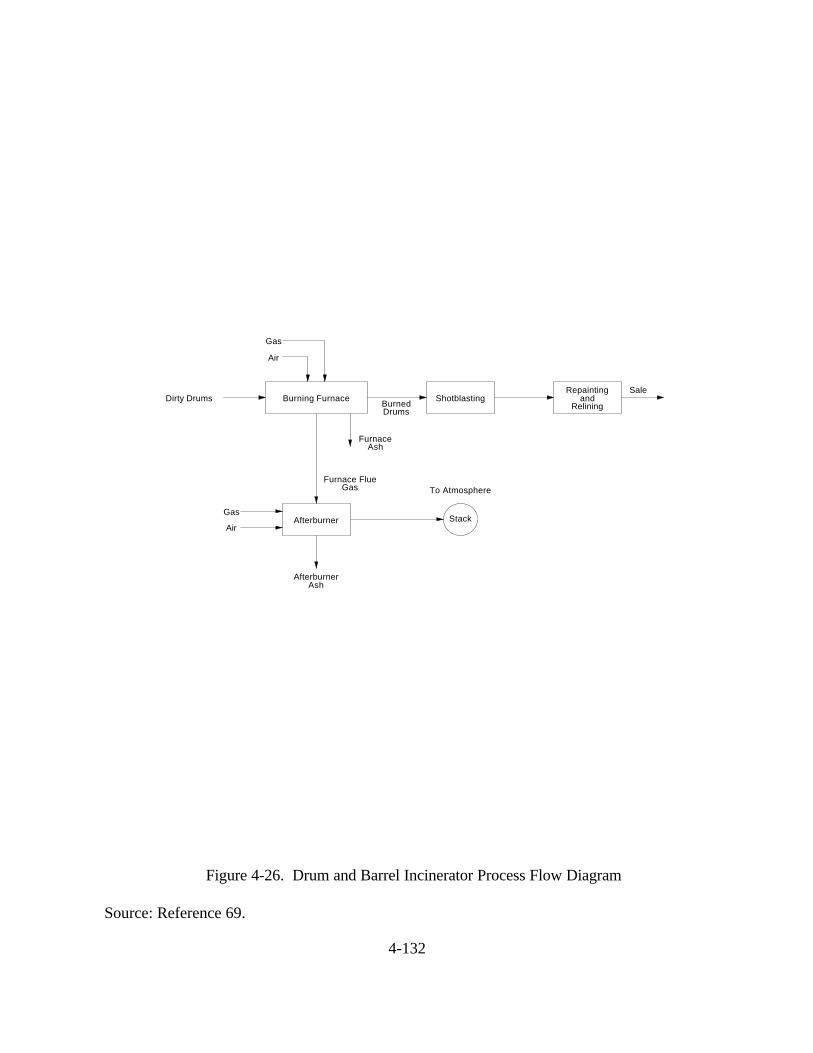
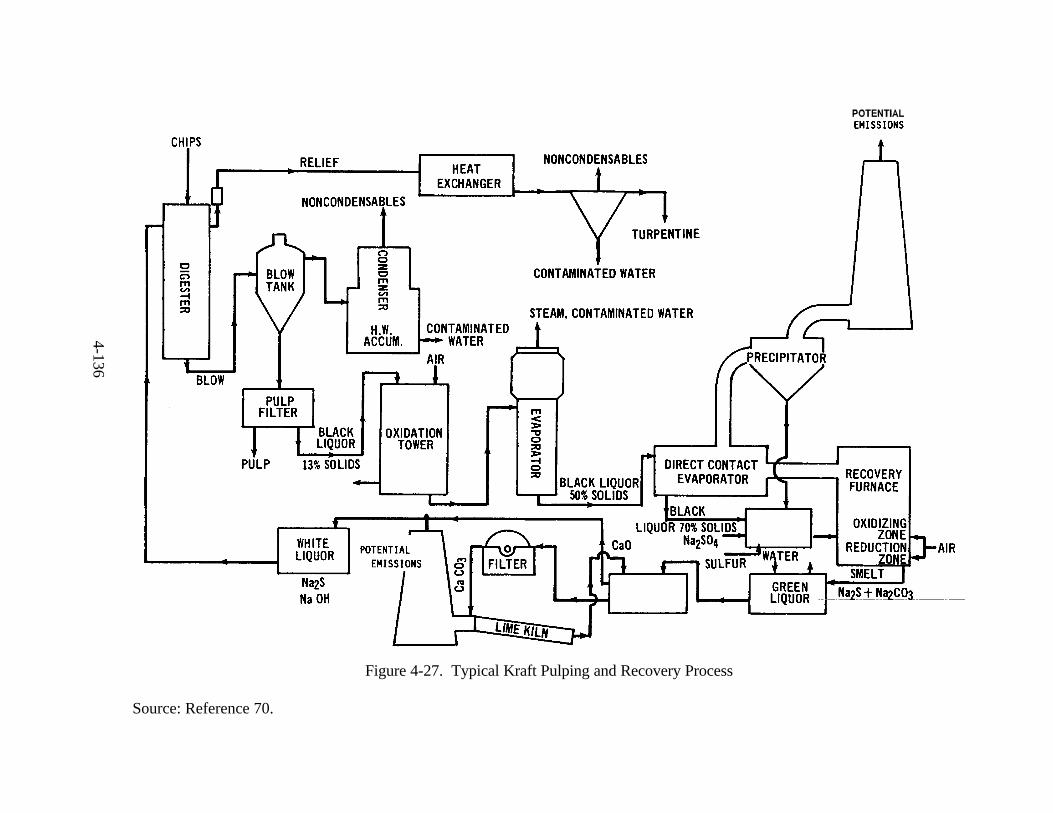
process. Process descriptions and flow diagrams are included in the discussions as appropriate.
Emission factors for the processes are presented when available, and control technologies and
source locations are described.
There are few emission control techniques that are dedicated solely to reducing
CDD/CDF emissions, and therefore data on the effectiveness of control strategies in reducing
CDD/CDF emissions are limited. In many cases, the emission factor data available are for both
controlled and uncontrolled processes and/or units, and are presented within this section, where
available.
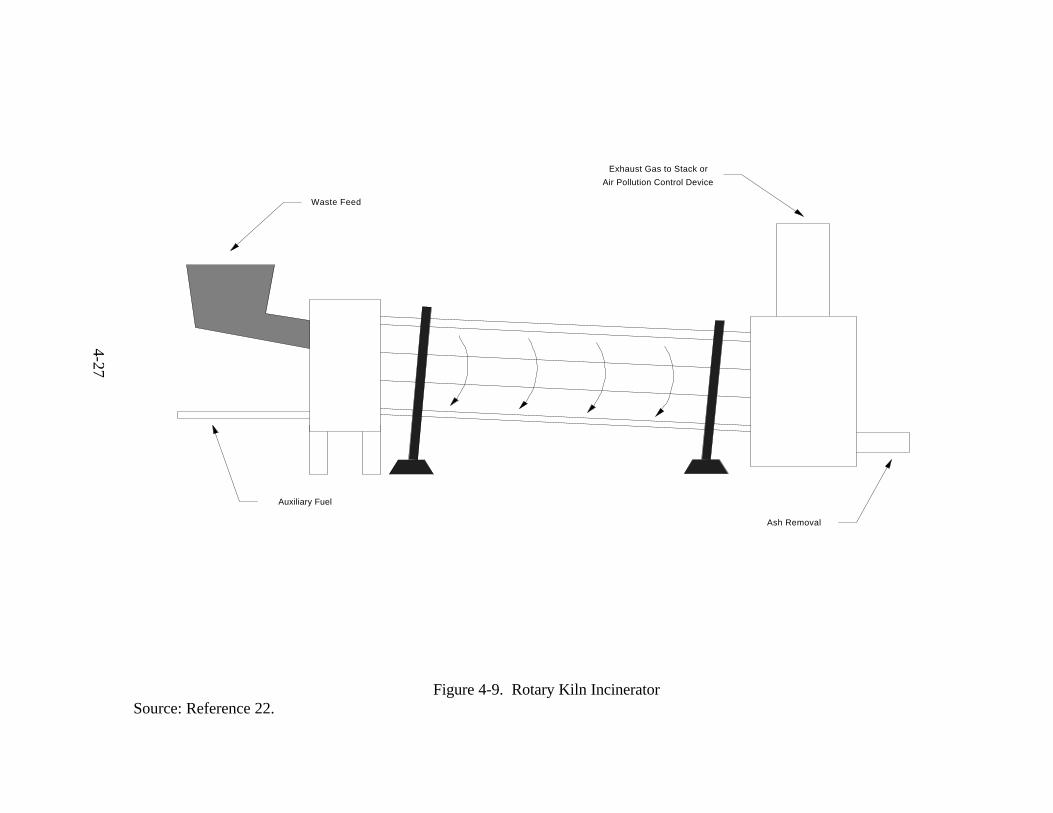
4.1 WASTE INCINERATION
This section discusses CDD/CDF emissions from waste incineration. Types of
waste incineration that are potential sources of CDD/CDF emissions include (1) municipal waste
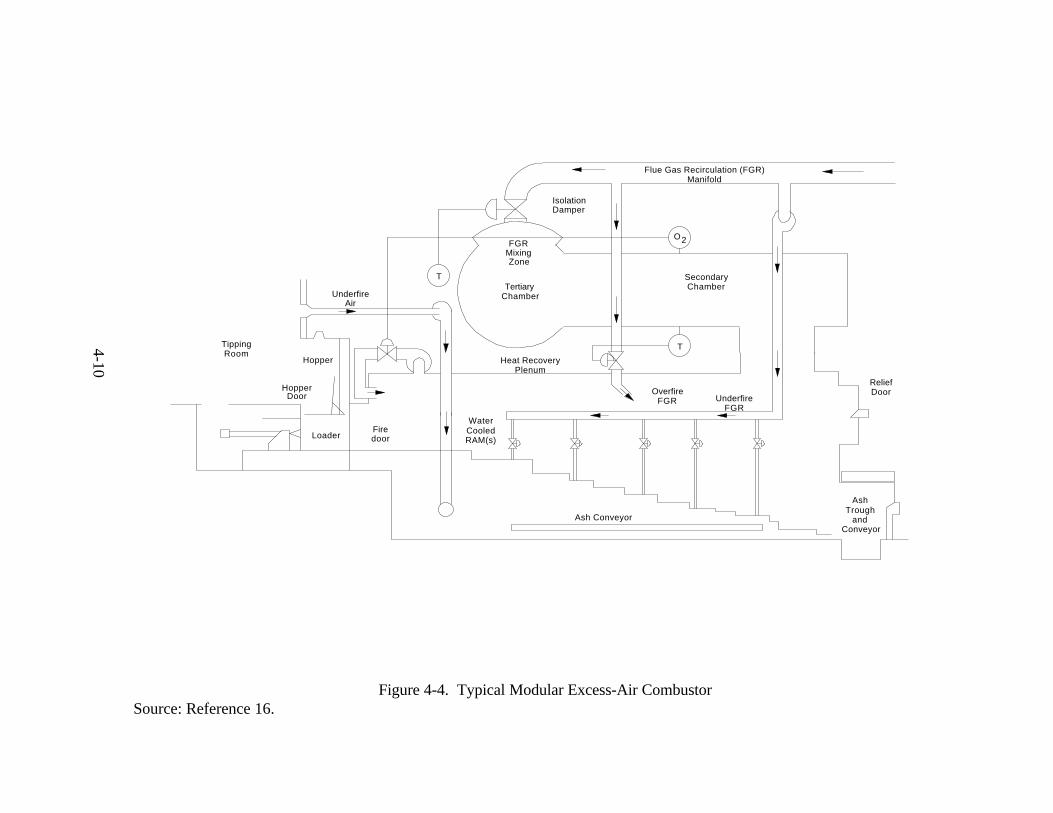
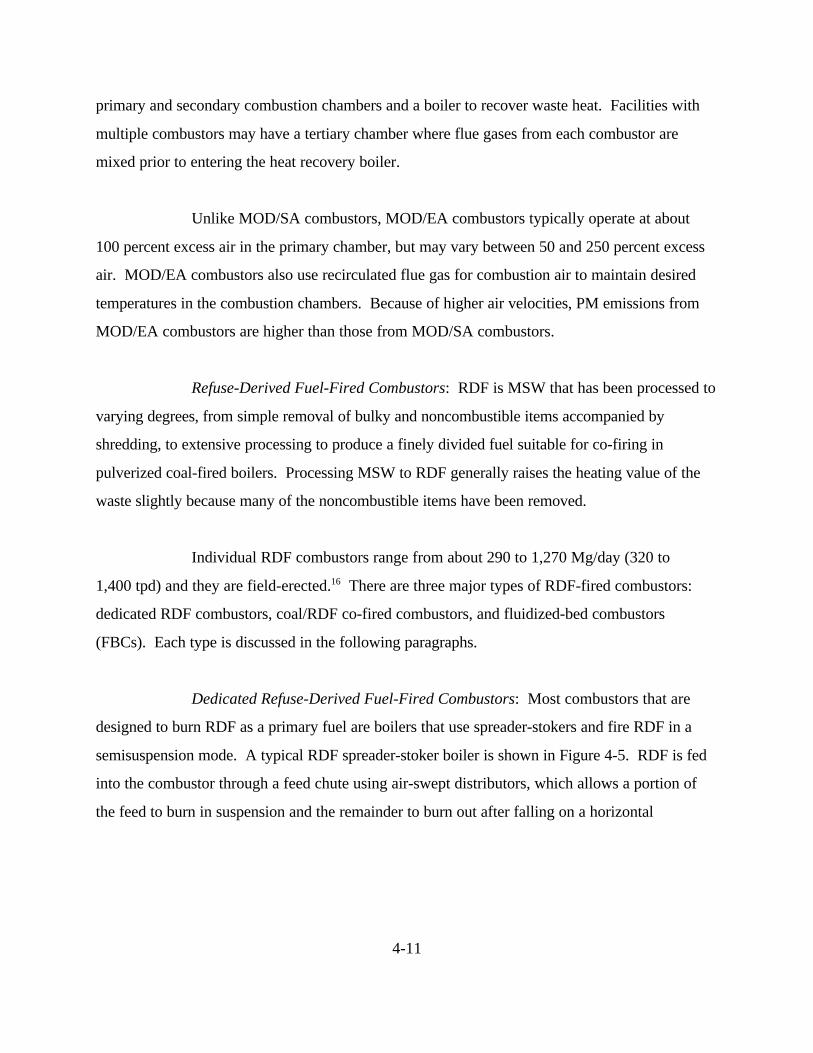
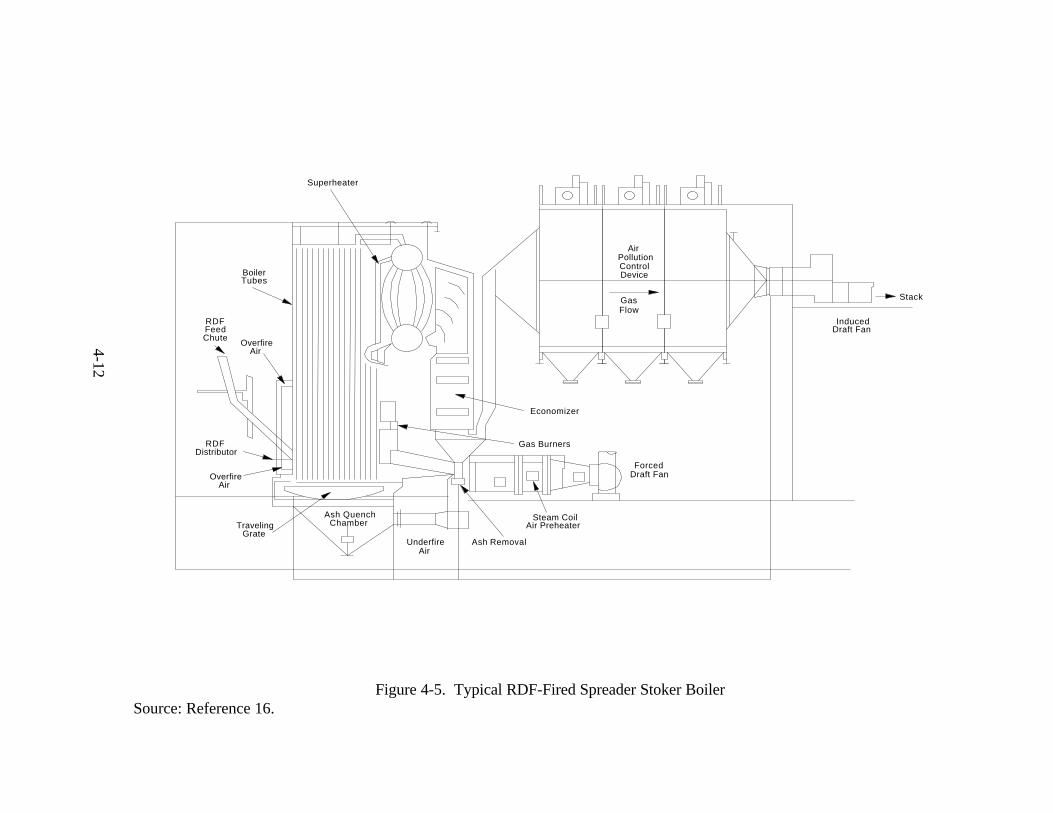
traveling grate. The traveling grate moves from the rear to the front of the furnace and distributor
settings are adjusted so that most of the waste lands on the rear two-thirds of the grate. This
allows more time for combustion to be completed on the grate. Underfire air and overfire air are
introduced to enhance combustion, and these combustors typically operate at 80 to 100 percent
excess air. Waterwall tubes, a superheater, and an economizer are used to recover heat for
production of steam and/or electricity.
Co-fired Combustors: RDF can be co-fired in various types of coal-fired boilers,
including pulverized coal-fired and cyclone-fired boilers. In a pulverized coal-fired system, coal is
pulverized into a powder and injected into the combustor through burners located on the
combustor walls. RDF with a particle size of 5 cm (2 in.) or less in diameter is introduced into the
combustor by air transport injectors that are located above or even with the coal injectors. A
significant portion of the larger, partially burned particles become disengaged from the gas flow
and fall onto grates at the bottom of the furnace where combustion is completed. Most
RDF/pulverized coal-fired units operate with 50 percent excess air, in contrast to units firing coal
alone, which may use as little as 25 percent excess air. Furnace exit temperatures are generally in
excess of 1,095 C (2,000 F), which is higher than in other MWCs.16
In an RDF/coal-fired, cyclone-fired combustor, crushed coal is injected into one
end of a horizontal combustion cylinder. Primary air (about 20 percent of the total combustion
air) is introduced tangentially to the burner, which causes the coal to move in a swirling pattern.
The RDF is injected into the combustion chamber along with the secondary air in the same
tangential direction through ports in the top of the cylinder. The cyclone operates at temperatures
exceeding 1,370 C (2,500 F), which melts the coal and RDF ash into a liquid slag. Because of
the swirling motion, most of the incoming coal and RDF gets caught in the slag layer on the
combustor walls, where it burns rapidly.
4-14
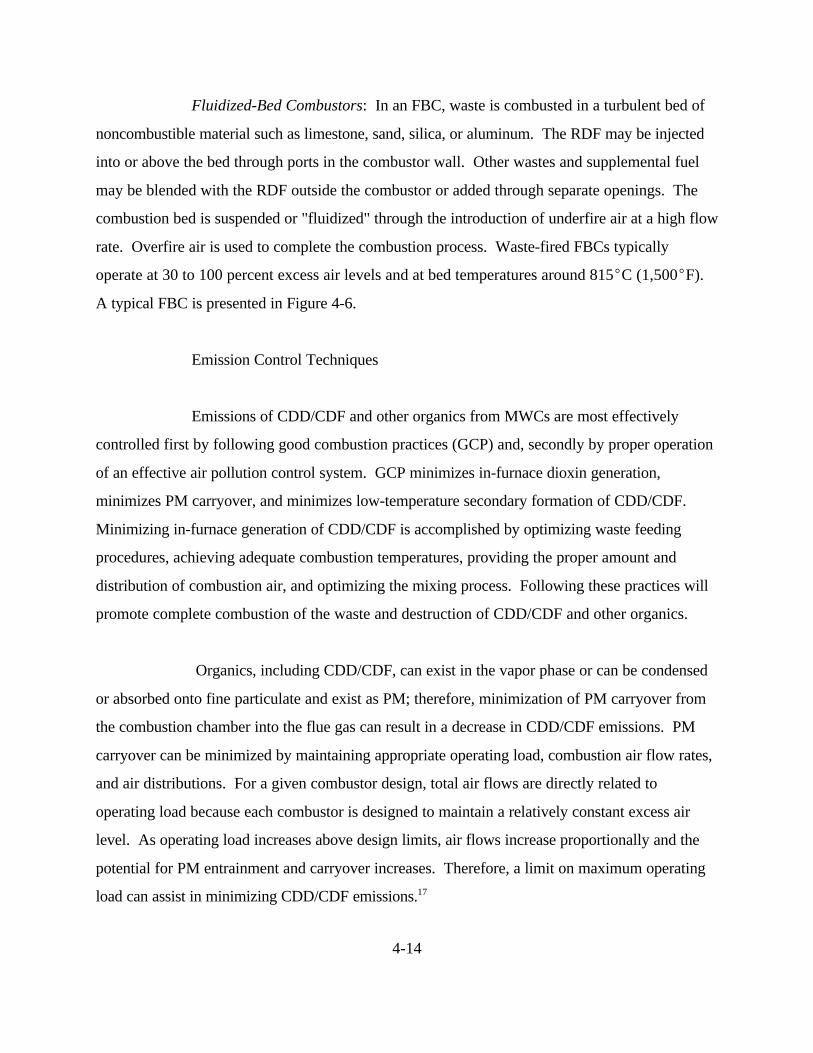
Fluidized-Bed Combustors: In an FBC, waste is combusted in a turbulent bed of
noncombustible material such as limestone, sand, silica, or aluminum. The RDF may be injected
into or above the bed through ports in the combustor wall. Other wastes and supplemental fuel
may be blended with the RDF outside the combustor or added through separate openings. The
combustion bed is suspended or "fluidized" through the introduction of underfire air at a high flow
rate. Overfire air is used to complete the combustion process. Waste-fired FBCs typically
operate at 30 to 100 percent excess air levels and at bed temperatures around 815 C (1,500 F).
A typical FBC is presented in Figure 4-6.
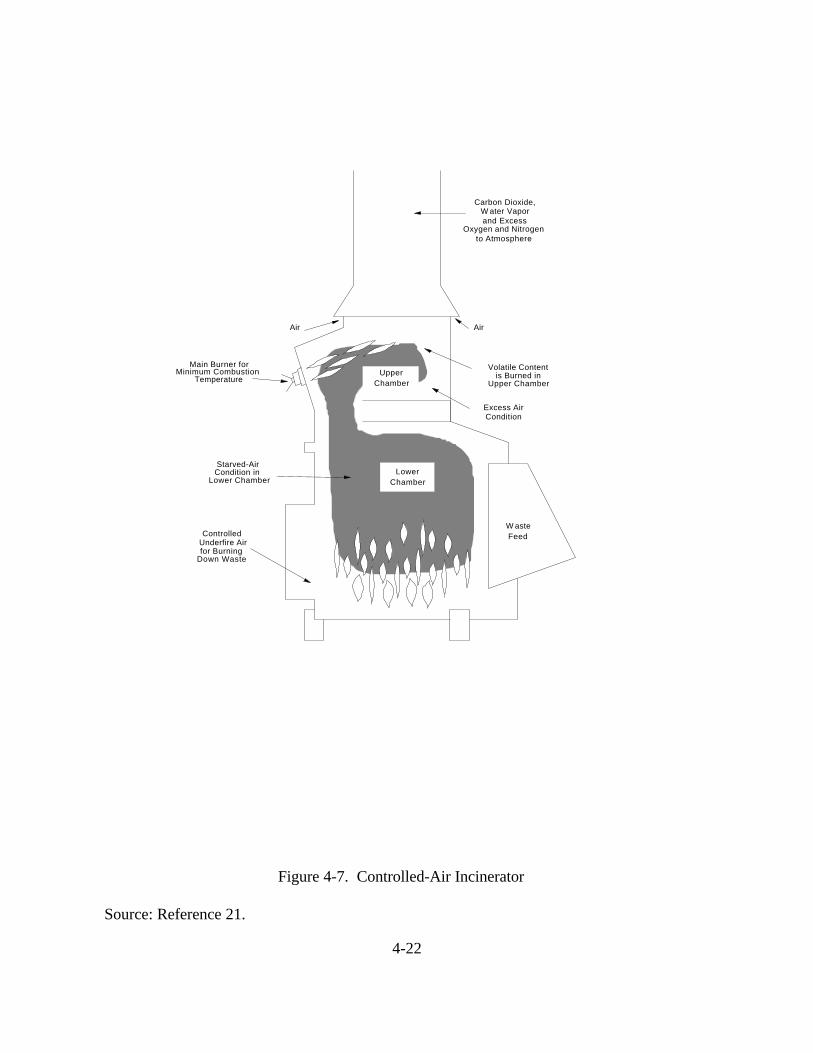
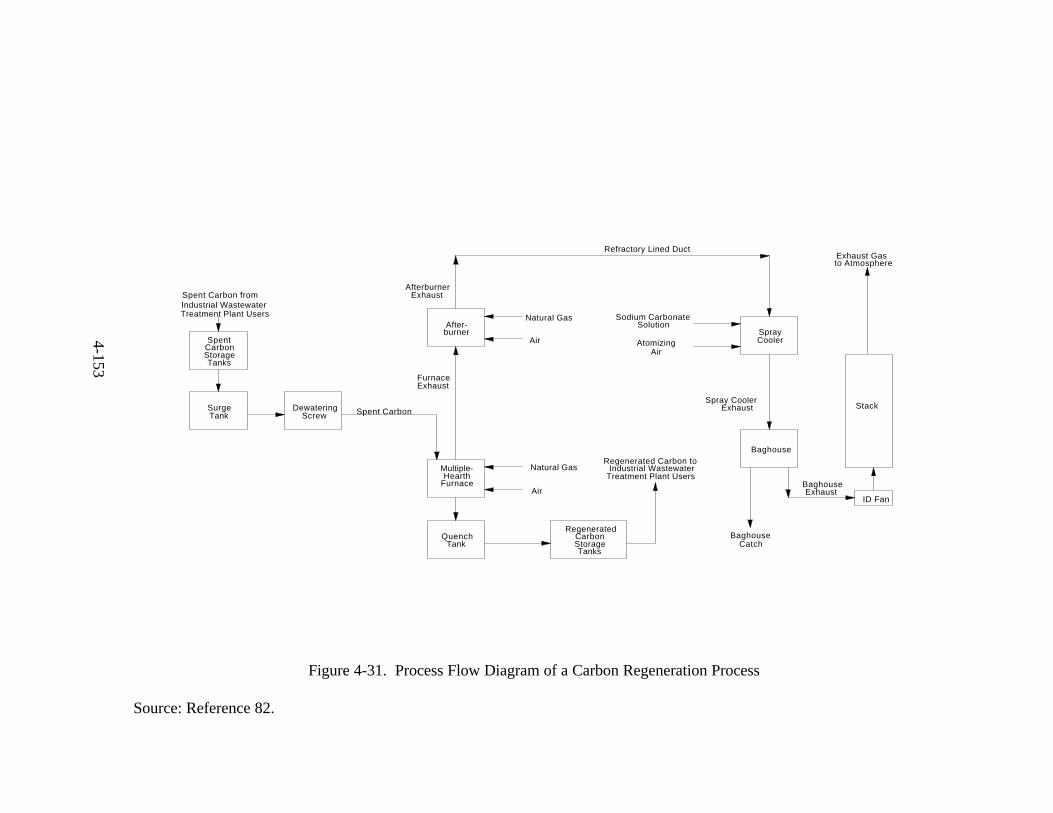
Emission Control Techniques
Emissions of CDD/CDF and other organics from MWCs are most effectively
controlled first by following good combustion practices (GCP) and, secondly by proper operation
of an effective air pollution control system. GCP minimizes in-furnace dioxin generation,
minimizes PM carryover, and minimizes low-temperature secondary formation of CDD/CDF.
Minimizing in-furnace generation of CDD/CDF is accomplished by optimizing waste feeding
procedures, achieving adequate combustion temperatures, providing the proper amount and
distribution of combustion air, and optimizing the mixing process. Following these practices will
promote complete combustion of the waste and destruction of CDD/CDF and other organics.
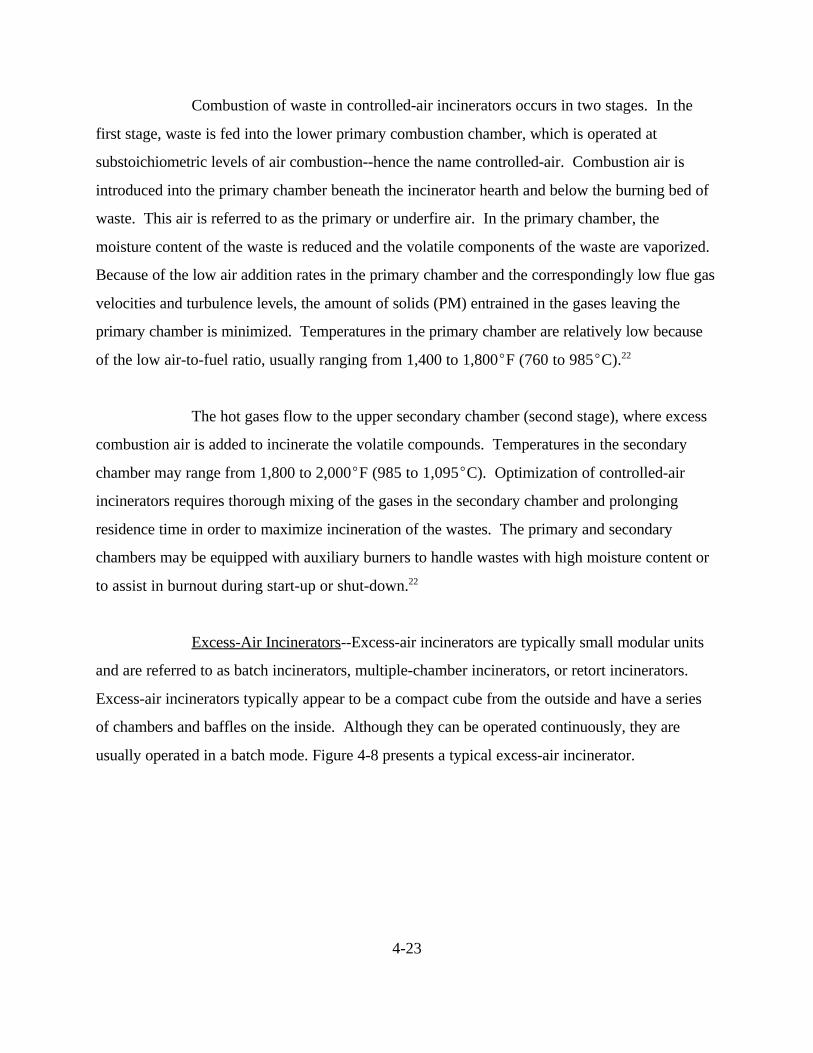
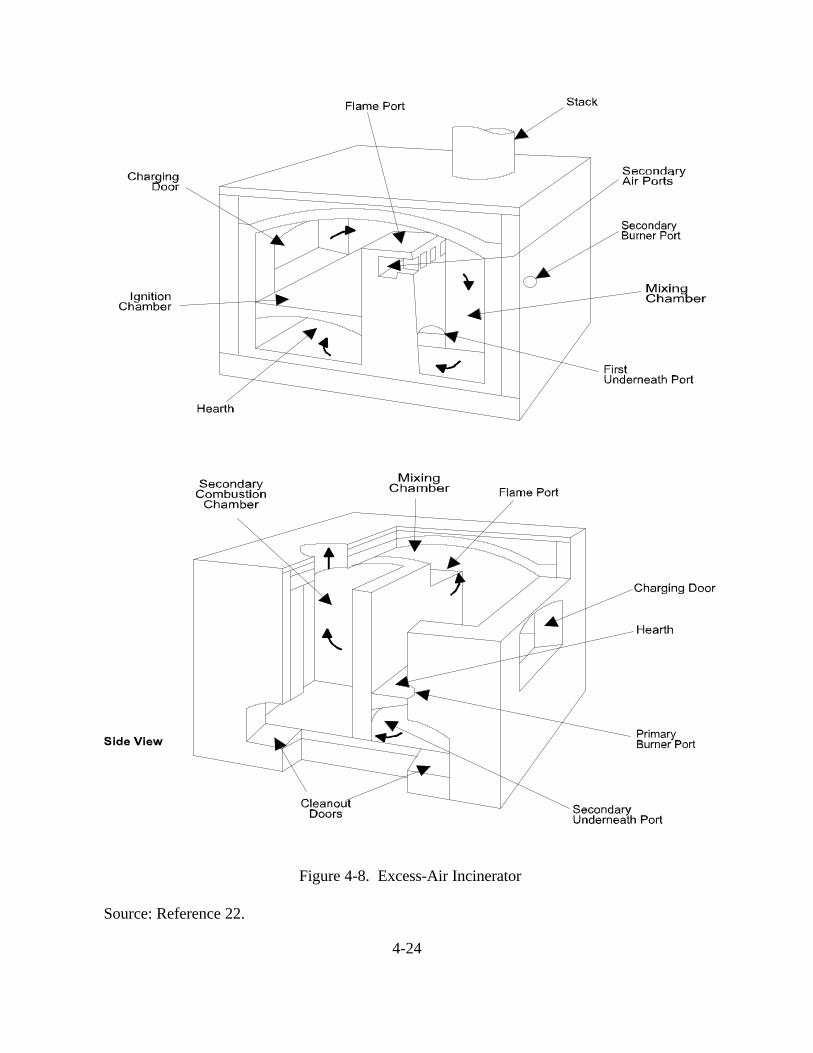
Organics, including CDD/CDF, can exist in the vapor phase or can be condensed
or absorbed onto fine particulate and exist as PM; therefore, minimization of PM carryover from
the combustion chamber into the flue gas can result in a decrease in CDD/CDF emissions. PM
carryover can be minimized by maintaining appropriate operating load, combustion air flow rates,
and air distributions. For a given combustor design, total air flows are directly related to
operating load because each combustor is designed to maintain a relatively constant excess air
level. As operating load increases above design limits, air flows increase proportionally and the
potential for PM entrainment and carryover increases. Therefore, a limit on maximum operating
load can assist in minimizing CDD/CDF emissions.17
4-15
Figure 4-6. Fluidized-Bed Combustor
Source: Reference 18.
4-16
Secondary CDD/CDF formation downstream from the furnace can occur in PM
control devices (e.g., ESPs). CDD/CDF formation can occur in the presence of excess oxygen
over a wide range of temperatures, with maximum formation rates occurring near 570 F
(300 C). At temperatures above 570 F, thermal degradation of CDD/CDF can occur. At17
lower temperatures, the rate of CDD/CDF formation decreases. At PM control device
temperatures of 300 to 570 F (150 to 300 C), CDD/CDF concentrations vary by approximately a
factor of two for each 86 F (30 C) change in temperature (e.g., reducing the operating
temperature of the PM control device from 356 F (180 C) to 302 F (150 C) will reduce
CDD/CDF emissions by a factor of approximately two. To reduce emissions of CDD/CDF, the
maximum inlet temperature on the PM control device should be reduced to the lowest practical
operating temperature, typically below 450 F (e.g., by using a spray dryer or water sprays in
combination with the PM control device).17
Most MWCs constructed since the late 1980s have a spray dryer installed
upstream of the PM control device to control acid gas emissions. The PM control device
operating temperature of these systems is typically 275 to 302 F (135 to 150 C). On some
MWCs, duct sorbent injection (DSI) is used rather than a spray dryer. Depending on design and
operating practices, the flue gas temperature entering the PM control device can be as low as
248 F (120 C) or as high as 392 F (200 C). Because of the wide variation in the PM control
device temperature of DSI systems, CDD/CDF emission factors can vary significantly.
Based on recent testing programs, the EPA has found that additional CDD/CDF
control is achieved by injecting activated carbon into the flue gas. For example, during EPA tests
at a commercial MWC, activated carbon injection achieved significant more CDD/CDF removal
than the reduction level achieved by a spray dryer/ESP scrubbing system alone.19
4-17
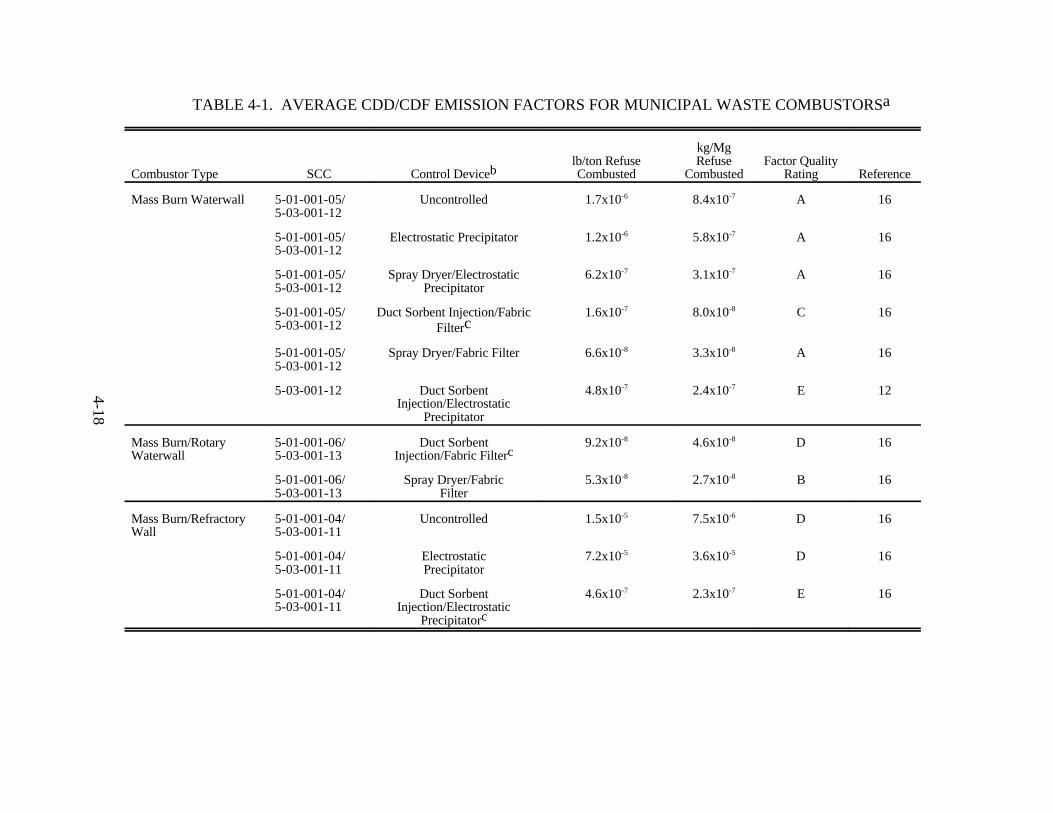
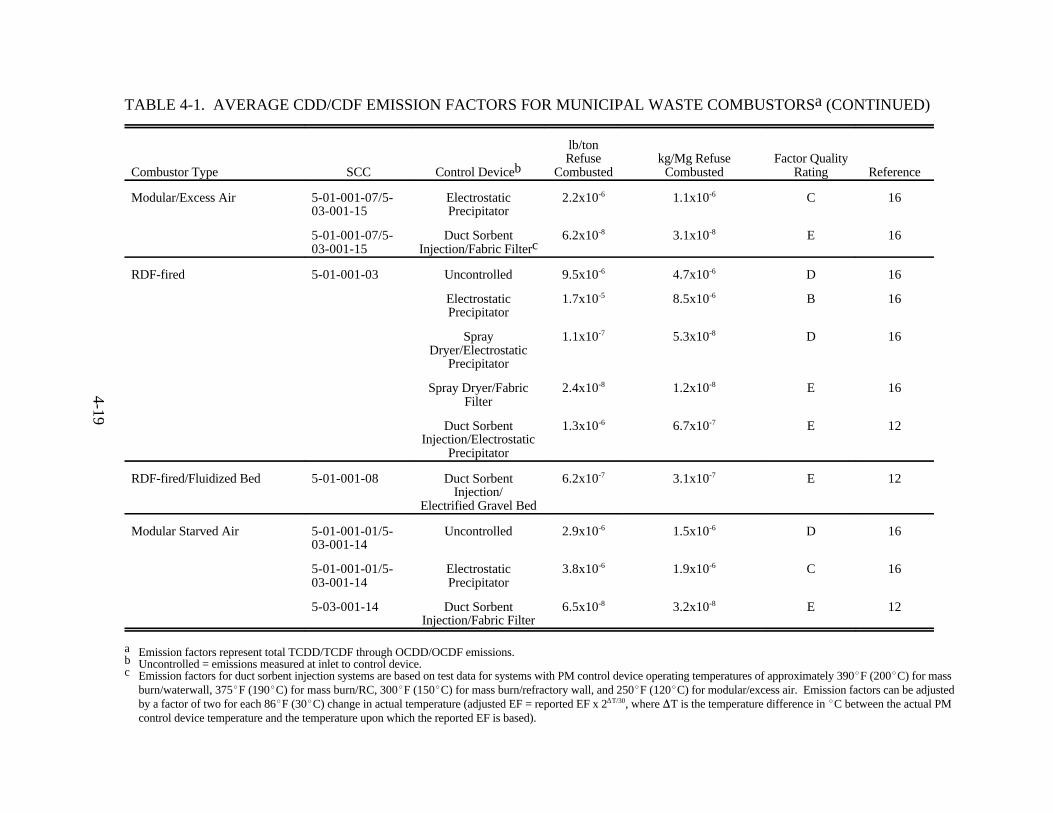
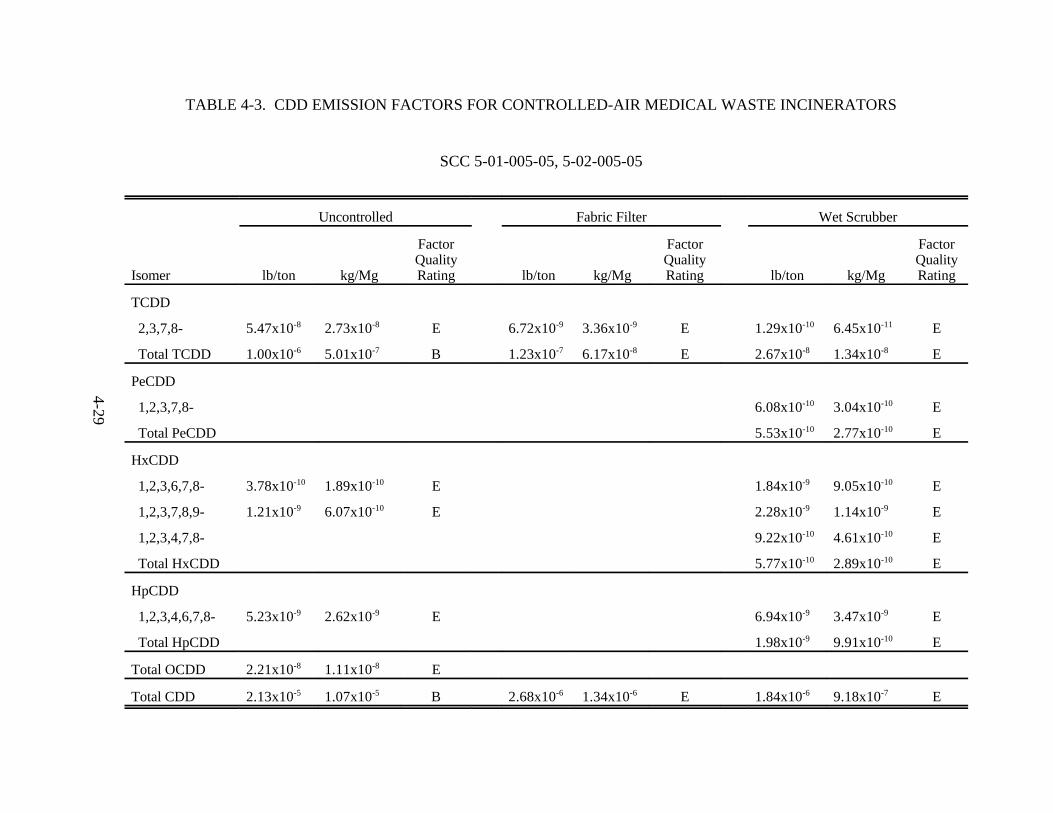
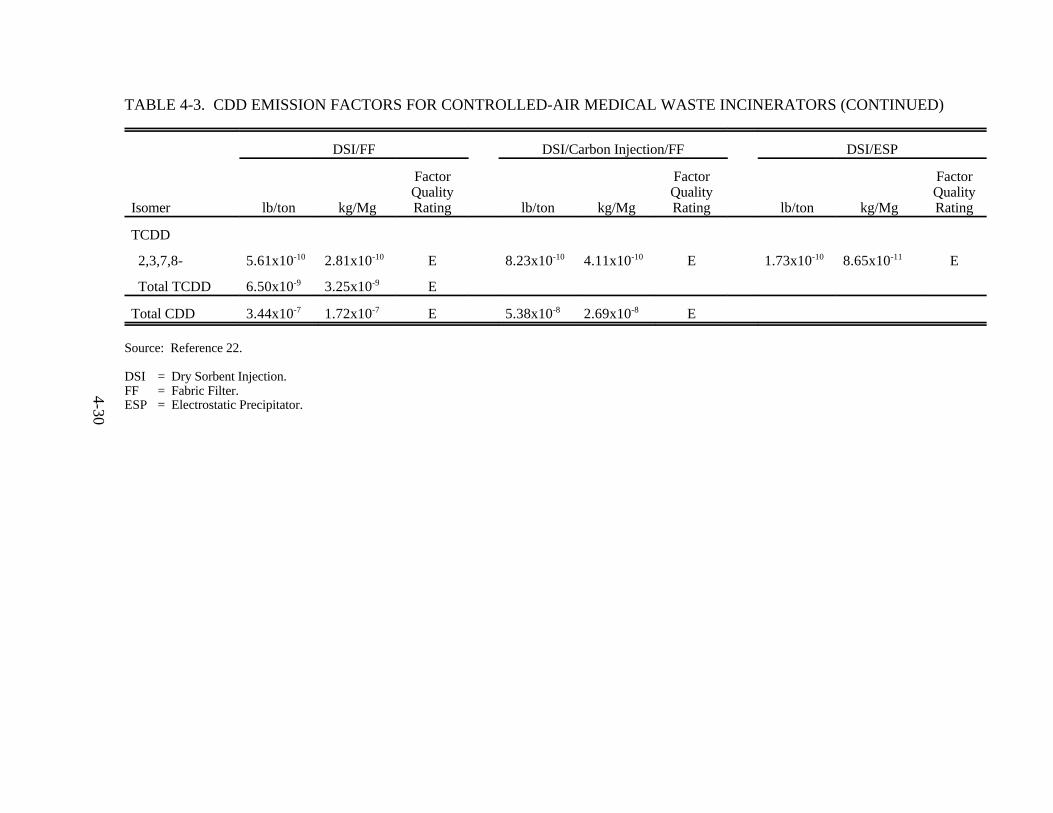
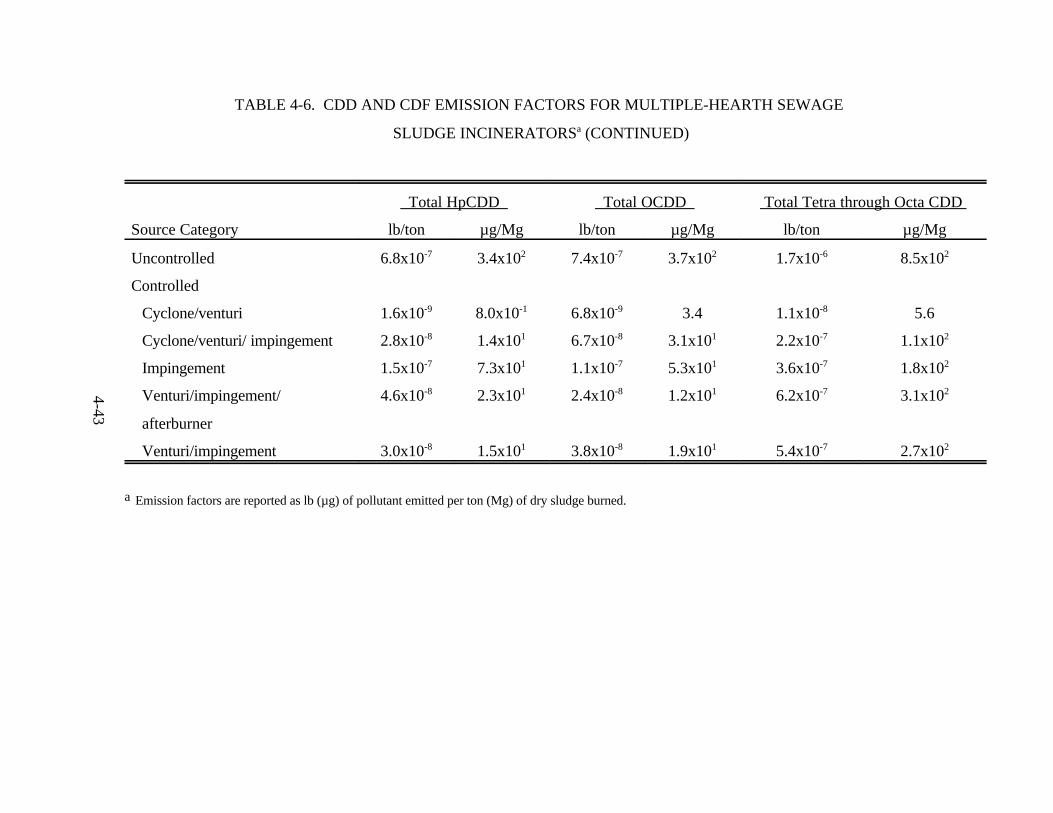
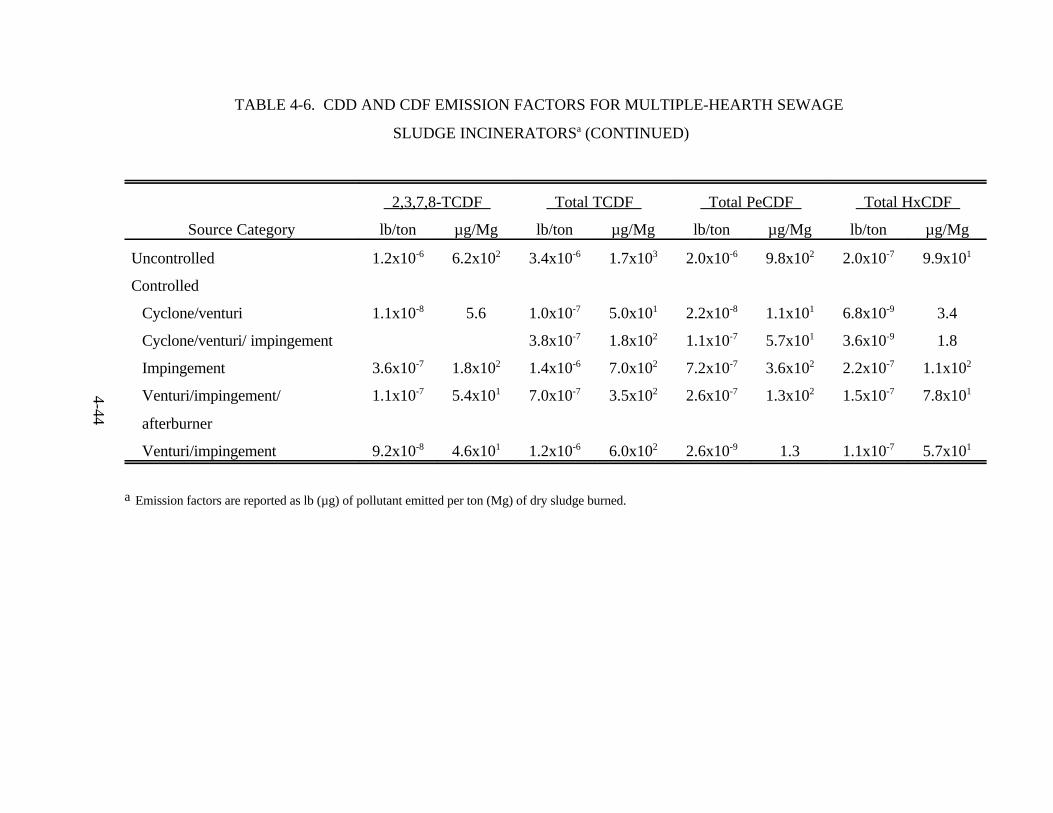
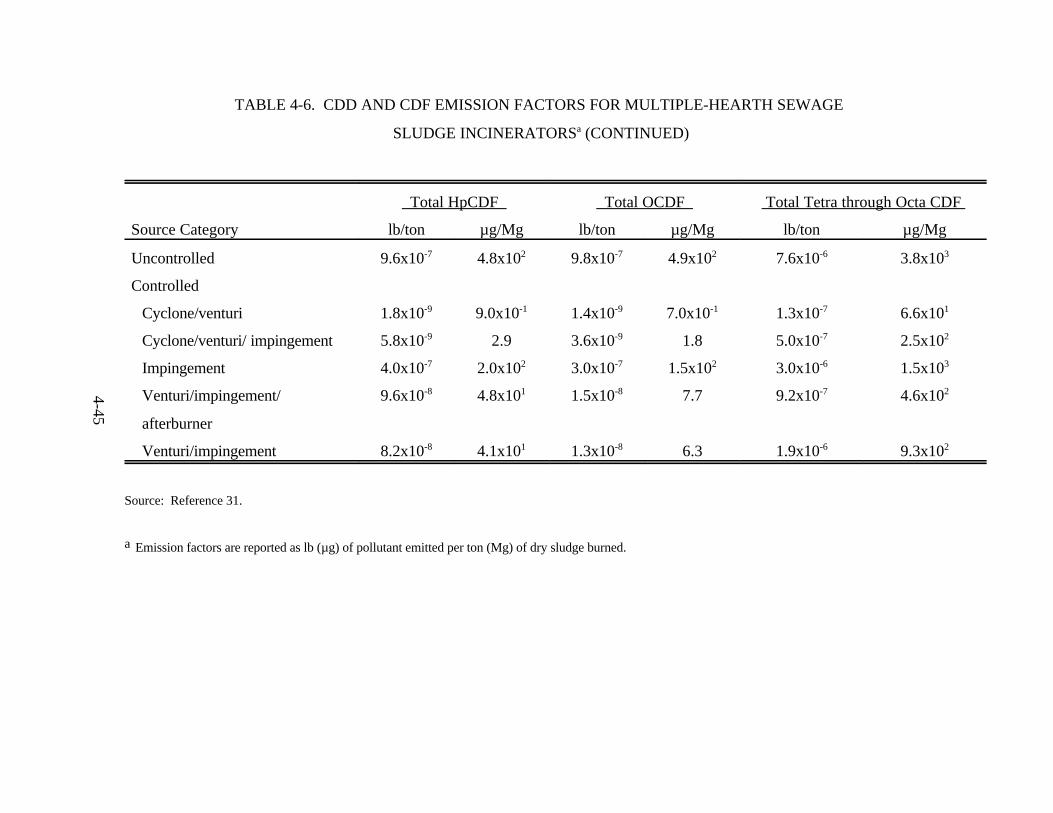
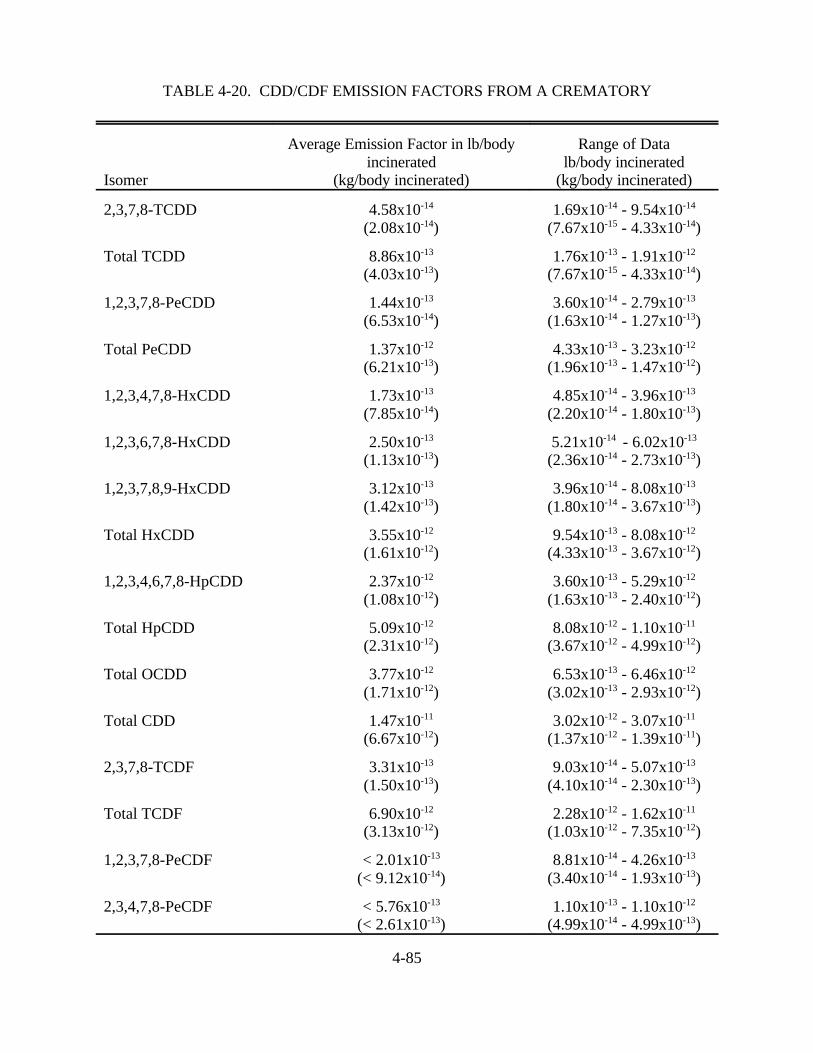
Emission Factors
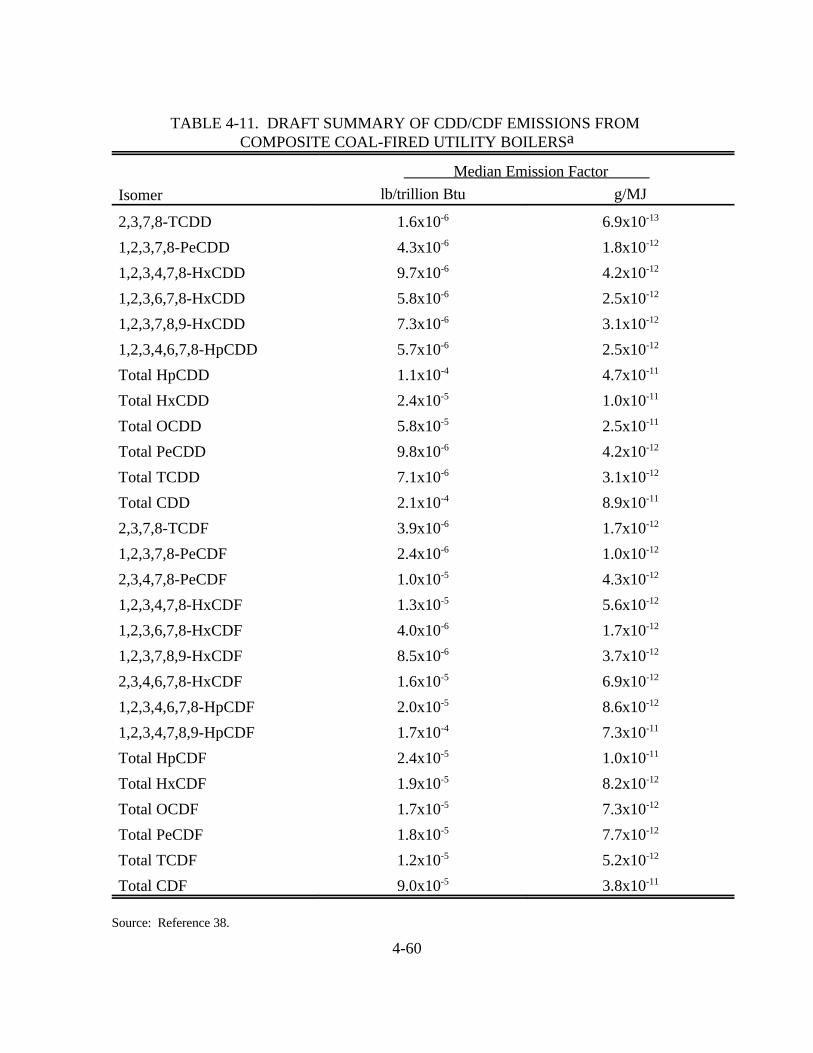
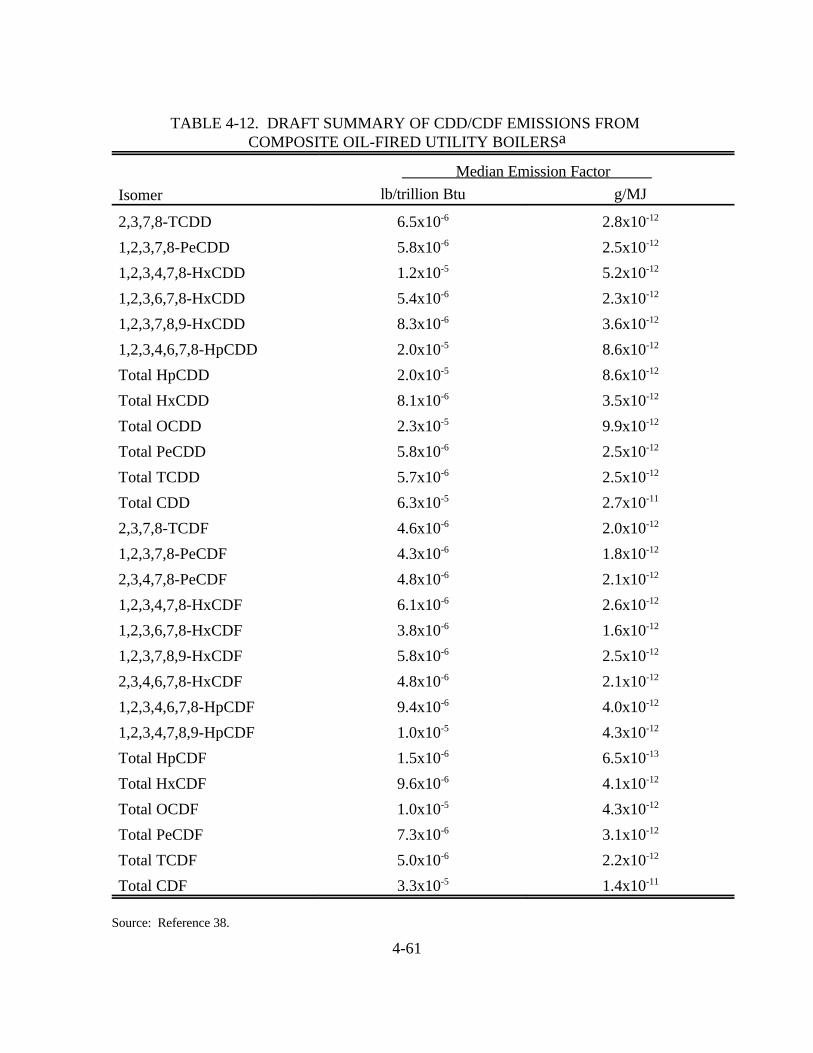
The emission factors presented in Table 4-1 were developed from a compilation of
data published on 107 separate test reports. Emission factors for uncontrolled and controlled
levels of operation based on various APCDs are included. For some types of units and APCDs,
there is a large amount of data available, while other categories have little data. The reader
should refer to the EPA Background Information Documents (BIDs) developed for the NSPS,
which provide detailed analyses of specific unit performances capabilities, APCDs, and emissions
levels.
The user of these emission factors should recognize that the values reported here
are averages and may not be representative of a particular facility. Emissions from MWCs may
vary significantly due to the composition of the waste, the extent of GCP, APCD operating
temperatures, and various other factors.
It is apparent from the data in Table 4-1 that CDD/CDF emissions vary greatly
between combustor types. Emissions variability is attributable to widely differing waste
compositions being combusted, combustor operating practices, and control device effectiveness.
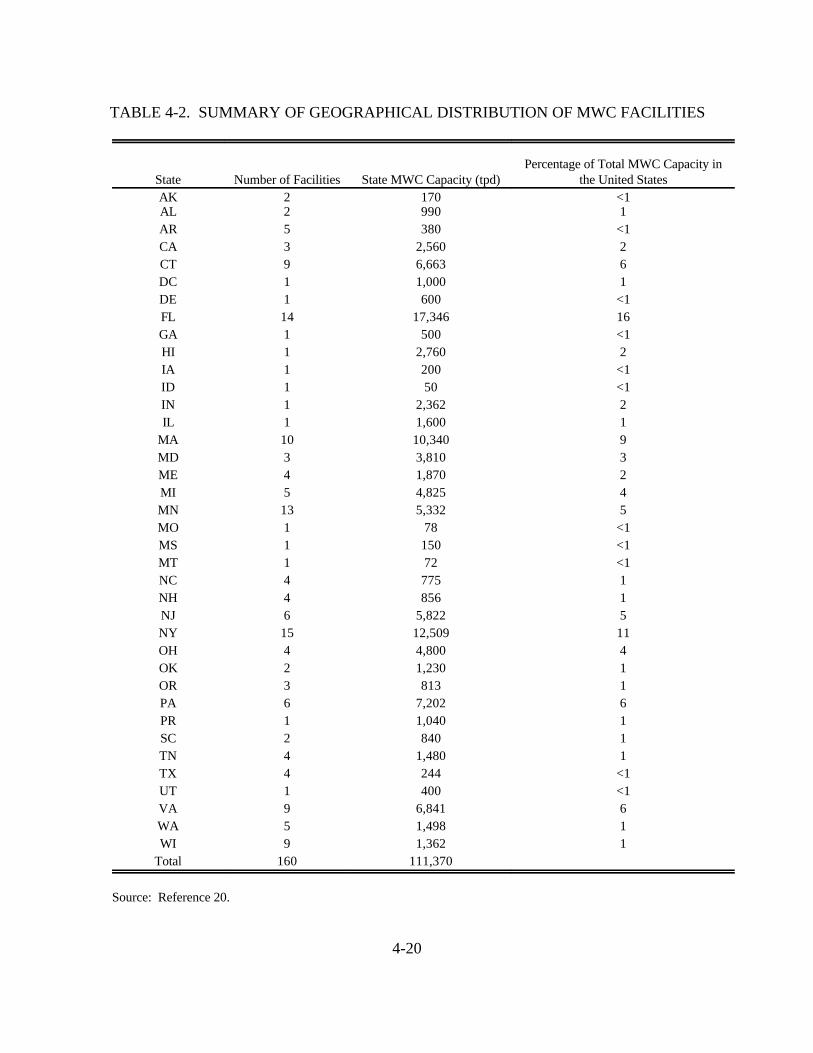
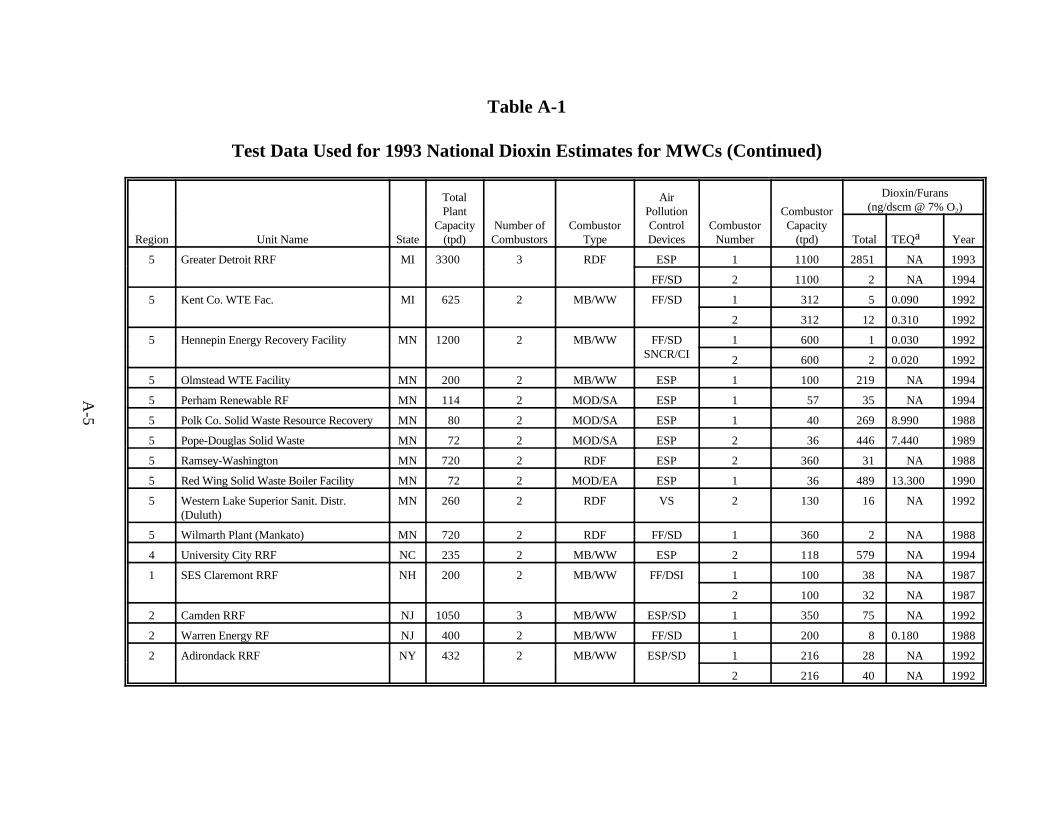
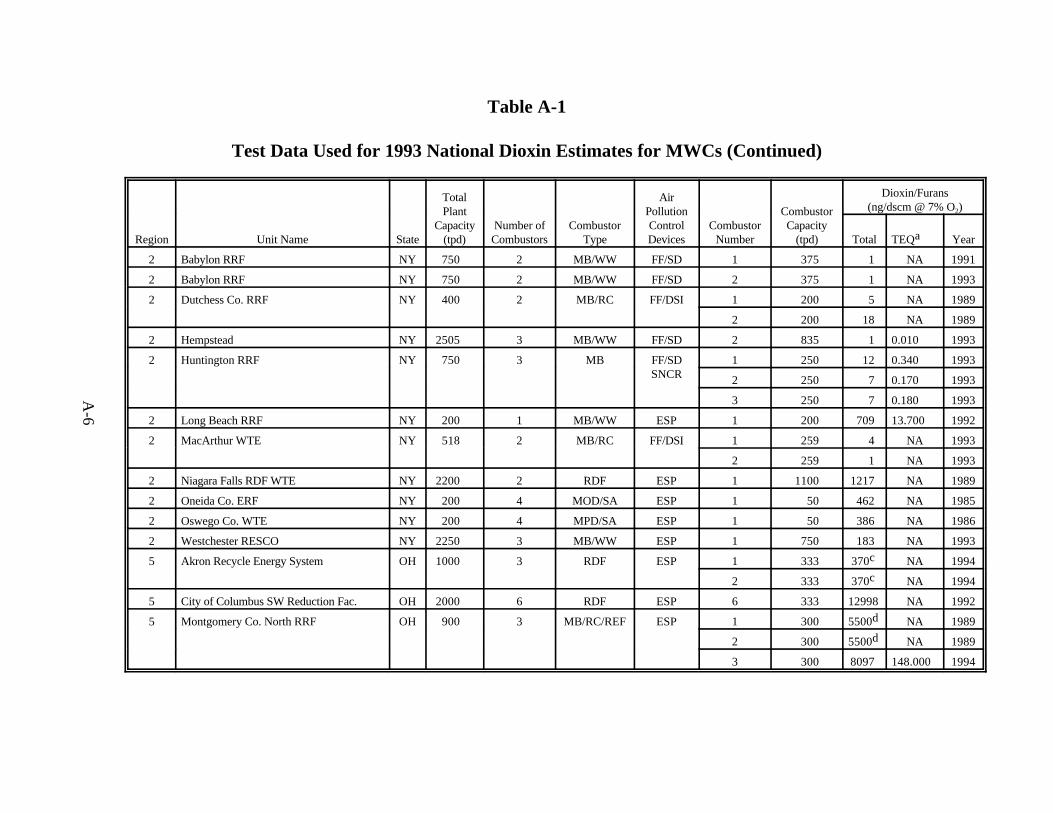
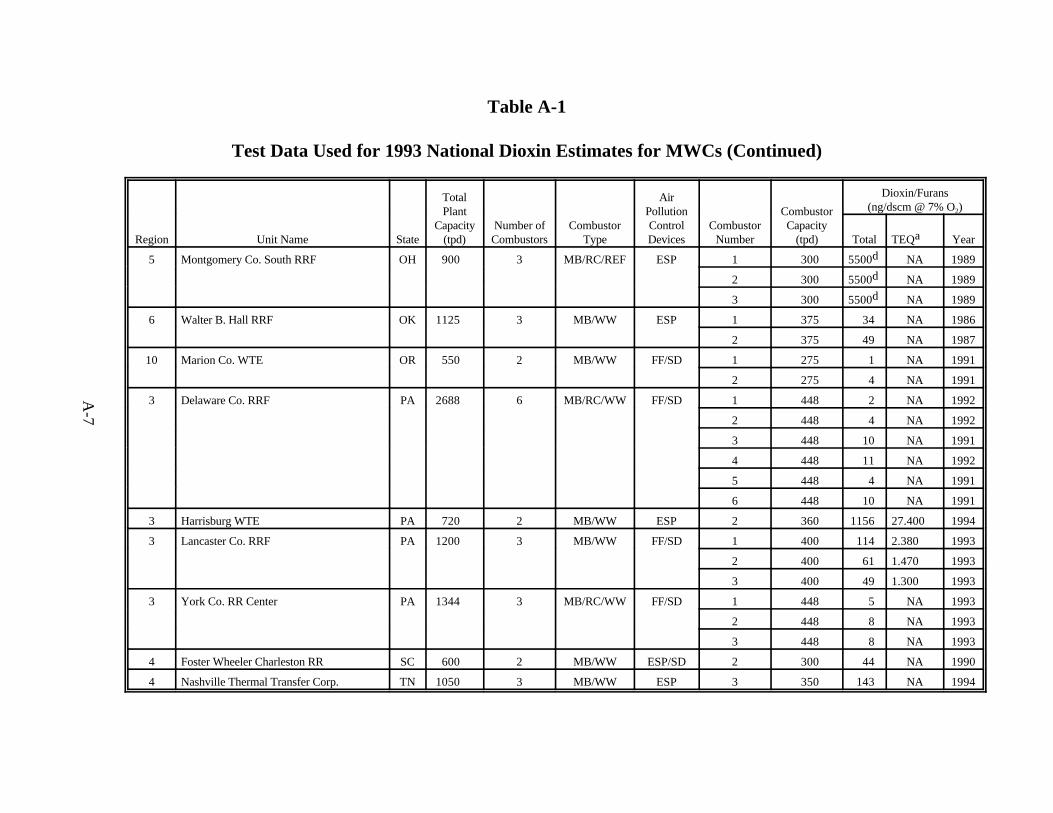
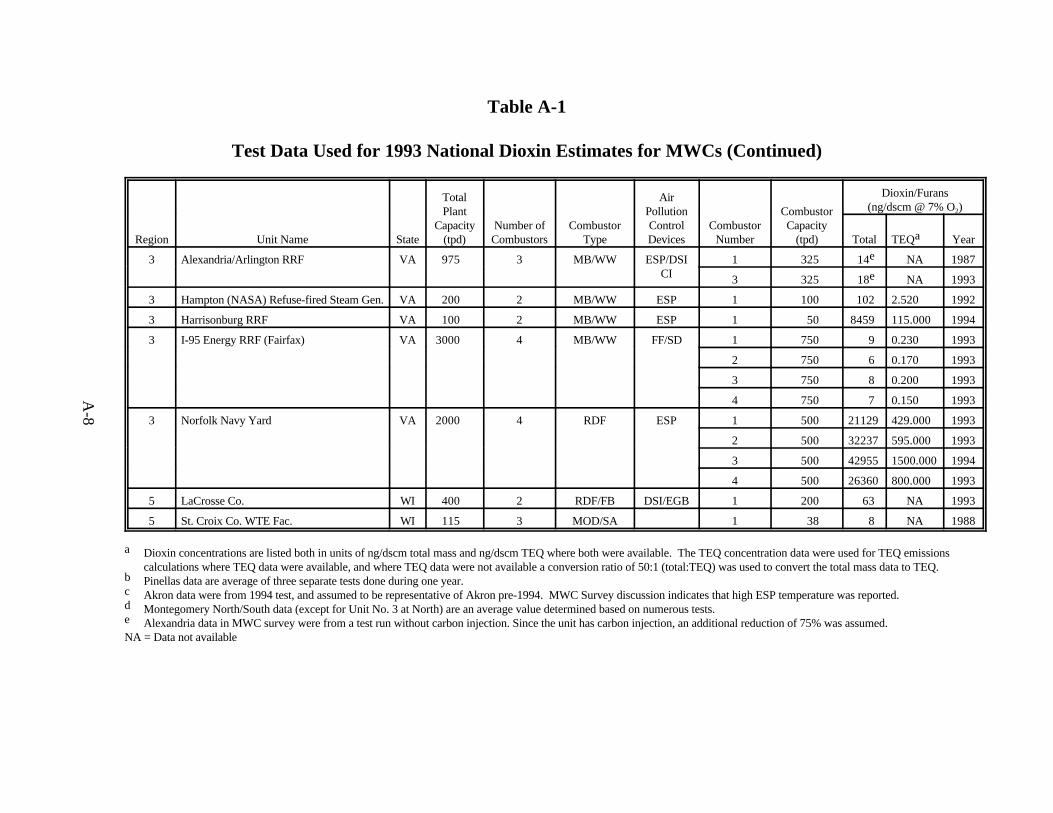
Source Locations
Of the 160 MWCs with capacities greater than 36 Mg/day (40 tpd) in operation in
the United States, 53 percent are mass burn, 31 percent are modular, and 15 percent are RDF. Of
the total MWC capacity in the United States (101,000 Mg/day [111,400 tpd]), about 69 percent is
in mass burn facilities, 26 percent in RDF facilities, and 5 percent in modular facilities. 20
Table 4-2 presents the geographic distribution of facilities and their capacities.
4-18
TABLE 4-1. AVERAGE CDD/CDF EMISSION FACTORS FOR MUNICIPAL WASTE COMBUSTORSa
Combustor Type SCC Control Device Combusted Combusted Rating Referenceblb/ton Refuse Refuse Factor Quality
kg/Mg
Mass Burn Waterwall 5-01-001-05/ Uncontrolled 1.7x10 8.4x10 A 165-03-001-12
-6 -7
5-01-001-05/ Electrostatic Precipitator 1.2x10 5.8x10 A 165-03-001-12
-6 -7
5-01-001-05/ Spray Dryer/Electrostatic 6.2x10 3.1x10 A 165-03-001-12 Precipitator
-7 -7
5-01-001-05/ Duct Sorbent Injection/Fabric 1.6x10 8.0x10 C 165-03-001-12 Filterc
-7 -8
5-01-001-05/ Spray Dryer/Fabric Filter 6.6x10 3.3x10 A 165-03-001-12
-8 -8
5-03-001-12 Duct Sorbent 4.8x10 2.4x10 E 12Injection/Electrostatic
Precipitator
-7 -7
Mass Burn/Rotary 5-01-001-06/ Duct Sorbent 9.2x10 4.6x10 D 16Waterwall 5-03-001-13 Injection/Fabric Filterc
-8 -8
5-01-001-06/ Spray Dryer/Fabric 5.3x10 2.7x10 B 165-03-001-13 Filter
-8 -8
Mass Burn/Refractory 5-01-001-04/ Uncontrolled 1.5x10 7.5x10 D 16Wall 5-03-001-11
-5 -6
5-01-001-04/ Electrostatic 7.2x10 3.6x10 D 165-03-001-11 Precipitator
-5 -5
5-01-001-04/ Duct Sorbent 4.6x10 2.3x10 E 165-03-001-11 Injection/Electrostatic
Precipitatorc
-7 -7
4-19
TABLE 4-1. AVERAGE CDD/CDF EMISSION FACTORS FOR MUNICIPAL WASTE COMBUSTORS (CONTINUED)a
Combustor Type SCC Control Device Combusted Combusted Rating Referenceb
lb/tonRefuse kg/Mg Refuse Factor Quality
Modular/Excess Air 5-01-001-07/5- Electrostatic 2.2x10 1.1x10 C 1603-001-15 Precipitator
-6 -6
5-01-001-07/5- Duct Sorbent 6.2x10 3.1x10 E 1603-001-15 Injection/Fabric Filterc
-8 -8
RDF-fired 5-01-001-03 Uncontrolled 9.5x10 4.7x10 D 16-6 -6
Electrostatic 1.7x10 8.5x10 B 16Precipitator
-5 -6
Spray 1.1x10 5.3x10 D 16Dryer/Electrostatic
Precipitator
-7 -8
Spray Dryer/Fabric 2.4x10 1.2x10 E 16Filter
-8 -8
Duct Sorbent 1.3x10 6.7x10 E 12Injection/Electrostatic
Precipitator
-6 -7
RDF-fired/Fluidized Bed 5-01-001-08 Duct Sorbent 6.2x10 3.1x10 E 12Injection/
Electrified Gravel Bed
-7 -7
Modular Starved Air 5-01-001-01/5- Uncontrolled 2.9x10 1.5x10 D 1603-001-14
-6 -6
5-01-001-01/5- Electrostatic 3.8x10 1.9x10 C 1603-001-14 Precipitator
-6 -6
5-03-001-14 Duct Sorbent 6.5x10 3.2x10 E 12Injection/Fabric Filter
-8 -8
Emission factors represent total TCDD/TCDF through OCDD/OCDF emissions.aUncontrolled = emissions measured at inlet to control device.bEmission factors for duct sorbent injection systems are based on test data for systems with PM control device operating temperatures of approximately 390 F (200 C) for masscburn/waterwall, 375 F (190 C) for mass burn/RC, 300 F (150 C) for mass burn/refractory wall, and 250 F (120 C) for modular/excess air. Emission factors can be adjustedby a factor of two for each 86 F (30 C) change in actual temperature (adjusted EF = reported EF x 2 , where T is the temperature difference in C between the actual PMT/30
control device temperature and the temperature upon which the reported EF is based).
4-20
State Number of Facilities State MWC Capacity (tpd)Percentage of Total MWC Capacity in
Electrolytic refining may be done as an additional step to produce electrolytic
copper. Electrolytic refining separates impurities from the copper by electrolysis in a solution
containing both copper sulfate and sulfuric acid. Metallic impurities form a sludge that can be
removed and treated for recovery of precious metals.
Emission Control Techniques
Generally, afterburners (usually natural gas-fired) are located at the top of the
cupola furnace and serve to complete the combustion of the exhaust gases. These afterburners
control emissions of unburned combustible PM and organic compounds.
Exhaust gases from the furnace after the afterburners are typically cooled with
water in a spray chamber and mixed with ventilation gases from the furnace charge floor and/or
ambient air. Generally, this gas stream is then passed through a fabric filter (baghouse) before
release to the atmosphere.
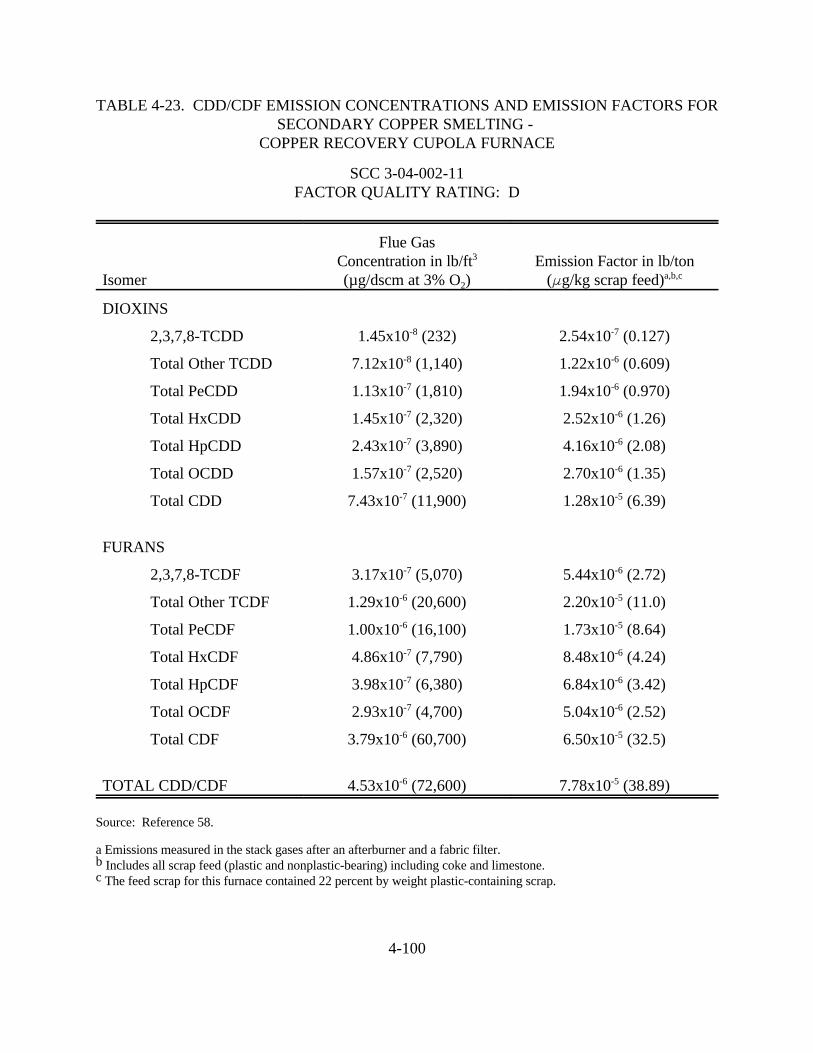
Emission Factors
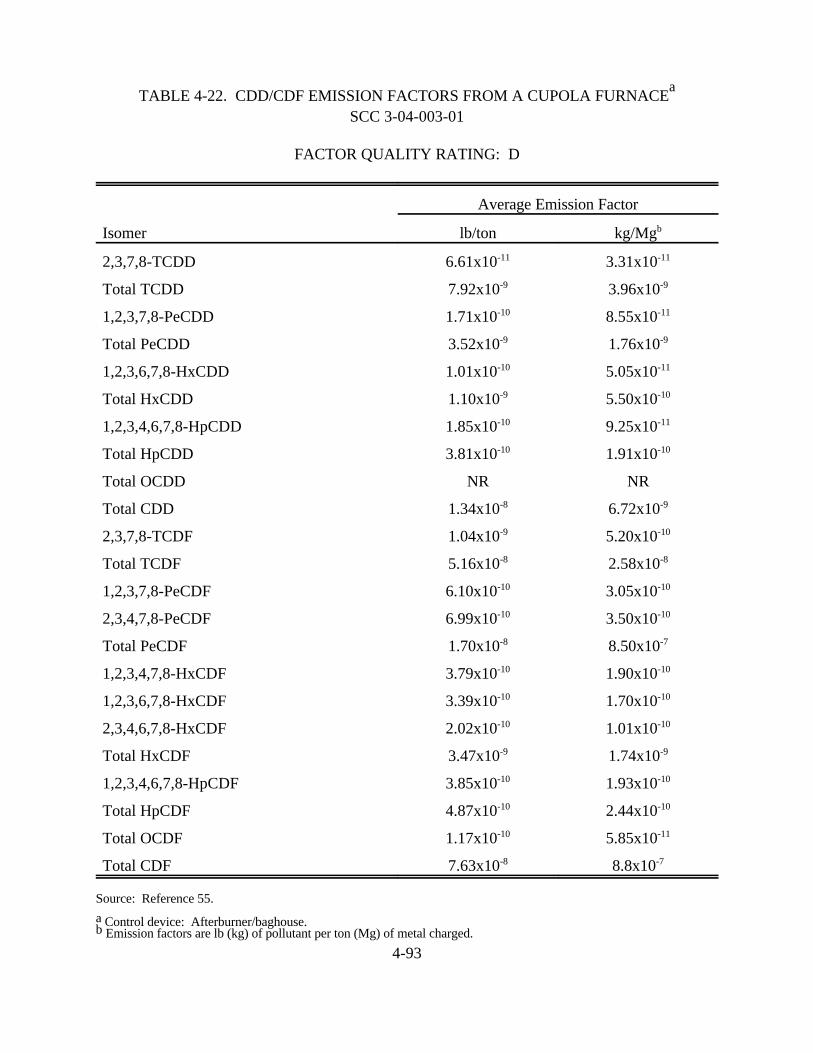
Emission factors were identified for a secondary copper recovery cupola furnace
firing scrap materials that included shredded telephone equipment, other copper-bearing metallic
scrap, metallurgical slags, and plant revert, along with coke and limestone. The shredded58
telephone equipment was composed of circuit boards, switching gear, telephone parts, and other
4-99
miscellaneous plastic parts. Some of the plastic contained in the scrap was PVC. The total
amount of telephone scrap processed accounted for 22 percent by weight of the total scrap feed.
No other scrap materials contained plastic materials.
The facility was equipped with natural gas-fired afterburners and a fabric filter.
Flue gas temperature after the afterburners averaged 1,610 F (877 C). After water spray
cooling, flue gas temperatures at the inlet to the fabric filter averaged 320 F (146 C).
Emissions of TCDD/TCDF through OCDD/OCDF were measured after the fabric
filter at the stack outlet. Table 4-23 presents CDD/CDF emissions on a flue gas-concentration
basis and as emission factors. Emission factors are based on the total weight of scrap metal
(plastic and nonplastic-bearing metal) fed to the furnace.
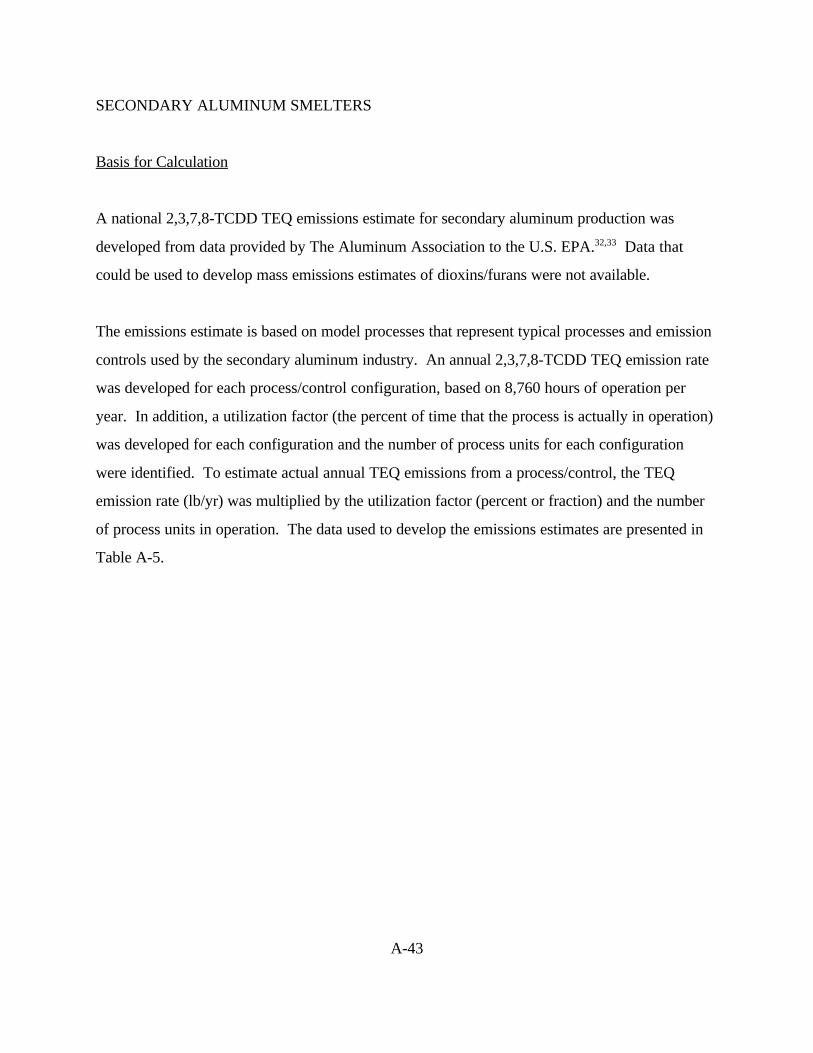
4.5.2 Secondary Aluminum Production
Secondary aluminum producers recycle aluminum from aluminum-containing
scrap, while primary aluminum producers convert bauxite ore into aluminum. The secondary
aluminum industry was responsible for 27.5 percent of domestic aluminum produced in 1989.
There are approximately 116 plants with a recovery capacity of approximately 2.6 million tons
(2.4 million megagrams) of aluminum per year. Actual total secondary aluminum production was
relatively constant during the 1980s. However, increased demand for aluminum by the
automobile industry has doubled in the last 10 years to an average of 173 pounds (78.5 kilograms)
per car. Recycling of used aluminum beverage cans (UBC) increased more than 26 percent from
1986 to 1989. In 1989, 1.4 million tons (1.3 million megagrams) of UBCs were recycled,
representing over 60 percent of cans shipped. Recycling a ton of aluminum requires only
5 percent of the energy required to refine a ton of primary aluminum from bauxite ore, making the
secondary aluminum economically viable.
4-100
SCC 3-04-002-11FACTOR QUALITY RATING: D
Isomer
Flue GasConcentration in lb/ft3
(µg/dscm at 3% O )2
Emission Factor in lb/ton( g/kg scrap feed)a,b,c
DIOXINS
2,3,7,8-TCDD 1.45x10 (232)-8 2.54x10 (0.127)-7
Total Other TCDD 7.12x10 (1,140)-8 1.22x10 (0.609)-6
Total PeCDD 1.13x10 (1,810)-7 1.94x10 (0.970)-6
Total HxCDD 1.45x10 (2,320)-7 2.52x10 (1.26)-6
Total HpCDD 2.43x10 (3,890)-7 4.16x10 (2.08)-6
Total OCDD 1.57x10 (2,520)-7 2.70x10 (1.35)-6
Total CDD 7.43x10 (11,900)-7 1.28x10 (6.39)-5
FURANS
2,3,7,8-TCDF 3.17x10 (5,070)-7 5.44x10 (2.72)-6
Total Other TCDF 1.29x10 (20,600)-6 2.20x10 (11.0)-5
Total PeCDF 1.00x10 (16,100)-6 1.73x10 (8.64)-5
Total HxCDF 4.86x10 (7,790)-7 8.48x10 (4.24)-6
Total HpCDF 3.98x10 (6,380)-7 6.84x10 (3.42)-6
Total OCDF 2.93x10 (4,700)-7 5.04x10 (2.52)-6
Total CDF 3.79x10 (60,700)-6 6.50x10 (32.5)-5
TOTAL CDD/CDF 4.53x10 (72,600)-6 7.78x10 (38.89)-5
Source: Reference 58.
a Emissions measured in the stack gases after an afterburner and a fabric filter. Includes all scrap feed (plastic and nonplastic-bearing) including coke and limestone.b The feed scrap for this furnace contained 22 percent by weight plastic-containing scrap.c
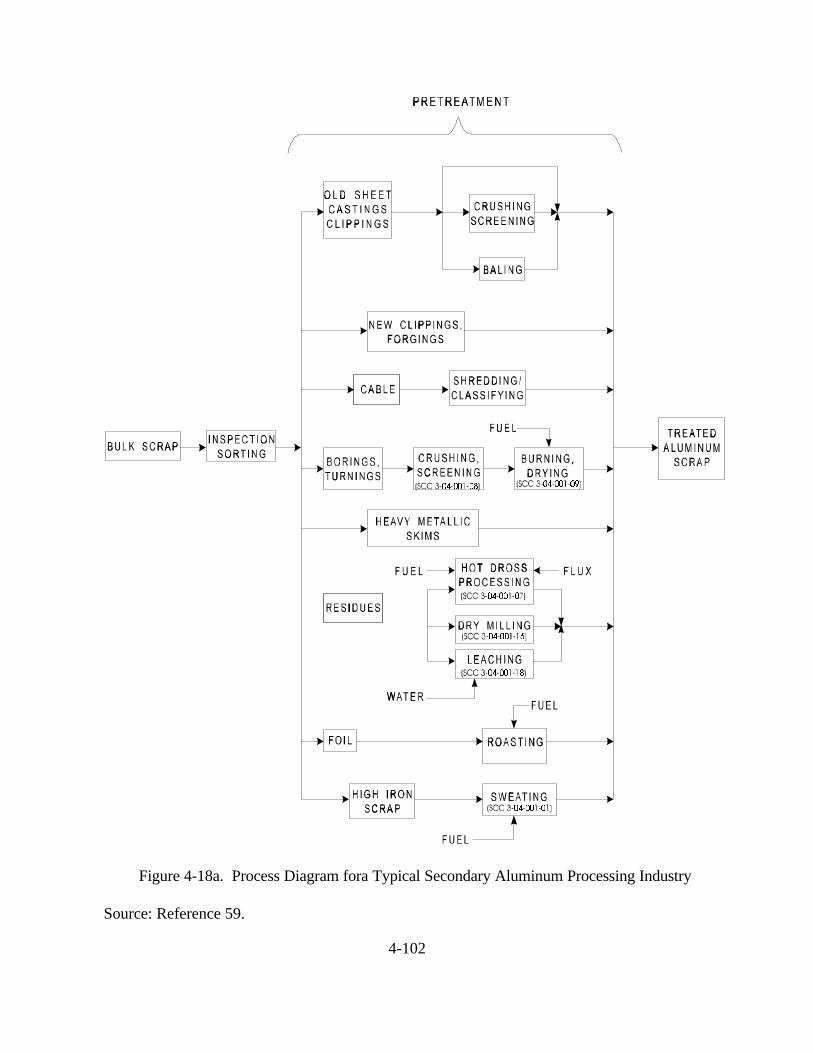
Secondary aluminum production involves two general categories of operations--
scrap pretreatment and smelting/refining. Pretreatment operations include sorting, processing,
and cleaning scrap. Smelting/refining operations include cleaning, melting, refining, alloying, and
pouring of aluminum recovered from scrap. The processes used to convert scrap aluminum to
products such as lightweight aluminum alloys for industrial castings are in involved at any one
facility. Some steps may be combined or reordered, depending on the type of scrap used (see
Figures 4-18a and 4-18b). Some or all the steps in these figures may be quality, source of scrap,
auxiliary equipment available, furnace design, and product specifications. Plant configuration,
scrap type usage, and product output varies throughout the secondary aluminum industry.
Scrap Pretreatment--Aluminum scrap comes from a variety of sources. "New"
scrap is generated by pre-consumer sources, such as drilling and machining of aluminum castings,
scrap from aluminum fabrication and manufacturing operations, and aluminum bearing residual
material (dross) skimmed off molten aluminum during smelting operations. "Old" aluminum scrap
is material that has been used by the consumer and discarded. Examples of old scrap include used
appliances, aluminum foil, automobile and airplane parts, aluminum siding, and beverage cans.59
Scrap pretreatment involves sorting and processing scrap to remove contaminants
and to prepare the material for smelting. Sorting and processing separates the aluminum from
other metals, dirt, oil, plastics, and paint. Pretreatment cleaning processes are based on
mechanical, pyrometallurgical, and hydrometallurgical techniques.
Mechanical Cleaning: Mechanical cleaning includes the physical separation of
aluminum from other scrap, with hammer mills, ring rushers, and other machines to break scrap
containing aluminum into smaller pieces. This improves the efficiency of downstream recovery by
magnetic removal of iron. Other recovery processes include vibratory screens and air classifiers.
4-102
Figure 4-18a. Process Diagram fora Typical Secondary Aluminum Processing Industry
Source: Reference 59.
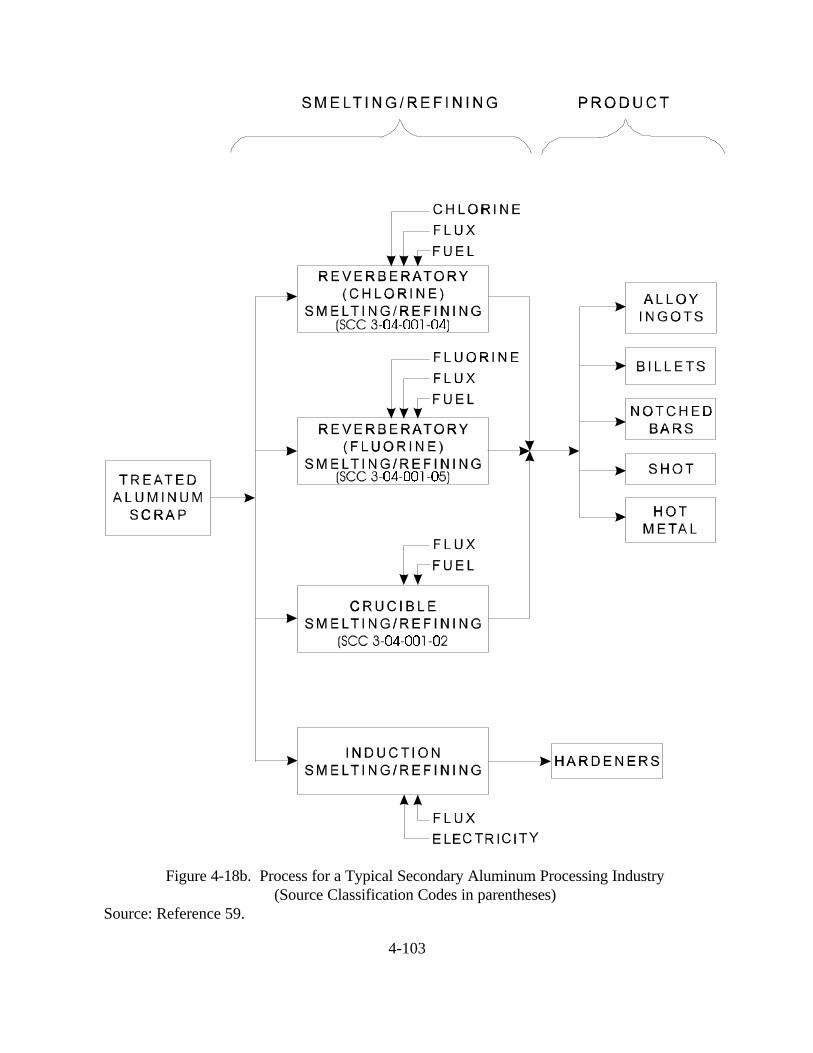
4-103
Figure 4-18b. Process for a Typical Secondary Aluminum Processing Industry(Source Classification Codes in parentheses)
Source: Reference 59.
4-104
An example of mechanical cleaning is the dry milling process. Cold aluminum-
laden dross and other residues are processed by milling and screening to obtain a product
containing at least 60 to 70 percent aluminum. Ball, rod, or hammer mills can be used to reduce
oxides and nonmetallic particles to fine powders for ease of removal during screening.
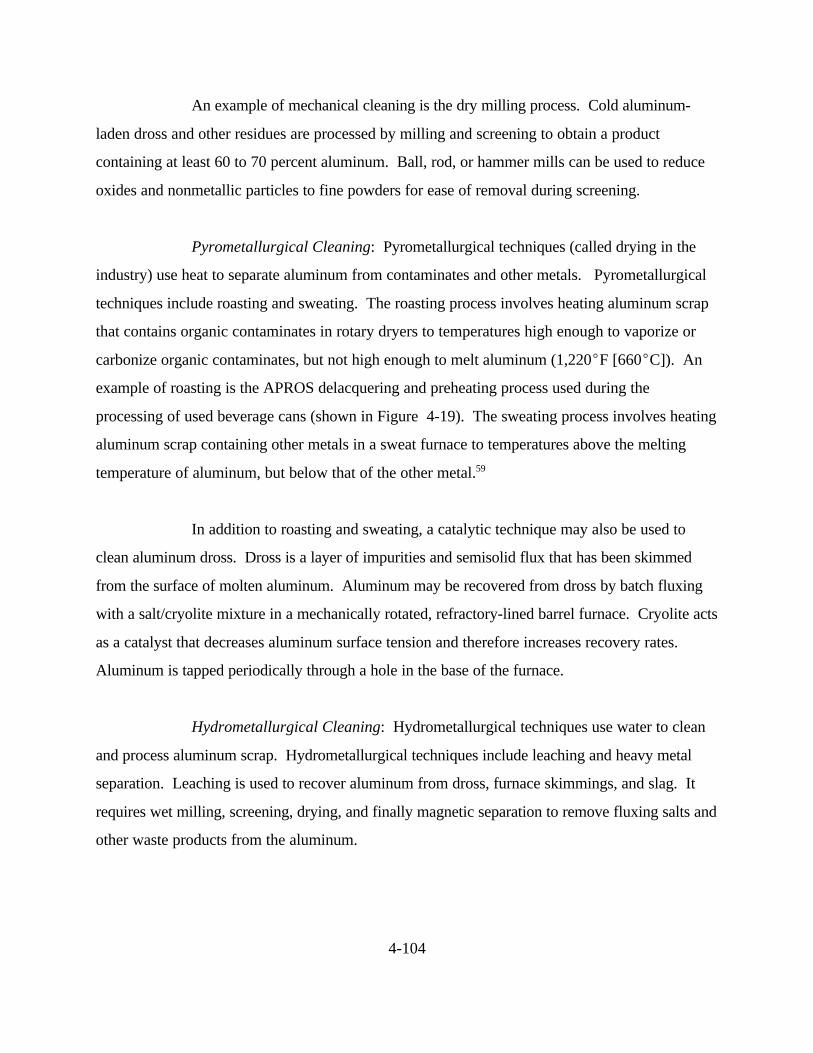
Pyrometallurgical Cleaning: Pyrometallurgical techniques (called drying in the
industry) use heat to separate aluminum from contaminates and other metals. Pyrometallurgical
techniques include roasting and sweating. The roasting process involves heating aluminum scrap
that contains organic contaminates in rotary dryers to temperatures high enough to vaporize or
carbonize organic contaminates, but not high enough to melt aluminum (1,220 F [660 C]). An
example of roasting is the APROS delacquering and preheating process used during the
processing of used beverage cans (shown in Figure 4-19). The sweating process involves heating
aluminum scrap containing other metals in a sweat furnace to temperatures above the melting
temperature of aluminum, but below that of the other metal.59
In addition to roasting and sweating, a catalytic technique may also be used to
clean aluminum dross. Dross is a layer of impurities and semisolid flux that has been skimmed
from the surface of molten aluminum. Aluminum may be recovered from dross by batch fluxing
with a salt/cryolite mixture in a mechanically rotated, refractory-lined barrel furnace. Cryolite acts
as a catalyst that decreases aluminum surface tension and therefore increases recovery rates.
Aluminum is tapped periodically through a hole in the base of the furnace.
Hydrometallurgical Cleaning: Hydrometallurgical techniques use water to clean
and process aluminum scrap. Hydrometallurgical techniques include leaching and heavy metal
separation. Leaching is used to recover aluminum from dross, furnace skimmings, and slag. It
requires wet milling, screening, drying, and finally magnetic separation to remove fluxing salts and
other waste products from the aluminum.
4-105
Figure 4-19. APROS Delacquering and Preheating Process
Source: Reference 59.
4-106
The heavy metal separation hydrometallurgical process separates high density
metal from low density metal using a viscous medium, such as copper and iron, from aluminum.
Heavy metal separation has been used to concentrate aluminum recovered from shredded cars.
The cars are shredded after large aluminum components have been removed (shredded material
contains approximately 30 percent aluminum) and processed in heavy media to further
concentrate aluminum to 80 percent or more.
Smelting/Refining--After scrap pretreatment, smelting and refining is performed.
Smelting and refining in secondary aluminum recovery takes place primarily in reverberatory
furnaces. These furnaces are brick-lined and constructed with a curved roof. The term
reverberatory is used because heat rising from ignited fuel is reflected (reverberated) back down
from the curved furnace roof and into the melted charge. A typical reverberatory furnace has an
enclosed melt area where the flame heatsource operates directly above the molten aluminum. The
furnace charging well is connected to the melt area by channels through which molten aluminum is
pumped from the melt area into the charging well. Aluminum flows back into the melt section of
the furnace under gravity.
Most secondary aluminum recovery facilities use batch processing in smelting and
refining operations. It is common for one large melting reverberatory furnace to support the59
flow requirements for two or more smaller holding furnaces. The melting furnace is used to melt
the scrap, and remove impurities and entrained gases. The molten aluminum is then pumped into
a holding furnace. Holding furnaces are better suited for final alloying, and for making any
additional adjustments necessary to ensure that the aluminum meets product specifications.
Pouring takes place from holding furnaces, either into molds or as feedstock for continuous
casters.
Smelting and refining operations can involve the following steps: charging,
melting, fluxing, demagging, degassing, alloying, skimming, and pouring.
4-107
The crucible smelting/refining process is used to melt small batches of aluminum
scrap, generally limited to 1,100 lb (500 kg) or less. The metal-treating process steps are
essentially the same as those of reverberatory furnaces.
The induction smelting and refining process is designed to produce aluminum
alloys with increased strength and hardness by blending aluminum and hardening agents in an
electric induction furnace. The process steps include charging scrap, melting, adding and blending
the hardening agent, skimming, pouring, and casting into notched bars. Hardening agents include
manganese and silicon.
Emissions
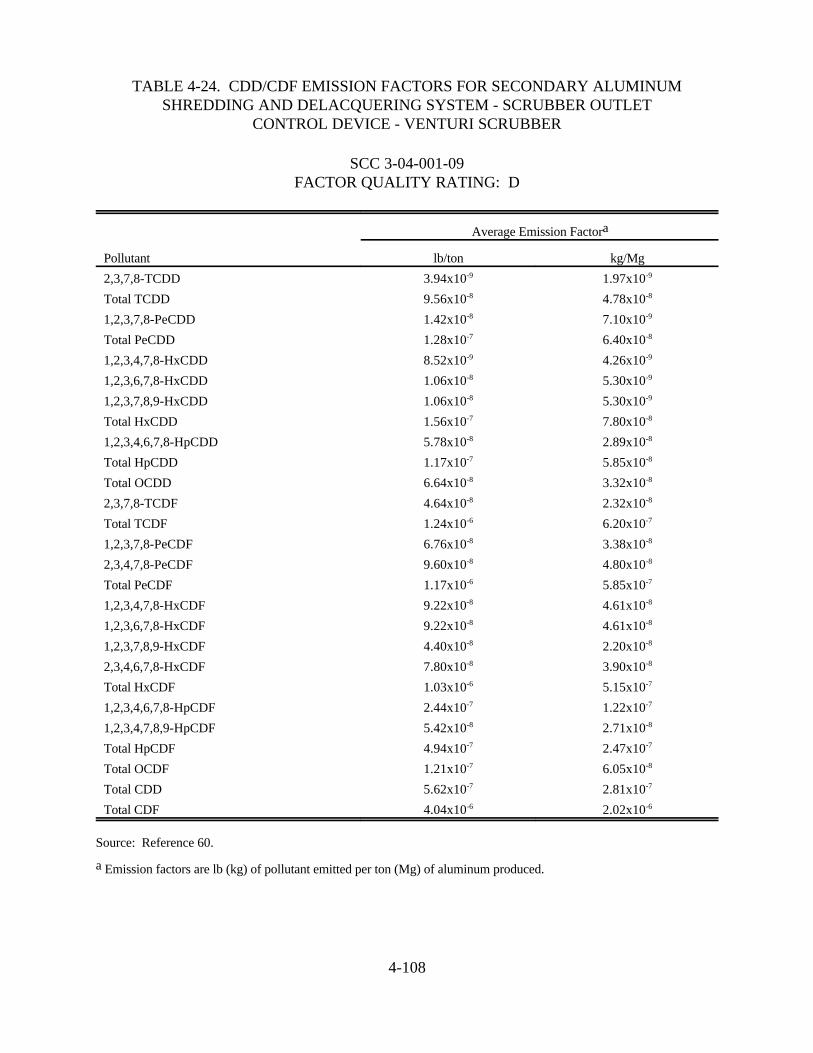
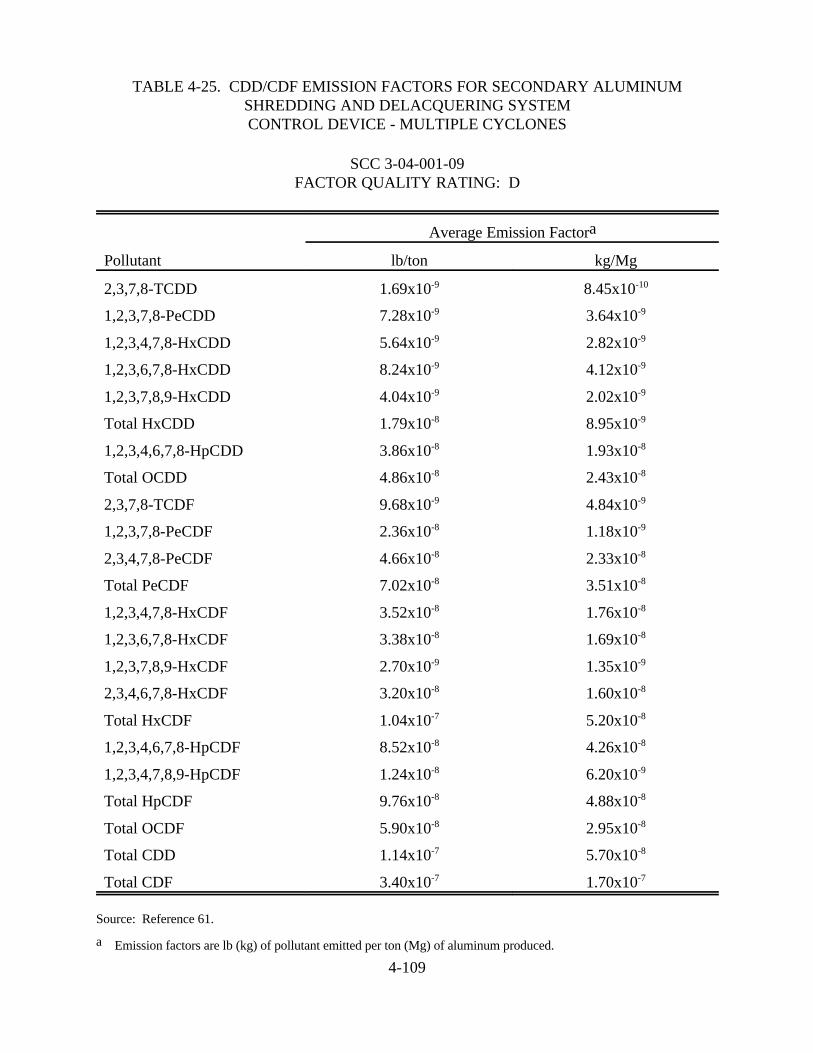
The major sources of emissions from scrap pretreatment processes are scrap driers,
sweat furnaces, and UBC delacquering systems. Tables 4-24 and 4-25 present CDD/CDF60
emission factors for two separate delacquering systems. Control devices included a venturi
scrubber (Table 4-24) and multiple cyclones (Table 4-25).
Controls--Mechanical cleaning techniques involve crushing, shredding, and
screening and produce metallic and nonmetallic particulates. Burning and drying operations
(pyrometallurgic techniques) emit particulates and organic vapors. Emissions from reverberatory
furnaces represent a significant fraction of the total particulate and gaseous effluent generated in
the secondary aluminum industry. Afterburners are frequently used to incinerate unburned VOCs.
Oxidized aluminum fines blown out of the dryer by the combustion gases contain particulate
emissions. Wet scrubbers or fabric filters are sometimes used in conjunction with afterburners.
Mechanically generated dust from rotating barrel dross furnaces constitutes the
main air emission of hot dross processing. Some fumes are produced from the fluxing reactions.
4-108
SCC 3-04-001-09FACTOR QUALITY RATING: D
Pollutant
Average Emission Factor a
lb/ton kg/Mg2,3,7,8-TCDD 3.94x10⁻⁹ 1.97x10⁻⁹
Total TCDD 9.56x10⁻⁸ 4.78x10⁻⁸
1,2,3,7,8-PeCDD 1.42x10⁻⁸ 7.10x10⁻⁹
Total PeCDD 1.28x10⁻⁷ 6.40x10⁻⁸
1,2,3,4,7,8-HxCDD 8.52x10⁻⁹ 4.26x10⁻⁹
1,2,3,6,7,8-HxCDD 1.06x10⁻⁸ 5.30x10⁻⁹
1,2,3,7,8,9-HxCDD 1.06x10⁻⁸ 5.30x10⁻⁹
Total HxCDD 1.56x10⁻⁷ 7.80x10⁻⁸
1,2,3,4,6,7,8-HpCDD 5.78x10⁻⁸ 2.89x10⁻⁸
Total HpCDD 1.17x10⁻⁷ 5.85x10⁻⁸
Total OCDD 6.64x10⁻⁸ 3.32x10⁻⁸
2,3,7,8-TCDF 4.64x10⁻⁸ 2.32x10⁻⁸
Total TCDF 1.24x10⁻⁶ 6.20x10⁻⁷
1,2,3,7,8-PeCDF 6.76x10⁻⁸ 3.38x10⁻⁸
2,3,4,7,8-PeCDF 9.60x10⁻⁸ 4.80x10⁻⁸
Total PeCDF 1.17x10⁻⁶ 5.85x10⁻⁷
1,2,3,4,7,8-HxCDF 9.22x10⁻⁸ 4.61x10⁻⁸
1,2,3,6,7,8-HxCDF 9.22x10⁻⁸ 4.61x10⁻⁸
1,2,3,7,8,9-HxCDF 4.40x10⁻⁸ 2.20x10⁻⁸
2,3,4,6,7,8-HxCDF 7.80x10⁻⁸ 3.90x10⁻⁸
Total HxCDF 1.03x10⁻⁶ 5.15x10⁻⁷
1,2,3,4,6,7,8-HpCDF 2.44x10⁻⁷ 1.22x10⁻⁷
1,2,3,4,7,8,9-HpCDF 5.42x10⁻⁸ 2.71x10⁻⁸
Total HpCDF 4.94x10⁻⁷ 2.47x10⁻⁷
Total OCDF 1.21x10⁻⁷ 6.05x10⁻⁸
Total CDD 5.62x10⁻⁷ 2.81x10⁻⁷
Total CDF 4.04x10⁻⁶ 2.02x10⁻⁶
Source: Reference 60.
Emission factors are lb (kg) of pollutant emitted per ton (Mg) of aluminum produced. a
TABLE 4-24. CDD/CDF EMISSION FACTORS FOR SECONDARY ALUMINUMSHREDDING AND DELACQUERING SYSTEM - SCRUBBER OUTLET
CONTROL DEVICE - VENTURI SCRUBBER
4-109
SCC 3-04-001-09FACTOR QUALITY RATING: D
Pollutant
Average Emission Factora
lb/ton kg/Mg
2,3,7,8-TCDD 1.69x10⁻⁹ 8.45x10⁻¹⁰
1,2,3,7,8-PeCDD 7.28x10⁻⁹ 3.64x10⁻⁹
1,2,3,4,7,8-HxCDD 5.64x10⁻⁹ 2.82x10⁻⁹
1,2,3,6,7,8-HxCDD 8.24x10⁻⁹ 4.12x10⁻⁹
1,2,3,7,8,9-HxCDD 4.04x10⁻⁹ 2.02x10⁻⁹
Total HxCDD 1.79x10⁻⁸ 8.95x10⁻⁹
1,2,3,4,6,7,8-HpCDD 3.86x10⁻⁸ 1.93x10⁻⁸
Total OCDD 4.86x10⁻⁸ 2.43x10⁻⁸
2,3,7,8-TCDF 9.68x10⁻⁹ 4.84x10⁻⁹
1,2,3,7,8-PeCDF 2.36x10⁻⁸ 1.18x10⁻⁹
2,3,4,7,8-PeCDF 4.66x10⁻⁸ 2.33x10⁻⁸
Total PeCDF 7.02x10⁻⁸ 3.51x10⁻⁸
1,2,3,4,7,8-HxCDF 3.52x10⁻⁸ 1.76x10⁻⁸
1,2,3,6,7,8-HxCDF 3.38x10⁻⁸ 1.69x10⁻⁸
1,2,3,7,8,9-HxCDF 2.70x10⁻⁹ 1.35x10⁻⁹
2,3,4,6,7,8-HxCDF 3.20x10⁻⁸ 1.60x10⁻⁸
Total HxCDF 1.04x10⁻⁷ 5.20x10⁻⁸
1,2,3,4,6,7,8-HpCDF 8.52x10⁻⁸ 4.26x10⁻⁸
1,2,3,4,7,8,9-HpCDF 1.24x10⁻⁸ 6.20x10⁻⁹
Total HpCDF 9.76x10⁻⁸ 4.88x10⁻⁸
Total OCDF 5.90x10⁻⁸ 2.95x10⁻⁸
Total CDD 1.14x10⁻⁷ 5.70x10⁻⁸
Total CDF 3.40x10⁻⁷ 1.70x10⁻⁷
Source: Reference 61.
Emission factors are lb (kg) of pollutant emitted per ton (Mg) of aluminum produced.a
TABLE 4-25. CDD/CDF EMISSION FACTORS FOR SECONDARY ALUMINUMSHREDDING AND DELACQUERING SYSTEMCONTROL DEVICE - MULTIPLE CYCLONES
4-110
Fugitive emissions are controlled by enclosing the barrel furnace in a hood system and by ducting
the emissions to a fabric filter. Furnace offgas emissions, mainly fluxing salt fume, are often
controlled by a venturi scrubber.
4.5.3 Secondary Lead Production
In 1990, primary and secondary smelters in the United States produced
1,380,000 tons (1,255,000 Mg) of lead. Secondary lead smelters produced 948,000 tons
(860,000 Mg) or about 69 percent of the total refined lead produced in 1990; primary smelters
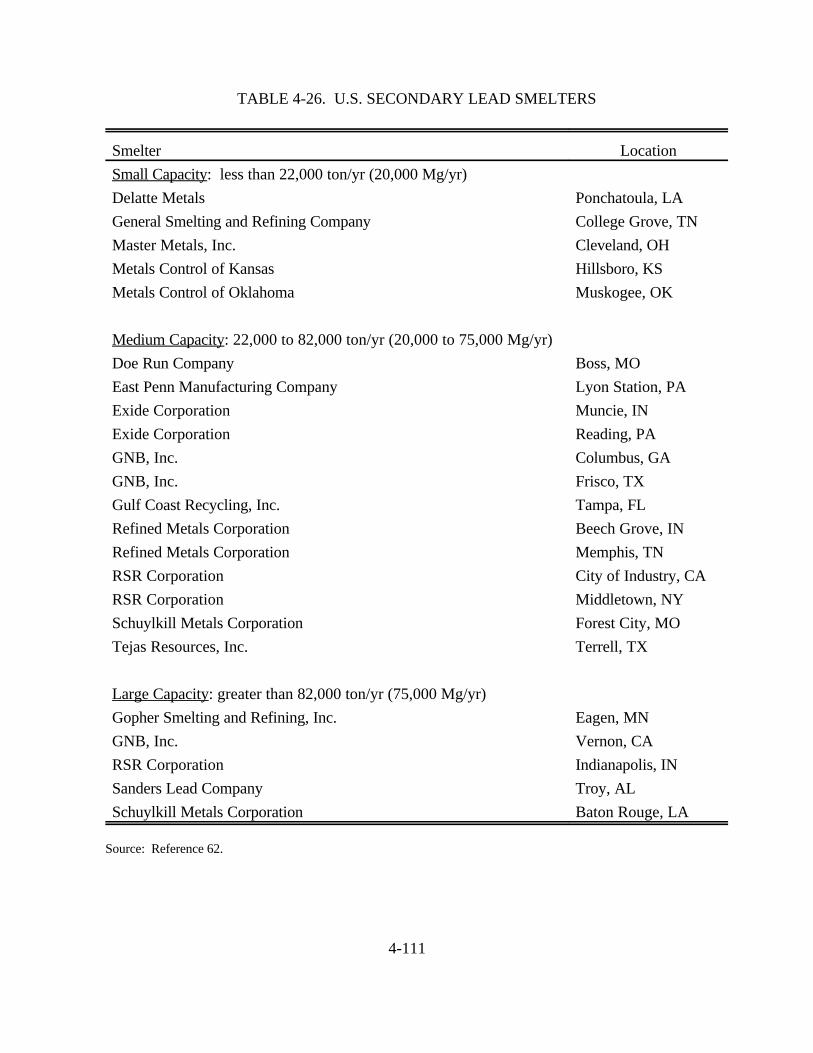
produced 434,000 tons (395,000 Mg). Table 4-26 lists U.S. secondary lead smelters according62
to their annual lead production capacity.
Process Description
The secondary lead smelting industry produces elemental lead and lead alloys by
reclaiming lead, mainly from scrap automobile batteries. Blast, reverberatory, rotary, and electric
furnaces are used for smelting scrap lead and producing secondary lead. Smelting is the reduction
of lead compounds to elemental lead in a high-temperature furnace. It requires higher
temperatures (2,200 to 2,300 F [1,200 to 1,260 C]) than those required for melting elemental
lead (621 F [327 C]). Secondary lead may be refined to produce soft lead (which is nearly pure
lead) or alloyed to produce hard lead alloys. Fifty percent of the lead produced by secondary lead
smelters is hard lead, and fifty percent is soft. About 80 percent of all lead in the United States
goes to producing new batteries. 62
Lead-acid batteries represent about 90 percent of the raw materials at a typical
secondary lead smelter, although this percentage may vary from one plant to the next. These
batteries contain approximately 18 lb (8.2 kg) of lead per battery consisting of 40 percent lead
alloys and 60 percent lead oxide. Other types of lead-bearing raw materials recycled by secondary
lead smelters include drosses (lead-containing byproducts of lead refining), which may be
4-111
Smelter LocationSmall Capacity: less than 22,000 ton/yr (20,000 Mg/yr)Delatte Metals Ponchatoula, LAGeneral Smelting and Refining Company College Grove, TNMaster Metals, Inc. Cleveland, OHMetals Control of Kansas Hillsboro, KSMetals Control of Oklahoma Muskogee, OK
Medium Capacity: 22,000 to 82,000 ton/yr (20,000 to 75,000 Mg/yr)Doe Run Company Boss, MOEast Penn Manufacturing Company Lyon Station, PAExide Corporation Muncie, INExide Corporation Reading, PAGNB, Inc. Columbus, GAGNB, Inc. Frisco, TXGulf Coast Recycling, Inc. Tampa, FLRefined Metals Corporation Beech Grove, INRefined Metals Corporation Memphis, TNRSR Corporation City of Industry, CARSR Corporation Middletown, NYSchuylkill Metals Corporation Forest City, MOTejas Resources, Inc. Terrell, TX
Large Capacity: greater than 82,000 ton/yr (75,000 Mg/yr)Gopher Smelting and Refining, Inc. Eagen, MNGNB, Inc. Vernon, CARSR Corporation Indianapolis, INSanders Lead Company Troy, ALSchuylkill Metals Corporation Baton Rouge, LA
Source: Reference 62.
TABLE 4-26. U.S. SECONDARY LEAD SMELTERS
4-112
purchased from companies that perform lead alloying or refining but not smelting; battery plant
scrap, such as defective grids or paste; and scrap lead, such as old pipes or roof flashing. Other
scrap lead sources include cable sheathing, solder, and babbitt metal.62
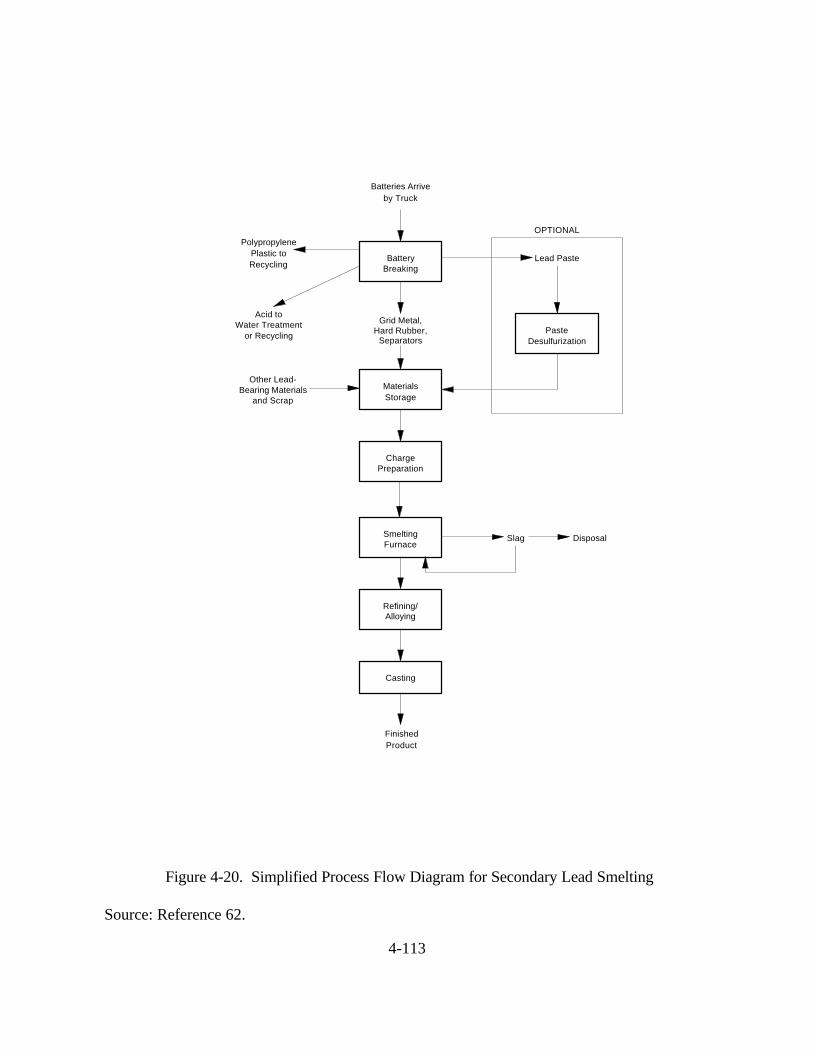
As illustrated in Figure 4-20, the normal sequence of operations in a secondary
lead smelter is scrap receiving, charge preparation, furnace smelting, and lead refining and
alloying. In all plants, scrap batteries are first sawed or broken open to remove the lead alloy
plates and lead oxide paste material. At blast furnace smelters, a slow-speed saw is used to
remove the top of the case, the plates are dumped from the case, and whole grids are charged to
the furnace. At other types of smelters, hammermills or other crushing/shredding devices are used
to break open the battery cases. Float/sink separation systems are typically used to separate
plastic battery parts, lead terminals, lead oxide paste, and hard rubber used in older batteries. The
majority of lead smelters recover the crushed polypropylene plastic materials for recycling. Hard
rubber materials are usually charged to the furnace.
Paste desulfurization is an optional feed material processing step used by some
secondary lead smelters. It involves the separation of lead sulfate and lead oxide paste from the
lead grid metal, polypropylene plastic cases, separators, and hard rubber battery cases. The next
step is the chemical conversion of lead sulfate in the lead battery paste to lead oxide. This process
improves furnace efficiency by reducing the need for fluxing agents to reduce lead-sulfur
compounds to lead metal. The process also reduces SO furnace emissions. However, SO2 2
emissions reduction is usually a less important consideration because many plants that perform
paste desulfurization are also equipped with SO scrubbers. About half of all smelters perform2
paste desulfurization.62
After removing the lead components from the scrap batteries, the lead scrap is
combined with other charge materials such as refining drosses, flue dust, furnace slag, coke,
limestone, and sand and fed to either a reverberatory, blast, rotary or electric smelting furnace.
Batteries Arriveby Truck
Battery
MaterialsStorage
PasteDesulfurization
Breaking
Grid Metal,Hard Rubber,
Separators
Acid toWater Treatment
or Recycling
Lead Paste
PolypropylenePlastic toRecycling
Other Lead-Bearing Materials
and Scrap
SmeltingFurnace
Refining/Alloying
Casting
FinishedProduct
Slag Disposal
ChargePreparation
OPTIONAL
4-113
Figure 4-20. Simplified Process Flow Diagram for Secondary Lead Smelting
Source: Reference 62.
4-114
Smelting furnaces are used to produce crude lead bullion, which is refined and/or alloyed into final
lead products.
Refining, the final step in secondary lead production, consists of removing
impurities and adding alloying metals to the molten lead obtained from the smelting furnaces to
meet a customer's specifications. Refining kettles are used for the purifying and alloying of
molten lead.
Blast and reverberatory furnaces are currently the most common types of smelting
furnaces in the industry, although some new plants are using rotary furnaces. There are
approximately 15 reverberatory furnaces, 24 blast furnaces, 5 rotary furnaces, and 1 electric
furnace in the secondary lead industry. The following discussion provides process descriptions62
of these four types of secondary lead smelters.
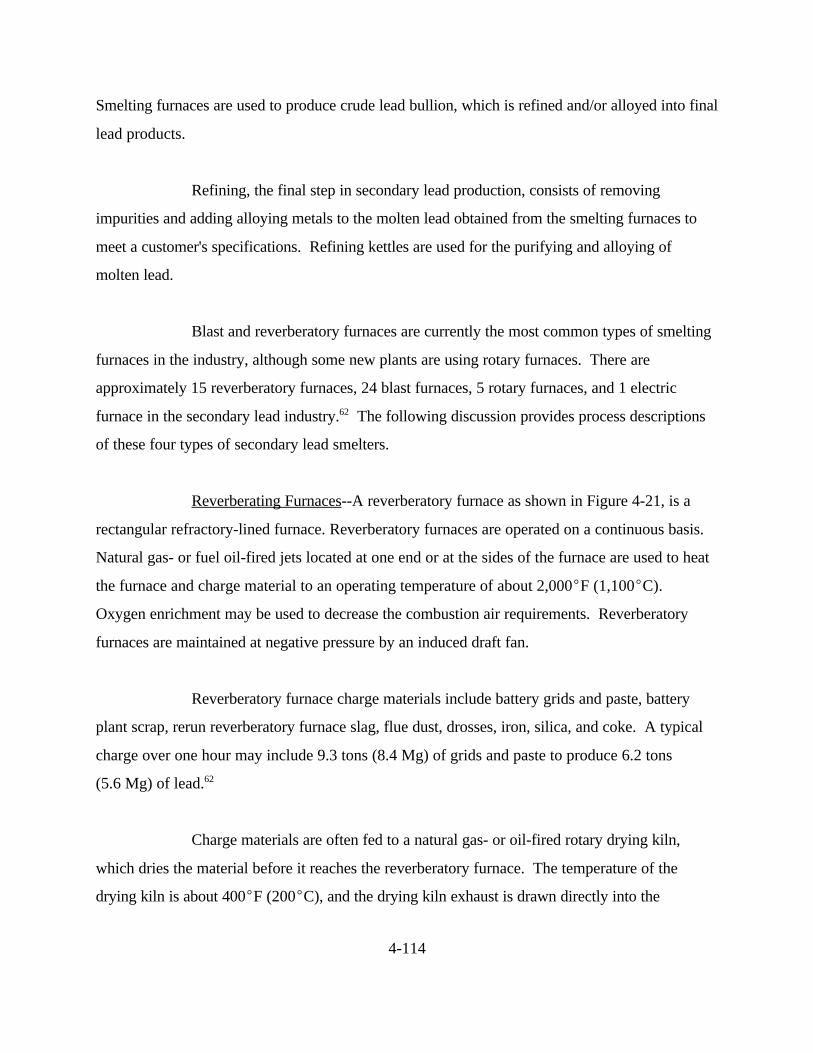
Reverberating Furnaces--A reverberatory furnace as shown in Figure 4-21, is a
rectangular refractory-lined furnace. Reverberatory furnaces are operated on a continuous basis.
Natural gas- or fuel oil-fired jets located at one end or at the sides of the furnace are used to heat
the furnace and charge material to an operating temperature of about 2,000 F (1,100 C).
Oxygen enrichment may be used to decrease the combustion air requirements. Reverberatory
furnaces are maintained at negative pressure by an induced draft fan.
Reverberatory furnace charge materials include battery grids and paste, battery
plant scrap, rerun reverberatory furnace slag, flue dust, drosses, iron, silica, and coke. A typical
charge over one hour may include 9.3 tons (8.4 Mg) of grids and paste to produce 6.2 tons
(5.6 Mg) of lead.62
Charge materials are often fed to a natural gas- or oil-fired rotary drying kiln,
which dries the material before it reaches the reverberatory furnace. The temperature of the
drying kiln is about 400 F (200 C), and the drying kiln exhaust is drawn directly into the
Lead Well and TapHydraulic Charge Ram
Burner
Charge ChuteFlue
Lead
Slag Layer
Slag Tap
Molten
4-115
Figure 4-21. Cross-sectional View of a Typical Stationary Reverberatory Furance
Source: Reference 62.
PbSO4 C Pb CO2 SO2
2PbO C 2Pb CO2
4-116
reverberatory furnace or ventilated to a control device. From the rotary drying kiln, the feed is
either dropped into the top of the furnace through a charging chute, or fed into the furnace at
fixed intervals with a hydraulic ram. In furnaces that use a feed chute, a hydraulic ram is often
used as a stoker to move the material down the furnace.62
Reverberatory furnaces are used to produce a soft (nearly pure) lead product and a
lead-bearing slag. This is done by controlling the reducing conditions in the furnace so that lead
components are reduced to metallic lead bullion and the alloying elements (antimony, tin, arsenic)
in the battery grids, posts, straps, and connectors are oxidized and removed in the slag. The
reduction of PbSO and PbO is promoted by the carbon-containing coke added to the charge4
material:
The PbSO and PbO also react with the alloying elements to form lead bullion and4
oxides of the alloying elements; the latter are removed in the slag.
The molten lead collects in a pool at the lowest part of the hearth. Slag collects in
a layer on top of this pool and retards further oxidation of the lead. The slag is made up of
molten fluxing agents such as iron, silica, and lime, and typically has significant quantities of lead.
Slag is usually tapped continuously and lead is tapped intermittently. The slag is tapped into a
crucible. The slag tap and crucible are hooded and vented to a control device. Reverberatory
furnace slag usually has a high lead content (as much as 70 percent by weight) and is used as feed
material in a blast or electric furnace to recover the lead content. Reverberatory furnace slag may
also be rerun through the reverberatory furnace during special slag campaigns before being sent to
a blast or electric furnace. Lead may be tapped into a crucible or directly into a holding kettle.
The lead tap is usually hooded and vented to a control device.62
4-117
Blast Furnaces--A blast furnace as shown in Figure 4-22, is a vertical furnace that
consists of a crucible with a vertical cylinder affixed to the top. The crucible is refractory-lined
and the vertical cylinder consists of a steel water jacket. Oxygen-enriched combustion air is
introduced into the furnace through tuyeres located around the base of the cylinder.
Charge materials are pre-weighed to ensure the proper mixture and then
introduced into the top of the cylinder using a skip hoist, a conveyor, or a front-end loader. The
charge fills nearly the entire cylinder. Charge material is added periodically to keep the level of
the charge at a consistent working height while lead and slag are tapped from the crucible. Coke
is added to the charge as the primary fuel, although natural gas jets may be used to start the
combustion process. Combustion is self-sustaining as long as there is sufficient coke in the charge
material. Combustion occurs in the layer of the charge nearest the tuyeres.
At plants that operate only blast furnaces, the lead-bearing charge materials may
include broken battery components, drosses from the refining kettles, agglomerated flue dust, and
lead-bearing slag. A typical charge over one hour may include 4.8 tons (4.4 Mg) of grids and
paste, 0.3 tons (0.3 Mg) of coke, 0.1 tons (0.1 Mg) of calcium carbonate, 0.07 tons (0.06 Mg) of
silica, 0.5 tons (0.4 Mg) of cast iron, and 0.2 tons (0.2 Mg) of rerun blast furnace slag, to produce
3.7 tons (3.3 Mg) of lead. At plants that also have a reverberatory furnace, the charge materials
will also include lead-bearing reverberatory furnace slag.62
Blast furnaces are designed and operated to produce a hard (high alloy content)
lead product by achieving more reducing furnace conditions than those typically found in a
reverberatory furnace. Fluxing agents include iron, soda ash, limestone, and silica (sand). The
oxidation of the iron, limestone, and silica promotes the reduction of lead compounds and
prevents oxidation of the lead and other metals. The soda ash enhances the reaction of PbSO and4
PbO with carbon from the coke to reduce these compounds to lead metal.
Water Jacket
Tuyere
Slag SpoutDam
CrucibleDrain Tap
Lead Spout
Lead Well and Siphon
Hot Water
Hot Water
Shaft
Charge Hopper
Exhaust Offtake to Afterburner
Average Level of Charge
Cool Water
Charge Hole
Charge
Diameter at Tuyeres68 to 120 cm
Working Height
2.4 to 3.0 m
Cool Water
Cone
Slag Layer
Lead Layer
of Charge
4-118
Figure 4-22. Cross-section of a Typical Blast Furnace
Source: Reference 62.
4-119
Lead tapped from a blast furnace has a higher content of alloying metals (up to
25 percent) than lead produced by a reverberatory furnace. In addition, much less of the lead and
alloying metals are oxidized and removed in the slag, so the slag has a low metal content
(e.g., 1 to 3 percent) and frequently qualifies as a nonhazardous solid waste.
Because air is introduced into the blast furnace at the tuyeres, blast furnaces are
operated at positive pressure. The operating temperature at the combustion layer of the charge is
between 2,200 and 2,600 F (1,200 and 1,400 C), but the temperature of the gases exiting the top
of the charge material is only between 750 and 950 F (400 and 500 C).
Molten lead collects in the crucible beneath a layer of molten slag. As in a
reverberatory furnace, the slag inhibits the further oxidation of the molten metal. Lead is tapped
continuously and slag is tapped intermittently, slightly before it reaches the level of the tuyeres. If
the tuyeres become blocked with slag, they are manually or automatically "punched" to clear the
slag. A sight glass on the tuyeres allows the furnace operator to monitor the slag level and ensure
that they are clear of slag. At most facilities, the slag tap is temporarily sealed with a clay plug,
which is driven out to begin the flow of slag from the tap into a crucible. The slag tap and
crucible are enclosed in a hood, which is vented to a control device.
A weir dam and siphon in the furnace are used to remove the lead from beneath
the slag layer. Lead is tapped from a blast furnace into either a crucible or directly to a refining
kettle designated as a holding kettle. The lead in the holding kettle is kept molten before being
pumped to a refining kettle for refining and alloying. The lead tap on a blast furnace is hooded
and vented to a control device.
Rotary Furnaces--As noted above, rotary furnaces (sometimes referred to as rotary
reverberatory furnaces) (Figure 4-23) are used at only a few recently constructed secondary lead
smelters in the United States. Rotary furnaces have two advantages over other furnace types: it
is easier to adjust the relative amount of fluxing agents because the furnaces are operated on a
Hygiene Hood
Riding Rings
Rotary Furnace Shell
Hygiene Hood
Mobile Flue
Jet
Drive Train
Door
Pouring Spout
4-120
Figure 4-23. Side-view of a Typical Rotary Reverbatory Furnace
Source: Reference 62.
4-121
batch rather than a continuous basis, and they achieve better mixing of the charge materials than
do blast or reverberatory furnaces.62
A rotary furnace consists of a refractory-lined steel drum mounted on rollers.
Variable-speed motors are used to rotate the drum. An oxygen-enriched natural gas or fuel oil jet
at one end of the furnace heats the charge material and the refractory lining of the drum. The
connection to the flue is located at the same end as the jet. A sliding door at the end of the
furnace opposite from the jet allows charging of material to the furnace. Charge materials are
typically placed in the furnace using a retractable conveyor or charge bucket, although other
methods are possible.
Lead-bearing raw materials charged to rotary furnaces include broken battery
components, flue dust, and drosses. Rotary furnaces can use the same lead-bearing raw materials
as reverberatory furnaces, but they produce slag that is relatively free of lead, less than 2 percent.
As a result, a blast furnace is not needed for recovering lead from the slag, which may be disposed
of as a nonhazardous waste.
Fluxing agents for rotary furnaces may include iron, silica, soda ash, limestone, and
coke. The fluxing agents are added to promote the conversion of lead compounds to lead metal.
Coke is used as a reducing agent rather than as a primary fuel. A typical charge may consist of
12 tons (11 Mg) of wet battery scrap, 0.8 tons (0.7 Mg) of soda ash, 0.6 tons (0.5 Mg) of coke,
and 0.6 tons (0.5 Mg) of iron. This charge will yield approximately 9 tons (8 Mg) of lead
product.62
The lead produced by rotary furnaces is a semi-soft lead with an antimony content
somewhere between that of lead from reverberatory and blast furnaces. Lead and slag are tapped
from the furnace at the conclusion of the smelting cycle. Each batch takes 5 to 12 hours to
process, depending on the size of the furnace. Like reverberatory furnaces, rotary furnaces are
operated at a slightly negative pressure.
4-122
Electric Furnaces--An electric furnace consists of a large, steel, kettle-shaped
container that is refractory-lined (Figure 4-24). A cathode extends downward into the container
and an anode is located in the bottom of the container. Second-run reverberatory furnace slag is
charged into the top of the furnace. Lead and slag are tapped from the bottom and side of the
furnace, respectively. A fume hood covering the top of the furnace is vented to a control device.
In an electric furnace, electric current flows from the cathode to the anode through
the scrap charge. The electrical resistance of the charge causes the charge to heat up and become
molten. There is no combustion process involved in an electric furnace .62
There is only one electric furnace in operation in the U.S. secondary lead industry.
It is used to process second-run reverberatory furnace slag, and it fulfills the same role as a blast
furnace used in conjunction with a reverberatory furnace. However, the electric furnace has two
advantages over a blast furnace. First, because there are no combustion gases, ventilation
requirements are much lower than for blast or reverberatory furnaces, and the potential for
formation of organics is greatly reduced. Second, the electric furnace is extremely reducing, and
produces a glass-like, nearly lead-free slag that is nonhazardous.
Emission Control Techniques
Controls used to reduce organic emissions from smelting furnaces in the secondary
lead smelting industry include afterburners on blast furnaces and combined blast and reverberatory
exhausts. Reverberatory and rotary furnaces have minimal dioxin/furan emissions because of high
exhaust temperatures and turbulence, which promote complete combustion of organics. No
controls for total hydrocarbons (THC) are necessary for these process configurations. 62
CDD/CDF emissions from blast furnaces are dependent on the type of add-on
control used. An afterburner operated at 1,300 F (700 C) achieves about 84 percent destruction
efficiency of total hydrocarbons (THC). Several facilities with blast and reverberatory furnaces62
Bath Level
ElectrodeFlue
Slag Tap
Lead Tap
Electrode
4-123
Figure 4-24. Cross-section View of an Electrical Furnace for Processing Slag
Source: Reference 62.
4-124
combine the exhaust streams and vent the combined stream to an afterburner. The higher
operating temperature of the reverberatory furnace reduces the fuel needs of the afterburner so
that the afterburner is essentially "idling." Any temperature increase measured across the
afterburner is due to the heating value of organic compounds in the blast furnace exhaust. A
combined reverberatory and blast furnace exhaust stream ducted to an afterburner with an exit
temperature of 1,700 F (930 C) can achieve 99 percent destruction efficiency for THC.62
Additional controls used by secondary lead smelters include baghouses for
particulate and metal control, hooding and ventilation to a baghouse for process fugitives, and
scrubbers for HCl and SO control.262
Emission Factors
Process emissions (i.e., those emitted from the smelting furnace's main exhaust)
Note: All results were reported at 12 percent CO . Unit identification codes are confidential for the mills, boilers, and units tested.2
NDCE furnace with ESP and scrubber, 1990 tests in California - Scrubber Outlet.a NDCE furnace with ESP, 1993 tests in Minnesota.b NDCE furnace with ESP, 1992 tests in New York.c DCE furnace with ESP and scrubber, 1992 tests in Louisiana - Scrubber Outlet.d DCE furnace with wet bottom ESP, 1992 tests in North Carolina.e NDCE furnace with ESP, 1990 tests in Michigan.f
bls = Black liquor solids.
4-144
State Kraft Pulp Mills State Kraft Pulp MillsAlabama 14 Montana 1Arizona 1 New Hampshire 1Arkansas 7 New York 1California 2 North Carolina 6Florida 7 Ohio 1Georgia 12 Oklahoma 1Idaho 1 Oregon 7Kentucky 2 Pennsylvania 3Louisiana 10 South Carolina 6Maine 7 Tennessee 2Maryland 1 Texas 6Michigan 3 Virginia 4Minnesota 2 Washington 6Mississippi 6 Wisconsin 4
Total 124
Source: Reference 72.
TABLE 4-31. DISTRIBUTION OF KRAFT PULP MILLS IN THEUNITED STATES (1997)
4.7.1 Process Description
Combustion generates the heat that takes place inside the combustion chamber.
Internal combustion engines are generally fueled by gasoline, diesel fuel, or gasoline/oil mixtures,
and can make use of either a two-stroke or a four-stroke cycle.
In a four-stroke cycle, the piston strokes are intake, compression, power, and
exhaust. The two-stroke cycle gasoline engine is designed to eliminate the intake and exhaust
strokes of the four-stroke cycle. The two-stroke cycle engine operates on a mixture of oil and
gas, with the oil in the gas being the sole source of lubrication for the system.73
Most passenger cars and some trucks are gasoline-fueled, but large trucks, buses,
and farm and heavy equipment are usually diesel-fueled. Motorcycles, outboard motors, lawn
mowers, and chain saws are examples of equipment that typically use two-cycle engines.
4-145
Temperatures in the combustion chamber and exhaust system and volume flow
rates influence CDD/CDF formation in internal combustion engines. Gasoline engine11,74
combustion occurs at temperatures around 6,332 F (3,500 C) at near-stoichiometric oxygen
levels. Gasoline engine exhaust temperatures generally range between 752 and 1,112 F (400 and
600 C). Diesel engines operate at combustion temperatures of about 3,657.6 F (2,000 C) with
an excess of oxygen. Diesel engine exhaust temperatures range between 392 and 752 F (200 and
400 C).
The gasoline engine derives its power from the explosion of a mixture of air and
gasoline, whereas in the diesel engine the fuel burns rather than explodes. The air-fuel mixture,
when ignited, expands rapidly in a cylinder, forcing a piston from the top of the cylinder to the
bottom. The exhaust gases from internal combustion engines are potential sources of CDD/CDF
emissions. After exhaust is released from a vehicle, it is diluted approximately 1,000-fold in the11
first few seconds and cools very rapidly.
Particulate emissions from diesels contain a significant amount of organic carbon.
CDD/CDF may accumulate in engine oil and be emitted when the oil leaks into the combustion
chamber or exhaust system and survives the emission process.11,76
A number of factors may affect CDD/CDF emissions from gasoline automobiles
and trucks, including:11
Air-to-fuel ratio;
Mode of vehicle operation;
Vehicle mileage;
Fuel content;
Presence of additives or lubricants; and
Presence of emission controls.
4-146
Air-to-fuel ratios less than stoichiometric promote incomplete combustion and
increase emissions. The effect of vehicle operation mode is related to the air-to-fuel ratio. Cold-
start operation will cause higher emissions because the engine is operating in a fuel-rich condition.
Higher engine load may also increase emissions during cold starts. Frequent engine start-ups and
shut-downs will decrease the air-to-fuel ratio, thereby decreasing the amount of fuel oxidized.11
CDD/CDF emissions are expected to increase with vehicle mileage, primarily
because of increased oil consumption. The higher quantities of oil consumed in older, more worn
cylinders provide more intermediates for CDD/CDF formation; in addition, the CDD/CDF
become concentrated in the oil. Another cause of increased CDD/CDF emissions with increased76
mileage is the formation of deposits in the combustion chamber. Emissions increase with mileage
until the deposits become stabilized.
Several studies have identified strong correlations between chlorinated additives in
gasoline and motor oil and CDD/CDF emissions during combustion tests. Unleaded gasoline8,75,76
may have a chlorine content of approximately 0.2 lb/ton (10 ppm), whereas the chlorine content in
leaded gasoline may be 5 to 10 times higher. In addition, it has been suggested that the77
concentration of aromatics in the fuel may contribute to these emissions.
CDD/CDF emissions are higher in cars using leaded gasoline. One reason may76
be that leaded gasoline contains chlorine in the form of dichloroethane, which is added as a "lead
scavenger." However, the amount of lead in leaded gasoline has decreased, and leaded gasoline
was totally phased out in 1996.
4.7.2 Emission Control Techniques
Emission control devices such as catalytic converters have reduced automobile
emissions significantly since the early 1970s. In one study, no dioxins were detected in cars76
4-147
equipped with catalytic converters using unleaded gasoline. A subsequent study revealed some76
CDD and CDF in catalyst-equipped cars, but at much lower levels than in the cars using leaded
gasoline. It is theoretically possible that the CDD/CDF formed in cars using unleaded gasoline77
could be destroyed in the catalytic converter. However, the lower levels of CDD/CDF found in76
cars equipped with catalytic converters using unleaded gasoline cannot be attributed solely to the
catalytic converter. It appears the combination of the unleaded gasoline and the catalytic
converter lowers CDD/CDF levels.
4.7.3 Emission Factors
CDD/CDF can be formed from mobile sources. However, emission factors
relevant to the United States are not readily available. A low confidence or quality rating is
assigned to the results and emission factors derived from European studies because the fuels and
control technologies used in these cars most likely differ from U.S. fuels and technologies.
In a 1987 study in Sweden, automobile exhaust emissions were analyzed for
CDD/CDF. No CDD/CDF were identified from cars equipped with catalytic converters using4
unleaded gasoline (representative of cars in the United States). The reported results from cars
without catalytic converters and burning leaded gasoline is not representative of cars in the United
States because the normal scavenger mixture of dichloro- and dibromoethane were not used.
Reported CDD/CDF emissions were approximately 2.6x10 to 4.7x10 lb/ton (13 to 235 ng/kg)-8 -7
or 8.6x10 to 1.6x10 lb/gal (39 to 704 ng/gal) of gasoline burned.-11 -9
A 1991 Norwegian study reported CDD/CDF emission factors for on-road
vehicles measured in a tunnel experiment. The length of the tunnel was not specified in the
report, but since complex ventilation was not stated, the length was probably relatively short.
Measurements of traffic density, traffic composition, and ventilation rate were also performed.
Most of the emissions were observed up a grade and were not measured on a flat road. Road
tunnel studies can represent an opportunity to obtain exhaust emission factors which can be
4-148
representative for the car population and the various traffic conditions that usually prevail in a
tunnel.
The data presented in Table 4-32 differentiates between emission factors for light
duty (LDV) and heavy duty diesel vehicles (HDDV). Although weekday and weekend sampling
occurred, the study did not differentiate between the fraction of light- and heavy-duty fleets
sampled during this period. Depending upon driving conditions, the estimated emission factors
were in the order of 1.4x10 to 1.8x10 lb/mile (0.04 to 0.5 ng/km) 2,3,7,8-TEQ (Nordic-13 -12
Model) for LDV and 2.5x10 to 3.4x10 lb/mile (0.7 to 9.5 ng/km) for HDDV. The emission-10 -11
factors for LDV, expressed as ng/km 2,3,7,8-TEQ, were obtained by dynamometer experiments
using leaded gasoline with dichloroethane added as a scavenger, which is not representative of on-
road motor vehicles in the United States.
The reader is cautioned in using the emission factors presented in Table 4-32 and
should recognize that this experiment was conducted with a mixture of new and old cars (which
are not always properly maintained). At the time of the measurements, the average age of the car
was about 9 years, and unleaded gasoline usage was only 25 to 30 percent of total consumption,
which also is not representative of on-road vehicles in the United States.
4.7.4 Source Locations
Internal combustion engines can be found in numerous vehicles, including
passenger cars, small and large trucks, buses, motorcycles, trains, ships, aircraft, farm machinery,
and military vehicles. Because these vehicles can be found nationwide, attempting to list specific
source/sites is not feasible. It may be reasonable to assume, however, that there is a direct
4-149
AMS 22-01-001-000FACTOR QUALITY RATING: U
Source
2,3,7,8-TCDD TEQalb/VMT
(ng/VkmT)2,3,7,8-TCDD lb/VMT
(ng/VkmT)2,3,7,8-TCDF lb/VMT
(ng/VkmT)
Light Duty Vehicles 1.35x10 - 1.84x10⁻¹³ -12
(3.80x10 - 5.20x10 )-2 -1--- ---
Heavy Duty DieselVehicles
2.55x10 - 3.37x10⁻¹² -11
(7.20x10 - 9.5)-1--- ---
Total on-road vehiclesb 8.85x10⁻¹⁴
(2.50x10 )-23.6x10⁻¹⁵
(1.00x10 )-35.65x10⁻¹⁴
(1.60x10 )-2
Source: Reference 78.a Source: Reference 79.b
VMT = vehicle miles travelled.
TABLE 4-32. EMISSION FACTORS FOR ON-ROAD MOBILE SOURCES
correlation between population density and the number of mobile vehicles in an area (i.e., there
would be more vehicles in a densely populated area than in a rural area).
4.8 CARBON REGENERATION
Activated carbon is used primarily for adsorbing pollutants from water or air (e.g.,
in industrial or municipal wastewater treatment plants). Because of increasing environmental
awareness and tighter regulations, the demand for activated carbon is increasing. The
consumption of activated carbon in water and wastewater treatment operations in 1990 was
reported at 1.44x10 lb (71,900 tons) (6.54x10 kg).8 7 80
Used carbon can be regenerated (reactivated) by essentially the same process as
used for the original activation. The regeneration process creates the potential for CDD/CDF
formation.
4-150
4.8.1 Process Description
In the regeneration process, organics adsorbed on carbon during use are burned off
by placing the spent carbon in continuous internally or externally fired rotary retorts or, most
commonly, in multiple-hearth furnaces. Figure 4-30 shows a cross-section of a typical multiple-81
hearth furnace. In this type of furnace, the charge (carbon) is stirred and moved from one hearth
to the next lower hearth by rotating rabble arms. For smaller-scale regeneration operations,
fluidized-bed and infrared furnaces can be used. The various furnace types used for carbon
regeneration and the approximate number of furnaces of each type are shown in Table 4-33.82
In a typical regeneration process, spent carbon in a water slurry form is fed from a
surge tank to a dewatering screw, which feeds the spent carbon to the top of the furnace. In the
furnace, the spent carbon is dried and the organics on the carbon are volatilized and burned as the
carbon is regenerated. The regenerated carbon drops from the bottom hearth of the furnace to a
quench tank and is stored as a slurry. A flow diagram of the carbon regeneration process is81
shown in Figure 4-31.81
A hot gas, such as steam or carbon dioxide, is introduced into the furnace at
temperatures of approximately 1498 to 1858 F (800 to 1,000 C), although some excess oxygen
is typically present throughout the furnace. The regeneration process is exothermic, using the83
heating value of the volatile carbon plus heat supplied from supplemental fuel (e.g., natural gas).
A typical furnace may fire an average of 459,089 cubic feet (13,000 cubic meters/day) of natural
gas.81
Typical industrial carbon regeneration plants may process up to 109,127 lbs/day
(49,500 kg/day) of spent carbon from numerous industrial or municipal facilities that use activated
carbon for wastewater treatment. Regeneration plants may operate 24 hrs/day, 7 days/wk for81
much of the year, with periodic shut-downs for furnace maintenance.
Furnace Exhaustto Afterburner
Floating Damper
Feed Material
PyrolysisGases
Product
Cooling and Combustion Air
4-151
Figure 4-30. Cross Section of a Typical Multiple-Hearth Furnace
Source: Reference 18.
4-152
Furnace TypeApproximate No.of Units in U.S.
Multiple-hearth <100
Fluidized-bed <20
Indirect-fired rotary kiln >50
Direct-fired rotary kiln <30
Vertical-tube type <30
Infrared-horizontal <5
Infrared-vertical 4
Source: Reference 82.
TABLE 4-33. TYPES OF EQUIPMENT USED FOR ACTIVATEDCARBON REGENERATION
Total Other TCDF 1.18x10 (1.89x10 )-16 -1 7.60x10 (3.80x10 )-4 -1
Total PeCDF 4.70x10 (7.50x10 )-15 -2 3.02x10 (1.51x10 )-4 -1
Total HxCDF 1.87x10 (3.00x10 )-15 -2 1.20x10 (6.00x10 )-4 -2
Total HpCDF 2.68x10 (4.30x10 )-15 -2 1.72x10 (8.60x10 )-4 -2
Total OCDF 2.06x10 (3.30x10 )-15 -2 1.32x10 (6.60x10 )-4 -2
Total CDF 1.56x10 (4.38x10 )-14 -1 1.76x10 (8.8x10 )-3 -1
Source: Reference 84.
Combustion gas flow rate was 196 dscm/hr. Facility operated 7,000 hr/yr. Operating rate of system was 97.5akg of spent activated carbon per hour.Control device consists of afterburner sized for a 0.3-minute (20-second) residence time at 1,850 F (1,010 C).b
ND = Not detected.U = Unratable.
TABLE 4-35. CDD/CDF CONCENTRATIONS AND EMISSION FACTORS FOR AHORIZONTAL INFRARED CARBON REGENERATION FURNACEa,b
TABLE 4-41. DIOXIN CONTAMINANTS ASSOCIATED WITH CHLOROBENZENES
The alkaline hydrolysis of 1,2,4-trichlorobenzene in the manufacture of PCP may
produce CDD such as 2,7-dichlorodibenzo-p-dioxin. In addition to alkaline hydrolysis of95
1,2,4-trichlorobenzene, the use of other chlorobenzenes in the manufacture of chlorophenols may
form CDD contaminants as shown in Table 4-41.
4.11.3 Brominated Compounds
Extensive research on CDD/CDF has produced much information on their
chemistry. However, much less is known about their brominated counterparts. On the basis
of laboratory studies on the formation of polybrominated dibenzo-p-dioxins (BDD) and
polybrominated dibenzofurans (BDF) from certain brominated compounds, an assumption can be
made that the mechanisms of dioxin and furan formation for brominated substances are similar to
those for chlorinated substances. Thus, bromine analogues of chlorinated compounds that have94
been associated with dioxin contamination could reasonably be expected to be associated with
BDD/BDF contamination. However, unlike the high-temperature chlorination process,
bromination of organic compounds is a low-temperature process. These low-temperature
bromination conditions are not as conducive to the formation of dioxins.
4-180
Information on the formation of BDD/BDF provided by one study demonstrated
that they could be formed during the chemical synthesis of flame retardants such as
2,4,6-tribromophenol, pentabromophenol, and tetrabromobisphenol A. Combustion of these
flame retardants also resulted in formation of BDD/BDF. High-resolution capillary column gas
chromatography coupled with mass spectrometry (HRGC/MS) analysis of 2,4,6-tribromophenol
indicated the presence of di- and tri-BDD, TBDD, PeBDF, HxBDF, HpBDF, and OBDF.94
Table 4-42 contains profiles of some industrial brominated chemicals, and include
information on the manufacturing process, possible contaminants, and most likely BDD/BDF
isomers. The predicted number of possible BDD/BDF formation pathways are given in
Table 4-43.
4.12 PORTLAND CEMENT PRODUCTION
Most of the hydraulic cement produced in the United States is Portland cement,
which is a cementitious, crystalline compound composed of metallic oxides. The end-product
cement, in its fused state, is referred to as "clinker." Raw materials used in the process can be
calcium carbonate- and aluminum-containing limestone, iron, silicon oxides, shale, clay, and
sand. There are four primary components in Portland cement manufacturing: raw materials98
handling, kiln feed preparation, pyroprocessing, and finished cement grinding. Pyroprocessing,
the fuel intensive process accomplished in cement kilns, has been identified as a potential source
of CDD/CDF emissions and constitutes the primary focus of this chapter.
4.12.1 Process Description
In Portland cement production, most raw materials typically are quarried on site
and transferred by conveyor to crushers and raw mills. After the raw materials are reduced to the
desired particle size, they are blended and fed to a large rotary kiln. The feed enters the kiln at the
elevated end, and the burner is located at the opposite end. The raw materials are then changed
into cementitious oxides of metal by a countercurrent heat exchange process. The materials are
4-181
TABLE 4-42. INDUSTRIAL BROMINATED COMPOUNDS
Compound Manufacturing Process Possible Contaminants Most Likely BDD/BDF Isomers
2,4-Dibromophenol Bromination of phenol in water or another polar 2,4,6-Tribromophenol; 2,7-Dibromodibenzo-p-dioxin.hydroxylic solvent. 2,4,5-tribromophenol; and
possibly tetrabromophenoland pentabromophenol.
2,4,6-Tribromophenol Bromination of phenol in the presence of water 2,4,5-Tribromophenol; 2,4,7,9-Tetrabromodibenzo-p-dioxin.or other polar hydroxylic solvent; reaction is tetrabromophenols.uncatalyzed.
Bromophenols (o-,m-, and Bromination of phenol in water or another Phenol, dibromophenol. Unfavorable kinetics and thermodynamicp-isomers) hydroxylic solvent. conditions. Low probability of BDDs and/or
2,6-Dibromo-4-nitrophenol Bromination of p-nitrophenol with excess Br ; 2,5-Dibromo-4-nitrophenol. None, due to steric hindrance and other 2catalyst is probably not necessary. effects from NO groups on aromatic ring.2
Decabromodiphenyloxide Perbromination of diphenyloxide with at least Diphenyloxide with varying Octabromodibenzofuran.150 percent excess Br in the presence of AlBr degrees of bromination.2 3at 95 F (35 C), followed by an increase intemperature to around 140 F (60 C).
Octabromodiphenyloxide Bromination of benzene with Br and FeCl as Varying degrees of Depends on the particular bromobenzene.2 3catalyst 176 to 212 F (80 to 100 C). brominated benzene.
Pentabromotoluene Perbromination at room temperature in presence Varying brominated toluenes. BDDs and BDFs could be formed underof catalyst (U.S. Patent No. 4287373, Great combustion conditions similar to that of theLakes Chemical Corporation, 1981). chlorinated benzenes in PCBs transformers.
The specific isomers depends on thecondensation of the particular brominatedtoluenes, several dimethyl polybrominateddioxins and furans are possible.
Compound Manufacturing Process Possible Contaminants Most Likely BDD/BDF Isomers
Tetrabromophthalic U.S. Patent No. 3382254, Chemische Fabrik Phthalic anhydride with None.Anhydride Kalk GMBH DE, 1968: phthalic anhydride, in varying degrees of
50-80 percent oleum, is brominated using bromination.halogenation catalyst at 176 to 194 F (80 to90 C); then, temperature is raised to about221 F (100 to 110 C) at end of Br addition;2then, heat to 248 to 302 F (120 to 150 C) toget rid of excess SO and Br reactants.3
1,2,4-Tribromobenzene By-product from the preparation of See bromobenzene and See bromophenols and pentabromotoluene.1,3,5-tribromobenzene. pentabromotoluene.
1,3,5-Tribromobenzene Bromination of benzene with Br using AlBr as See 1,2,4-tribromobenzene. See 1,2,4-tribromobenzene.2 3catalyst; since 1,3,5-isomer is most stable, willtend toward this configuration (yield1,3,5-isomer 50 percent).
Tetrabromobisphenol A Bromination of bisphenol A in organic solvent Brominated phenols. Octabromodibenzo-p-dioxin.with Br at 68 to 104 F (20 to 40 C) and then2increasing incubation temperature to 149 to158 F (65 to 70 C).
Source: Reference 94.
4-183
Chemical NamePredicted Number of Possible BDD/BDF
Formation Pathways
2,4-Dibromophenol 5
2,4,6-Tribromophenol 2
o-, m-, and p-Bromophenol 2
2,6-Dibromo-4-nitrophenol 1
Decabromodiphenyloxide 1
Octabromodiphenyloxide 1
Bromobenzene (mono- and di-) 0 a
Pentabromotoluene 0b
Tetrabromophthalic anhydride 0
1,2,4-Tribromobenzene 0a,b
1,3,5-Tribromobenzene 0a,b
Pentabromodiphenyloxide 1
Tetrabromobisphenol A 1
Source: Reference 94.
Under combustion conditions, brominated benzenes could condense to BDD and BDF similar to chlorinatedabenzenes.BDD and BDF could be formed under combustion conditions similar to those of chlorinated benzenes in PCBbtransformers.
TABLE 4-43. BROMINATED COMPOUNDS WITH THE POTENTIAL FOR BDD/BDF FORMATION
4-184
continuously and slowly moved to the low end by the rotation of the kiln while being heated to
high temperatures (2,700 F [1,482 C]) by direct firing. In this stage, chemical reactions occur,
and a rock-like substance called "clinker" is formed. This clinker is then cooled, crushed, and
blended with gypsum to produce Portland cement. The cement is then either bagged or98
bulk-loaded and transported out.98
Cement may be made via a wet or a dry process. Many older kilns use the wet
process. In the past, wet grinding and mixing technologies provided more uniform and consistent
material mixing, resulting in a higher quality clinker. Dry process technologies have improved,
however, to the point that all of the new kilns since 1975 use the dry process. In the wet100
process, water is added to the mill while the raw materials are being ground. The resulting slurry
is fed to the kiln. In the dry process, raw materials are also ground finely in a mill, but no water is
added and the feed enters the kiln in a dry state.
More fuel is required for the wet process then the dry process to evaporate the
water from the feed. However, for either the wet or dry process, Portland cement production is
fuel-intensive. The primary fuel burned in the kiln may be natural gas, oil, or coal. Many cement
plants burn supplemental fuels such as waste solvents, chipped rubber, shredded municipal
garbage, and coke. A major trend in the industry is the increased use of waste fuels. In 1989,98
33 plants in the United States and Canada reported using waste fuels; the number increased to
55 plants in 1990.98
The increased use of hazardous waste-derived fuels (HWDFs) for the kilns is
attributed to lower cost and increased availability. As waste generators reduce or eliminate
solvents from their waste steams, the streams contain more sludge and solids. As a result, two
new hazardous waste fueling methods have emerged at cement kilns. The first method pumps
solids (either slurried with liquids or dried and ground) into the hot end of the kiln. The second
method (patented by cement kiln processor and fuel blender Cadence, Inc.) introduces containers
of solid waste into the calcining zone of the kiln.100
4-185
The kiln system for the manufacture of Portland cement by dry process with
preheater is shown in Figure 4-35. The raw material enters a four-stage suspension preheater,
where hot gases from the kiln heat the raw feed and provide about 40-percent calcination before
the feed enters the kiln. Some installations include a precalcining furnace, which provides about
85-percent calcination before the feed enters the kiln.98
Facilities that burn HWDF are subject to the Boilers and Industrial Furnaces (BIF)
rule under the Resource Conservation and Recovery Act (RCRA) promulgated February 21,
1991. The BIF rule requires that a facility that burns hazardous waste demonstrate a 99.99
percent destruction efficiency for principal organic hazardous constituents in the waste stream.
To guard against products of incomplete combustion, the BIF rule limits CO levels in the kiln and
or total hydrocarbon levels in stack gases. In addition, a NESHAP for control of HAPs from100,101
Portland cement kilns is under development by the Emission Standards Division of OAQPS.
4.12.2 Emission Control Techniques
Fuel combustion at Portland cement plants can emit a wide range of pollutants in
small quantities. If the combustion reactions do not reach completion, CO and VOCs can be
emitted. When waste fuels are burned, incomplete combustion can lead to emissions of specific
HAPs, such as CDD/CDF. These pollutants are generally emitted at low levels.
In the pyroprocessing units, control devices employed are fabric filters (reverse air,
pulse jet, or pulse plenum) and ESPs. Typical control measures for the kiln exhaust are reverse
air fabric filters with an air-to-cloth ratio of 0.41:1 meter per minute (m/min) (1.5:1 acfm/ft ) and2
ESPs with a net specific collecting area (SCA) of 1,140 to 1,620 square meters per thousand m3
(m /1,100 m ) (350 to 500 square feet per thousand ft [ft /1,000 ft ]). Clinker cooler systems are2 3 3 2 3
controlled most frequently with pulse jet or pulse plenum fabric filters. The potential for
secondary CDD/CDF formation exists within the ESP. CDD/CDF formation can occur in the
Fan DustBin
DustCollector
Hot Gases toRoller Mill
Raw Material Feed
1
2
3
B
Roller Mill
Rotating Kiln ClinkerCooler
Air
Fuel
Clinker Storage
ToGrinding
Mill
A
4-186
Figure 4-35. Process Diagram of Portland Cement Manufacturing by Dry Process with Preheater
Source: Reference 98.
4-187
presence of excess oxygen over a wide range of temperatures. Refer to Section 4.1.1 for a
detailed discussion.
4.12.3 Emission Factors
The raw materials used by some facilities may contain organic compounds, which
constitute a precursor to potential CDD/CDF formation during the heating step. However, fuel
combustion to heat the kiln is believed to be the greater source of CDD/CDF emissions. The data
collected and presented in this section indicate that CDD/CDF are emitted when either fossil fuels,
HWDFs, or combinations of the two are combusted in the kiln.98,101
CDD/CDF emissions data for Portland cement kilns with various process, fuel, and
control configurations were compiled by the U.S. EPA's Office of Solid Waste in 1994. Testing101
was conducted at 35 Portland cement manufacturing facilities to certify compliance with the BIF
Rule. Emission factors developed from the study are presented in Tables 4-44 and 4-45.
It should be noted that Table 4-44 presents emission factors for kilns that burn
hazardous waste (HW) and also kilns that do not burn hazardous waste (NHW). In addition, this
document presents separate emissions estimates for HW and NHW kilns.
4.12.4 Source Locations
The Portland cement manufacturing industry is dispersed geographically
throughout the United States. Thirty-six states have at least one facility. As of December 1990,
there were 112 operating Portland cement plants in the United States, operating 213 kilns with a
total annual clinker capacity of approximately 80 million tons (73.7 million Mg). The kiln
population included 80 wet process kilns and 133 dry process kilns. Table 4-46 presents the98
number of Portland cement plants and kilns in the United States by State and the associated
production capacities as of December 1990.
4-188
SCC 3-05-006-06FACTOR QUALITY RATING: D
Fuel Type Control Device Pollutant
Average EmissionFactor in lb/ton
(kg/Mg)a
Natural Gas Electrostatic Precipitatorb 2,3,7,8-TCDD 1.20x10 (6.00x10 )-10 -11
Emission factors in lb (kg) of pollutant emitted per ton (Mg) of clinker produced.aKiln operating conditions: high combustion temperature; minimum electrostatic precipitator power.bKiln operating conditions: maximum feed, kilns 1 and 2.cKiln operating conditions: maximum hazardous waste feed.dKiln operating conditions: high combustion temperature; maximum production.e
TABLE 4-44. CDD/CDF EMISSION FACTORS FOR DRY PROCESS PORTLANDCEMENT KILNS (CONTINUED)
Emission factors in lb (kg) of pollutant emitted per ton (Mg) of clinker produced.a Kiln operating conditions: high combustion temperature; minimum electrostatic precipitator power.b
TABLE 4-45. CDD/CDF EMISSION FACTORS FOR WET PROCESS PORTLAND CEMENT KILNS (CONTINUED)
4-193
LocationNumber of Plants
(kilns)Capacity
10 tons/yr (10 Mg/yr)3 3
Alabama 5 (6) 4,260 (3,873)
Alaska 1 (0)a 0 (0)
Arizona 2 (7) 1,770 (1,609)
Arkansas 2 (5) 1,314 (1,195)
California 12 (20) 10,392 (9,447)
Colorado 3 (5) 1,804 (1,640)
Florida 6 (8) 3,363 (3,057)
Georgia 2 (4) 1,378 (1,253)
Hawaii 1 (1) 263 (239)
Idaho 1 (2) 210 (191)
Illinois 4 (8) 2,585 (2,350)
Indiana 4 (8) 2,830 (2,573)
Iowa 4 (7) 2,806 (2,551)
Kansas 4 (11) 1,888 (1,716)
Kentucky 1 (1) 724 (658)
Maine 1 (1) 455 (414)
Maryland 3 (7) 1,860 (1,691)
Michigan 5 (9) 4,898 (4,453)
Mississippi 1 (1) 504 (458)
Missouri 5 (7) 4,677 (4,252)
Montana 2 (2) 592 (538)
Nebraska 1 (2) 961 (874)
Nevada 1 (2) 415 (377)
New Mexico 1 (2) 494 (449)
New York 4 (5) 3,097 (2,815)
Ohio 4 (5) 1,703 (1,548)
TABLE 4-46. SUMMARY OF PORTLAND CEMENTPLANT CAPACITY INFORMATION
4-194
LocationNumber of Plants
(kilns)Capacity
10 tons/yr (10 Mg/yr)3 3
Oklahoma 3 (7) 1,887 (1,715)
Oregon 1 (1) 480 (436)
Pennsylvania 11 (24) 6,643 (6,039)
South Carolina 3 (7) 2,579 (2,345)
South Dakota 1 (3) 766 (696)
Tennessee 2 (3) 1,050 (955)
Texas 12 (20) 8,587 (7,806)
Utah 2 (3) 928 (844)
Virginia 1 (5) 1,117 (1,015)
Washington 1 (1) 473 (430)
West Virginia 1 (3) 822 (747)
Wyoming 1 (1) 461 (419)
Source: Reference 98.
Grinding plant only.a
TABLE 4-46. SUMMARY OF PORTLAND CEMENTPLANT CAPACITY INFORMATION (CONTINUED)
5-1
SECTION 5.0
SOURCE TEST PROCEDURES
Several sampling and analysis techniques have been employed for determining
CDD and CDF emissions. Measurement of CDD and CDF involves three steps: (1) sample
collection; (2) sample recovery and preparation; and (3) quantitative analysis. This section briefly
describes general methodologies associated with each of these steps. The purpose of this section
is to present basic sampling and analysis principles used to gather emissions data on CDD and
CDF from stationary sources. The presentation of non-EPA methods in this report does not
constitute endorsement or recommendation or signify that their contents necessarily reflect EPA's
views and policies.
5.1 SAMPLE COLLECTION
Collection of CDD and CDF from stationary sources is achieved by using a
sampling system that captures both particulate and condensibles. The most prevalent method is
EPA Method 0010, also referred to as the Modified Method 5 (MM5) Sampling Train, which is
equipped with a sorbent resin for collecting condensibles. A schematic of the MM5 sampling
train used for collecting CDD and CDF is shown in Figure 5-1.
The Source Assessment Sampling System (SASS), a high-volume variation of
MM5 capable of sampling particulate and vapor emissions from stationary sources has also been
used. A schematic of the SASS train is shown in Figure 5-2.102,103
TABLE 5-1. COMPARISON OF MM5 AND SASS CHARACTERISTICS
The general characteristics of the SASS and MM5 trains are compared in
Table 5-1. The major differences between the two methods are in the sampling rate and volume
of gas collected. The smaller gas volume used in the MM5 train (about 10 times smaller than the
SASS train) requires less XAD-2 resin. Also, in a SASS train, the filter is normally held at a®
higher temperature than in the MM5 train.102,103
In the MM5 sampling train, a water-cooled condenser and XAD-2 resin cartridge®
are placed immediately before the impinger section. XAD-2 is designed to adsorb a broad range®
of volatile organic species. The gas stream leaving the filter is cooled and conditioned in the
condenser prior to entering the sorbent trap, which contains the XAD-2 resin. From the sorbent®
trap, the sample gas is routed through impingers, a pump, and a dry gas meter. The MM5 train is
designed to operate at flow rates of approximately 0.015 dry standard cubic meters per minute
(dscmm) or, equivalently, 0.5 dry standard cubic feet per minute (dscfm) over a 4-hour sampling
period. Sample volumes of 3 dscm (100 dscf) are typical.103
5-5
An advantage of using the MM5 train is that it is constructed of inert materials. A
disadvantage is that long sampling periods (2 hours) are required to collect sufficient sample for
quantitative analysis.
The SASS train is a multi-component sampling system designed for collecting
particulates, volatile organics, and trace metals. The train contains three heated cyclones and a
heated filter that allow size fractionation of the particulate sample. Volatile organic material is
collected in a sorbent trap containing XAD-2 resin. Volatile inorganic species are collected in a®
series of impingers before the sample gas exits the system through a pump and a dry gas meter.
Large sample volumes are required to ensure adequate recovery of sample fractions. The system
is designed to operate at a flow rate of 0.113 scmm (4.0 scfm), with typical sample volumes of
30 dscm (1,000 dscf).102
An advantage of the SASS train is that a large quantity of sample is collected. A
disadvantage is that the system does not have the ability to traverse the stack. Also, because
constant flow is required to ensure proper size fractionation, the SASS train is less amenable to
compliance determinations because isokinetic conditions are not achieved. Another disadvantage
is the potential of corrosion of the stainless steel components of the SASS train by acidic stack
gases.11
Other methods that have been used to collect and determine concentrations of
CDD and CDF from stationary sources are EPA Reference Method 23, California Air104
Resources Board (CARB) Method 428, and a draft ASME (American Society of Mechanical105
Engineers) protocol that was distributed in December 1984.106
EPA Reference Method 23 is a combined sampling and analytical method that uses
a sampling train identical to the one described in EPA Method 5, with the exceptions and
modifications specified in the method.104
5-6
CARB Method 428 is another combined sampling and analytical method. With
Method 428, particulate and gaseous phase CDD and CDF are extracted isokinetically from a
stack and collected on a filter, on XAD-2 resin, in impingers, or in upstream sampling train®
components. The sampling train in Method 428 is similar to the train in EPA Method 23 except
that the CARB Method 428 train includes one impinger containing either water or ethylene glycol
and the EPA Method 23 train includes two impingers containing water.
The draft ASME protocol assumes that all of the compounds of interest are
collected either on XAD-2 resin or in upstream sampling train (MM5) components. The®
minimum detectable stack gas concentration should generally be in the nanogram/cubic meter
(ng/m ) or lower range.3
5.2 SAMPLE RECOVERY AND PREPARATION
Quantitative recovery of CDD and CDF requires the separation of these
compounds from the remainder of the collected material, as well as efficient removal from the
collection media. A technique commonly used for recovery of CDD and CDF from filters, and
adsorbent and liquid media is soxhlet extraction.
Most recovery methods entail (1) the addition of isotopically labeled internal
standards and/or surrogate compounds, (2) concentration of the sample volume to 1-5 mL or less,
(3) sample cleanup involving a multi-column procedure, and (4) concentration of the sample to
the final desired volume.
EPA Method 23, CARB Method 428, and the draft ASME protocol employ
soxhlet extraction for the extraction of CDD and CDF from both filter and sorbent catches. The
primary difference among these methods is in the recovery solvents used.
5-7
EPA Method 23 sample recovery solvent for rinsing the sample train glassware is
acetone, with a final quality assurance rinse of toluene; however, the results from the toluene rinse
are not used in calculating total CDD and CDF emissions. Toluene is used for soxhlet extraction.
The columns used for sample cleanup include silica gel, modified silica gel, basic alumina, and
carbon/celite.
In CARB 428, sample recovery solvents for rinsing the sample train glassware
include methanol, benzene, methylene chloride and distilled deionized water. The filter and
sorbent catches are dried with sodium sulfate (NA SO ) prior to soxhlet extraction with benzene2 4
or toluene. A minimum two-column cleanup system (silica gel/alumina) is required. A third
column, the carbon/celite cleanup procedure, may be necessary.
The draft ASME protocol specifies the use of acetone followed by hexane as
sample recovery solvents and toluene as the soxhlet extraction solvent. Silica and alumina column
cleanup procedures are the minimum requirement, with cleanup on carbon/celite and silica/diol
columns if necessary.
EPA Reference Methods 8280 and 8290 are analytical methods used to determine
TCDD/TCDF through OCDD/OCDF in chemical wastes, including still bottoms, fuel oils,
sludges, fly ash, reactor residues, soil, and water. Both methods involve the addition of internal
standards to the sample prior to a matrix-specific extraction procedure as specified in the method.
The extracts are submitted to an acid-base washing treatment and dried. Following a solvent
exchange step, the residue is cleaned up by column chromatography on neutral alumina and
carbon on celite. 102,105
EPA Method 8280 employs seven C labeled standards and one Cl labeled13 37
standard. Two are used as recovery standards, five are used as internal standards, and one is used
as a cleanup standard. There are no labeled standards for the PeCDD/PeCDF homologues, the
HxCDF homologues, and the HpCDD homologues. This means that for these CDD/CDF
5-8
homologues, the efficiency of the extraction and cleanup procedures cannot be measured. The107
method does not include the use of surrogate standards, which are normally added to the
adsorbent trap, because Method 8280 is only an analytical method.
EPA Method 8290 employs eleven C labeled standards. Two are used as13
recovery standards and nine are used as internal standards. TCDD/TCDF through
HpCDD/HpCDF and OCDD are represented by the internal standards. This use of standards
allows for monitoring of all but OCDF for extraction and cleanup recoveries.106,107
5.3 QUANTITATIVE ANALYSIS
The analytical techniques employed to identify and quantify CDD/CDF in
environmental samples include high-resolution capillary column gas chromatography coupled with
low-resolution mass spectrometry (HRGC/LRMS) or high-resolution mass spectrometry
(HRGC/HRMS). EPA Method 8280 and the draft ASME protocol use HRGC/LRMS; EPA
Method 23 and EPA Reference Method 8290 use HRGC/HRMS. Either technique can be used in
CARB 428.
Separation of isomers or series of isomers is accomplished by HRGC, and
quantification is accomplished by operating the mass spectrometer in the selected ion monitoring
(SIM) mode. A high-resolution fused silica capillary column (60 m DB-5) is used to resolve as
many CDD/CDF isomers as possible; however, no single column is known to resolve all isomers.
Identification is based on gas chromatograph retention time and correct chlorine
isotope ratio. Strict identification criteria for CDD/CDF are listed in each individual method.
Quantification generally involves relative response factors determined from multi-level calibration
standards. An initial calibration curve is required prior to the analysis of any sample and then
intermittent calibrations (i.e., analysis of a column performance-check solution and a mid-range
concentration solution) are performed throughout sample analyses.
5-9
In the draft ASME protocol, two different columns are required if data on both
2,3,7,8-TCDD and 2,3,7,8-TCDF, as well as on total CDD/CDF by chlorinated class, are desired.
The appropriate columns are a fused silica capillary column (60 m DB-5) and a 30 m
capillary (DB-225). The DB-5 column is used to separate several groups of TCDD/TCDF
through OCDD/OCDF. Although this column does not resolve all of the isomers within each
chlorinated group, it effectively resolves each of the chlorinated groups from all of the other
chlorinated groups, thereby providing data on the total concentration of each group (that is, total
TCDD/TCDF through OCDD/OCDF). The DB-225 column is used to quantify 2,3,7,8-TCDF
because it adequately resolves this isomer from the other TCDF isomers.106
The capillary gas chromatographic columns recommended in CARB Method 428
and EPA Method 23 include the 60 m DB-5 or the SP-2331. The peak areas for the two ions
monitored by the mass spectrometer for each analyte are summed to yield the total response for
each analyte. Each internal standard is used to quantify the CDD/CDF in its homologous series.
A DB-5 (30 m) or SP-2250 capillary column is recommended for EPA
Methods 8280 and 8290. The analytical procedures specified in EPA Method 8290 are similar to
those in Method 23, with the addition of the surrogate standards used to measure sample
collection efficiency. Identification of the compounds for which an isotopically labeled standard is
used is based on elution at the exact retention time established by analysis of standards and
simultaneous detection of the two most abundant ions in the molecular ion region. Compounds
for which no isotopically labeled standard is available are identified by their relative retention
times, which must fall within the established retention windows, and the simultaneous detection of
the two most abundant ions in the molecular ion region in the correct abundance ratio. The
retention windows are established by analysis of a GC performance evaluation solution.
Identification is confirmed by comparing the ratio of the integrated ion abundance of the
molecular ion species to the theoretical abundance ratio.
5-10
Quantification of the individual homologues and total CDD/CDF is based upon a
multi-point calibration curve for each homologue. The major difference between107,108
Method 8280 and Method 8290 is the resolving power of the mass spectrometer. The HRMS
provides a higher-quality analysis than does the LRMS because of its ability to incorporate
additional labeled standards to cover almost all of the TCDD/TCDF through OCDD/OCDF
homologues.
6-1
SECTION 6.0
REFERENCES
1. U.S. EPA. Compilation of Air Pollutant Emission Factors, 5th ed. (AP-42), Vol. I: Stationary Point and Area Sources. Research Triangle Park, North Carolina: U.S. Environmental Protection Agency, 1995.
2. U.S. EPA. Technical Procedures for Developing AP-42 Emission Factors and PreparingAP-42 Sections. EPA-454/B-93-050. Research Triangle Park, North Carolina: U.S. Environmental Protection Agency, Office of Air Quality Planning and Standards,1993.
3. Pope, A. (U.S. Environmental Protection Agency, Emission Inventory Branch); R.B.Jones (Midwest Research Institute); and G. Brooks (Radian Corporation). Groupdiscussion on applying "U" rating to emission factors. Research Triangle Park, NorthCarolina. December 8, 1992.
4. World Health Organization. Sources of Environmental Pollution. PolychlorinatedDibenzo-p-dioxins and Dibenzofurans, Environmental Health Criteria 88. Geneva,Switzerland: World Health Organization, 1989.
5. U.S. EPA. Health and Environmental Effects Profile for Tetra-, Penta-, andHexachlorodibenzofurans. EPA-600/X-84/114. Cincinnati, Ohio: U.S. EnvironmentalProtection Agency, Office of Health and Environmental Assessment, 1983. p. 1-1.
6. U.S. EPA. Health Assessment Document for Polychlorinated Dibenzo-p-dioxins. EPA-600/8-84-014A. Washington, D.C.: U.S. Environmental Protection Agency, Officeof Health and Environmental Assessment, 1984. pp. 3-5.
7. Podoll, R.T., H.M. Jaber, and T. Mill. Tetrachlorodibenzodioxin: Rates of Volatilizationand Photolysis in the Environment. Environmental Science and Technology. 20(1986):490.
6-2
8. Lustenhouwer, J.W.A., K. Olie, and O. Hutzinger. Chlorinated Dibenzo-p-dioxins andRelated Compounds in Incinerator Effluents: A Review of Measurements andMechanisms of Formation. Chemosphere. 9:512, 1990.
9. U.S. EPA. National Dioxin Study Tier 4--Combustion Sources: Engineering AnalysisReport. EPA-450/4-84-014h. Research Triangle Park, North Carolina: U.S. Environmental Protection Agency, 1987.
10. U.S. EPA. National Dioxin Study Tier 4--Combustion Sources: Project SummaryReport. EPA-450/4-84-014g. Research Triangle Park, North Carolina: U.S. Environmental Protection Agency, 1987.
11. Barnes, D.G., F.W. Kutz (U.S. Environmental Protection Agency, Office of Research andDevelopment); D.P. Bottimore (Versar, Inc.). Interim Procedures for Estimating RisksAssociated with Exposures to Mixtures of Chlorinated Dibenzo-p-dioxins andDibenzofurans (CDD and CDF) and 1989 Update. EPA-625/3-89/016. Washington,D.C.: U.S. Environmental Protection Agency, 1989.
12. National Dioxin Emission Estimates from Municipal Waste Combustors. U.S. Environmental Protection Agency, Emission Standards Division, Office of AirQuality Planning and Standards, Research Triangle Park, North Carolina. June 1996. Docket A-90-45, Item VII-A-001.
13. National Dioxin Emission from Medical Waste Incinerators. U.S. EnvironmentalProtection Agency, Emission Standards Division, Office of Air Quality Planning andStandards, Research Triangle Park, North Carolina. June 1996.
14. U.S. EPA. Locating and Estimating Air Emissions from Sources of Polycyclic OrganicMatter, Final Report. Research Triangle Park, North Carolina: U.S. EnvironmentalProtection Agency, November 1996.
15. Fenn, D.A., and K.L. Nebel (Radian Corporation). Memorandum to W.H. Stevenson(U.S. Environmental Protection Agency, Emission Standards Division) concerning MWCDatabase. March 1992.
17. U.S. EPA. Municipal Waste Combustion Assessment: Technical Basis for GoodCombustion Practice. EPA-600/8-89-063. Research Triangle Park, North Carolina: U.S. Environmental Protection Agency, 1989.
6-3
18. U.S. EPA. Locating and Estimating Air Toxics Emissions from Sewage SludgeIncinerators. EPA-450/2-90-009. Research Triangle Park, North Carolina: U.S. Environmental Protection Agency, 1990.
19. U.S. EPA. Standards of Performance for New Stationary Sources: Municipal WasteCombustors, 59 FR 48216, September 20, 1994.
20. U.S. EPA. Municipal Waste Combustors--Background Information for ProposedStandards: Post-Combustion Technology Performance. EPA-450/3-89-27c. ResearchTriangle Park, North Carolina: U.S. Environmental Protection Agency, 1989.
21. U.S. EPA. Locating and Estimating Air Toxic Emissions from Medical WasteIncinerators. EPA-454/R-93-053. Research Triangle Park, North Carolina: U.S. Environmental Protection Agency, 1993.
23. Moody, T.K. (Radian Corporation), and R. Copland (U.S. Environmental ProtectionAgency, Emission Standards Division). Teleconference concerning hospital incinerators. July 17, 1995.
24. Radian Corporation. Site 4 Final Emission Test Report, Sewage Sludge Test Program. Research Triangle Park, North Carolina: U.S. Environmental Protection Agency, 1989.
25. ERT. Non-Criteria Emissions Monitoring Program for the Envirotech Nine-HearthSewage Sludge Incinerator at the Metropolitan Wastewater Treatment Facility. St. Paul,Minnesota: Metropolitan Waste Control Commission, 1986.
26. U.S. EPA. National Dioxin Study Tier 4--Combustion Sources, Final Test Report--Site 1Sewage Sludge Incinerator SSI-A. EPA-450/4-84-014j. Research Triangle Park, NorthCarolina: U.S. Environmental Protection Agency, 1987.
27. U.S. EPA. National Dioxin Study Tier 4--Combustion Sources, Final Test Report--Site 3Sewage Sludge Incinerator SSI-B. EPA-450/4-84-014l. Research Triangle Park, NorthCarolina: U.S. Environmental Protection Agency, 1987.
28. U.S. EPA. National Dioxin Study Tier 4--Combustion Sources, Final Test Report--Site 12 Sewage Sludge Incinerator SSI-C. EPA-450/4-84-014l. Research Triangle Park,North Carolina: U.S. Environmental Protection Agency, 1987.
29. Acurex Corporation. 1990 Source Test Data for the Sewage Sludge Incinerator. Prepared for the Palo Alto Water Quality Control Plant. Palo Alto, California: AcurexCorporation, 1991.
6-4
30. Entropy Environmentalists, Inc. Emissions of Metals, Chromium and Nickel Species, andOrganics from Municipal Wastewater Sludge Incinerators, Vol. I: Summary Report. Cincinnati, Ohio: U.S. Environmental Protection Agency, 1992.
32. Whitworth, W.E., and L.R. Waterland. Pilot-Scale Incineration of PCB-ContaminatedSediments from the Hot Spot of the New Bedford Harbor Superfund Site. Jefferson,Arkansas: Acurex Corporation, 1992.
33. Oppelt, E.T. Incineration of Hazardous Waste--A Critical Review. Journal of AirPollution Control Association. 37(5):558-586, 1987.
34. Standards for Owners and Operators of Hazardous Waste Incinerators and Burning ofHazardous Wastes in Boilers and Industrial Furnaces. 40 CFR Parts 260, 261, 264, and270. Federal Register. 55(82):17-93, April 27, 1990.
35. U.S. EPA. Permit Writer's Guide to Test Burn Data, Hazardous Waste Incineration. EPA-625/6-86-012. Cincinnati, Ohio: U.S. Environmental Protection Agency, 1986.
36. U.S. EPA. National Dioxin Study Tier 4--Combustion Sources, Final Test Report--Site 2Industrial Solid Waste Incinerator ISW-A. EPA-450/4-84-014k. Research Triangle Park,North Carolina: U.S. Environmental Protection Agency, 1987.
37. Radian Corporation. Summary of Trace Emissions from and Recommendations of RiskAssessment Methodologies for Coal and Oil Combustion Sources. DCN No. 86-203-024-41-10. Research Triangle Park, North Carolina: U.S. Environmental Protection Agency, 1986.
38. Cole, J. (Research Triangle Institute). Memorandum to W. Maxwell (U.S. EnvironmentalProtection Agency) on HAP Emission Factors. January 19, 1995.
39. Someshwar, A.V. and J.E. Pinkerton. Air Pollution Engineering Manual, Chapter 18: Wood Processing Industry. Air and Waste Management Association. New York, NewYork: Van Nostrand Reinhold, 1992.
41. Someshwar, A.V. Summary of Mill Test Reports on Wood Residue Combustion, BlackLiquor Combustion, and Kraft Mill Sludge Burning. NCASI Files. Gainesville, Florida: National Council of the Paper Industry for Air and Stream Improvement, Inc., 1995.
43. Johnson, N.D., and M.T. Schultz (ORTECH Corporation). MOE Toxic ChemicalEmissions Inventory for Ontario and Eastern North America. Final ReportNo. P92-T61-5429/OG. Rexdale, Ontario: Ontario Ministry of the Environment, AirResources Branch, 1992.
46. U.S. EPA. National Dioxin Study Tier 4--Combustion Sources: Final Test Report--Site 13 Residential Wood Stove WS-A. EPA-450/4-84-014v. Research Triangle Park,North Carolina: U.S. Environmental Protection Agency, 1987.
47. U.S. EPA. Estimating Exposure to Dioxin-Like Compounds, Volume II: Properties,Sources, Occurrence, and Background Exposures, External Review Draft. EPA-600/6-88-005bC. Washington, D.C.: U.S. Environmental Protection Agency,Exposure Assessment Group, Office of Health and Environmental Assessment, June 1994.
48. U.S. EPA. Markets for Scrap Tires. EPA/530-SW-90-074A. Washington, D.C.: U.S. Environmental Protection Agency, Office of Solid Waste and Emergency Response,1991.
50. Radian Corporation. Modesto Energy Company Waste Tire-to-Energy Facility, Westley,California, Final Emission Test Report. Report No. 243-047-20. Research TrianglePark, North Carolina: Radian Corporation, 1988.
51. California Air Resources Board. Emissions Testing of a Propane Fired Incinerator at aCrematorium. Report No. ERC-39. Sacramento, California: California Air ResourcesBoard, 1992.
52. Cremation Association of North America. Cremation Statistics. Cremationist. Chicago,Illinois: Cremation Association of North America, 1992.
53. U.S. EPA. Emission Factors for Iron Foundries--Criterion and Toxic Pollutants. EPA-60/2-90-044. Cincinnati, Ohio: U.S. Environmental Protection Agency, ControlTechnology Center, Office of Research and Development, 1990.
54. U.S. EPA. Electric Arc Furnaces in Ferrous Foundries, Background Information forProposed Standards. Report No. 3-80-020a. Research Triangle Park, North Carolina: U.S. Environmental Protection Agency, Office of Air Quality Planning and Standards,1980.
6-6
55. California Air Resources Board. Emissions Measurement of Toxic Compounds from aCupola Baghouse at a Steel Foundry. Report No. ERC-61. Sacramento, California: California Air Resources Board, 1993.
56. Keller, P.A. (Radian Corporation). Teleconference with J. Maysilles, (U.S. EnvironmentalProtection Agency). April 2, 1994.
58. U.S. EPA. National Dioxin Study Tier 4--Combustion Sources: Final Test Report--Site10 Secondary Copper Recovery Cupola Furnace MET-A. EPA-450/4-84-0145. ResearchTriangle Park, North Carolina: U.S. Environmental Protection Agency, 1987.
60. California Air Resources Board. Dioxin/Furan Emissions Estimates from a SecondaryAluminum Facility. Report No. ERC-9. Sacramento, California: California AirResources Board, 1992.
61. California Air Resources Board. Emissions Measurements on Delacquering System. Report No. ERC-32. Sacramento, California: California Air Resources Board, 1992.
62. U.S. EPA. Secondary Lead Smelting Background Information Document For ProposedStandards, Vol. 1. EPA-450/R-94-024a. Research Triangle Park, North Carolina: U.S. Environmental Protection Agency, Office of Air Quality Planning and Standards,1994.
63. Steinwurtzel, R.N. (Counsel for Association of Battery Recyclers), and D.W. Safreit(U.S. Environmental Protection Agency, Emission Factor and Inventory Group). Personalcommunication. May 4, 1995.
64. U.S. EPA. HAP Emission Testing on Selected Sources at a Secondary Lead Smelter--Tejas Resources, Inc., Draft Emission Test Report. Prepared by Roy F. Weston, Inc. EPA Contract No. 68-D1-0104. Research Triangle Park: U.S. Environmental ProtectionAgency, 1992.
65. U.S. EPA. HAP Emission Testing on Selected Sources at a Secondary LeadSmelter--Schuylkill Metals Corporation, Draft Emission Test Report. Prepared by Roy F.Weston, Inc. EPA Contract No. 68-D1-0104. Research Triangle Park: U.S. Environmental Protection Agency, 1992.
6-7
66. U.S. EPA. HAP Emission Testing on Selected Sources at a Secondary LeadSmelter--East Penn Manufacturing Company, Draft Emission Test Report. Prepared byRoy F. Weston, Inc. EPA Contract No. 68-D1-0104. Research Triangle Park: U.S. Environmental Protection Agency, 1992.
67. U.S. EPA. Secondary Lead Smelting Background Information Document For ProposedStandards, Vol. 2: Appendices. EPA-450/R-94-024b. Research Triangle Park, NorthCarolina: U.S. Environmental Protection Agency, Office of Air Quality Planning andStandards, 1994.
68. U.S. EPA. National Dioxin Study Tier 4--Combustion Sources: Final Test Report--Site6 Wire Reclamation Incinerator WRI-A. EPA-450/4-84-0140. Research Triangle Park,North Carolina: U.S. Environmental Protection Agency, 1987.
69. U.S. EPA. National Dioxin Study Tier 4--Combustion Sources: Final Test Report--Site 11 Drum and Barrel Reclamation Furnace DBR-A. EPA-450/4-8-0144. ResearchTriangle Park, North Carolina: U.S. Environmental Protection Agency, 1987.
71. Dyer, H., S. Gajita, and D. Fisher. 1992 Lockwood-Post's Directory of the Pulp, Paperand Allied Trades. Miller Freeman Publications. San Francisco, California, 1991.
72. Dyer, H., S. Gajita, and D. Fisher. 1997 Lockwood-Post's Directory of the Pulp, Paperand Allied Trades. Miller Freeman Publications. San Francisco, California, 1997.
73. National Council of the Paper Industry for Air and Stream Improvement, Inc. A Study ofKraft Recovery Furnace Hydrochloric Acid Emissions. Technical Bulletin No. 674. Gainesville, Florida: National Council of the Paper Industry for Air and StreamImprovement, Inc., August, 1994.
74. Carruth, G., ed. The Volume Library, Energy and Power Sources. Nashville, Tennessee: The Southwestern Company, 1986.
75. Ballschmiter, K., et al. Automobile Exhausts Versus Municipal Waste Incineration asSources of the Polychloro-dibenzodioxins (PCDD) and -furans (PCDF) Found in theEnvironment. Chemosphere. 15(7):901-915, 1986.
76. Marklund, S., C. Rappe, M. Tysklind, and K. Egeback. Identification of PolychlorinatedDibenzofurans and Dioxins in Exhausts from Cars Run on Leaded Gasoline. Chemosphere. 16(1):29-36, 1987.
6-8
77. Marklund, S., et al. Emissions of PCDDs and PCDFs in Gasoline and Diesel Fueled Cars. Chemosphere. 20(5):553-561, 1990.
78. Oehme, M., S. Larson, and E.M. Bvevik. Emission Factors of PCDD and PCDF for RoadVehicles Obtained by Tunnel Experiment. Chemosphere. 23(11/12)1699-1708, 1991.
79. U.S. Environmetnal Protection Agency. Emissions Inventory of Section 112(c)(6)Pollutants: Polycyclic Organic Matter (POM), 2,3,7,8-Tetrachlorodibenzo-P-Dioxin(TCDD)/2,3,7,8,-Tetrachlorodibenzofuran (TCDF), Polychlorinated BiphenylCompounds (PCBs), Hexachlorobenzene, Mercury, and Alkylated Lead. Draft Report. Office of Air Quality Planning and Standards, Research Triangle Park, NorthCarolina, 1996.
80. Humer, C. Activated Carbon Plant Starts for American Novit. Chemical MarketingReporter. June 8, 1992. p. 2.
81. U.S. EPA. National Dioxin Study, Tier 4--Combustion Sources, Final Test Report--Site 9, Carbon Regeneration Furnace CRF-A. EPA-450/4-84-014r. Research TrianglePark, North Carolina: U.S. Environmental Protection Agency, Office of Air QualityPlanning and Standards, 1987.
82. Schuliger, W.G. and L.G. Knapil. Reactivation Systems. Paper presented at the annualconference of the American Water Works Association, June 1990.
83. Byers, W.D. Charcoal/Activated Carbon. Air Pollution Engineering Manual. A.J. Buonicore and W.J. Davis, eds. New York, New York: Van Nostrand Reinhold,1991.
84. Koffskey, W.E. and B.W. Lykins, Jr. GAC Adsorption and Infrared Reactivation: CaseStudy. Journal of American Water Works Association. (January 1990) 48-56.
85. BTC Environmental, Inc. AB-2588 Toxic Emission Testing. Ventura, CA: OrangeCounty Water District, 1991.
86. Raven, P.H. Biology of Plants. New York, New York: Worth Publishers, Inc., 1980.
87. Bacher, R., M. Swerev, and K. Ballschmiter. Profile and Pattern of Monochloro- throughOctachlorodibenzodioxins and -dibenzofurans in Chimney Deposits from Wood Burning. Environmental Science and Technology. 26(8):1649-1655, 1992.
88. Nestrick, T.J., and L.L. Lamparski. Assessment of Chlorinated Dibenzo-p-dioxinFormation and Potential Emission to the Environment from Wood Combustion. Chemosphere. 12(4/5):617-626, 1983.
6-9
89. Tashiro, C. et al. Preliminary Report: Dioxins and Furans in Prescribed Burns. Chemosphere. 20:1533-1536, 1990.
90. U.S. Code of Federal Regulations. Title 40, Protection of the Environment, Part 761--Polychorinated Bi-phenyls (PCBs) Manufacturing, Processing, Distribution in Commerce,and Use Prohibitions. Washington, D.C.: U.S. Government Printing Office, 1994.
91. U.S. EPA. National Dioxin Study Tier 4--Combustion Sources: Final Literature Review. EPA-450/4-84-014i. Research Triangle Park, North Carolina: U.S. EnvironmentalProtection Agency, 1986.
93. California Air Resources Board. Compliance Testing for Non-Criteria Pollutants at aLandfill Flare. Report No. ERC-2. Sacramento, California: California Air ResourcesBoard, 1990.
94. Lee, A. et al. Dioxins and Furan Contamination in the Manufacture of HalogenatedOrganic Chemicals. EPA/600/2-86/101. Cincinnati, Ohio: U.S. EnvironmentalProtection Agency, 1986.
95. Sittig, M. Handbook of Toxic and Hazardous Chemicals and Carcinogens, 2nd ed. ParkRidge, New Jersey: Noyer Publications, 1985.
96. Wilkinson, J. (Vulcan Chemicals). Letter to D. Safriet (U.S. Environmental ProtectionAgency, Emission Factor and Inventory Group) concerning dioxin exposure assessmentcomments, technical information staff. June 20, 1995.
97. Chinkin, L. et al. Inventory of Chlorophenol Use in the Forest Products Industry andInvestigation of Related Emissions of Chlorinated Dibenzodioxins and Dibenzofurans. SYSAPP-87/078. Sacramento, California: California Air Resources Board, 1987.
99. Pierson, T. (Research Triangle Institute). Summary of Portland Cement MACT Data. Report to T. Lahre, (U.S. Environmental Protection Agency, Office of Air QualityPlanning and Standards). Research Triangle Park, North Carolina: Research TriangleInstitute, April 25, 1994.
100. Kim, I. Incinerators and Cement Kilns Face Off. Chemical Engineering. April 1994.
6-10
101. U.S. EPA. Technical Support for Revision of the Hazardous Waste CombustionRegulations for Cement Kilns and Other Thermal Treatment Devices, Second Draft. Prepared by Energy and Environmental Research Corporation, Irvine, California. Washington, D.C.: U.S. Environmental Protection Agency, Office of Solid Waste. May 17, 1994.
102. U.S. EPA. IERL-RTP Procedure Manual: Level 1 Environmental Assessment (2nd ed.). EPA-600/7-78-201. Interagency Energy/Environment R&D Program Report. U.S. Environmental Protection Agency, October 1978.
103. Cooke, M., F. DeRoos, and B. Rising. Hot Flue Gas Spiking and Recovery Study forTetrachlorodibenzodioxins (TCDD) Using Modified Method 5 and SASS (SourceAssessment Sampling System) Sampling with a Simulated Incinerator. EPA-600/2-84/159. Research Triangle Park, North Carolina: U.S. EnvironmentalProtection Agency, Industrial Environmental Research Laboratory, 1984.
104. Standards of Performance for New Stationary Sources, Appendix A, Test Method 23 -Determination of Polychlorinated Dibenzo-p-Dioxins and Polychlorinated Dibenzofuransfrom Stationary Sources. Federal Register, 60(104)28378-28426, May 31, 1995.
105. California Air Resources Board. Stationary Source Test Methods, Volume III: Methodsfor Determining Emissions of Toxic Air Contaminants from Stationary Sources. Sacramento, California: California Air Resources Board, Monitoring and LaboratoryDivision, 1989.
106. American Society of Mechanical Engineers. Analytical Procedures to Assay StackEffluent Samples and Residual Combustion Products for PolychlorinatedDibenzo-p-Dioxins (PCDD) and Polychlorinated Dibenzofurans (PCDF). Washington,D.C.: U.S. Department of Energy and U.S. Environmental Protection Agency, 1984.
107. U.S. EPA. Test Methods for Evaluating Solid Waste, 3rd ed. Method 8280 - TheAnalysis of Polychlorinated Dibenzo-p-Dioxin and Polychlorinated Dibenzofurans. SW-846. Washington, D.C.: Office of Solid Waste, 1986.
108. U.S. EPA. Test Methods for Evaluating Solid Waste, 3rd ed. Method 8290 - TheAnalysis of Polychlorinated Dibenzo-p-Dioxin and Polychlorinated Dibenzofurans byHigh-Resolution Gas Chromatography/High-Resolution Mass Spectrometry. SW-846. Washington, D.C.: Office of Solid Waste, 1986.
APPENDIX A
METHODS FOR ESTIMATING NATIONAL CDD/CDF EMISSIONS
ii
Note: The national emissions estimates presented here are those that were available at the timethis document was published. Ongoing efforts and studies by the U.S. EnvironmentalProtection Agency will most likely generate new estimates. The reader should contact theU.S. Environmental Protection Agency for the most recent estimates.
The national dioxin/furan emissions estimates for MWCs were obtained directly from work done
by EPA's Emission Standards Division (ESD) to support MACT standards for this source
category. The estimates are based on dioxin data collected by the EPA during its "MWC1
Survey" in 1994. The dioxin emissions data that were collected were combined with MWC plant
design data, plant annual utilization rate data, and flue gas flow rate conversion factors to
calculate annual dioxin emission estimates. ESD calculated estimates for three different time
periods (1993, 1995, and 2000), and the 1995 estimate is presented in this document because it is
the most recent estimate. A summary of the methods used to determine the estimates are
provided here. More detailed information on the derivation of the estimates can be obtained from
the cited reference 1.1
There are three main types of municipal waste incinerators in the United States: mass burn (MB),
refuse derived fuel (RDF), and modular combustors (MOD). Mass burn combustors are the most
common type of combustor, representing 54 percent of all municipal waste combustors (MWCs)
in the United States, followed by modular facilities (32 percent) and RDF facilities (13 percent).2
According to the 1994 Maximum Achievable Control Technologies (MACT) Study there are
158 existing MWC facilities with design capacities above 38.6 tons/day. The facilities designed to
burn less than 38.6 tons/day account for less than one percent of the total waste flow to MWC
facilities. Of the total MWC capacity in the United States, about 58 percent of municipal waste2
is treated in mass burn facilities, 29 percent in RDF-fired facilities, 9 percent in modular
combustors, and 4 percent in other MWC designs.2
A-2
Dioxin test results for 1993 were compiled from emission source tests performed between 1985
and 1993 (see Table A-1). In a limited number of cases, test results from 1994 on individual units
were used if there were no changes in MWC unit operation or air pollution control device
(APCD) configurations since 1993. Where the emission test date in the table is noted as 1985
through 1989, the data were gathered by OAQPS to develop the new source performance
standards and emissions guidelines proposed for MWCs in 1989 (December 1989). Where the
emission test date is noted as 1990 through 1994, the data were gathered by OAQPS, or
submitted to OAQPS, as part of one of the following efforts:
1. Data gathered by OAQPS to develop the revised new source performancestandards and emission guidelines for MWCs proposed on September 20, 1994;
2. Data submitted to OAQPS in response to the "MWC Survey" of dioxin emissions;or
3. Data submitted to the docket (A-90-45) as public comments on the revised newsource performance standards and emission guidelines proposed on September 20,1994.
For facilities with dioxin test data, the following criteria were used to determine the most
representative test results for each facility for 1993:
For facilities with more than one test result, the most recent test was used. Theseresults were chosen such that they were representative of plant operation at theend of 1993. Exceptions to this were in cases when two or more tests wereconducted at a MWC over a relatively short period of time. Then, the average ofthese tests was used to represent the 1993 emissions.
At facilities with multiple units where not all units were tested, an average of thetest results from the tested units was used as a representative value for theuntested units.
Test results were obtained for approximately 55 percent of the domestic MWCs. For the other45 percent, a set of default values was created and used to estimate dioxin concentrations. Theset of default values was compiled from test data, AP-42 emission factors, and from the EPA
A-3
Table A-1
Test Data Used for 1993 National Dioxin Estimates for MWCs
Region Unit Name State (tpd) Combustors Type Devices Number (tpd) Total TEQ Year
Total AirPlant Pollution Combustor
Capacity Number of Combustor Control Combustor Capacity
3 I-95 Energy RRF (Fairfax) VA 3000 4 MB/WW FF/SD 1 750 9 0.230 1993
2 750 6 0.170 1993
3 750 8 0.200 1993
4 750 7 0.150 1993
3 Norfolk Navy Yard VA 2000 4 RDF ESP 1 500 21129 429.000 1993
2 500 32237 595.000 1993
3 500 42955 1500.000 1994
4 500 26360 800.000 1993
5 LaCrosse Co. WI 400 2 RDF/FB DSI/EGB 1 200 63 NA 1993
5 St. Croix Co. WTE Fac. WI 115 3 MOD/SA 1 38 8 NA 1988
Dioxin concentrations are listed both in units of ng/dscm total mass and ng/dscm TEQ where both were available. The TEQ concentration data were used for TEQ emissionsacalculations where TEQ data were available, and where TEQ data were not available a conversion ratio of 50:1 (total:TEQ) was used to convert the total mass data to TEQ.Pinellas data are average of three separate tests done during one year.bAkron data were from 1994 test, and assumed to be representative of Akron pre-1994. MWC Survey discussion indicates that high ESP temperature was reported. cMontegomery North/South data (except for Unit No. 3 at North) are an average value determined based on numerous tests.dAlexandria data in MWC survey were from a test run without carbon injection. Since the unit has carbon injection, an additional reduction of 75% was assumed.e
NA = Data not available
A-9
document EPA-450/3-89-27e "Municipal Waste Combustors - Background Information for
Proposed Guidelines for Existing Facilities" (this document presented the results of a study on3
APCD retrofits on MWC units). Default values were generated for every MWC combustor type
and APCD configuration for which a default value was needed. Test data available to OAQPS, as
of January 15, 1995, were organized into groups based on MWC combustor type and APCD
configurations and averaged. These averages were designated as the default values for the
corresponding combustor/APCD configurations. For the combustor/APCD configurations where
there were no test data available, default values were obtained from the MWC section in AP-42,4
or from EPA document EPA-450/3-89-27e. A summary of the default values is given in
Table A-2.
To estimate annual emissions, a capacity factor for each unit is needed. This factor represents the
percentage of operational time a plant has operated during one year. By using the capacity factor
and unit capacity, the annual throughput (combustion) of MSW or RDF can be calculated. Some
facilities provided data to OAQPS on the tonnage of municipal waste burned in year 1993. For
these facilities, a capacity factor was estimated by dividing the tonnage burned in one year by the
unit s rated yearly capacity and was used for the 1993 emissions calculation. For most units,
however, the capacity factors used were default values taken from EPA document
EPA-450/3-89-27e. For all units except modular/starved-air combustors, the default capacity
factor was 91 percent (0.91). For modular/starved-air units, the default capacity factor was
74 percent (0.74).
For many test results and for all dioxin default concentrations, TEQ concentrations were not
available. Similar to the development of the default dioxin concentrations, a default total mass-to-
TEQ ratio was also developed. Test results from units for which there were both total mass and
TEQ results available were used to develop a default ratio of total dioxin concentration to TEQ
concentration. The total:TEQ ratios from these units were averaged, resulting in a default ratio of
Values presented in this table are averages of available data for various combustor type/APCD type combinations.aValues were estimated based on a compilation of the MWC survey data, background information for the 1991 and1994 MWC rulemakings, public comments received on the 1994 MWC rulemaking, and AP-42 (5th edition). Noneof the data listed provides credit for supplemental dioxin control (polishing) by carbon injection. The use of carboninjection typically reduces dioxin emissions by an additional 75 percent or more. (See Air Docket A-90-45, itemsVI-B-013 and VI-B-014).
* ESP operated at less than 440 F.
APCD = air pollution control device MOD = modularDSI = duct sorbent injection RC = rotary combustorEA = excess air RDF = refuse derived fuelEGB = electrified gravel bed REF = refractory wallESP = electrostatic precipitator SA = starved airFB = fluidized bed SD = spray dryerFF = fabric filter WW = waterwallMB = mass burn
Emissions gyr
C x V x T x CF109
A-11
50:1. This ratio was used for estimating TEQ emissions for all sources where TEQ test data were
not available.
The F factor is a standard conversion factor used in combustion calculations to determinedexhaust flowrates based on heat input. Full documentation of F factors is given in 40 CFR 60,dAppendix A, Method 19. The specific F factor for municipal waste combustion, given bydMethod 19, is 9,570 dry standard cubic feet of flue gas per million Btu (dscf/MMBtu) of
municipal waste combustion. This flow rate is based on 0 percent O in the flue gases.2
Average heating values for fuels derived from municipal wastes are given in the Refuse
Combustion section of AP-42. For unprocessed municipal solid waste (MSW), the heating value
is 4,500 Btu per pound. For RDF, the heating value is 5,500 Btu per pound. The heating value
for RDF is higher than general MSW because RDF goes through some degree of pre-processing
to remove non-combustible materials.
The first step in calculating annual dioxin emissions from MWCs was to calculate the emissions
from individual units. This task was accomplished with plant-specific information such as dioxin
emission concentration, unit size, unit capacity factor, fuel heating value, and the F factor. d
The following equation was used to convert dioxin stack concentrations (total and TEQ) to grams
per year (g/yr) emitted:
where:
Emissions = Annual dioxin emissions (g/yr)
C = Flue Gas Dioxin Concentration (ng/dscm @7 percent O )2
V = Volumetric Flow Factor (dscm @7 percent O /ton waste fired)2
V Fd x HV x 2000 x 10 6
35.31x 20.9
20.9 7
HV = Heating Value (4,500 Btulb
for MSW and 5,500 Btulb
for RDF)
V =9,570
dscf @ 0% O2
MMBtu4,500 Btu
lb2,000 lb
ton
35.31 dscfdscm
106 BtuMMBtu
x 20.920.9 7
= 3,668dscm @ 7%O2
ton MSWfor non RDF units
V =9,570
dscf @ 0% O2
MMBtu5,500 Btu
lb2,000 lb
ton
35.31 dscfdscm
106 BtuMMBtu
x 20.920.9 7
= 4,482dscm @ 7%O2
ton RDFfor RDF units
A-12
T = Tons of MSW burned/year (@100 percent capacity for 365days/year)
CF = Capacity Factor (unitless)
The volumetric flow factor (V) is calculated as follows:
where:
10 ngdscm
@ 7% O2 3,670 dscm @ 7% O2ton
182,500 tonyr
0.91
109 ngg
A-13
Example Calculation
For a mass burn/waterwall (non-RDF) unit, rated at 500 tons/day capacity (365,000 tons/yr), with
a dioxin concentration of 10 ng/dscm (total mass) @7 percent O , annual dioxin emissions are2calculated to be:
= 6.1 g dioxin/yr (total mass), or
= 6.1/50 = 0.12 g dioxin/yr (TEQ)
Individual emission estimates were developed for all operational MWCs in the U.S., and the
individual estimates were summed to provide the 1993 national CDD/CDF emissions estimate for
MWCs.
The 1995 CDD/CDF estimate is based on the same data and methodology as that used to develop
the 1993 estimate. To develop the 1995 estimate, data for 11 facilities were adjusted to reflect
reduced emissions levels. During the 1993 inventory, 11 facilities were found to have elevated
dioxin emission concentrations and corrective actions were initiated at these MWCs to reduce
emissions. The 1995 CDD/CDF emissions estimate incorporates the expected emissions
reductions at these facilities after corrective actions have been taken. The development of the
1995 CDD/CDF estimate is discussed in detail in Reference 1.
The national emissions estimate of 2,3,7,8-TCDD TEQ from MWCs is 1.61 lb/yr.
A-14
MEDICAL WASTE INCINERATION
Basis for Calculation
There are approximately 3,400 medical facilities in the United States. Using facility capacities, it2
was estimated that about 846,000 tons of medical waste were incinerated in 1995. The national5
dioxin/furan emissions estimates for medical waste incinerations (MWIs) were obtained directly
from work done by EPA's Emission Standards Division (ESD) to support Maximum Achievable
Control Technology (MACT) standards for this source category. A summary of the methods6
used to determine the estimates are provided here. More detailed information on the derivation of
the estimates can be obtained from Reference 6.
The starting point for the national estimates is a 1995 inventory of existing MWIs, which includes
for each MWI the location, type (batch or non-batch), and the design capacity of the unit. The
information used to develop the inventory was taken from a number of sources including a listing
of MWIs prepared by the American Hospital Association (AHA), state air permits gathered by
EPA, and a survey of MWIs in California and New York conducted by EPA in 1995. The AHA
inventory was itself taken from two sources; an EPA "Locating and Estimating" document and a
vendor listing. Once this information was compiled, the inventory was reviewed and modified
based on updates from state surveys, commercial sources, and MWI vendors.
The capacity of each MWI was provided in the inventory. The capacities for the continuous and
intermittent MWIs in the inventory were expressed in terms of an hourly charging rate in pounds
per hour (lb/hr). Batch MWI capacities were provided in pounds per batch (lb/batch). Therefore,
batch MWIs were evaluated separately from the continuous and intermittent MWIs and the batch
capacities were not converted to hourly burning rates.6
Also included in the inventory was the applicable state particulate matter (PM) emission limit for
each MWI. The AHA listing of MWIs and the state air permits included PM limits for each MWI.
A-15
Where PM limits were not listed, limits were applied based on State regulatory requirements using
the same methods described in the MACT floor analysis for the proposed standards. PM limits
could be used to estimate the type of emission control at MWIs for which the control was not
identified for the MWI.
Nationwide MWI emissions were calculated by first calculating MWI emissions on a unit specific
basis using the MWI inventory and considering unit specific parameters. Actual emission control
data was used where available and was estimated when not available. In calculating emissions and
estimating operating parameters, there are three distinct types of MWIs as follows: batch,
intermittent, and continuous. The difference in these three MWI types is in the methods of
charging waste to the MWI and removing ash from the primary chamber of the MWI.
Continuous MWIs, which are the largest of the three types, have mechanical ram feeders and
continuous ash removal systems. These features allow the unit to operate 24 hours per day for
many days at a time. Most intermittent MWIs also have mechanical ram feeders that charge
waste into the primary chamber. However, intermittent MWIs do not have an automatic ash
removal system, and can only be operated for a limited number of hours before the unit must be
shut down for ash removal. In batch MWIs, all of the waste to be burned is loaded into the
primary chamber and, once the burning cycle begins, no additional waste is loaded. After the burn
cycle for a batch unit is complete and the unit has cooled down, the ash is removed manually. In
the inventory of existing MWIs used to estimate the nationwide dioxin emissions, a differentiation
was made between batch and nonbatch (continuous and intermittent) MWIs. However, no
distinction was made between continuous and intermittent MWIs in the final inventory.6
The hours of operation were estimated for each MWI type in the inventory in order to determine
the annual waste incinerated. The hours of operation were defined as the hours during which the
MWI combusts waste.
For batch MWIs, it is estimated that a typical MWI charges waste 160 times per year (i.e., 160
batches/yr; 3 batches per week). The amount of waste burned each year in a batch unit and the
A-16
yearly emissions produced depend primarily on the unit capacity and the annual number of
batches. Because of this relationship, it was unnecessary to determine the actual hours of
operation for batch MWIs.
For continuous and intermittent MWIs, operating hours were estimated for three size categories
( 500, 501 to 1,000, and >1,000 lb/hr). All MWIs with capacities less than 500 lb/hr were
assumed to be intermittent MWIs. The waste charging hours for intermittent MWIs with
capacities less than 500 lb/hr were estimated at 1,250 hours per year (hr/yr). Since the inventory
does not indicate whether an MWI is continuous or intermittent, a ratio of about 3 to 1,
intermittent to onsite continuous, was used to estimate the hours of operation for onsite
continuous and intermittent MWIs with capacities greater than 500 lb/hr. The average operating
hours for continuous MWIs in the 501 to 1,000 lb/hr size category was 2,916 hr/yr and the
average charging hours for intermittent MWIs in this size category was 1,500 hr/yr. The
weighted average of the charging hours for the combined continuous and intermittent MWIs was
determined as follows:
(1,500 hr/yr x 0.77) + (2,916 hr/yr x 0.23) = 1,826 hr/yr
Large MWIs with design capacities greater than 1,000 lb/hr were estimated to operate 2,174 hr/yr
and all commercial MWIs were estimated to operate 7,776 hr/yr. A summary of the waste
charging hours for the continuous and intermittent MWIs is presented below.6
NOTE: "Capacity factor" means ratio of tons of waste actually burned per yeardivided by the tons of waste that could be burned per year had the unit benoperating at full capacity.
A-17
A capacity factor represents the percentage of operational time a MWI has operated in 1 year.
Capacity factors were calculated for each MWI size category based on the ratio of the actual
annual charging hours to the maximum annual charging hours. For intermittent MWIs, the
maximum annual charging hours were estimated to be 4,380 hr/yr. This is based on 12 charging
hours per day and 365 days per year because intermittent MWIs must shut down for daily ash
removal. The maximum annual charging hours for continuous MWIs were estimated to be
8,760 hr/yr based on 24 charging hours per day and 365 days per year. All commercial MWIs
were assumed to be continuous units. The maximum annual charging hours for onsite MWIs with
capacities greater than 500 lb/hr were estimated to be 5,475 hr/yr, based on the 3 to 1 ratio of
intermittent to onsite continuous MWIs discussed previously. The calculated capacity factors for
each MWI size category are shown in the box on the previous page.
Waste charging rates measured during emissions tests show the average hourly charging rates to
be about two-thirds of the MWI design rates specified by incinerator manufacturers. Therefore,
waste was assumed to be charged at two-thirds of the MWI design capacity. Using the operating
hours per year (or number of batches per year for batch units) and the corrected waste charge rate
(two-thirds of the design rate), the amount of waste burned annually was determined for each
MWI.
Actual emission control data was used where available and was estimated when necessary. When
emission control system type was unknown it was estimated based on (1) the average PM
emission rates for the different types of emission controls and (2) the PM limit to which the MWI
is subject. For example, the average PM emission rate for intermittent and continuous MWIs with
1/4-second combustion control was estimated from test data to be 0.30 grains per dry standard
cubic feet (gr/dscf). Thus, any MWI with a PM emission limit greater than 0.30 gr/dscf was
assumed to have a 1/4-second combustion system. The PM emission limit ranges for all of the
emission controls are shown below.
A-18
PM Emission Limit (gr/dscf at 7% O ) Assumed Level of Emission Control2
Intermittent and continuous MWIs
0.3 1/4-sec combustion control0.16 x <0.3 1-sec combustion control.10 x 0.16 2-sec combustion control0.015 < x <0.10 Wet scrubbers
0.015 Dry scrubbersBatch MWIs
0.079 1/4-sec combustion control0.042 x < 0.079 1-sec combustion control0.026 x <0.042 2-sec combustion control<0.026 Wet scrubbers
An analysis of EPA-sponsored emission test data showed a direct relationship between the
CDD/CDF emissions on a "total" dioxin basis and a "TEQ" basis. For total CDD/CDF emissions
greater than 150 nanograms per dry standard cubic meter (ng/dscm), the ratio of total CDD/CDF
emissions to the TEQ emissions was 48:1. For total CDD/CDF emissions less than 150 ng/dscm,
the ratio was 42:1. These ratios were used with test data on total CDD/CDF emissions to
develop TEQ emission factors for each type of emission control. The resulting dioxin and TEQ
emission factors are shown in Table A-3.
Table A-3
Total Dioxin and TEQ Emission Factors
Type of Emission Control Dioxin/lb Waste Dioxin/lb WasteTEQ Factors, lb/TEQ Dioxin Factors, lb Total
1/4-sec combustion control 3.96 x 10 1.94 x 10⁻⁹ -7
1-sec combustion control 9.09 x 10 4.45 x 10⁻¹⁰ -8
2-sec combustion control 7.44 x 10 3.65 x 10⁻¹¹ -9
Wet scrubbers 1.01 x 10 4.26 x 10⁻¹¹ -10
Dry scrubbers no carbon 7.44 x 10 3.65 x 10⁻¹¹ -10
Dry scrubbers with carbon 1.68 x 10 7.04 x 10⁻¹² -11
Fabric filter/packed bed 6.81 x 10 3.34 x 10⁻¹⁰ -8
A-19
In combination with the MWI parametric data, control technology data, and emission factors the
following equation calculates the annual dioxin emissions from each MWI in the MWI inventory:
Emissions = (C x H x C ) x F x Q1
Where:
Emissions = Annual dioxin emissions, g/yr
C = MWI capacity, lb/hr
H = Charging hours, hr/yr
C = Ratio of waste charging rate to design capacity, 2:31
F = Emission factor for the appropriate level of control(lb dioxin/lb waste charged), and
Q = Conversion factor for pounds to grams, 453.6 grams/lb.
The CDD/CDF emissions from the individual MWIs in the inventory were calculated by
multiplying the annual amount of waste burned by the appropriate emission factor from
Table A-3. Next, the annual emissions from each MWI were summed to estimate the total 1995
CDD/CDF emissions from MWIs. CDD/CDF emissions from MWIs in 1995 are estimated to be
16 pounds on a total mass basis and 0.332 pounds on a 2,3,7,8-TCDD TEQ basis.6
2,3,7,8 TCDD national emissions estimate = (9.5 x 10⁵ ton/yr incinerated)
x (1.0 x 10 9 lb/ton incinerated)
= 9.5 x 10 4 lb/yr
2,3,7,8 TCDF national emissions estimate = (9.5 x 10⁵ ton/yr incinerated)
x (3.6 x 10 7 lb/ton incinerated)
= 3.42 x 10 1 lb/yr
2,3,7,8 TCDD TEQ national emissions estimate = (9.5 x 10⁵ ton/yr incinerated)
x (5.57 x 10 8 lb/ton incinerated)
= 5.29 x 10 2 lb/yr
A-20
SEWAGE SLUDGE INCINERATION
Basis for Calculation
In 1995, there were 143 operating sewage sludge facilities in the United States, and more than2
80 percent of the facilities were multiple hearth incinerators. In 1992, approximately7
9.5x10 tons of dry sewage sludge were incinerated. Emission factors for 2,3,7,8-TCDD and5 2
2,3,7,8-TCDF from a multiple hearth incinerator with an impingement tray scrubber in place were
obtained from AP-42. The emission factors were multiplied by the tons of sludge incinerated to7
2,3,7,8-TCDD national emissions estimate = (4.58x10 lb/body) x (400,500 bodies/yr)-14
= 1.83x10 lb/yr-8
2,3,7,8-TCDF national emissions estimate = (3.31x10 lb/body) x (400,500 bodies/yr)-13
= 1.33x10 lb/yr-7
A-54
REMAINING SOURCE CATEGORIES
National dioxin/furan emissions from the following source categories could not be calculated
because of lack of additional information (e.g., activity data):
Industrial waste incineration;
Scrap metal incineration;
PCB fires;
Municipal solid waste landfills; and
Organic chemical manufacturing.
A-55
REFERENCES
1. National Dioxin Emission Estimates from Municipal Waste Combustors. U.S. Environmental Protection Agency, Emission Standards Division, Office of AirQuality Planning and Standards, Research Triangle Park, North Carolina. June 1996. Docket A-90-45, Item VII-A-001.
2. U.S. Environmental Protection Agency. Emissions Inventory of Section 112(c)(6)Pollutants: Polycyclic Organic Matter (POM),2,3,7,8-Tetrachlorodibenzo-P-Dioxin (TCDD)/2,3,7,8,-Tetrachlorodibenzofuran (TCDF),Polychlorinated Biphenyl Compounds (PCBs), Hexachlorobenzene, Mercury, andAlkylated Lead. Draft Report. Office of Air Quality Planning and Standards, ResearchTriangle Park, North Carolina, 1996.
3. U.S. EPA. Municipal Waste Combustors - Background Information for ProposedGuidelines for Existing Facilities. EPA-450/3-89-27e. August 1989.
4. U.S. EPA. Compilation of Air Pollutant Emission Factors, 5th ed. , Vol. I: StationaryPoint and Area Sources. Research Triangle Park, North Carolina: U.S. EnvironmentalProtection Agency, 1995.
5. Federal Register, Vol. 61, No. 120, June 20, 1996. Standards of Performance for NewStationary Sources and Emission Guidelines for Existing Sources: Medical WasteIncinerators. Proposed Rule.
6. National Dioxin Emissions From Medical Waste Incinerators. U.S. EnvironmentalProtection Agency, Emission Standards Division, Office of Air Quality Planning andStandards, Research Triangle Park, North Carolina. June 1996. Docket #A-91-61,ITCM, IV-A-007.
7. U.S. EPA. Emission Factor Documentation for AP-42, Chapter 2.5 Sewage SludgeIncineration. Research Triangle Park, North Carolina: U.S. Environmental ProtectionAgency, 1993. pp. 2.5-13 to 2.5-17.
8. Oppelt, E.T. Incineration of Hazardous Waste--A Critical Review. Journal of AirPollution Control Association. 37(5):558-586, 1987.
9. Memorandum from G. Rizeq, EER Corporation, to F. Behan, U.S. EnvironmentalProtection Agency. "TEQ and Mercury National Emissions Estimate for HazardousWaste Incinerators." April 3, 1997.
A-56
10. Draft Technical Support Document: HAPs National Emissions Estimate for HazardousWaste Combustor Systems. Prepared by EER Corporation for the EnvironmentalProtection Agency's Office of Solid Waste (OSW). April, 1997.
11. Memorandum from G. Rizeq, EER Corporation, to F. Bekan, U.S. EnvironmentalProtection Agency. "National Emissions Estimates for TEQ and Mercury." April 7, 1997.
12. Memorandum from E. Heath, Research Triangle Institute to J. Wood, U.S. EnvironmentalProtection Agency. March 18, 1996. "Dioxin/Furan Toxic Equivalent Emissions fromCement Kilns that do not Burn Hazardous Waste."
13. Draft Technical Support Document for Hazardous Waste Combustion (HWC) MACTStandards, Volume II: HWC Emissions Database, Appendix A: Cement Kiln DetailedData Listing, U.S. Environmental Protection Agency, Office of Solid Waste andEmergency Response. September, 1995.
14. Radian Corporation. Modesto Energy Company Waste Tire-to-Energy Facility, Westley,California, Final Emission Test Report. Report No. 243-047-20. Research Triangle Park,North Carolina: Radian Corporation, 1988.
15. U.S. EPA. Summary and Markets for Scrap Tires. EPA/530-SW-90-074B. Washington,D.C.: Office of Solid Waste and Emergency Response, U.S. Environmental ProtectionAgency, 1992.
16. Cole, J. (Research Triangle Institute). Memorandum to W. Maxwell, (U.S. EnvironmentalProtection Agency), Research Triangle Park, North Carolina. January 19, 1995.
17. Someshwar, A.V. Summary of Mill Test Reports on Wood Residue Combustion, BlackLiquor Combustion, and Kraft Mill Sludge Burning. NCASI Files. Gainesville, Florida: National Council of the Paper Industry for Air and Stream Improvement, Inc., 1995.
18. Energy Information Administration. Estimate of U.S. Biofuels Consumption 1990. DOE/EIA-0548(90). Washington, D.C.: Office of Coal, Nuclear, Electric, andAlternative Fuels, U.S. Department of Energy, 1991. p. 9.
19. Energy Information Administration. State Energy Data Report. Washington, D.C.: Office of Energy Markets and End Use, U.S. Department of Energy, 1992.
20. Energy Information Administration. February, 1993. Household Energy Consumptionand Expenditures 1990. DOE/EIA-0321(90).
A-57
21. Energy Information Administration. February 1993. Household Energy Consumption andExpenditures 1990, Supplement: Regional. Office of Energy Markets and End Use. DOE/EIA-0321(90/S). pp. 30, 115, 205, and 297.
22. Letter and attachments from David Menotti, Shaw, Potts, and Trowbridge, to Anne Pope,U.S. EPA. Comments to the draft 112(c)(6) emissions inventory report. November 27,1996.
23. U.S. EPA. June 1994. Estimating Exposures to Dioxin-Like Compounds, Volume II: Properties, Sources, Occurrence, and Background Exposures. External Review Draft. EPA-600/6-88-005Cb. Office of Health and Environmental Assessment, Washington,DC. pp. 3-143-3-146.
24. California Air Resources Board. Emissions Measurement of Toxic Compounds from aCupola Baghouse at a Steel Foundry. Report No. ERC-61. Sacramento, California: California Air Resources Board, 1993.
25. Research Triangle Institute. 1994. Preliminary Source Assessment for the SecondaryCopper Smelting Industry. Prepared for the U.S. Environmental Protection Agency,Research Triangle Park, North Carolina.
26. U.S. EPA. 1987. National Dioxin Study Tier 4-Combustion Sources. Final Test Report-Site 10 Secondary Copper Recovery Cupola Furnace MET-A. EPA-450/4-87-014s. Research Triangle Park, North Carolina.
27. Larrabee, D.A. Lead. In: U.S. Industrial Outlook 1991. U.S. Department of Commerce,International Trade Administration, Washington, DC. 1991.
28. U.S. EPA. Secondary Lead Smelting Background Information Document forPromulgated Standards. EPA-453/R-95-008B. Research Triangle Park, North Carolina.
29. U.S. EPA. Draft Emission Test Report. HAP Emission Testing a Selected Sources at aSecondary Lead Smelter. East Penn Manufacturing Company. Prepared by Roy F.Weston, Inc. 1993.
30. U.S. EPA. Draft Emission Test Report. HAP Emission Testing on Selected Sources at aSecondary Lead Smelter. Tejas Resources, Inc. Prepared by Roy F. Weston, Inc. 1992.
31. U.S. EPA. Draft Emission Test Report. HAP Emission Testing in Selected Sources at aSecondary Lead Smelter. Schulkill Metals Corporation. Prepared by Roy F. Weston, Inc. 1993.
A-58
32. Memorandum from Bob Strieter, The Aluminum Association, to Juan Santiago,U.S. Environmental Protection Agency. Annual Dioxin Emissions from SecondaryAluminum Production. May 17, 1996.
33. Memorandum from Juan Santiago, U.S. Environmental Protection Agency, to JackJohnson, Eastern Research Group, Inc. New Dioxin/Furan Emissions Data Received fromthe Aluminum Association, Research Triangle Park, North Carolina. January 22, 1997.
34. U.S. Federal Highway Administration's Highway Statistics. Washington, D.C.: U.S.Department of Transportation, 1992.
35. U.S. EPA. MOBILE5a Emission Factor Model. Ann Arbor, Michigan: Office of MobileSources, U.S. Environmental Protection Agency, 1993.
36. U.S. EPA. 1990 Census of Pulp, Paper and Paperboard Manufacturing Facilities. Response to 308 Questionnaire, Part A: Technical Information. Washington, D.C.: Office of Water, U.S. Environmental Protection Agency, 1992.
37. California Air Resources Board. Inventory of Chlorophenol Use in the Forest ProductsIndustry and Investigation of Related Emissions of Chlorinated Dibenzodioxins andDibenzofurans, Final Report. Sacramento, CA: California Air Resources Board, 1987.
38. Humer, C. Activated Carbon Plant Starts for American Novit. Chemical MarketingReporter. June 1992.
39. U.S. EPA. Estimating Exposure to Dioxin-like Compounds, Volume II: Properties,Sources, Occurrence, and Background Exposures, External Review Draft. EPA-600/6-88-005 Cb. Washington, D.C.: Exposure Assessment Group, Office ofHealth and Environmental Assessment, U.S. Environmental Protection Agency, 1994.
40. Peterson, J. (Mt. Baker--Snoqualmie National Forest) and D. Ward (Forest Service FireLab). An Inventory of Particulate Matter and Air Toxic Emissions from Prescribed Firesin the United States for 1989. Proceedings of the Air and Waste ManagementAssociation 1993 Annual Meeting and Exhibition. Denver, Colorado. June 14 to 18,1993.
41. California Air Resources Board. Emissions Testing of a Propane Fired Incinerator at aCrematorium. Report No. ERC-39. Sacramento, California: California Air ResourcesBoard, 1992.
42. Cremation Association of North America. Cremation Statistics. Cremationist. Chicago,Illinois: Cremation Association of North America, 1992.