CHAPTER TEN Location-Based Computing for Infrastructure Field Tasks Amin Hammad, James. H. Garrett, Jr. and Hassan A. Karimi 10.1 INTRODUCTION Infrastructure plays a key role in the economic prosperity and the quality of life of a nation. If not maintained, the quality of service of that infrastructure drops due to the effects of deterioration, and in some cases, results in sudden failure and loss of lives. A recent report from the American Society of Civil Engineers emphasized the poor conditions of the infrastructure in the U.S. (ASCE, 2001). Inspection and maintenance activities are expensive and time-consuming. The type and amount of data to be collected during inspection vary according to the specific approach adopted by an infrastructure management agency. Taking bridges as an example of infrastructure, there are nearly 590,000 bridges in the American National Bridge Inventory that must be inspected at least every two years. The current approach to bridge inspection and assessment is based on a condition rating method, whereby the inspectors go to the bridge and assign a condition rating to the major components of the bridge. The rating of the entire bridge is based on the conditions of all of the elements no matter the relative importance of the elements. This approach, while easier to collect data, does not recognize that the nature and location of damage on an element, and the type of element, will greatly change the reliability of the overall structure. Frangopol et al. describe a reliability-based approach for managing highway bridge maintenance and claim that this approach could cost at least 50% less than conventional maintenance strategies if labor and user costs are considered (Frangopol et al., 2001). This reliability-based approach will require that a greater amount of condition information be collected from bridge elements. The location and amount of damage for all elements will have to be determined so that the relationship of the damage to the reliability of the elements and to the bridge can be assessed. Technological advancements in sensing and wireless communication systems are motivating the development of structural health monitoring systems using embedded sensing technology, such as MicroElectroMechanical Sytems (MEMS) based sensors (Lynch et al., 2002). These automated systems are expected to play a major role in providing the data needed for Frangopol’s reliability-based approach. However, these systems will not completely substitute for inspection methods, but will rather complement them. Therefore, inspection methods should be enhanced to support these emerging systems. Field engineers and technicians working on infrastructure projects need to determine and verify the location of structures and structural elements in order to
Transcript
CHAPTER TEN
Location-Based Computing for Infrastructure Field Tasks
Amin Hammad, James. H. Garrett, Jr. and Hassan A. Karimi
10.1 INTRODUCTION
Infrastructure plays a key role in the economic prosperity and the quality of life of a nation. If not maintained, the quality of service of that infrastructure drops due to the effects of deterioration, and in some cases, results in sudden failure and loss of lives. A recent report from the American Society of Civil Engineers emphasized the poor conditions of the infrastructure in the U.S. (ASCE, 2001). Inspection and maintenance activities are expensive and time-consuming. The type and amount of data to be collected during inspection vary according to the specific approach adopted by an infrastructure management agency. Taking bridges as an example of infrastructure, there are nearly 590,000 bridges in the American National Bridge Inventory that must be inspected at least every two years. The current approach to bridge inspection and assessment is based on a condition rating method, whereby the inspectors go to the bridge and assign a condition rating to the major components of the bridge. The rating of the entire bridge is based on the conditions of all of the elements no matter the relative importance of the elements. This approach, while easier to collect data, does not recognize that the nature and location of damage on an element, and the type of element, will greatly change the reliability of the overall structure. Frangopol et al. describe a reliability-based approach for managing highway bridge maintenance and claim that this approach could cost at least 50% less than conventional maintenance strategies if labor and user costs are considered (Frangopol et al., 2001). This reliability-based approach will require that a greater amount of condition information be collected from bridge elements. The location and amount of damage for all elements will have to be determined so that the relationship of the damage to the reliability of the elements and to the bridge can be assessed.
Technological advancements in sensing and wireless communication systems are motivating the development of structural health monitoring systems using embedded sensing technology, such as MicroElectroMechanical Sytems (MEMS) based sensors (Lynch et al., 2002). These automated systems are expected to play a major role in providing the data needed for Frangopol’s reliability-based approach. However, these systems will not completely substitute for inspection methods, but will rather complement them. Therefore, inspection methods should be enhanced to support these emerging systems.
Field engineers and technicians working on infrastructure projects need to determine and verify the location of structures and structural elements in order to
288 Telegeoinformatics: Location-Based Computing and Services collect the necessary data. They usually use maps, engineering drawings, databases, and other technical documents for this purpose (Bridge, 1995). In a typical scenario, a bridge inspector who is inspecting a reinforced concrete pier needs to know the number of the pier at which he or she is looking. The inspector may also want to look at the maintenance history of this pier and retrieve the location of cracks that have been found in previous inspections. The inspector also has to take notes about the locations and directions of any new cracks by drawing sketches, taking pictures, and writing a description of the problem.
With the increasing availability of commercial mobile and wearable computers, some of the aforementioned data can be collected and retrieved on-site using specialized data collection systems. One early example of such a system is that developed by the University of Central Florida for the Florida Department of Transportation (FDOT) (Kuo et al., 1994). The system consists of both a field and office set up with a pen-based notebook computer used to collect all field inspection data. The Massachusetts Highway Department is using a system called IBIIS to store and manage all of their bridge documents (Leung, 1996). As part of this system, inspectors are equipped with a video camcorder to take video and still photographs and a notebook computer to enter the rating data for each bridge and commentary. A more recent, Personal Digital Assistant (PDA) -based field data collection system for bridge inspection is Inspection On Hand (IOH) (Trilon, 2003). IOH helps inspectors capture all rating information, commentary and sketches using hand-held, pen-based PDAs, and share data with Pontis bridge management system.
Using mobile and wearable computers in the field under severe working and environmental conditions requires new types of interaction that increase the efficiency and safety of field workers. Research on systems aiming to provide information related to infrastructure, at different stages of their life cycle, to mobile workers has been undertaken. Garrett et al. (1998, 2000, 2002) discussed the issues in delivering mobile and wearable computer-aided inspection systems for field users. Sunkpho et al. (2002) developed the Mobile Inspection Assistant (MIA) that runs on a wearable computer and delivers a voice recognition-based user interface. They also proposed a framework for developing field inspection support systems that explicitly considers the objects to be inspected, the instrument used to collect data, the background inspection knowledge, and the collected inspection data. Bürgy and Garrett (2002) developed the Interaction Constraint Model that helps system designers identify relevant user interface concepts for applying mobile and wearable computers to a specific context based on the constraints imposed by the task to be performed (e.g., need for using other tools or for full attention), the type of the data needed for the application (e.g., text-based or drawing-based), the environment where the system will be used (e.g., lighting and noise), the type of the computer, and the abilities and work patterns of the user.
Mobility is a basic characteristic of field tasks. In the above bridge inspection scenario, the inspector has to move most of the time in order to do the job at hand. The inspector walks over, under or around the bridge, or in some cases climbs the bridge. Knowing the exact location of the inspector with respect to the inspected elements can greatly facilitate the task of data collection by automatically identifying the elements, and potentially specifying the locations of defects on these elements. Approximate location information can still help in focusing the scope of data collection by identifying the objects that are of interest. Present methods of
Location-Based Computing for Infrastructure Field Tasks 289 capturing location information using paper or digital maps, pictures, drawings and textual description can lead to ambiguity and errors in interpreting the collected data. The following description of the location of cracks in a bridge inspection report is a good example of this ambiguity: “Several cracks are found in the welds and base metal of the floor-beam web-to-top flange welds near the box girder connection of arches.”
Location-Based Computing (LBC) is an emerging discipline focused on integrating geoinformatics, telecommunications, and mobile computing technologies (see Chapter 5). LBC utilizes geoinformatics technologies, such as Geographic Information Systems (GISs) and the Global Positioning System (GPS) in a distributed real-time mobile computing environment. LBC is paving the way for a large number of location-based services and is expected to become pervasive technology that people will use in daily activities, such as mobile commerce, as well as in critical systems, such as emergency response systems. In LBC, elements and events involved in a specific task are registered according to their locations in a spatial database, and the activities supported by the mobile and wearable computers are aware of these locations using suitable positioning devices. For example, an inspection system based on LBC would allow the bridge inspector in the above scenario to accurately locate the cracks on a predefined 3D model of the bridge in real time without the need for any post-processing of the data.
One driving force behind LBC is the simultaneous emergence of a variety of applications that need some combination of GIS, GPS, and wireless communications. For example, the Federal Communication Commission mandates that all wireless carriers are supposed to provide the location of the emergency calls to Public Safety Answer Points with the accuracy of 125 m for 67% of calls by the end of 2005 (FCC, 2003). Another example is the advancements in Intelligent Transportation Systems (ITSs), such as advanced vehicle control systems, route navigation, and fleet management (ITSs are discussed in detail in Chapter 11).
Several applications of LBC related to infrastructure data collection have been practically used for a number of years, such as mobile mapping of highway features and the automated survey of pavement surface distress (Wang and Gong, 2002). These applications use high accuracy GPS, Inertial Navigation Systems (INSs), and CCD cameras that are connected to a high-performance computer system for image processing and georeferencing the resulting output data. In these applications, all the instruments are usually installed on a van and no interaction with the system is necessary. The requirements of these automated systems are different from those of data collection systems that need continuous interaction with the field workers.
In this chapter, we present and discuss the concept of a mobile data collection system for engineering field tasks based on LBC that we call LBC for Infrastructure field tasks or LBC-Infra. In the subsequent sections, we first present the LBC-Infra concept. Then, we review the component technologies of LBC-Infra and discuss the issues involved in the deployment of these technologies. Then, we discuss the requirements of LBC-Infra and identify its most promising system architectures based on available technologies and the modes of interaction. We also explore the specific interaction and communication methods needed in LBC-Infra. Finally, we report on a prototype system that has been developed to test and illustrate the discussed issues.
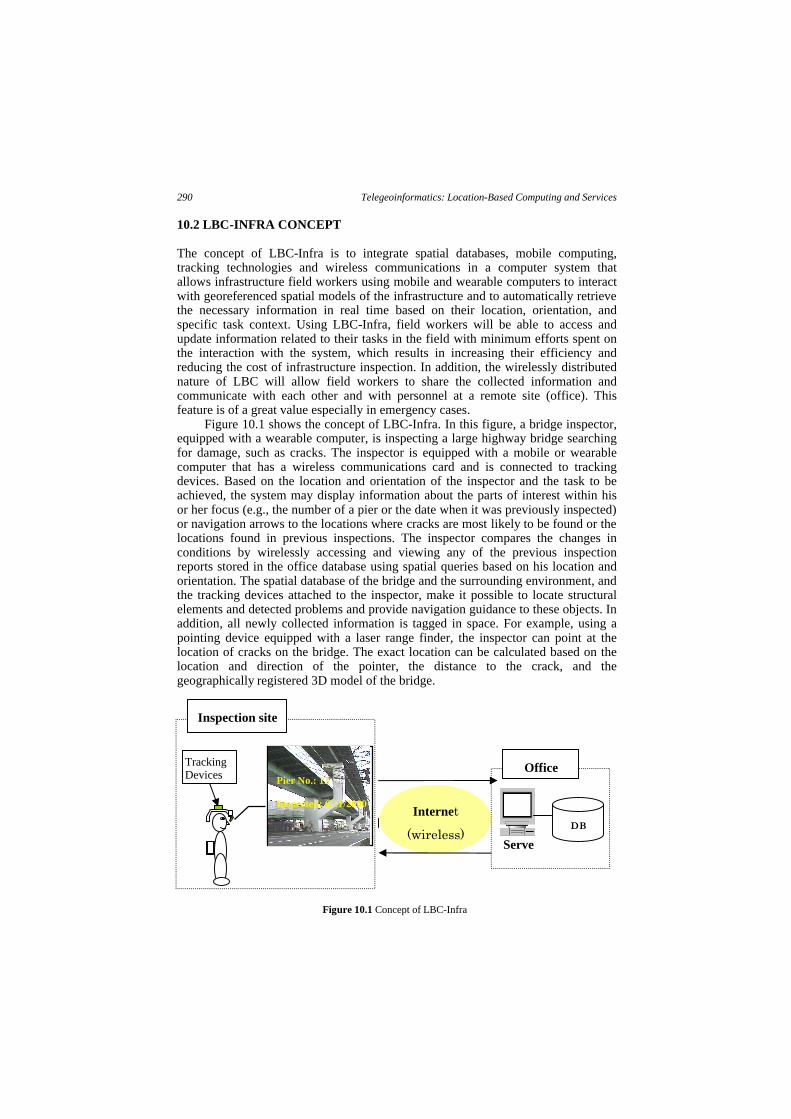
290 Telegeoinformatics: Location-Based Computing and Services 10.2 LBC-INFRA CONCEPT The concept of LBC-Infra is to integrate spatial databases, mobile computing, tracking technologies and wireless communications in a computer system that allows infrastructure field workers using mobile and wearable computers to interact with georeferenced spatial models of the infrastructure and to automatically retrieve the necessary information in real time based on their location, orientation, and specific task context. Using LBC-Infra, field workers will be able to access and update information related to their tasks in the field with minimum efforts spent on the interaction with the system, which results in increasing their efficiency and reducing the cost of infrastructure inspection. In addition, the wirelessly distributed nature of LBC will allow field workers to share the collected information and communicate with each other and with personnel at a remote site (office). This feature is of a great value especially in emergency cases.
Figure 10.1 shows the concept of LBC-Infra. In this figure, a bridge inspector, equipped with a wearable computer, is inspecting a large highway bridge searching for damage, such as cracks. The inspector is equipped with a mobile or wearable computer that has a wireless communications card and is connected to tracking devices. Based on the location and orientation of the inspector and the task to be achieved, the system may display information about the parts of interest within his or her focus (e.g., the number of a pier or the date when it was previously inspected) or navigation arrows to the locations where cracks are most likely to be found or the locations found in previous inspections. The inspector compares the changes in conditions by wirelessly accessing and viewing any of the previous inspection reports stored in the office database using spatial queries based on his location and orientation. The spatial database of the bridge and the surrounding environment, and the tracking devices attached to the inspector, make it possible to locate structural elements and detected problems and provide navigation guidance to these objects. In addition, all newly collected information is tagged in space. For example, using a pointing device equipped with a laser range finder, the inspector can point at the location of cracks on the bridge. The exact location can be calculated based on the location and direction of the pointer, the distance to the crack, and the geographically registered 3D model of the bridge.
Figure 10.1 Concept of LBC-Infra
Internet
(wireless)
Inspection site
Tracking Devices
DB
Serve
Office Pier No.: 12
Inspected: 6/11/2000
Location-Based Computing for Infrastructure Field Tasks 291 The inspector is providing input directly into the database with an inspection
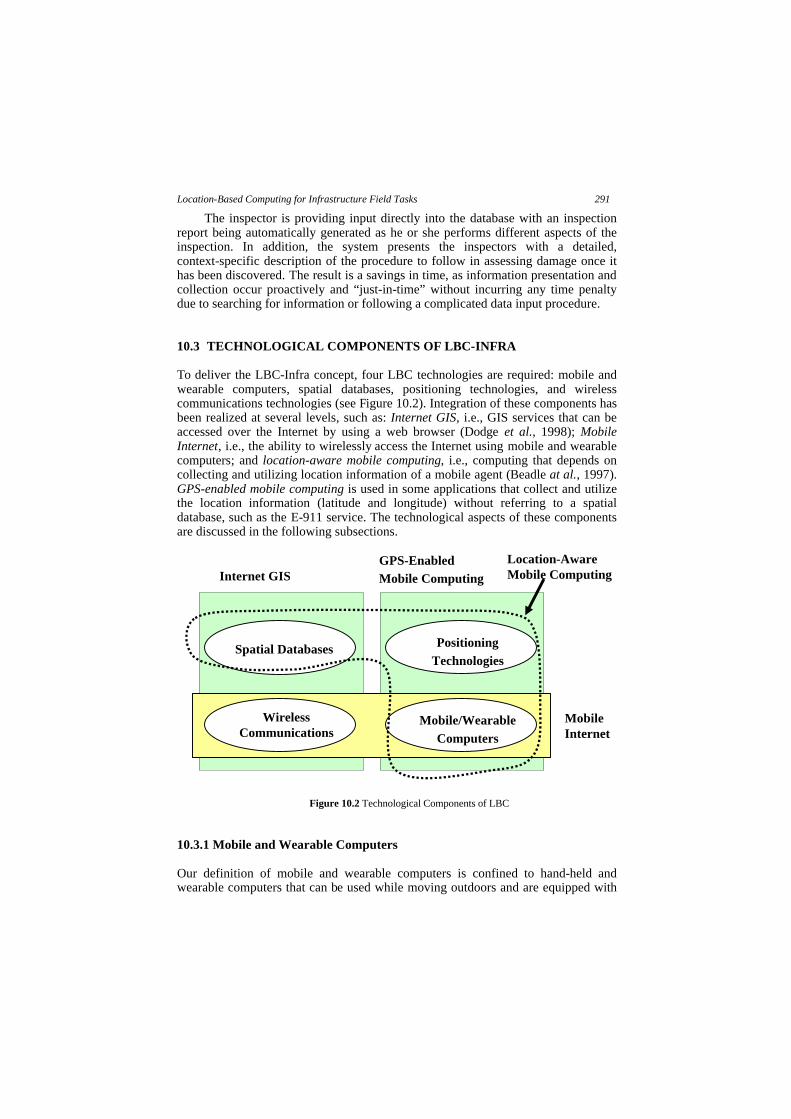
report being automatically generated as he or she performs different aspects of the inspection. In addition, the system presents the inspectors with a detailed, context-specific description of the procedure to follow in assessing damage once it has been discovered. The result is a savings in time, as information presentation and collection occur proactively and “just-in-time” without incurring any time penalty due to searching for information or following a complicated data input procedure. 10.3 TECHNOLOGICAL COMPONENTS OF LBC-INFRA To deliver the LBC-Infra concept, four LBC technologies are required: mobile and wearable computers, spatial databases, positioning technologies, and wireless communications technologies (see Figure 10.2). Integration of these components has been realized at several levels, such as: Internet GIS, i.e., GIS services that can be accessed over the Internet by using a web browser (Dodge et al., 1998); Mobile Internet, i.e., the ability to wirelessly access the Internet using mobile and wearable computers; and location-aware mobile computing, i.e., computing that depends on collecting and utilizing location information of a mobile agent (Beadle at al., 1997). GPS-enabled mobile computing is used in some applications that collect and utilize the location information (latitude and longitude) without referring to a spatial database, such as the E-911 service. The technological aspects of these components are discussed in the following subsections. 10.3.1 Mobile and Wearable Computers Our definition of mobile and wearable computers is confined to hand-held and wearable computers that can be used while moving outdoors and are equipped with
Location-Aware Mobile Computing
Spatial Databases
Wireless Communications
Mobile/Wearable Computers
Internet GIS
Mobile Internet
Positioning Technologies
GPS-Enabled Mobile Computing
Figure 10.2 Technological Components of LBC
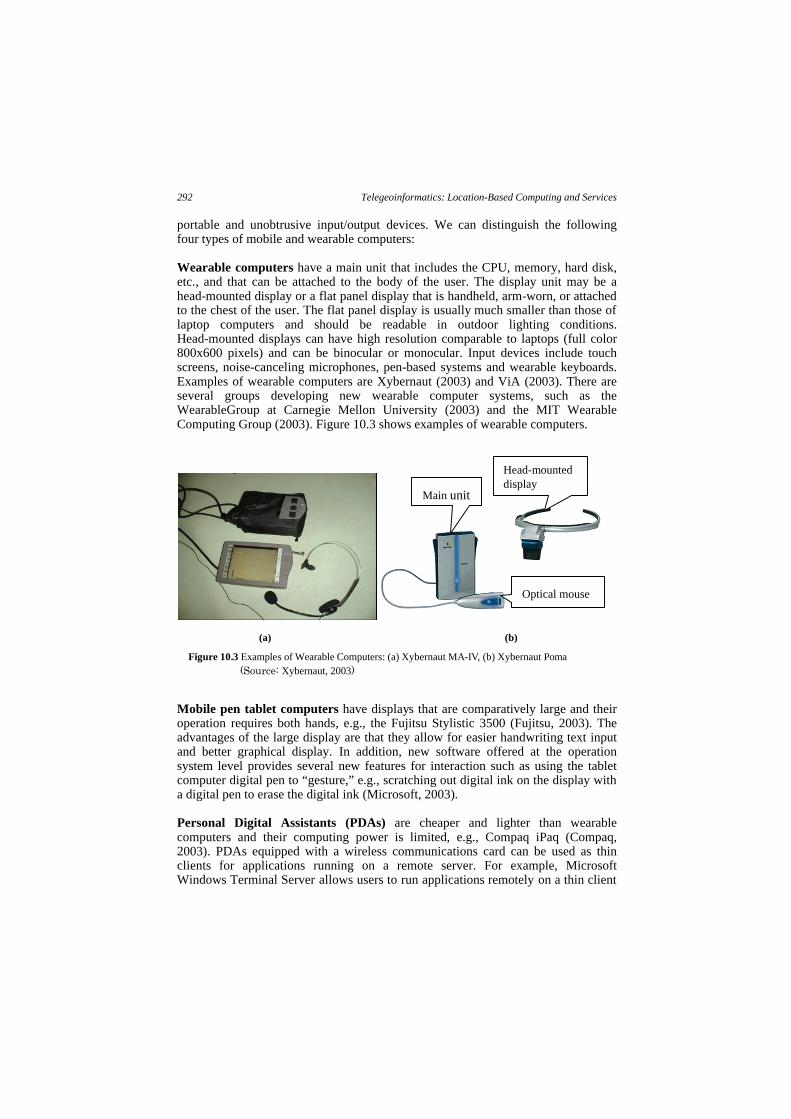
292 Telegeoinformatics: Location-Based Computing and Services portable and unobtrusive input/output devices. We can distinguish the following four types of mobile and wearable computers: Wearable computers have a main unit that includes the CPU, memory, hard disk, etc., and that can be attached to the body of the user. The display unit may be a head-mounted display or a flat panel display that is handheld, arm-worn, or attached to the chest of the user. The flat panel display is usually much smaller than those of laptop computers and should be readable in outdoor lighting conditions. Head-mounted displays can have high resolution comparable to laptops (full color 800x600 pixels) and can be binocular or monocular. Input devices include touch screens, noise-canceling microphones, pen-based systems and wearable keyboards. Examples of wearable computers are Xybernaut (2003) and ViA (2003). There are several groups developing new wearable computer systems, such as the WearableGroup at Carnegie Mellon University (2003) and the MIT Wearable Computing Group (2003). Figure 10.3 shows examples of wearable computers. Mobile pen tablet computers have displays that are comparatively large and their operation requires both hands, e.g., the Fujitsu Stylistic 3500 (Fujitsu, 2003). The advantages of the large display are that they allow for easier handwriting text input and better graphical display. In addition, new software offered at the operation system level provides several new features for interaction such as using the tablet computer digital pen to “gesture,” e.g., scratching out digital ink on the display with a digital pen to erase the digital ink (Microsoft, 2003). Personal Digital Assistants (PDAs) are cheaper and lighter than wearable computers and their computing power is limited, e.g., Compaq iPaq (Compaq, 2003). PDAs equipped with a wireless communications card can be used as thin clients for applications running on a remote server. For example, Microsoft Windows Terminal Server allows users to run applications remotely on a thin client
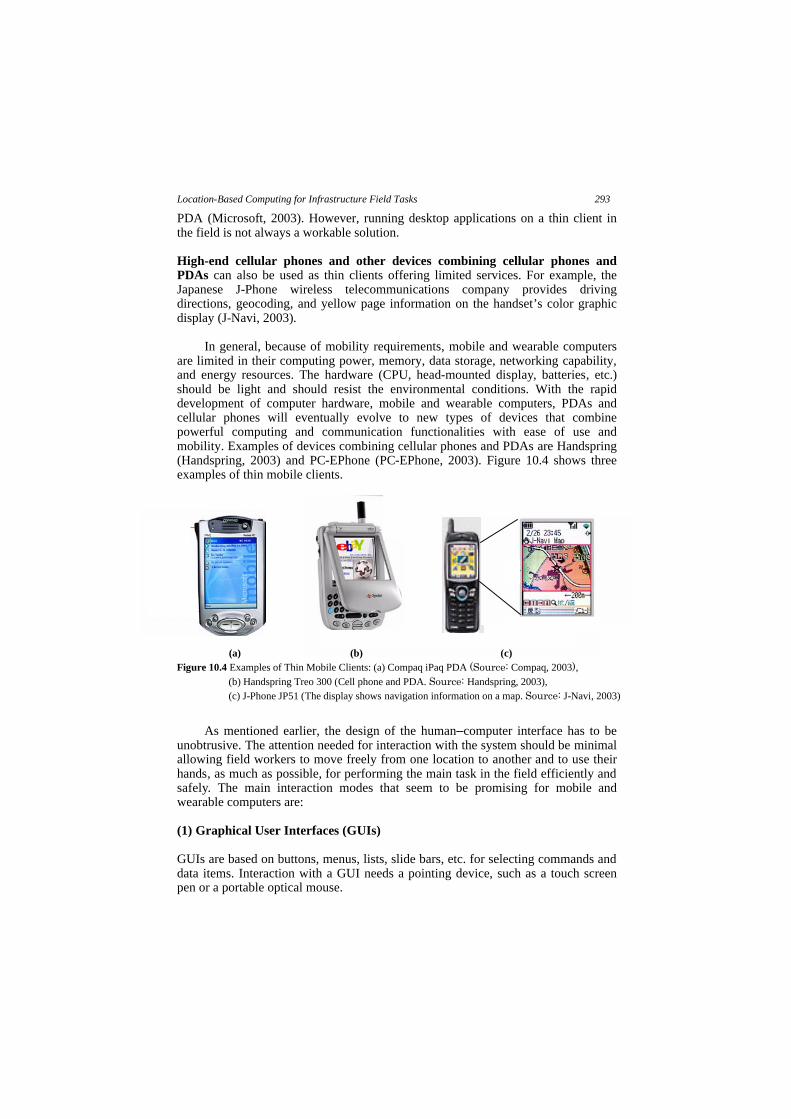
Location-Based Computing for Infrastructure Field Tasks 293 PDA (Microsoft, 2003). However, running desktop applications on a thin client in the field is not always a workable solution. High-end cellular phones and other devices combining cellular phones and PDAs can also be used as thin clients offering limited services. For example, the Japanese J-Phone wireless telecommunications company provides driving directions, geocoding, and yellow page information on the handset’s color graphic display (J-Navi, 2003).
In general, because of mobility requirements, mobile and wearable computers are limited in their computing power, memory, data storage, networking capability, and energy resources. The hardware (CPU, head-mounted display, batteries, etc.) should be light and should resist the environmental conditions. With the rapid development of computer hardware, mobile and wearable computers, PDAs and cellular phones will eventually evolve to new types of devices that combine powerful computing and communication functionalities with ease of use and mobility. Examples of devices combining cellular phones and PDAs are Handspring (Handspring, 2003) and PC-EPhone (PC-EPhone, 2003). Figure 10.4 shows three examples of thin mobile clients.
As mentioned earlier, the design of the human–computer interface has to be
unobtrusive. The attention needed for interaction with the system should be minimal allowing field workers to move freely from one location to another and to use their hands, as much as possible, for performing the main task in the field efficiently and safely. The main interaction modes that seem to be promising for mobile and wearable computers are: (1) Graphical User Interfaces (GUIs) GUIs are based on buttons, menus, lists, slide bars, etc. for selecting commands and data items. Interaction with a GUI needs a pointing device, such as a touch screen pen or a portable optical mouse.
(a) (b) (c) Figure 10.4 Examples of Thin Mobile Clients: (a) Compaq iPaq PDA (Source: Compaq, 2003),
(b) Handspring Treo 300 (Cell phone and PDA. Source: Handspring, 2003), (c) J-Phone JP51 (The display shows navigation information on a map. Source: J-Navi, 2003)
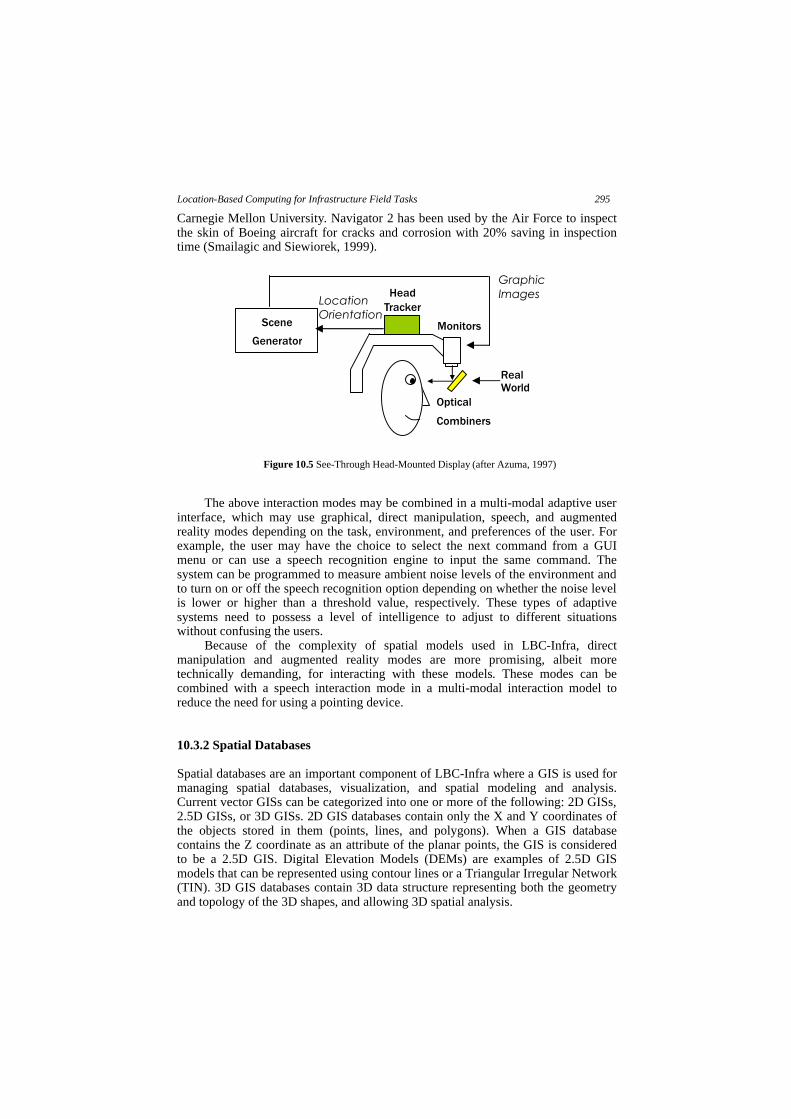
294 Telegeoinformatics: Location-Based Computing and Services (2) Direct manipulation mode Direct manipulation of spatial models allows in general for better interaction with these models. For example, selecting an element of a bridge by clicking on that element in a 3D graphical model of the bridge is easier than selecting the same element from a list of identifiers in a GUI since this minimizes the syntax-memorization load of the user with respect to the design and contents of the GUI (Shneiderman, 1998). This mode is similar to GUIs in that it requires a pointing device. (3) Speech-centered mode Speech recognition and synthesis allow for hands- and eyes-free operations. Speech recognition systems can be categorized according to the flow of speech (discrete commands or continuous dictation), speaker dependency (training the system is needed), and vocabulary size (Sunkpho et al., 2002). However, speech recognition may not be suitable in noisy environments, such as construction sites. (4) Augmented reality mode Augmented reality allows interaction with 3D virtual objects and other types of information superimposed over 3D real objects in real time (Azuma, 1997). The augmentation can be realized by looking at the real world through a see-through head-mounted display equipped with sensors that accurately track head movements (3 displacements and 3 rotations) to register the virtual objects with the real objects in real time as shown in Figure 10.5. In some commercial head-mounted displays, electronic compasses are used to measure the yaw angle, and tilt sensors are used to measure the roll and pitch angles. In this mode, field workers do not have to look back and forth at the structure and the computer screen to mentally achieve the spatial mapping of the information displayed on the screen. This helps them to better focus on their actual tasks and improves their efficiency and safety.
The main challenge for augmented reality is the requirement for very accurate 3D spatial databases and head tracking (further described in Sections 10.3.2 and 10.3.3, respectively). For example, if a bridge inspector is looking at a pier from a distance of 10 m, a 1 m position error will result in about 5 degrees error assuming that the inspector is still and not moving his or her head.
Augmented reality has many potential applications as a visualization aid in assembling, maintaining and repairing complex engineered systems. Examples of such augmented reality systems include a laser printer maintenance application (Feiner et al., 1993), X-ray vision that allows seeing the location of reinforcement within a reinforced concrete wall (Webster et al., 1996), and a construction support system for a space frame (Webster et al., 1996). Mobile augmented reality systems are emerging as powerful support tools for field tasks. The “Touring Machine” is an example of such systems that allows users to view information linked to specific buildings of a university campus while walking (Höllerer at al., 1999; also see Chapter 8). Thomas et al. (1998) have demonstrated the use of augmented reality to visualize architectural designs in an outdoor environment. Some practical systems in limited-range restricted environments exist today, such as Navigator 2 developed at
Location-Based Computing for Infrastructure Field Tasks 295 Carnegie Mellon University. Navigator 2 has been used by the Air Force to inspect the skin of Boeing aircraft for cracks and corrosion with 20% saving in inspection time (Smailagic and Siewiorek, 1999).
The above interaction modes may be combined in a multi-modal adaptive user interface, which may use graphical, direct manipulation, speech, and augmented reality modes depending on the task, environment, and preferences of the user. For example, the user may have the choice to select the next command from a GUI menu or can use a speech recognition engine to input the same command. The system can be programmed to measure ambient noise levels of the environment and to turn on or off the speech recognition option depending on whether the noise level is lower or higher than a threshold value, respectively. These types of adaptive systems need to possess a level of intelligence to adjust to different situations without confusing the users.
Because of the complexity of spatial models used in LBC-Infra, direct manipulation and augmented reality modes are more promising, albeit more technically demanding, for interacting with these models. These modes can be combined with a speech interaction mode in a multi-modal interaction model to reduce the need for using a pointing device.
10.3.2 Spatial Databases Spatial databases are an important component of LBC-Infra where a GIS is used for managing spatial databases, visualization, and spatial modeling and analysis. Current vector GISs can be categorized into one or more of the following: 2D GISs, 2.5D GISs, or 3D GISs. 2D GIS databases contain only the X and Y coordinates of the objects stored in them (points, lines, and polygons). When a GIS database contains the Z coordinate as an attribute of the planar points, the GIS is considered to be a 2.5D GIS. Digital Elevation Models (DEMs) are examples of 2.5D GIS models that can be represented using contour lines or a Triangular Irregular Network (TIN). 3D GIS databases contain 3D data structure representing both the geometry and topology of the 3D shapes, and allowing 3D spatial analysis.
296 Telegeoinformatics: Location-Based Computing and Services
A spatial database must contain two types of information about the represented objects: geometric data and topological data. Geometric data contain information about the shape of the objects, whereas topological data include the mathematically explicit rules defining the connectivity between spatial objects (Laurini and Thompson, 1992). Through such topological models, GISs can answer spatial queries about infrastructure objects. Researchers from the GIS, computer graphics, and CAD communities have been investigating spatial data structures and models that can be used as the base of 3D GISs for the past several years. Molenaar (1990) and Pilouk et al. (1994, 1996) discussed data models supporting 3D topology, such as the 3D formal data structure and constructive solid geometry.
The 2D or 2.5D GISs are enough to fulfill the needs of many LBC applications, such as in the case of road pavement survey systems in which the road geometry can be draped over the DEM. However, in the general case of infrastructure field tasks, it is necessary to have the 3D spatial models of the infrastructure itself, i.e., the 3D models of bridges, tunnels, etc., at the same level of detail as when represented by 3D CAD software, such as AutoCAD. Research in the area of product and process data models resulted in a number of standards for representing buildings and other types of structures, such as the STandard for the Exchange of Product (STEP) data model (STEP, 2003) and the Industry Foundation Classes (IFC) (Froese, 1996). Although these data models support topology representation, they do not provide the means for actually performing spatial analysis based on topology. The recent trend has been to integrate GIS and CAD functions into one environment, e.g., Autodesk Map (2003). However, this integration is based on geometry for visualization purposes and does not support topology and 3D spatial analysis (Nguyen and Oloufa, 2002). Many of the examples given in Section 10.1 require 3D spatial analysis. In the example of finding the locations of cracks, LBC-Infra equipped with accurate positioning can retrieve these locations from a 3D database and give the inspector 3D navigation guidance based on his or her present position.
In order to realize the full potential of the LBC-Infra concept, a data structure and spatial analysis tools that integrate 3D GIS and CAD data need to be created and made able to answer geometric and topological queries. This integration will be of great benefit to all kinds of LBC applications related to infrastructure management, including construction, inspection, and monitoring. However, such 3D modeling and analysis require a large amount of storage and computing resources. 10.3.3 Positioning and Tracking Technologies LBC-Infra requires that the position and orientation of the field worker are continuously tracked. Positioning technologies can be grouped into four categories: (1) active source systems; (2) passive source systems; (3) dead reckoning systems; and (4) hybrid systems (Azuma, 1997). Chapter 3 has more information on positioning technologies.
Location-Based Computing for Infrastructure Field Tasks 297 (1) Active Source Systems Active source systems require powered signal emitters and sensors specially placed and calibrated. The signal can be magnetic, optical, radio, ultrasonic, or from the GPS satellites. These active source systems are based on the triangulation approach measuring signal arrival time (equivalent to the distances) between the mobile station and the multiple emitters. Traditionally, the need for special infrastructure and the short range of tracking make these systems more suitable indoors (except the GPS). Recently, some cell phone networks can be used as an active source positioning system that can provide cheap, low-accuracy positioning almost everywhere without the need for an additional infrastructure (Wirelessdevnet, 2003). In this case, the emitters are the cell phones and the infrastructure is the set of base stations in the network.
GPS is available anywhere within certain conditions, and it measures the horizontal and vertical positions of the receiver. Because of this availability and the relatively good accuracy and low cost of GPS, it is widely used for mobile mapping and other data collection tasks. Even with Selective Availability1 turned off in 2000, other factors still affect GPS accuracy. These factors include ionospheric and tropospheric distortion of the radio signals from the satellites, orbital alignment and clock errors of the satellites, and signal multipath errors (reflections and bouncing of the signal near buildings). In addition, GPS is easily blocked in urban areas, near hills, or under highway bridges. The accuracy of a position is also a function of the geometry of the GPS constellation visible at that moment in time, i.e., when the visible satellites are well separated in the sky, GPS receivers compute positions more accurately. One method to increase the accuracy of GPS is by using Differential GPS (DGPS). DGPS is based on correcting the effects of the pseudo-range errors caused by the ionosphere, troposphere, and satellite orbital and clock errors by placing a GPS receiver at a precisely known location (base station). The pseudo-range errors are considered common to all GPS receivers within some range. Multipath errors and receiver noise differ from one GPS receiver to another and cannot be removed using differential corrections. DGPS has a typical 3D accuracy of better than 3 m and an update rate of 0.1-1 Hz (Kaplan, 1996). The DGPS corrections can be sent to the mobile GPS receivers in real time, or added later by post-processing of the collected data. Real-time kinematic GPS (RTK-GPS) receivers with carrier-phase ambiguity resolution can achieve accuracies better than 10 cm, but are computationally very intensive to run in real time (Kaplan, 1996).
(2) Passive Source Systems These systems use naturally occurring signals. The main passive source systems are electronic compasses, sensing the earth magnetic field, and vision-based systems that depend on natural light. Electronic compasses are small, inexpensive, and accurate (accuracy of about 0.5 degrees). However, like magnetic sensors, they have the problem of magnetic distortion when in proximity to metals. Vision-based systems use video sensors to track specially placed marks called fiducials indoors, or natural features and landmarks outdoors. In augmented reality applications, these
1 The random errors deliberately added to keep GPS a more powerful tool for the U.S. military.
298 Telegeoinformatics: Location-Based Computing and Services systems allow for getting feedback from the scene and enforce better registration by matching reference features from the camera and graphics streams; this technique is called closed-loop tracking systems and can achieve tracking accuracy of few millimeters. However, this tracking requires that the tracked objects be always visible. In addition, achieving robust real-time video processing, especially for natural features tracking, is computationally intensive and requires special hardware that is not suitable for LBC-Infra. (3) Dead Reckoning Systems Dead reckoning systems do not depend on any external signal source. For example, an inertial system measures the linear accelerations and rotation rates resulting from gravity using linear accelerometers and rate gyroscopes, respectively. The measured signals from a gyroscope are integrated once and those from an accelerometer are integrated twice to produce orientation and position, respectively, causing linear and non-linear accumulation of drift errors with elapsed time. Although some rate gyroscopes may give sufficient accuracy of minutes or seconds for short time intervals, no accelerometers exist with enough accuracy (Azuma, 1997). (4) Hybrid Systems Hybrid systems use multiple measurements obtained from different sensors to compensate for the shortcomings of each technology when used alone. One promising hybrid system for LBC-Infra is to measure position by DGPS and inertial tracking, and orientation by a digital compass and tilt sensors. A Kalman filter can be used to integrate measurements from different positioning techniques and to provide the best tracking solution using the information obtained from the available sensors (You and Neumann, 2001). It also provides a positioning solution when measurements from one or more sensors become unavailable. In this case, each sensor in the hybrid system is considered as a backup for the others. For example, when the work to be done is under a canopy where GPS signals may be obstructed, the Kalman filter would use the information from the inertial tracking system to compute the position.
Table 10.1 shows a comparison of several positioning technologies and the associated accuracies.
Table 10.1 Positioning Technologies and Associated Accuracies
Technology Accuracy
(m) Type of Position Data
Comment
GPS 20 Absolute Stand-alone mode
Differential GPS 0.05-3 Absolute Real time or post-processing Laser rangefinders
0.05 Relative Operators must aim device at a substantial target
Inertial navigation
0.05 Relative Error accumulates with time
Location-Based Computing for Infrastructure Field Tasks 299 10.3.4 Wireless Communications Field workers using LBC-Infra need to communicate with other members of the team who may be at different locations in the field or at the office. They also need to download and upload data from remote servers. The processing power of their mobile and wearable computers may not be enough to support the intensive processing needed for LBC. Wireless communications technology is becoming more available to field workers, allowing the design of distributed collaborative mobile systems that can satisfy the above communication requirements (Liu et al., 2002; Peña-Mora and Dwivedi, 2002). There are several standard protocols to achieve distributed computing that allow invoking methods of an object residing on a remote computer, e.g., Common Object Request Broker Architecture (CORBA) and the Java Remote Method Invocation (RMI).
Two types of wireless networks are conceivable for LBC-Infra: Wireless Wide Area Networks (WWANs) and Wireless Local Area Networks (WLANs). WWANs are used for low rate data transmission over cellular digital packet radios based on costly infrastructures. Advanced Mobile Phone System (AMPS) and Global System for Mobile Communication (GSM) are examples of second generation (2G) WWANs with data transmission rates of 4.8 Kbps and 9.6-14.4 Kbps, respectively. The 2.5G systems, such as the General Packet Radio Service (GPRS), and future 3G systems, such as the Universal Mobile Telecommunications System (UMTS), will allow digital packet data transmission rates of up to 160 Kbps and 2Mbps, respectively. On the other hand, WLANs are flexible data communication systems using electromagnetic waves (mostly radio) over a small area, such as a university campus. In a typical WLAN configuration, a transmitter/receiver (transceiver) device, called an access point, connects to the wired network from a fixed location using a standard Ethernet cable. End users access the WLAN through WLAN adapters, which are implemented as PCMCIA cards or fully integrated devices within mobile and wearable computers.
When fixed access points are established, the WLAN is called an infrastructure WLAN. All network traffic from mobile stations goes through an access point to reach the destination on either the wired or wireless networks. Another type of WLAN, called an ad-hoc (peer to peer) WLAN, has no central controller or access point. Each device communicates directly with other devices in the network rather than through a central controller. Bluetooth (Bluetooth, 2003) is expected to become popular in ad-hoc short range WLANs (about 10 m), also called Wireless Personal Area Networks (WPANs). Ad-hoc WLANs are useful in places where small groups of computers might congregate without the need for accessing another network. For example, in the case of an earthquake emergency, where a team of engineers needs to exchange information quickly, ad-hoc WLANs are more easily deployable than infrastructure WLANs.
WLANs have four main characteristics, i.e., range, throughput, interoperability and interference, that should be considered in LBC-Infra. Range (radius of coverage) is the distance over which radio waves can communicate and is a function of the transmitted power and receiver design. Most WLANs use radio waves because they can penetrate walls and surfaces, but interactions with buildings and other objects can affect the range. The range for typical WLANs varies from under 30 m to more than 200 m. Throughput depends on the type of WLAN used, airwave congestion (number of users), interference and multipath, as well as the
300 Telegeoinformatics: Location-Based Computing and Services latency and bottlenecks in the wired portions of the WLAN. Recent WLANs have high data rates. For example, IEEE 802.11b and 802.11a standards have data rates of 11 and 54 Mbps, respectively. Interoperability with wired and wireless infrastructure can be achieved by complying with WLANs industry standards and specifications, such as those of IEEE. Interference of WLAN waves with others in the same frequency spectrum transmitted by other devices may happen because of the unlicensed nature of radio-based WLANs. Table 10.2 summarizes the main characteristics of the major wireless communications technologies. Chapter 4 has a detailed description of wireless communications technologies.
Table 10.2 Summary of Wireless Communications Technologies
10.4 GENERAL REQUIREMENTS OF LBC-INFRA LBC-Infra should satisfy a number of requirements in order to fulfill its functions. Some of these requirements are necessary at the component level of LBC-Infra, e.g., the requirements of WLAN, GPS, and mobile computing, while others are necessary at the system level, e.g., the requirements of an augmented reality system for bridge inspection. The following requirements can be considered as most essential for the successful deployment of LBC-Infra. (1) Availability: Positioning and wireless communications systems, such as GPS
and WLANs, may not be available in some situations. (2) Reliability: Even when position information is available, the accuracy of this
information and the data in the spatial database affect the reliability of LBC-Infra. The reliability is also affected by the quality of wireless communications.
(3) Data storage: The data volume of infrastructure-related 3D GIS/CAD
databases is typically very extensive. The storage capacity of most of today’s mobile and wearable computers is in most cases insufficient for storing these large databases required for field tasks.
(4) Real time processing: Spatial analysis using 3D GIS/CAD databases is
computationally intensive. In LBC-Infra, the real time requirement is measured by the end-to-end system delay, which is the total time for tracking, spatial
Technology Average Range (m)
Data Rate (Mbps)
Ultra-wideband 10 100 IEEE 802.11a 50 54
WLAN
IEEE 802.11b 100 11 PLAN Bluetooth 10 1
GPRS Wide region 0.16 WWAN UMTS Wide region 2
Location-Based Computing for Infrastructure Field Tasks 301 analysis, communications, scene generation and display. An end-to-end delay of 100 ms is typical in existing augmented reality systems, which results in angular error of 5 degrees considering a head rotation speed of 50 degrees per sec. However, the angular accuracy that the human eye can detect is less than one minute (Azuma, 1997). This registration error causes visual conflicts that may not be acceptable. As GPS positioning is updated every 0.1 to 1 sec., position extrapolation may be used to compensate for the low update rate.
(5) Wireless communications throughput and range: In order to have efficient
communications, the type of the deployed wireless technology should provide the necessary throughput and range for the specific system architecture as discussed in Section 10.5.
(6) Interoperability: LBC-Infra should be able to access heterogeneous data
formats from different remote servers, and process and display the results on heterogeneous platforms, e.g., PDAs, wearable computers, etc.
(7) Scalability: When covering a wide geographical area, the volume of the spatial
data of that area may become too large to be managed at a central server. In this case, the data should be distributed at several servers and dynamically partitioned based on the location of the field worker in order to answer a spatial query from the field. Also, the design of LBC-Infra should allow for increasing the number of field workers using the system without degrading the performance of the system.
(8) Usability: The usability of LBC-Infra is critical for its success and acceptance
by field workers because of the small displays, limited input/output devices, and weight, energy and safety requirements.
It should be noted that most of the above requirements have strong dependency
on the advancement in the technological components of LBC-Infra including spatial databases, mobile and wearable computers, tracking technologies, and wireless communications. Fortunately, these technologies have been progressing rapidly in the last few years, while becoming more available and less costly. In the following section, a framework for LBC-Infra is discussed that considers the above requirements and can accommodate the expected technological advancement in the near future. 10.5 INTERACTION PATTERNS AND FRAMEWORK OF LBC-INFRA Based on the discussion of the components and requirements of LBC-Infra presented in Sections 10.3 and 10.4, respectively, a framework is discussed in this section that identifies a collection of high-level reusable software objects and their relationships. The generic structure of this framework embodies the general functionalities of LBC-Infra so that it can be extended and customized to create more specific applications, e.g., a bridge inspection application or a building construction progress monitoring application.
302 Telegeoinformatics: Location-Based Computing and Services 10.5.1 Interaction Patterns of LBC-Infra The framework of LBC-Infra aims to facilitate data collection and access in the field by allowing field workers to interact with georeferenced infrastructure models to automatically retrieve the necessary information in real time based on their location and orientation, and the task context. The following interaction patterns are typical examples that have been identified based on common tasks that field workers usually perform and the type of information they collect (Bridge, 1995). (1) Presenting navigation information As an extension to conventional navigation systems based on 2D maps, LBC-Infra can also present navigation information in 3D. Within a specific field task, the system can guide a field worker by providing him/her with navigation information and focusing his or her attention on the next element to be inspected. Taking crack inspection as an example, the system displays arrows to navigate the inspector to the locations where cracks are most likely to be found or the locations found in previous inspections. The system intelligently asks the inspector for information about the data to be acquired based on similar previous cases in the database, thus reducing the data collection burden. (2) Displaying graphical details LBC-Infra displays to the field worker structural details retrieved from previous inspection reports. This can happen in a proactive way based on spatial events, such as the proximity of the inspector to specific elements. For example, once a cracked element is within an inspector field-of-view, the system displays the cracks on that element discovered during previous inspections. This will help focus the inspector’s attention on specific locations. The user of the system can control the level of detail of representing objects depending on his or her needs. (3) Displaying non-graphical information and instructions The user interface can provide links to documents related to the project, such as reports, regulations and specifications. In addition, LBC-Infra allows for displaying context sensitive instructions on the steps involved in a specific task, such as instructions about the method of checking new cracks, and measuring crack size and crack propagation. These instructions are based on manuals, such as the Bridge Inspector’s Training Manual (1995). (4) Communication LBC-Infra facilitates the wireless communications among a team of field workers, geographically separated at the project site, by establishing a common spatial reference about the site of the project. In some cases, the field workers may communicate with an expert engineer stationed at the office who monitors the same scene generated by the mobile unit in the field.
Location-Based Computing for Infrastructure Field Tasks 303 10.5.2 Interaction Framework Because the LBC-Infra concept integrates several evolving technologies, its implementation should follow an open and extensible framework so that the application development can adapt to new requirements and new technologies while reducing the time and cost of the development. A framework is an abstract design that describes the interaction between objects to provide a skeleton of applications in a particular domain (Johnson, 1997; Fayad et al., 1999). A framework also incorporates knowledge that is common to all applications in a specific domain.
The Model-View-Controller (MVC) software development model (Reenskaug, 1981; Potel, 1996) has been selected as the basic framework of LBC-Infra because of its simplicity and flexibility in manipulating complex and dynamic data structures requiring diverse representations. The MVC model has three main high-level objects: Model, View, and Controller. The Model represents the data underlying the application that are accessible only through the View object. The Model of LBC-Infra has three basic databases for managing the spatial data (e.g., the axial end coordinates of the members of a steel bridge), data about the attributes of the infrastructure (e.g., inspection data), and data about field tasks (e.g., information about inspection tasks, their order, and devices and methods used for performing them). The View object accesses the data from the Model database and specifies how these data are presented to the user, e.g., the information about the members of a bridge can be used to create 2D or 3D representations of the bridge. The Controller determines how user interactions with the View, in the form of events, cause the data in the Model to change, e.g., clicking on a “no defect” button causes the value of the “inspection” attribute of the selected member to be set to “no defect” in the attribute database. The Model closes the loop by notifying the View to update itself so that it reflects the changes that occurred in the data. Using the MVC model, new methods of interaction can easily be introduced to the system by developing new View objects.
Using the MVC model in distributed client-server applications involves deciding which parts of the model are implemented, in whole or in part, on the client or the server (Potel, 1996). The Model represents a typical server-side functionality while the View represents a typical client-side functionality. The Controller can be partitioned between the client and the server; most of the processing could be on the client side in a fat client or on the server side with only a simple GUI application on a thin client. In more elaborate architectures, other partitioning of the functionalities between the client and the server are possible, e.g., the client may have a proxy of the Model to lower the demand for communication with the server. In addition to the Model, View and Controller, LBC-Infra has a Tracker object that handles location-related functionalities as explained in the following paragraph. Figure 10.6 shows the relationship between the high-level objects of LBC-Infra using a Unified Modeling Language (UML) collaboration diagram, where objects interact with each other by sending messages (UML, 2003). The numbers in the diagram refer to the order of execution of the messages. Messages that are not numbered are threads that are executed at the beginning of the application and run continuously and concurrently with other messages, or they are event-driven messages that may occur at any time.
304 Telegeoinformatics: Location-Based Computing and Services
A Field Worker starts interacting with the system by sending a message (start application) to the Controller (message 1). As part of the initialization of the system, the View accesses the databases of the Model that reside on a remote server to retrieve the information necessary to create its contents (message 2) before it updates itself (message 3). Once the application is initialized, the Tracker starts continuously reading the location and orientation measurements of the Field Worker from the tracking devices and updating the Controller about the current coordinates of the Field Worker. The Controller retrieves the information about the next task to be performed from the Task Database that contains a plan defining the tasks (message 4). However, the Field Worker has the freedom to confirm this selection or override it by selecting another task if necessary (message 5). Based on the changing coordinates of the Field Worker, the Controller updates the viewpoint of the View, filters the contents of the selection menus, and updates the navigation information towards the best location and orientation to perform the present task. These updating and filtering steps insure that the presented information coincides with what the Field Worker can see in the real scene. The navigation is performed by presenting visual or audible guidance. As the Field Worker follows the navigation guidance towards the new location, the Controller provides him or her with information about the task (message 6). Another function of the Controller is to capture spatial events, such as the proximity to an element of interest. This flexibility allows switching the order of the tasks when adequate to inspect an element planned for inspection in a subsequent task. As in message 5 above, the Field Worker can accept or reject this change in the task order.
Once the Field Worker is at the right position and orientation to perform the task at hand, the Controller presents him or her with previously collected information (if available) that may help in performing the present task (message 7). At this point, the Field Worker performs the task, e.g., collecting inspection data visually of using some devices (message 8). He or she can input the collected data by interacting with the View, e.g., by clicking on an element displayed within the View for which data have to be updated. The input events are captured by the View (message 9), and used by the Controller to update the data in the Model (message 10). Finally, the changes in the databases are channeled to the View by distributed notification (message 11) so that the View can update itself (message 12). Client-server communications can happen whenever needed depending on the nature of the client (thin or fat). 10.5.3 Interaction Levels of LBC-Infra Section 10.3 covered the whole spectrum of available technologies for implementing LBC-Infra. The framework of LBC-Infra presented in Section 10.5.2 provides the base for developing an open system architecture that is flexible enough to accommodate any combination of present and near-future technologies. However, the specific functional requirements of each version of LBC-Infra will largely vary depending on the specific technologies used in the implementation. For example, the following levels of interaction functionalities are identified based on the dimensionality of the spatial model (i.e., 2D, 2.5D or 3D), the tracking technologies
Location-Based Computing for Infrastructure Field Tasks 305 that match this dimensionality, and the volume of information involved in the spatial model that need to be sent over the wireless network. (1) Level-1: Location-Aware Direct Manipulation of 2D GIS This level uses a 3G cellular phone or a PDA equipped with a WLAN card as the mobile platform, and 2D maps of the infrastructure system. For example, in the case of a bridge inspection system, the piers and the decks of the bridges can be represented by a point layer and a polygon layer, respectively. Positioning can be achieved using GPS, DGPS or other methods depending on the needed accuracy. Because of the limited hardware and software capabilities, this level provides only simple navigation and data input/output functionalities using direct manipulation on the display of the cellular phone or the PDA.
Figure 10.6 Collaboration Diagram Between the Entities of the Framework
306 Telegeoinformatics: Location-Based Computing and Services (2) Level-2: Location-Aware Direct Manipulation of 3D GIS/CAD This level uses a PDA or a wearable computer with a WLAN card. The spatial model can be provided using 2D GIS as in level-1, or by integrating 3D GIS (a DEM with draped maps of rivers, roads, etc) with 3D CAD models of infrastructure systems, e.g., 3D models of bridges. This level of functionality requires 3D accurate positioning and direction tracking that may be provided using DGPS and a digital compass, respectively. This level provides all the functionalities of the LBC-Infra framework. (3) Level-3: Augmented Reality Interaction This level uses a wearable computer with a head-mounted display and a WLAN card. The spatial model integrates 3D GIS with 3D CAD models of infrastructure systems. It requires very accurate head tracking (six degrees of freedom) to provide all the functionalities of the LBC-Infra framework through an augmented reality interaction mode as discussed in Subsection 10.3.1. As an example of the interaction patterns in this level, when a bridge inspector keeps the orientation of his or her head in the same direction for more than 3 seconds, the system starts retrieving and displaying information about the bridge elements that are within the field-of-view of the inspector based on the present task, e.g., checking of the existence of cracks.
Table 10.3 summarizes the combinations of the spatial databases and positioning technologies for the three levels. It should be noted that, although the primary interaction modes used in the above three levels necessitate a display, a secondary speech interaction mode can be also used in a multi-modal fashion. In order to address the storage and real-time processing requirements in level-2 and level-3, it is necessary to have a client-server wireless distributed system, where the field computer is the client and the server is located remotely in an office. The design of the system should consider both the computing power of the client computer and the data transfer rate over the wireless connection. 10.6 PROTOTYPE SYSTEM AND CASE STUDY In order to demonstrate the potential of LBC-Infra in infrastructure projects, a prototype system of LBC-Infra following the framework discussed in Subsection 10.5.2 was developed and tested in a case study. The prototype system, whose architecture is based on level-2 functionalities, allows for location-aware direct manipulation of 3D GIS/CAD. In the case study, one of the authors simulating the action of a bridge inspector, walked around and above bridges and inspect their different elements visually or using some instruments. The Birmingham Bridge, erected in 1976 over the Monongahela River, is used in the case study (see Figure 10.7). The 185 m (607 ft) main span of this bridge is a steel arch bridge with wire rope suspenders.
Location-Based Computing for Infrastructure Field Tasks 307
Table 10.3 System Architectures for Combinations of Spatial Databases and Positioning Technologies
Type of spatial database
Type of tracking
2D GIS (Maps of roads, etc.)
3D GIS/CAD (Maps + DEM + 3D CAD models of infrastructure)
GPS/DGPS (2D positioning)
Level 1: Location-Aware Direct Manipulation of 2D GIS Uses 3G cellular phones or PDA with WLAN (IEEE 802.11b)
Not applicable
DGPS + digital compass (3D positioning and orientation)
Level 2: Location Aware Direct Manipulation of 3D GIS/CAD Uses PDA or wearable computer with WLAN (IEEE 802.11b)
Accurate head tracking (Six degrees of freedom)
Not applicable
Level 3: Augmented Reality Interaction Uses wearable computer with head-mounted display and WLAN (IEEE 802.11a)
10.6.1 Software of the Prototype The prototype system has the three databases of the Model object as discussed in Subsection 10.5.2, i.e., spatial database, attribute database including inspection data, and inspection tasks database. The databases were implemented in ORACLE 9i as relational databases. The spatial database includes the map of the rivers and major roads of the area around the bridge in addition to the 3D data of the members of the bridge. A detailed 3D model of the Birmingham Bridge was created and
Figure 10.7 Birmingham Bridge
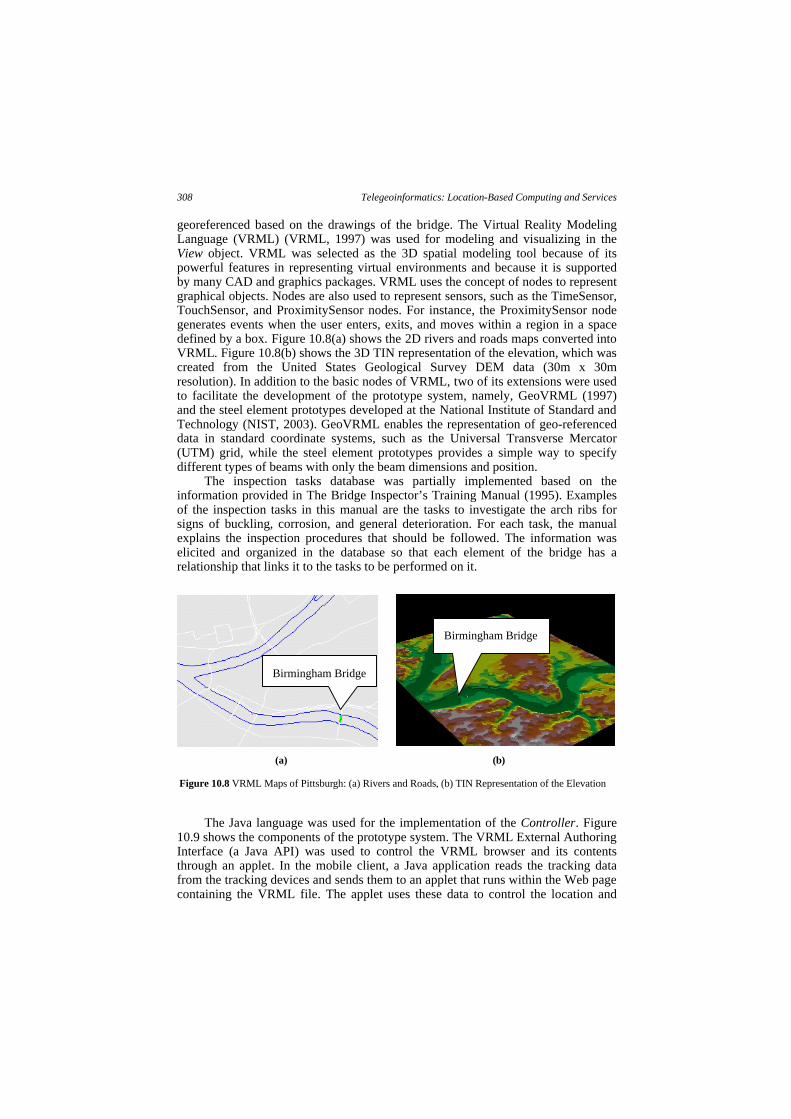
308 Telegeoinformatics: Location-Based Computing and Services georeferenced based on the drawings of the bridge. The Virtual Reality Modeling Language (VRML) (VRML, 1997) was used for modeling and visualizing in the View object. VRML was selected as the 3D spatial modeling tool because of its powerful features in representing virtual environments and because it is supported by many CAD and graphics packages. VRML uses the concept of nodes to represent graphical objects. Nodes are also used to represent sensors, such as the TimeSensor, TouchSensor, and ProximitySensor nodes. For instance, the ProximitySensor node generates events when the user enters, exits, and moves within a region in a space defined by a box. Figure 10.8(a) shows the 2D rivers and roads maps converted into VRML. Figure 10.8(b) shows the 3D TIN representation of the elevation, which was created from the United States Geological Survey DEM data (30m x 30m resolution). In addition to the basic nodes of VRML, two of its extensions were used to facilitate the development of the prototype system, namely, GeoVRML (1997) and the steel element prototypes developed at the National Institute of Standard and Technology (NIST, 2003). GeoVRML enables the representation of geo-referenced data in standard coordinate systems, such as the Universal Transverse Mercator (UTM) grid, while the steel element prototypes provides a simple way to specify different types of beams with only the beam dimensions and position.
The inspection tasks database was partially implemented based on the information provided in The Bridge Inspector’s Training Manual (1995). Examples of the inspection tasks in this manual are the tasks to investigate the arch ribs for signs of buckling, corrosion, and general deterioration. For each task, the manual explains the inspection procedures that should be followed. The information was elicited and organized in the database so that each element of the bridge has a relationship that links it to the tasks to be performed on it.
The Java language was used for the implementation of the Controller. Figure
10.9 shows the components of the prototype system. The VRML External Authoring Interface (a Java API) was used to control the VRML browser and its contents through an applet. In the mobile client, a Java application reads the tracking data from the tracking devices and sends them to an applet that runs within the Web page containing the VRML file. The applet uses these data to control the location and
(a) (b)
Figure 10.8 VRML Maps of Pittsburgh: (a) Rivers and Roads, (b) TIN Representation of the Elevation
Birmingham Bridge
Birmingham Bridge
Location-Based Computing for Infrastructure Field Tasks 309 orientation of the viewpoint so that the displayed scene matches the real scene in front of the user. The applet is also responsible for handling the user-interface for adding or removing objects (e.g., navigation objects) and interacting with menus that control the task flow (e.g., changing attributes). Another function of the Java application is to facilitate the communication between the mobile client and a remote server hosting the databases.
10.6.2 Hardware of the Prototype The prototype system was developed and tested using a Sony notebook computer (Vaio, PCG-Z505CR/K) with Pentium III processor (750 MHz). The system was also partially tested using two wearable computers, a Xybernaut MA-IV with Intel Pentium III CPU (233 MHz), 128 MB RAM, and flat-panel all-light-readable display, and a Xybernaut Poma with Hitachi SuperH RISC CPU (128 MHz), 32 MB RAM, and Liquid Crystal on Silicon head-mounted display (see Figure 10.3).
A Trimble GeoExplorer 3 GPS receiver equipped with a magneto-resistive digital compass was used with a beacon for real-time DGPS correction. Although the software design is based on a client-server architecture, where the client and server are linked via a WLAN, because of the difficulty of establishing an access point at this stage of testing, both the client and the server reside on the same mobile notebook. 10.6.3 Preliminary Evaluation of the Prototype System The purpose of the preliminary evaluation of the prototype system in this stage of the development is to demonstrate the feasibility of the proposed concept and framework of LBC-Infra, discussed in Section 10.5, by testing the basic functionalities of the prototype system. A more formal usability study of the system is planned in the near future after more detailed functionalities are implemented.
Java Application
Tracking Devices
Location, Orientation (UTM Coordinates)
Communications
Java Applet
VRML File
Web page
Update Viewpoint
Change Attributes
Mobile Client
Figure 10.9 Components of the Prototype System
Databases
Server
310 Telegeoinformatics: Location-Based Computing and Services
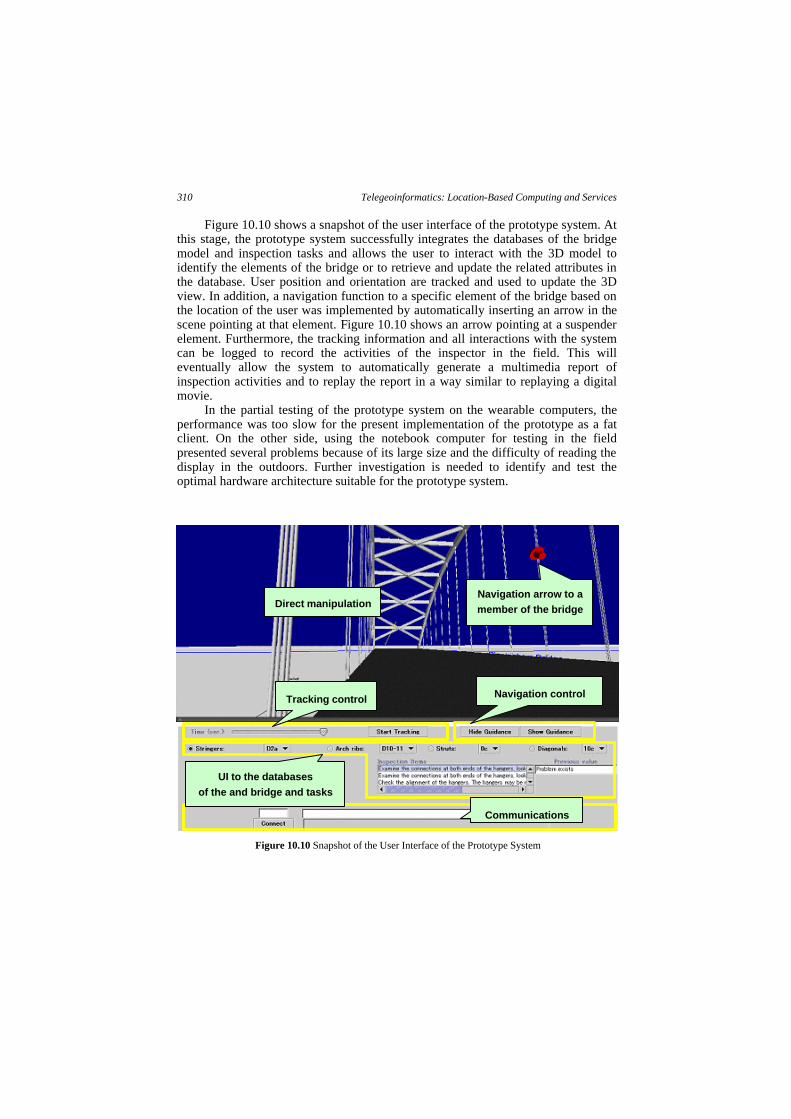
Figure 10.10 shows a snapshot of the user interface of the prototype system. At this stage, the prototype system successfully integrates the databases of the bridge model and inspection tasks and allows the user to interact with the 3D model to identify the elements of the bridge or to retrieve and update the related attributes in the database. User position and orientation are tracked and used to update the 3D view. In addition, a navigation function to a specific element of the bridge based on the location of the user was implemented by automatically inserting an arrow in the scene pointing at that element. Figure 10.10 shows an arrow pointing at a suspender element. Furthermore, the tracking information and all interactions with the system can be logged to record the activities of the inspector in the field. This will eventually allow the system to automatically generate a multimedia report of inspection activities and to replay the report in a way similar to replaying a digital movie.
In the partial testing of the prototype system on the wearable computers, the performance was too slow for the present implementation of the prototype as a fat client. On the other side, using the notebook computer for testing in the field presented several problems because of its large size and the difficulty of reading the display in the outdoors. Further investigation is needed to identify and test the optimal hardware architecture suitable for the prototype system.
Figure 10.10 Snapshot of the User Interface of the Prototype System
Tracking control Navigation control
Communications
Direct manipulation
UI to the databases of the and bridge and tasks
Navigation arrow to a member of the bridge
Location-Based Computing for Infrastructure Field Tasks 311 10.7 CONCLUSIONS In this chapter, we discussed the technologies, requirements, and the framework for Location-Based Computing for Infrastructure field tasks (LBC-Infra). LBC-Infra facilitates collecting inspection data by allowing field workers to interact with georeferenced infrastructure models and automatically retrieve the necessary information in real time based on their location and orientation, and the task context. The framework of LBC-Infra integrates mobile and wearable computers, 3D GIS/CAD databases, positioning technologies and wireless communications to provide field workers with the specific information they need in a proactive manner. We investigated the promising system architectures that can be realized by integrating the wide spectrum of available technologies, and how these architectures can best support field tasks. We also demonstrated the potential and limitations of the framework and one system architecture through partially developing a prototype system and testing it in a case study. The prototype, using location-aware direct manipulation of 3D GIS/CAD, demonstrated the basic functionalities of LBC-Infra, such as tracking, navigation, and interacting with the 3D model to identify elements of the bridge or to retrieve and update the related attributes in the database. This is expected to improve the efficiency and safety of the field workers by allowing them to concentrate on their job. Future work will focus on further development and testing of the prototype system, considering both hardware and software issues, and on investigating the usage of LBC-Infra as a base for collaborative environment for field workers. REFERENCES ASCE, 2001, Report Card for America’s Infrastructure,
http://www.asce.org/reportcard/ (accessed March, 2003). Autodesk web site, <http://usa.autodesk.com/> (accessed March, 2003). Azuma, R.T., 1997, A Survey of Augmented Reality, Presence: Teleoperators and
Virtual Reality, 6(4), pp. 355-386. Beadle, H.W.P., Harper, B., Maguire, G.Q., Judge, J., 1997, Location Aware Mobile
Computing, Proc. IEEE/IEE International Conference on Telecommunications, (ICTí97), Melbourne, April, pp. 1319-1324.
Bluetooth web site, <http://www.bluetooth.com> (accessed March, 2003). Bridge Inspector’s Training Manual, 1995, U.S. Department of Transportation,
Federal Highway Administration. Bürgy, C. and Garrett, Jr., J., 2002, Wearable Computers: An Interface between
Humans and Smart Infrastructure Systems. Bauen mit Computern, Bonn, Germany. VDI Verlag GmbH, Duesseldorf, Germany.
Compaq web site: <http://athome.compaq.com> (accessed March, 2003). de la Garza, J.M. and Howitt, I., 1998, Wireless Communication and Computing at
the Construction Jobsite, Automation in Construction, Vol. 7, pp 327-347. Dodge, M., Doyle, S., Smith, A., and Fleetwood, S., 1998, Towards the Virtual City:
VR & Internet GIS for Urban Planning, paper presented at the Virtual Reality and Geographical Information Systems Workshop, Birkbeck College, London. Also available at the Centre for Advanced Spatial Analysis (CASA), University
312 Telegeoinformatics: Location-Based Computing and Services
College London <http://www.casa.ucl.ac.uk/newvenue/towards_virtual_city.pdf> (accessed March, 2003).
Fayad, M.E., Schmidt, D.C. and R. E. Johnson. 1999, Application Frameworks. In Building Application Framework, New York: John Wiley and Sons, pp. 3-27.
FCC web site: < http://www.fcc.gov/911/enhanced/> (accessed March, 2003). Feiner, S., MacIntyre, B. and Sleegmann, D., 1993, Knowledge-Based Augmented
Reality. Communications of ACM, 36:7, pp. 55-62. Frangopol, D.M., Kong, J.S., Gharaibeh, E.S., 2001, Reliability-based Life-Cycle
Management of Highway Bridges, Journal of Computing in Civil Engineering, 15(1), pp. 27-47.
Froese, T., 1996, STEP Data Standards And The Construction Industry, CSCE Annual Conference, Vol. 1, Edmonton, pp. 404-415.
Fujitsu web site: <http://www.fujitsupc.com> (accessed March, 2003). Garrett, J.H. Jr., Sieworiek, D.P. and Smailagic, A., 1998, Wearable Computers for
Bridge Inspection, Proceedings of the International Symposium on Wearable Computers (ISWC), Pittsburgh, PA,USA, October, 1998, pp.160-161.
Garrett, J.H. Jr., Sunkpho, J., 2000, Issues in Delivering IT Systems for Field Users, International Conference on the Application of Computer Science and Mathematics in Architecture and Civil Engineering (IKM2000). Weimar, Germany.
Garrett, J.H. Jr., Bürgy, C., Reinhardt, J. and Sunkpho, J., 2002, An Overview of the Research in Mobile/Wearable Computer-Aided Engineering Systems in the Advanced Infrastructure Systems Laboratory at Carnegie Mellon University. Bauen mit Computern, Bonn, Germany. VDI Verlag GmbH, Duesseldorf, Germany.
GeoVRML web site: <http://www.geovrml.org/> (accessed March, 2003). Handspring web site: <http://www.handspring.com> (accessed March, 2003). Höllerer, T., Feiner, S., Terauchi, T., Rashid, G. and Hallaway, D., 1999, Exploring
MARS: Developing Indoor and Outdoor User Interfaces to a Mobile Augmented Reality System, Computers and Graphics, Elsevier Publishers, 23(6), pp. 779-785.
J-Navi web site: < http://www.j-phone.com/english/products/kisyu/j_p51/index.html > (accessed March, 2003).
Johnson, R.E., 1997, Frameworks = (Components + Patterns). Communications of the ACM 40 (October), pp. 39-42.
Kaplan, E.D., 1996, Understanding GPS: Principles and Applications, Artech House.
Kuo, S. S., Clark, D. A. and Kerr, R., 1994, Complete Package for Computer-Automation Bridge Inspection Process. Transportation Research Record, No. 1442, pp. 115-127.
Laurini, R. and Thompson, A.D., 1992, Fundamentals of Spatial Information Systems. A.P.I.C. Series, Academic Press, New York, NY.
Leung, A., 1996, Perfecting Bridge Inspecting. Civil Engineering Magazine, pp. 59-61.
Liu, D., Cheng, J., Law, K.H. and Wiederhold, G., 2002, An Engineering Information Service Infrastructure for Ubiquitous Computing, CIFE Technical Report #141, Stanford University.
Location-Based Computing for Infrastructure Field Tasks 313 Lynch, J.P., Kiremidjian, A.S., Law, K.H., Kenny, T.W. and Carryer, E., 2002,
Issues in Wireless Structural Damage Monitoring Technologies, Proceedings of the 3rd World Conference on Structural Control (3WCSC), Como, Italy, April 7-12.
Microsoft Windows XP Tablet PC Edition web site: <http://www.microsoft.com/windowsxp/tabletpc/> (accessed March, 2003). MIT Wearable Computing Group web site: <http://www.media.mit.edu/wearables>
(accessed March, 2003). Molenaar, M., 1990, A formal data structure for 3D vector maps, Proceedings of
EGIS’90, Vol. 2, Amsterdam, The Netherlands, pp. 770-781. Nguyen, T.H. and Oloufa, A.A., 2002, Automation of Building Design with Spatial
Information, the 19th International Symposium on Automation and Robotics in Construction, NIST, Washington, D.C., pp. 179-184.
NIST web site: <http://cic.nist.gov/vrml/cis2.html> (accessed March, 2003). PC-Ephone web site: <http://www.pc-ephone.com> (accessed March, 2003). Peña-Mora, F. and Dwivedi, G.H., 2002, Multiple Device Collaborative and Real
time Analysis System for Project Management in Civil Engineering, ASCE Journal of Computing in Civil Engineering, 16(1), pp.23-38.
Pilouk, M., 1996, Integrated modelling for 3D GIS, PhD thesis, ITC, The Netherlands.
Pilouk, M. and Tempfli, K., 1994, An object-oriented approach to the Unified Data Structure of DTM and GIS, Proceedings of ISPRS, Commission IV, Vol. 30, Part 4, Athens, USA.
Potel, M., 1996, MVP: Model-View-Presenter, The Taligent Programming Model for C++ and Java,
<ftp://www6.software.ibm.com/software/developer/library/mvp.pdf> Reenskaug, T., 1981, Smalltalk Issue Of Byte, 6(8), August. Shneiderman, B., 1998, Designing the User Interface, Addison Wesley Longman,
Inc., Reading, Massachusetts. Smailagic, A., Siewiorek, D., 1999, System Level Design as Applied to CMU
Wearable Computers, Journal of VLSI Signal Processing Systems, Kluwer Academic Publishers, 21(3).
STEP web site: <http://cic.vtt.fi/links/step.html> (accessed March, 2003). Sunkpho, J., Garrett, J., and McNeil, S., 2002, A Framework for Field Inspection
Support Systems Applied to Bridge Inspection, Proceedings of the 7th International Conference on the Applications of Advanced Technologies in Transportation, Cambridge MA, August 5-7, pp. 417-424.
Terminal Server web site: <http://www.microsoft.com/ntserver/ProductInfo/terminal/thinclient.asp> (accessed
March, 2003). Thomas, B., Piekarski, W. and Gunther, B., 1998, Using Augmented Reality to
Visualize Architectural Designs in an Outdoor Environment, DCNet'98 Online Conference, <http://www.arch.usyd.edu.au/kcdc/journal/vol2/dcnet/sub8> (accessed March, 2003).
Trilon, Inc. web site: <http://www.trilon.com/> (accessed March, 2003). UML Resource Center web site: <http://www.rational.com/uml/> (accessed March,
2003). ViA web site: <http://www.via.com.tw> (accessed March, 2003).
314 Telegeoinformatics: Location-Based Computing and Services VRML Specifications, 1997, <http://www.vrml.org/Specifications/VRML97>
(accessed March, 2003). Wang, K.C.P. and Gong, W., 2002, Real time Automated Survey of Pavement
Surface Distress, Proceedings of the 7th International Conference on the Applications of Advanced Technology in Transportation Conference (AATT' 2002), Cambridge, pp. 456-472.
WearableGroup at Carnegie Mellon University web site: <http://www.ce.cmu.edu/~wearables> (accessed March, 2003).
Webster, A., Feiner, S., MacIntyre, B., Massie, W., and Krueger, T., 1996, Augmented reality in architectural construction, inspection and renovation, Proc. of ASCE Third Congress on Computing in Civil Engineering, Anaheim, CA, pp. 913-919.
Wirelessdevnet web site: <http://www.wirelessdevnet.com/channels/lbs/features/mobilepositioning.html>
(accessed March, 2003). Xybernaut web site: <http://www.xybernaut.com> (accessed March, 2003). You, S. and Neumann, U., 2001, Fusion of Vision and GyroTracking for Robust