124
#LOVEBOQ ANNUAL REPORT 2014

#LOVEBOQ
ANNUAL REPORT2 014

CONTENTSDIRECTORS’ REPORT 2
DIRECTORS’ DETAILS 2
OPERATING AND FINANCIAL REVIEW 5
REMUNERATION REPORT 12
INTRODUCTORY MESSAGE 12
REMUNERATION REPORT 12
LEAD AUDITOR’S INDEPENDENCE DECLARATION 36
CORPORATE GOVERNANCE 37
FINANCIAL REPORT 47
INCOME STATEMENTS 47
STATEMENTS OF COMPREHENSIVE INCOME 48
BALANCE SHEETS 49
STATEMENTS OF CHANGES IN EQUITY 50
STATEMENTS OF CASH FLOWS 54
NOTES TO THE FINANCIAL STATEMENTS 55
OTHER INFORMATION 113
DIRECTORS’ DECLARATION 113
INDEPENDENT AUDITOR’S REPORT TO THE MEMBERS 114
SHAREHOLDING DETAILS 116
SHAREHOLDER INFORMATION 119
PERFORMANCE SNAPSHOT

Bank of Queensland Limited and its Controlled Entities A.B.N. 32 009 656 740. 1
PERFORMANCE SNAPSHOT
66to
DIVIDEND PER SHAREfull year ordinary
up
c
89.5cto
EARNINGS PER SHAREcash basic
up
$301.2m
up
to
CASH EARNINGSafter tax
$260.5mto
STATUTORY NET PROFITafter tax
up

ANNUAL REPORT 20142
DIRECTORS’ REPORT Year Ended 31 August 2014
The Directors’ present their report together with the financial report of Bank of Queensland Limited (“the Bank”) and of the Consolidated Entity, being the Bank and its controlled entities for the year ended 31 August 2014 and the independent auditor’s report thereon.
DIRECTORS’ DETAILSThe Directors of the Bank at any time during or since the end of the financial year are:
Name, qualifications and independence status Age Experience, special responsibilities and other Directorships
Roger Davis B.Econ. (Hons), Master of Philosophy
Chairman Non-Executive Independent Director
62 Mr Davis was appointed Chairman on 28 May 2013 and has been a Director since August 2008. He has 32 years’ experience in banking and investment banking in Australia, the US and Japan. He is currently a consulting Director at Rothschild Australia Limited. He was previously a Managing Director at Citigroup where he worked for over 20 years and more recently was a Group Managing Director at ANZ Bank. He is a Director of AIG Australia Ltd, Argo Investments Limited, Ardent Leisure Management Ltd and Ardent Leisure Ltd and Aristocrat Leisure Ltd. He was formerly Chair of Charter Hall Office REIT and Esanda, and a Director of ANZ (New Zealand) Limited, CitiTrust in Japan and Citicorp Securities Inc. in the USA. He has a Bachelor of Economics (Hons) degree from the University of Sydney and a Master of Philosophy degree from Oxford. Mr Davis is Chair of the Nomination & Governance Committee, a member of the Audit and Risk Committees, and an attendee at all other Board Committees.
Stuart Grimshaw PMD, MBA, BCA
Managing Director and Chief Executive Officer Executive Non-Independent Director
(Resigned - 31 August 2014)
53 Mr Grimshaw joined BOQ in November 2011 as Managing Director and Chief Executive Officer. Prior to joining BOQ, Mr Grimshaw was a Non-Executive Director of Suncorp Group Ltd and Chief Executive Officer of Caledonia Investments Pty Ltd (an investment house). Before joining Caledonia, Mr Grimshaw spent seven years leading a variety of functions at Commonwealth Bank of Australia, including Chief Financial Officer and Group Executive, Wealth Management; and a decade at National Australia Bank Limited in a variety of roles, culminating in the position of Chief Executive Officer – Great Britain.
Steve Crane B Com, SF Fin, FAICD
Non-Executive Independent Director
62 Mr Crane was appointed a Director of the Bank at the Annual General Meeting on 11 December 2008. He has over 40 years’ experience in financial markets in Australia, including experience at both AMP and BZW Australia, where he was promoted to Managing Director – Financial Markets in 1995 and became Chief Executive in 1996. In 1998, when ABN AMRO Australia Pty Limited acquired BZW Australia and New Zealand, Mr Crane became Chief Executive and remained in this role until his retirement in June 2003. Mr Crane is Chairman of nib Holdings Limited and Global Valve Technology Limited, Director of Transfield Services, APA Pipeline Limited, Taronga Conservation Society Australia and a member of the CIMB Advisory Council. Mr Crane is Chair of the Risk Committee and a member of the Nomination & Governance Committee.
Carmel Gray B Bus
Non-Executive Independent Director
65 Ms Gray was appointed a Director of BOQ in April 2006. Ms Gray has had an extensive executive career in IT and Banking. She was Group Executive Information Technology at Suncorp from 1999 until 2004 and a member of Suncorp’s Group Executive committee during that period. Previously, she held a number of senior roles in the IT Services industry, including General Manager, Energy Information Solutions and Chief Executive, Logica Australia. She is Non-Executive Chair of Bridge Point Communications, and provides IT and business consultancy services to the SME sector. Ms Gray is a member of each of the Information Technology, Audit and Nomination & Governance Committees.
Michelle Tredenick B Sc, FAICD, F Fin
Non-Executive Independent Director
53 Ms Tredenick has served on the Board of BOQ since February 2011. Ms Tredenick has more than 30 years’ experience in the banking, insurance and wealth management industries across Australia and New Zealand. Ms Tredenick has held senior executive roles and been a member of the Executive Committee at National Australia Bank, MLC and Suncorp-Metway Limited, as well as serving as an Executive Director for NAB and MLC companies. During her career, she has held various roles as Chief Information Officer, Head of Strategy as well as line responsibility for corporate superannuation, insurance and wealth management businesses. In addition to her role at BOQ Ms Tredenick currently serves as a Non-Executive Director of Vocation Ltd and Canstar Pty Ltd. She is Chair of IAG and NRMA Superannuation Pty Ltd and is a member of the Senate of the University of Queensland and the Board of St James Ethics Centre. Ms Tredenick is Chair of the Information Technology Committee and a member of each of the Human Resources & Remuneration and Risk Committees.

Bank of Queensland Limited and its Controlled Entities A.B.N. 32 009 656 740. 3
(Continued) Year Ended 31 August 2014
DIRECTORS’ REPORT
Name, qualifications and independence status Age Experience, special responsibilities and other Directorships
Richard Haire B.Ec, FAICD
Non-Executive Independent Director
55 Mr Haire was appointed a Director of the Bank on 18 April 2012. Mr Haire has more than 28 years’ experience in the international cotton and agribusiness industry, including 26 years in agricultural commodity trading and banking. He is a Director of the Cotton Research and Development Corporation and formerly a Director of Open Country Dairy (NZ) and New Zealand Farming Systems Uruguay. Mr Haire is Chair of the Audit Committee and a member of the Risk and Information Technology Committees.
David Willis B Com, ACA, ICA
Non-Executive Independent Director
58 Mr Willis has over 33 years’ experience in financial services in the Asia Pacific, the UK and the US. He is a qualified Accountant in Australia and New Zealand and has had 17 years’ experience working with Australian and foreign banks. Mr Willis is a Director of New Zealand Post and Kiwi Bank, a Director of CBH (A Grain Cooperative in Western Australia) and Interflour Holdings, a Singapore based flour milling company. He is also a Director of Parcel Direct Group based in Sydney and a Director of Converga Pty Ltd. Mr Willis chairs a Sydney based Charity “The Horizons Program”. He was appointed a Director of the Bank in February 2010 and is Chair of the Human Resources & Remuneration Committee and is a member of the Risk Committee. He is a Non-Executive Director of the Bank’s insurance subsidiary, St Andrew’s.
Neil Berkett B Com and Admin
Non-Executive Independent Director
58 Mr Berkett was appointed a Director of the Bank on 30 July 2013. His career spans a range of sectors and geographies in both the consumer and enterprise space with an emphasis on managing significant change. For six years finishing in mid-2013 he was the Chief Executive Officer of Virgin Media, a NASDAC listed company where he oversaw the successful turnaround, differentiation and growth of the UK cable company. Mr Berkett then led the sale of the company to Liberty Global in June 2013. His previous career included senior roles at Lloyds TSB, Prudential, St George Bank in Australia, Citibank and Eastwest Airlines. He is the Non-Executive Chairman of the Guardian Media Group, is a Non-Executive Director with the Sage Group plc and a Trustee for the NSPCC. Mr Berkett is a member of each of the Human Resources & Remuneration and Information Technology Committees.
Bruce Carter B Econ, MBA, FAICD, FICA
Non-Executive Independent Director
(Appointed 27 February 2014)
56 Mr Carter was a founding Managing Partner of Ferrier Hodgson South Australia, a corporate advisory and restructuring business, and has worked across a number of industries and sectors in the public and private sectors. He has been involved with a number of state government-appointed restructures and reviews including chairing a task force to oversee the government’s involvement in major resource and mining infrastructure projects. Mr Carter had a central role in a number of key government economic papers including the Economic Statement on South Australian Prospects for Growth, the Sustainable Budget Commission, and the Prime Minister’s 2012 GST Distribution Review. Mr Carter has worked with all the major financial institutions in Australia. Before Ferrier Hodgson, Mr Carter was at Ernst & Young for 14 years including four years as Partner in Adelaide. During his time at Ernst & Young he worked across the London, Hong Kong, Toronto and New York offices. Mr Carter is the chair of Australian Submarine Corporation and Territory Insurance Office and a Non-Executive Director of SkyCity Entertainment Group Limited and Genesee & Wyoming Australia Pty Ltd. Mr Carter is a member of each of the Audit and Risk Committees.
Margaret Seale BA, FAICD
Non-Executive Independent Director
(Appointed 21 January 2014)
54 Margaret (Margie) Seale has more than 25 years’ experience in senior executive roles in Australia and overseas in the global publishing, health and consumer goods industries, and in the transition of traditional business models to adapt and thrive in a digital environment. Most recently she was Managing Director of Random House Australia (with managerial responsibility for Random House New Zealand) and President, Asia Development for Random House Inc., the global company. Amongst other roles prior to that she held national sales and national marketing roles for Oroton and Pan Macmillan respectively. She is a Non-Executive Director of Telstra and member of the Audit & Risk Committee. She has also served on the boards of the Australian Publishers’ Association and the Powerhouse Museum, and on the Council of Chief Executive Women, chairing its Scholarship Committee from 2011 to 2012. She remains a Non-Executive Director of Random House Australia and New Zealand. She is a member of the Information Technology and Human Resources & Remuneration Committees.
COMPANY SECRETARY Melissa Grundy, Company Secretary BCom, GradDipAppFin (Sec Inst), GradDipACG, CPA, F Fin, FGIA, ASAIM, GAICD
Ms Grundy was appointed Company Secretary on 4 June 2012. Prior to joining the Bank, she held various roles within the Compliance division of ASX Limited, with the most recent being State Manager (Qld) and Manager, Listings (Brisbane).

ANNUAL REPORT 20144
DIRECTORS’ REPORT(Continued) Year Ended 31 August 2014
DIRECTORS’ MEETINGSThe number of meetings of the Bank’s Directors (including meetings of Committees of Directors) and the number of meetings attended by each Director during the financial year were:
Board of Directors
Board of Directors - St Andrews
Risk Committee
Audit Committee
Nomination & Governance Committee
Human Resources & Remuneration
Committee - BOQ & St Andrews
Investment Committee (1)
Information Technology Committee
Due Diligence Committee
Audit & Risk Committee - St Andrews
A B A B A B A B A B A B A B A B A B A B
Stuart Grimshaw(2) 10 10 4 5 10 10 7 7 5 5 7 7 2 2 8 8 3 3 3 6
Steve Crane 10 10 - - 8 10 - - 5 5 3 3 2 2 - - 2 3 - -
Roger Davis(3) 10 10 - - 10 10 7 7 5 5 6 7 2 2 8 8 3 3 - -
Carmel Gray 10 10 - - - - 7 7 5 5 - - 2 2 8 8 3 3 - -
Michelle Tredenick 10 10 - - 10 10 - - - - 7 7 - - 8 8 - - - -
David Willis 9 10 5 5 7 10 - - - - 7 7 - - - - - - - 1
Richard Haire 10 10 - - 10 10 7 7 - - - - 2 2 8 8 3 3 - -
Neil Berkett 9 10 - - - - 4 6 - - 3 4 2 2 5 8 1 3 - -
Margaret Seale(4) 7 7 - - - - - - - - 3 3 - - 6 6 - - - -
Bruce Carter(5) 6 6 - - 6 6 3 3 - - - - 1 1 - - 2 3 - -
Total number of meetings held
10 5 10 7 5 7 2 8 3 6
A - Number of meetings attended
B - Number of meetings held during the time the Director was a member of the Board / Committee during the year
(1) The composition of the Investment Committee is not fixed. Composition and meetings held are set by the Board on an as required basis. (2) Stuart Grimshaw attended these Committee meetings but was not a formal committee member. (3) Roger Davis attends these Committee meetings but is not a formal Committee member.(4) Margaret Seale was appointed as a Director on 21 January 2014.(5) Bruce Carter was appointed as a Director on 27 February 2014.
Bank of Queensland Limited and its Controlled Entities A.B.N. 32 009 656 740. 5
(Continued) Year Ended 31 August 2014
DIRECTORS’ REPORT
Statutory Basic Earnings per Share (EPS) (cents)
2HY12 1HY13 2HY13 1HY14 2HY14
25.7 26.431.2
41.536.2
2HY12 1HY13 2HY13 1HY14 2HY14
Statutory Net Interest Margin (NIM) (%)
1.63 1.651.72
1.771.87
57.6
77.4
1.69
1.82
2HY12 1HY13 2HY13 1HY14 2HY14
Statutory Profit after Tax ($m)
134.7
85.3100.573.5
125.8
185.8
260.5
40%
34%
13bps
Dividends (cents)
2HY12 1HY13 2HY13 1HY14 2HY14
2628
3032
34
58
66
2HY12 1HY13 2HY13 1HY14 2HY14
Cash Earnings Net Profit after Tax ($m)
140.2131.0119.9
103.0
161.0
250.9
301.220%
14%
2HY12 1HY13 2HY13 1HY14 2HY14
Cash Cost-to-Income (%)
46.444.7
43.9 43.8 43.9
44.3
43.9
40bps
OPERATING AND FINANCIAL REVIEW
ANNUAL REPORT 20146
(Continued) Year Ended 31 August 2014
DIRECTORS’ REPORT
OPERATING AND FINANCIAL REVIEW (CONTINUED)
About BOQ
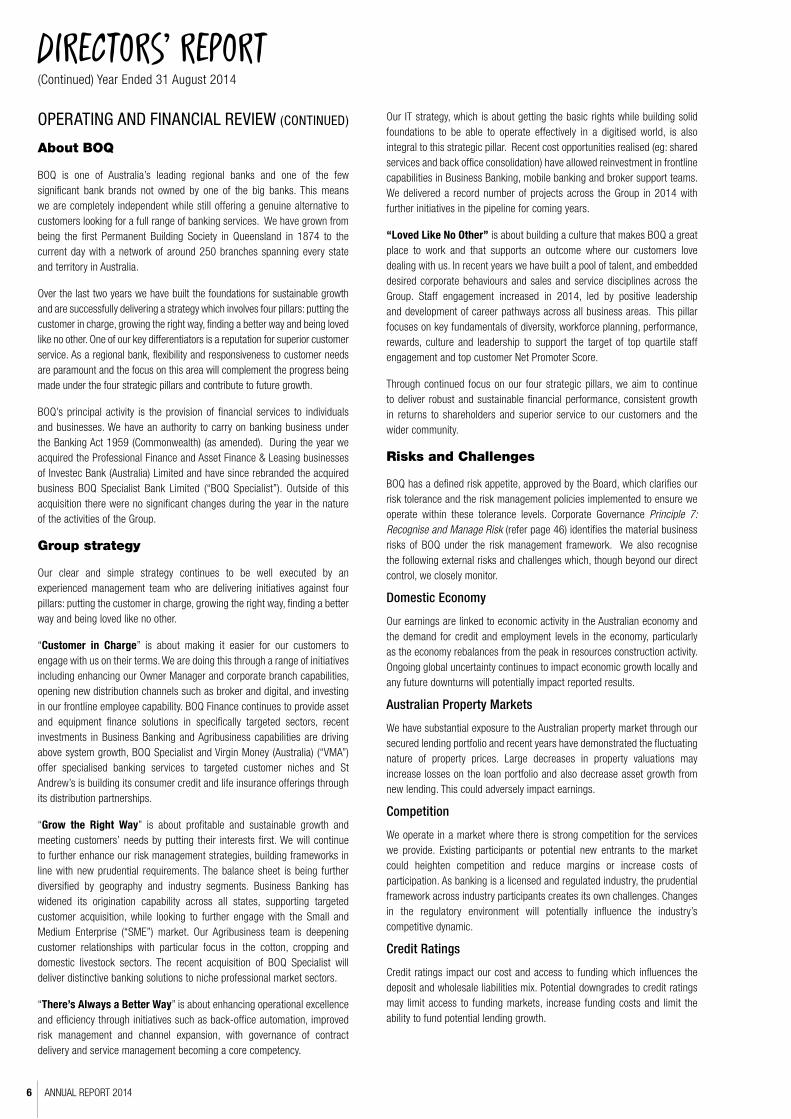
BOQ is one of Australia’s leading regional banks and one of the few significant bank brands not owned by one of the big banks. This means we are completely independent while still offering a genuine alternative to customers looking for a full range of banking services. We have grown from being the first Permanent Building Society in Queensland in 1874 to the current day with a network of around 250 branches spanning every state and territory in Australia.
Over the last two years we have built the foundations for sustainable growth and are successfully delivering a strategy which involves four pillars: putting the customer in charge, growing the right way, finding a better way and being loved like no other. One of our key differentiators is a reputation for superior customer service. As a regional bank, flexibility and responsiveness to customer needs are paramount and the focus on this area will complement the progress being made under the four strategic pillars and contribute to future growth.
BOQ’s principal activity is the provision of financial services to individuals and businesses. We have an authority to carry on banking business under the Banking Act 1959 (Commonwealth) (as amended). During the year we acquired the Professional Finance and Asset Finance & Leasing businesses of Investec Bank (Australia) Limited and have since rebranded the acquired business BOQ Specialist Bank Limited (“BOQ Specialist”). Outside of this acquisition there were no significant changes during the year in the nature of the activities of the Group.
Group strategy
Our clear and simple strategy continues to be well executed by an experienced management team who are delivering initiatives against four pillars: putting the customer in charge, growing the right way, finding a better way and being loved like no other.
“Customer in Charge” is about making it easier for our customers to engage with us on their terms. We are doing this through a range of initiatives including enhancing our Owner Manager and corporate branch capabilities, opening new distribution channels such as broker and digital, and investing in our frontline employee capability. BOQ Finance continues to provide asset and equipment finance solutions in specifically targeted sectors, recent investments in Business Banking and Agribusiness capabilities are driving above system growth, BOQ Specialist and Virgin Money (Australia) (“VMA”) offer specialised banking services to targeted customer niches and St Andrew’s is building its consumer credit and life insurance offerings through its distribution partnerships.
“Grow the Right Way” is about profitable and sustainable growth and meeting customers’ needs by putting their interests first. We will continue to further enhance our risk management strategies, building frameworks in line with new prudential requirements. The balance sheet is being further diversified by geography and industry segments. Business Banking has widened its origination capability across all states, supporting targeted customer acquisition, while looking to further engage with the Small and Medium Enterprise (“SME”) market. Our Agribusiness team is deepening customer relationships with particular focus in the cotton, cropping and domestic livestock sectors. The recent acquisition of BOQ Specialist will deliver distinctive banking solutions to niche professional market sectors.
“There’s Always a Better Way” is about enhancing operational excellence and efficiency through initiatives such as back-office automation, improved risk management and channel expansion, with governance of contract delivery and service management becoming a core competency.
Our IT strategy, which is about getting the basic rights while building solid foundations to be able to operate effectively in a digitised world, is also integral to this strategic pillar. Recent cost opportunities realised (eg: shared services and back office consolidation) have allowed reinvestment in frontline capabilities in Business Banking, mobile banking and broker support teams. We delivered a record number of projects across the Group in 2014 with further initiatives in the pipeline for coming years.
“Loved Like No Other” is about building a culture that makes BOQ a great place to work and that supports an outcome where our customers love dealing with us. In recent years we have built a pool of talent, and embedded desired corporate behaviours and sales and service disciplines across the Group. Staff engagement increased in 2014, led by positive leadership and development of career pathways across all business areas. This pillar focuses on key fundamentals of diversity, workforce planning, performance, rewards, culture and leadership to support the target of top quartile staff engagement and top customer Net Promoter Score.
Through continued focus on our four strategic pillars, we aim to continue to deliver robust and sustainable financial performance, consistent growth in returns to shareholders and superior service to our customers and the wider community.
Risks and Challenges
BOQ has a defined risk appetite, approved by the Board, which clarifies our risk tolerance and the risk management policies implemented to ensure we operate within these tolerance levels. Corporate Governance Principle 7: Recognise and Manage Risk (refer page 46) identifies the material business risks of BOQ under the risk management framework. We also recognise the following external risks and challenges which, though beyond our direct control, we closely monitor.
Domestic Economy
Our earnings are linked to economic activity in the Australian economy and the demand for credit and employment levels in the economy, particularly as the economy rebalances from the peak in resources construction activity. Ongoing global uncertainty continues to impact economic growth locally and any future downturns will potentially impact reported results.
Australian Property Markets
We have substantial exposure to the Australian property market through our secured lending portfolio and recent years have demonstrated the fluctuating nature of property prices. Large decreases in property valuations may increase losses on the loan portfolio and also decrease asset growth from new lending. This could adversely impact earnings.
Competition
We operate in a market where there is strong competition for the services we provide. Existing participants or potential new entrants to the market could heighten competition and reduce margins or increase costs of participation. As banking is a licensed and regulated industry, the prudential framework across industry participants creates its own challenges. Changes in the regulatory environment will potentially influence the industry’s competitive dynamic.
Credit Ratings
Credit ratings impact our cost and access to funding which influences the deposit and wholesale liabilities mix. Potential downgrades to credit ratings may limit access to funding markets, increase funding costs and limit the ability to fund potential lending growth.

Bank of Queensland Limited and its Controlled Entities A.B.N. 32 009 656 740. 7
(Continued) Year Ended 31 August 2014
DIRECTORS’ REPORT
Reputational
This is the potential loss of earnings or adverse impact on market capitalisation resulting from stakeholders taking a negative view of the Bank or our actions.
Regulatory Environment
BOQ is a prudentially regulated and we seek to comply with all applicable laws and regulations. Any changes to the regulatory environment will potentially influence use of capital and resources and / or create an increase in operational costs.
Financial Performance
Highlights
2014 2013
Aug 14 vs
Aug 13
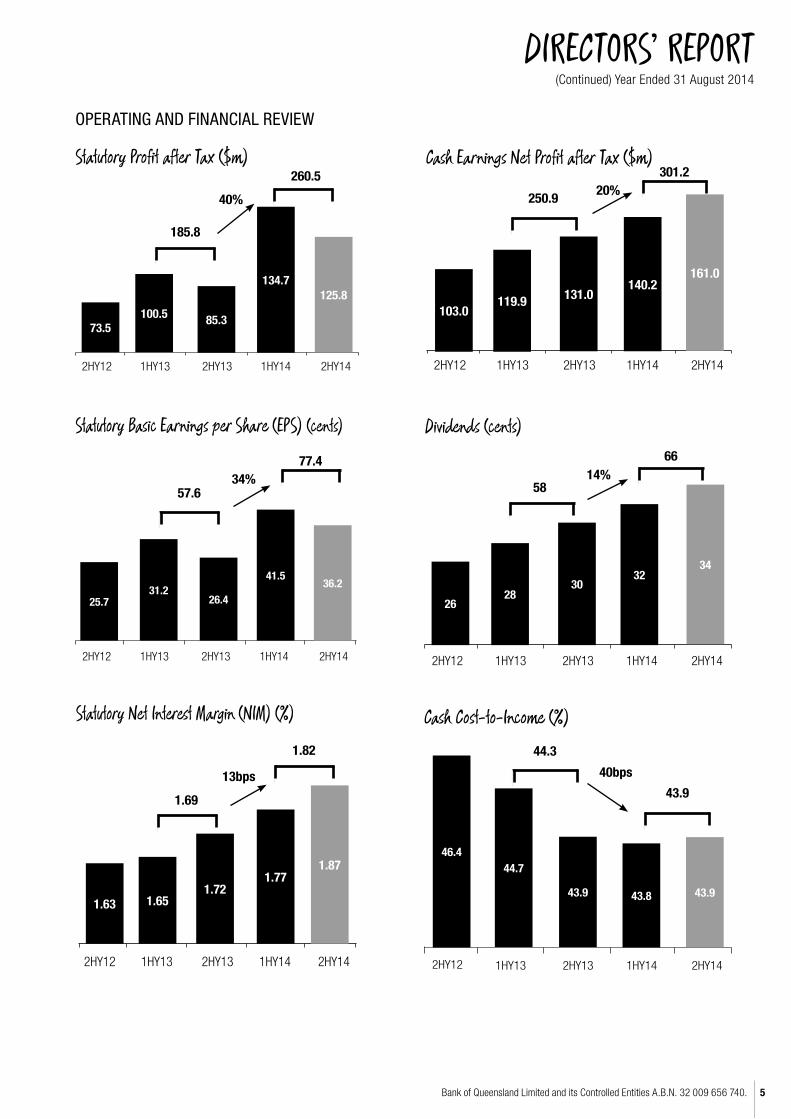
Net Profit After Tax - Statutory $’m 260.5 185.8 40%
Net Profit After Tax - Cash $’m 301.2 250.9 20%
Return on Equity - Statutory % 9.0 7.0 200bps
Return on Equity - Cash % 10.4 9.4 100bps
Dividend (cents) 66.0 58.0 14%
Basic Earnings per Share - Statutory
(cents)77.4 57.6 34%
Basic Earnings per Share - Cash (cents) 89.5 78.1 15%
Market Capitalisation $’m 4,560.3 3,070.2 49%
Common Equity Tier 1 % 8.63 8.63 -
Statutory Profit is prepared in accordance with the Corporations Act 2001 and the Australian Accounting Standards, which comply with International Financial Reporting Standards (“IFRS”). Cash Earnings is a non-Accounting Standards measure commonly used in the banking industry to assist in presenting a clear view of the Bank’s underlying earnings.
The table below provides a reconciliation of Statutory Profit to Cash Earnings.
$ million Aug-14 Aug-13
Aug 14 vs
Aug 13
Cash Earnings after Tax 301.2 250.9 20%
Amortisation of customer contracts
(acquisition)(6.8) (9.1) (25%)
Amortisation of fair value adjustments
(acquisition)- (1.0) (100%)
Hedge ineffectiveness (1.7) 2.4 (171%)
Government guarantee break fee (1.4) (5.2) (73%)
Integration / due diligence costs (7.6) (3.7) 105%
Legacy items (23.2) (37.5) (38%)
Restructuring costs - (11.0) (100%)
Statutory Net Profit after Tax 260.5 185.8 40%
Integration/due diligence costs – increase reflects costs relating to the acquisition of BOQ Specialist Bank. 2013 included the acquisition of Virgin Money (Australia).
Government guaranteed break fee – includes costs relating to repurchase of Government guaranteed debt.
Legacy items – principally a provision for settlement of the outstanding Storm Financial proceedings. Also includes legal costs relating to court proceedings by former NSW Owner Managers which found in favour of BOQ in February 2014. 2013 included the Product Remediation Review.
Restructuring costs – 2013 included a number of costs relating to significant restructuring activities undertaken in 2012 and 2013 as we implemented the four pillar strategy.
BOQ has posted record statutory and cash results for the 2014 financial year, as we continue to make progress in executing our strategy and building an organisation that is lower risk, lower volatility and set up for a sustainable future.
Statutory profit after tax was up 40% on the prior year to $260.5 million. Cash Earnings after Tax increased 20% on FY13 to $301.2 million, predominantly driven by net interest margin expansion and further improvement in impairment expense. Statutory basic earnings per share increased 34% to 77.4 cents per share for 2014, compared to the prior year earnings per share of 57.6 cents. Basic cash earnings per share was up 15% on the prior year to 89.5 cents.
The Board has determined to pay a final dividend of 34 cents per share fully franked, taking the full year dividend to 66 cents per share, an increase of 14% on 2013.
Net Interest Income increased largely due to an expansion in the net interest margin of 13 basis points. We received credit rating upgrades from Standard & Poor’s and Moody’s during the year to A- and A3 respectively, the highest level ever achieved by the bank, which enhanced our ability to improve our funding mix. The acquisition of the higher margin BOQ Specialist business will provide opportunities to grow assets in more profitable segments.
Lending assets grew at 9% over the year to $38.4 billion. This included the $2.6 billion in assets acquired as part of the BOQ Specialist Bank acquisition. Ignoring the impact of the acquisition, organic lending growth of $0.6 billion (2%) was achieved, which was below system growth of 6%. The Bank’s portfolio is heavily weighted to Queensland, where credit growth has been significantly lower than other regions across the country. Growth rates have also been impacted by a reduction in credit risk appetite from pre 2013 levels.
32.5
260.5
Aug 13 Loan
Impairment
Expense
Other
Income
Aug 14Net Interest
Income
TaxExpenses
2014 Statutory Earnings movement ($m)
15.0
67.7
28.3
185.8
3.8

ANNUAL REPORT 20148
(Continued) Year Ended 31 August 2014
DIRECTORS’ REPORT
OPERATING AND FINANCIAL REVIEW (CONTINUED)
Further success was achieved in our Business Banking strategy which delivered above average growth in the Property, SME and Agribusiness areas.
Improvement in all key credit metrics reflects macro-economic benefits from the low interest rate environment. In addition, revised risk appetite and focus on embedding heightened risk management processes continues to improve the credit quality of the portfolio. Loan impairment expense, impaired asset and arrears balances have all reduced from the prior year and demonstrate the Bank’s enhanced credit management practices. The changes will deliver improved sustainability of returns for shareholders over the long term.
Operating expenses have increased marginally over the year. Expenses include the one-off $31.5 million (pre-tax) settlement relating to Storm Financial, whilst the 2013 result included $46 million costs relating to the Product Remediation Review. Excluding these significant one off items, expenses reflect the significant investment in frontline capability as we expand our Business Banking team and establish a broker support network and mobile banking unit. These initiatives are now generating new business and putting the ‘Customer in Charge’ of choosing the channel through which they deal with us. We are in the process of undertaking substantial re-investment in our systems to move from a paper based to a digitised business, and this will provide the platform to harvest future productivity and efficiency benefits.
The balance sheet continues to be conservatively managed with capital ratios remaining stable. Recent credit rating upgrades have enabled us to improve the resilience and diversification of the Bank’s liability mix with the deposits to lending ratio increasing to 69%.
Income
Total operating income increased by 10% to $938.6 million compared with $855.9 million in the prior year. The main driver of this increase was net interest income growth of $67.7 million.
As seen from the graph below, Statutory net interest income increased by 13bps over the year to 1.82%. This movement was attributable to a number of factors including:
Asset pricing and mix – reductions over the year reflect run off of lower quality, higher margin business (eg Line of Credit product run off of $700 million) which has been replaced by lower margin lending such as the new award winning ‘Clear Path’ mortgage offering.
Funding costs and mix – driven by selective retail re-pricing initiatives, rollover of wholesale funding at lower credit spreads supported by improved market conditions, recent rating upgrades and ongoing benefits from repurchases of higher cost Government Guaranteed debt in recent periods.
Capital & low cost deposits – the investment return on the capital and low-cost deposit replicating portfolio has reduced in line with the lower interest rate environment. This has been partly offset by interest earned on the capital raised during the year in advance of settlement of the BOQ Specialist acquisition.
Other Income, excluding insurance income, increased by 11% to $136.2 million. Trading Income benefitted from favourable positioning and recent reductions in credit spreads on the liquid asset portfolio. Commission income increased due to a full year of VMA commission streams compared to four months post acquisition in 2013. Insurance income increased 3% to $41.6 million from the prior year of $40.3 million with a solid underwriting result and lower acquisition costs.
Fee income earned on banking products has remained challenging as new product offerings have lower fee structures and customers have continued to migrate to these products.
Expenses
Operating expenses on a statutory basis increased by 1% to $469.4 million (2013: $465.5 million) and cost to income ratio for the current financial year is 50.0%, down from 54.4% in 2013. Total operating expenses (excluding the impact of BOQ Specialist) on a cash basis increased by 6% to $403 million for the full year. On the same basis, the cash cost to income ratio improved from 44.3% to 43.8%.
While we continue to actively manage the expense base, we have reinvested in the business by bolstering our frontline capability to support the ‘Customer in Charge’ strategy.
There were a number of one-off costs for premises consolidation incurred during the year, including bridging tenancies, onerous lease provisions and lease surrender costs relating to branch closures. Excluding these impacts the annual expense growth would have been approximately 4.5%.
The Group is undertaking a strategic transformation in its operational infrastructure to digitise the organisation, requiring significant reinvestment to deliver its objectives. Whilst the expense growth profile is above inflation it reflects the current stage of this evolution. We would expect costs to return to an inflationary profile upon delivery of key pipeline projects which are underway.
The strategic project pipeline is designed to improve the customer experience while generating front and back office efficiency and includes a new retail lending platform, business processing systems and moving from legacy manual paper based processes to electronic data with full workflow management capability. We have also announced a significant restructure of our IT service delivery model and entered into a new IT outsourcing agreement with Hewlett-Packard after a competitive tender process. The new agreement brings a substantial lift in capability and an improved cost profile compared to the previous ten year old agreement. The new agreement is for five years with an option to extend for a further two years. We will experience an upward trend in technology amortisation in coming years as the investment pipeline is completed. This uplift should be sheltered by the significant operational efficiencies expected from the new IT outsourcing model and the benefits from these investment programs.
The acquisition of BOQ Specialist, which is a higher margin and higher cost to income ratio business, will reset the Group’s cost to income ratio approximately 1% higher than the current level. The BOQ Group’s cost to income ratio, excluding BOQ Specialist, is expected to be stable in financial year 2015. Completion of the current project portfolio is expected to deliver improved cost to income outcomes from financial year 2016.
1.69%
0.33%
1.82%
0.32%
FY13 Asset Pricing & Mix
Funding & Mix Capital & Low Cost Deposits
BOQ Specialist FY14
0.23% (0.03%) 0.01%
Net Interest Margin Third Party Costs
2.02% 2.14%
(0.08%)
Net Interest Margin
Bank of Queensland Limited and its Controlled Entities A.B.N. 32 009 656 740. 9
(Continued) Year Ended 31 August 2014
DIRECTORS’ REPORT
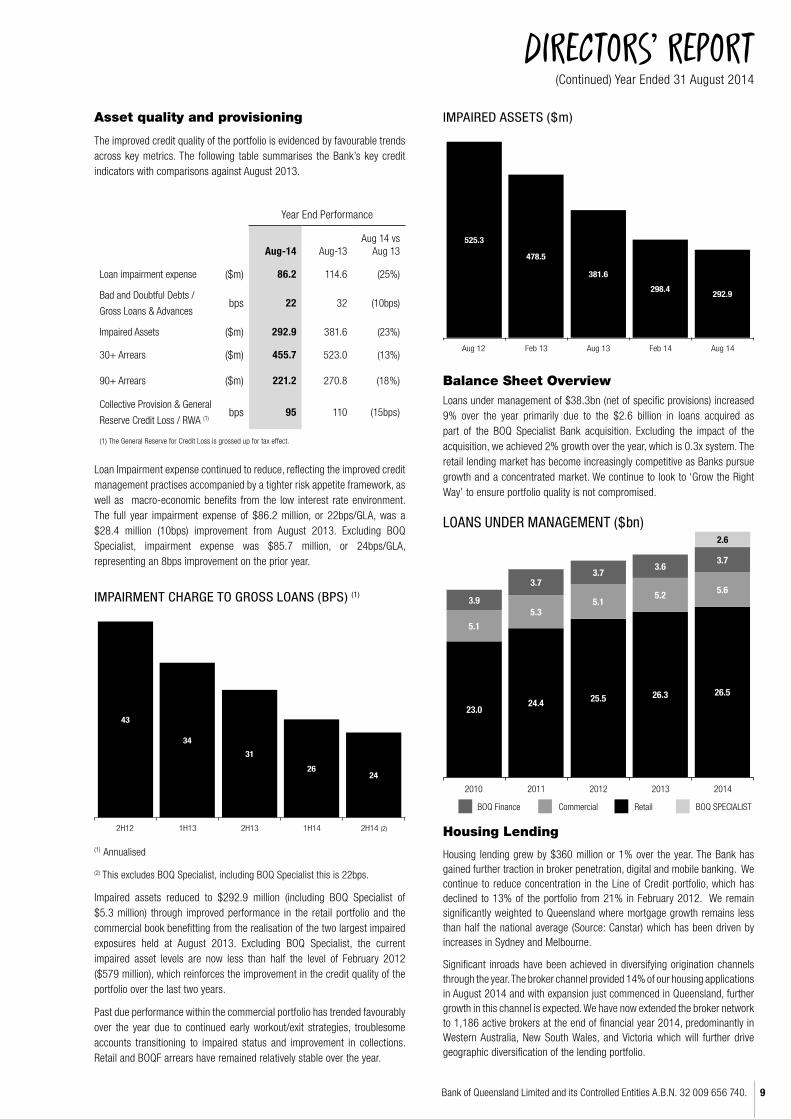
Balance Sheet OverviewLoans under management of $38.3bn (net of specific provisions) increased 9% over the year primarily due to the $2.6 billion in loans acquired as part of the BOQ Specialist Bank acquisition. Excluding the impact of the acquisition, we achieved 2% growth over the year, which is 0.3x system. The retail lending market has become increasingly competitive as Banks pursue growth and a concentrated market. We continue to look to ‘Grow the Right Way’ to ensure portfolio quality is not compromised.
Housing Lending
Housing lending grew by $360 million or 1% over the year. The Bank has gained further traction in broker penetration, digital and mobile banking. We continue to reduce concentration in the Line of Credit portfolio, which has declined to 13% of the portfolio from 21% in February 2012. We remain significantly weighted to Queensland where mortgage growth remains less than half the national average (Source: Canstar) which has been driven by increases in Sydney and Melbourne.
Significant inroads have been achieved in diversifying origination channels through the year. The broker channel provided 14% of our housing applications in August 2014 and with expansion just commenced in Queensland, further growth in this channel is expected. We have now extended the broker network to 1,186 active brokers at the end of financial year 2014, predominantly in Western Australia, New South Wales, and Victoria which will further drive geographic diversification of the lending portfolio.
Year End Performance
Aug-14 Aug-13Aug 14 vs
Aug 13
Loan impairment expense ($m) 86.2 114.6 (25%)
Bad and Doubtful Debts /
Gross Loans & Advancesbps 22 32 (10bps)
Impaired Assets ($m) 292.9 381.6 (23%)
30+ Arrears ($m) 455.7 523.0 (13%)
90+ Arrears ($m) 221.2 270.8 (18%)
Collective Provision & General
Reserve Credit Loss / RWA (1)bps 95 110 (15bps)
(1) The General Reserve for Credit Loss is grossed up for tax effect.
Asset quality and provisioning
The improved credit quality of the portfolio is evidenced by favourable trends across key metrics. The following table summarises the Bank’s key credit indicators with comparisons against August 2013.
Loan Impairment expense continued to reduce, reflecting the improved credit management practises accompanied by a tighter risk appetite framework, as well as macro-economic benefits from the low interest rate environment. The full year impairment expense of $86.2 million, or 22bps/GLA, was a $28.4 million (10bps) improvement from August 2013. Excluding BOQ Specialist, impairment expense was $85.7 million, or 24bps/GLA, representing an 8bps improvement on the prior year.
525.3
478.5
381.6
298.4292.9
Aug 12 Feb 13 Aug 13 Feb 14 Aug 14
IMPAIRED ASSETS ($m)
(1) Annualised
(2) This excludes BOQ Specialist, including BOQ Specialist this is 22bps.
Impaired assets reduced to $292.9 million (including BOQ Specialist of $5.3 million) through improved performance in the retail portfolio and the commercial book benefitting from the realisation of the two largest impaired exposures held at August 2013. Excluding BOQ Specialist, the current impaired asset levels are now less than half the level of February 2012 ($579 million), which reinforces the improvement in the credit quality of the portfolio over the last two years.
Past due performance within the commercial portfolio has trended favourably over the year due to continued early workout/exit strategies, troublesome accounts transitioning to impaired status and improvement in collections. Retail and BOQF arrears have remained relatively stable over the year.
23.024.4 25.5 26.3 26.5
5.1
5.35.1
5.2 5.63.9
3.73.7
3.63.7
2010 2011 2012 2013 2014
LOANS UNDER MANAGEMENT ($bn)
Commercial RetailBOQ Finance
2.6
BOQ SPECIALIST
43
34
31
2624
2H12 1H13 2H13 1H14 2H14 (2)
IMPAIRMENT CHARGE TO GROSS LOANS (BPS) (1)

ANNUAL REPORT 201410
(Continued) Year Ended 31 August 2014
DIRECTORS’ REPORT
Credit rating
Our current long-term debt ratings are shown below. Two rating agencies revised their long term debt ratings for the Bank during the year. Standard & Poor’s upgraded their rating to A- and Moody’s upgraded to A3. Both noted the improved balance sheet and capital strength of BOQ.
Rating Agency Short Term Long Term Outlook
Standard & Poor’s A2 A- Stable
Fitch F2 BBB+ Positive
Moody’s P2 A3 Stable
Tax Expense
The effective tax rate for the year is 32%. The increment over the 30% company tax rate reflects non-deductibility of interest payable on Convertible Preference Shares, intangibles amortisation expenses and BOQ Specialist acquisition costs.
Capital
We maintained a strong capital position over the course of the year with Common Equity Tier 1 steady at 8.63%. During the year, we raised $400 million in capital to fund the acquisition of BOQ Specialist. The improved cash earnings, coupled with lower lending growth, enabled underlying capital generation of approximately 38 basis points of Common Equity Tier 1. This was used to part fund the capital requirements of the BOQ Specialist acquisition.
OPERATING AND FINANCIAL REVIEW (CONTINUED)
Commercial LendingCommercial lending grew 41% to $7.2 billion bolstered by the acquisition of BOQ Specialist. Excluding the impact of the acquisition, growth was up 6% over the year to $5.6 billion. This was delivered by continuing to build closer customer relationships and supported by the appointment of SME specialists.
In our Business Bank, we continue to outperform our peers in customer satisfaction surveys, leading the pack in the East & Partners Business Banking Index for six years running and recently achieving a record high.
BOQ Finance
The portfolio has been further complemented by the recent acquisition of BOQ Specialist Bank which has an asset and finance leasing portfolio providing commercial rental, lease and loan solutions for a broad range of equipment types. Our BOQ Finance leasing portfolio saw organic growth despite contraction in the industry, offsetting a targeted reduction in selected debtor finance exposures which provided further portfolio credit quality improvement. The business maintains leading capability in equipment, debtor, vendor and dealer finance.
Funding & Liquidity
As evidenced by recent credit upgrades from both Standard & Poor’s (‘A-’) and Moody’s (‘A3’), there has been progress in strengthening the balance sheet, creating a sustainable funding profile and improving internal capital generation.
The recent upgrades, supported by improvement in term funding markets, have provided opportunities to further diversify funding sources and manage all liabilities to maximise interest margins, which has been a key driver of income growth. Significant value was achieved over the year as we reduced reliance on high cost, price sensitive segments of the retail deposit market. We have also deepened our penetration of middle market customers as the recent upgrades widen our liability eligibility across investment portfolios.
We maintain a high quality, diversified liquid asset portfolio to support regulatory and internal requirements. The transition of the liquid asset portfolio to meet the new Basel III Prudential Standard APS 210 Liquidity rules has been completed well in advance of the 1 January 2015 implementation date. Further, eligibility for the Reserve Bank of Australia (‘RBA’) Committed Liquidity Facility has been finalised and will begin on 1 January 2015.
Our total liquidity holdings of $6.4 billion represents a substantial excess over short term funding levels and provides a material buffer in the event of a market dislocation. In addition, $2.4 billion of internal securitisation capacity is held which is eligible for repurchase arrangements with the Reserve Bank of Australia as a source of contingent liquidity in the event of a crisis scenario. Significant further liquidity is also available with the majority of the Bank’s retail lending assets eligible to be placed as collateral into the structure.
Aug 13 Cash Earnings Net Dividends net of DRP (1)
RWA Movement
Capitalised Software
Aug 14
8.63%
1.40%
0.34%
0.60%
0.28%
8.63%
COMMON EQUITY TIER 1 RATIO
Underlying capital generation
0.13%
0.14%
OtherStorm Settlement
BOQ Specialist Acquisition (2)
(1) DRP participation level in the 2014 half year dividend was 31%.
(2) The loan book acquired on completion was $215m higher than the book reflected at announcement. This growth, coupled with a small increase in goodwill due to fair value adjustments, has resulted in consumption of excess capital of 34 basis points rather than the 25 basis points ($54m) presented in the February 2014 proforma announcement. Post completion, organic capital generation of the acquired business is available to fund RWA growth.
0.09%
Bank of Queensland Limited and its Controlled Entities A.B.N. 32 009 656 740. 11
(Continued) Year Ended 31 August 2014
DIRECTORS’ REPORT
Dividends
The Board announced an increase in the final dividend to 34 cents per share. This takes full year dividends to 66 cents per share and represents an increase of 14% on the prior year. All the dividends paid or determined were fully franked at the tax rate of 30%.
Environmental regulation
The Group’s operations are not subject to any significant environmental regulations under either Commonwealth or State legislation. The Board confirms that the Group is not aware of any breach of environmental requirements.
Director and Management changes
Bruce Carter and Margaret Seale joined the Board as Non-Executive Independent Directors during the financial year. Bruce was appointed on 27 February 2014 and is also a member of the Audit and Risk Committees. Margaret, appointed 21 January 2014, is a member of the Human Resources & Remuneration and Information Technology Committees. On 31 August 2014 Stuart Grimshaw resigned from his positions as Managing Director and Chief Executive Officer with plans well advanced for his replacement.
Acquisition
On 31 July 2014, we finalised the acquisition of Investec Bank (Australia) Limited, which has now been renamed as BOQ Specialist Bank Limited. BOQ Specialist has a substantial market share of Medical and Accounting professionals and combining this with access to BOQ products and funding will create significant growth opportunities. In addition it increases BOQ’s footprint geographically while at the same time adding $2.6 billion to our loan portfolio.
BOQ Specialist contributed one month of earnings to the Group Net Profit after tax of $3.1 million, in line with expectations.
Below are details of the entities established or acquired during the financial year:
• BOQ Specialist Bank Limited formerly known as Investec Bank (Australia) Limited was acquired on 31 July 2014.
• BOQ Specialist Pty Ltd formerly known as Investec Professional Finance Pty Ltd was acquired on 31 July 2014.
• BOQ Asset Finance and Leasing Pty Ltd formerly known as Investec Asset Finance & Leasing Pty Ltd was acquired on 31 July 2014.
Refer to Section 6.5 of the financial report for further information.
Disposals
Series 2005-2 REDS Trust was closed on 12 June 2014.
Events subsequent to balance date
Dividends have been determined after 31 August 2014, refer to Section 2.5. The financial effect of the above transaction has not been brought to account in the financial statements for the year ended 31 August 2014.
On 22 September 2014, we announced an agreement to settle the outstanding Storm Financial proceedings for $31.5 million, which had been brought against the Group by the Australian Securities and Investment Commission and a class action on behalf of borrowers advised by Storm Financial. The timing of payment is to be confirmed as we await court ratification of the settlement.
ANNUAL REPORT 201412
Year Ended 31 August 2014
REMUNERATION REPORT
INTRODUCTORY MESSAGE
Dear Shareholder
Please find attached the 2014 Remuneration Report. In response to feedback from shareholders, proxy advisors, remuneration advisors and regulators we have, as we did last year, further refined the 2014 remuneration report in an effort to make it more readable and meaningful. This feedback has also resulted in changes to our policy and practice.
The BOQ Human Resources & Remuneration Committee has, on behalf of the BOQ Board, sought to provide governance over the Bank’s remuneration and human resources, and in doing so to align the interests of employees and shareholders. Our principles have not changed:
• No upfront cash payments for executives joining BOQ;
• Deferral and claw back of unvested short term incentives (STI) and long term incentives (LTI);
• Allocation of LTIs on the basis of face value and not fair value;
• Matching the fixed and total remuneration to market;
• Structuring total remuneration at approximately one third fixed, one third short term incentive and one third long term incentive;
• Providing Board overlay discretion on all remuneration outcomes; and
• Ensuring key performance indicators for all executives, covering both financial and non-financial measures.
During the year we made several changes to the remuneration arrangements for our Senior Executives as follows:• Ceased awarding non-hurdled deferred award rights (DARs) to
Senior Executives. These have previously been used as a retention mechanism, but are seen as inappropriate as an element of their remuneration at the current time;
• Awarded restricted shares instead of cash for the deferred component of STI. This change will better align management and shareholder interests;
• For the 2015 STI scheme, we will be using an EPS measure as a gateway to STI instead of Net Profit After Tax (“NPAT”) currently in use;
• We will make LTI offers in FY15 on the basis that some or all of any unvested performance award rights may remain on foot at the Board’s discretion for a Senior Executive deemed to be a “good leaver”, with the vesting of any such award rights remaining subject to satisfaction of the vesting conditions. The Board intends to apply this principle to unvested LTI performance award rights granted in years prior to FY15, subject to any necessary approvals (refer Table 3 or Page 20). This change will further encourage Management to ensure their actions are focused on long term shareholder value whilst they are employed at BOQ;
• We plan to add a second vesting measure to our 2015 – Long Term Incentive Plan to complement the current comparative Total Shareholder Return (“TSR”) hurdles. We continue to work on what measure best suits the objectives of the LTI; and
• We considered the dilution impact on unvested award rights from the 2014 capital raising and the Board decided consistent with the 2011 capital raising that there would be no adjustment.
2014 has been a very strong year for the BOQ shareholders in both absolute and comparative terms. The total shareholder return for the 12 months to August 2014 was 39.2%. This provided the best overall return amongst BOQ’s industry competitors and, subject to individual performances, has meant that the Board of BOQ has awarded short term incentives which are higher than last year. Each executive’s remuneration has been evaluated in accordance with their Key Performance Indicators (“KPIs”), scored and moderated by the Acting CEO and by the Board.
The Human Resources (“HR”) & Remuneration Committee has taken external advice concerning comparative and absolute payments for all Senior Executives. In August 2014, the BOQ Managing Director & CEO, Stuart Grimshaw, resigned. His entitlements on departure have been released publicly and are consistent with his employment contract. He received no STI for the 2014 year however his LTI remains on foot and is subject to the comparative TSR vesting hurdles. We have also publicised the remuneration for the Acting CEO, Jon Sutton. When the Board determines who will be the permanent CEO, we will agree a new contract and conditions.
Finally, the year has been satisfying for the Bank in many respects. In addition to a strong financial and share price performance, a number of improvements to the internal systems and processes are being successfully implemented and should provide a basis for shareholder value in future years and this has impacted our view on remuneration. In many ways, this year has provided confidence to the Board that the additional costs associated with the renewal of the senior executive at BOQ have been more than offset by the value this team is creating for shareholders.
DAVID WILLIS
CHAIRMAN OF THE HUMAN RESOURCES & REMUNERATION COMMITTEE
2014 REMUNERATION REPORT – AUDITEDThis Remuneration Report is prepared for consideration by shareholders at the 2014 Annual General Meeting of the Bank. It outlines the overall remuneration strategy, framework and practices adopted by the Consolidated Entity for the period 1 September 2013 to 31 August 2014 and has been prepared in accordance with Section 300A of the Corporations Act 2001 and its regulations.
Contents1. Key management personnel
2. Remuneration governance
3. Remuneration policy
4. Executive remuneration framework
5. Non-executive Director remuneration
6. Remuneration disclosures
7. Transactions with Directors and Senior Executives
8. Executive contracts
1. Key Management Personnel (KMP)KMP include those Directors and executives who have authority and responsibility for planning, directing and controlling the activities of the Bank and the Consolidated Entity.
The KMP for the financial year ended 31 August 2014 were as follows:
(i) Directors
CurrentRoger Davis Chairman (Non-executive)Stuart Grimshaw Managing Director and Chief Executive Officer (Resigned - 31 August 2014)
Neil Berkett Director (Non-executive)Bruce Carter Director (Non-executive) (appointed - 27 February 2014)Steve Crane Director (Non-executive)
Carmel Gray Director (Non-executive)
Richard Haire Director (Non-executive)
Page
12
13
13
13
19
20
32
33

Bank of Queensland Limited and its Controlled Entities A.B.N. 32 009 656 740. 13
(Continued) Year Ended 31 August 2014
REMUNERATION REPORT
(i) Directors (continued)Margaret Seale Director (Non-executive) (appointed 21 January 2014)Michelle Tredenick Director (Non-executive)
David Willis Director (Non-executive)
(ii) Senior ExecutivesCurrentJon Sutton Chief Operating Officer (currently Acting CEO)
Julie Bale Chief Information Officer
Matthew Baxby Group Executive, Retail and Online Banking
Brian Bissaker Chief Executive Officer, Virgin Money Australia
Peter Deans Chief Risk Officer
Karyn Munsie Group Executive, Corporate Affairs, Investor Relations & Government Relations
Anthony Rose Chief Financial Officer
Brendan White Group Executive, Business Banking, Agribusiness & Financial Markets
2. Remuneration GovernanceThe HR & Remuneration Committee makes recommendations to the Board on remuneration policies, Directors’ and executives’ remuneration (which includes the Company Secretary) and HR matters. This Committee considers remuneration and HR issues regularly and obtains advice from external independent remuneration specialists to assist in its deliberations. Under the Consolidated Entity’s HR & Remuneration Committee Charter, the Committee undertakes to do the following: • Conduct annual reviews of the Consolidated Entity’s Remuneration
Policy to ensure compliance with the Consolidated Entity’s objectives, and risk management framework;
• Review and provide recommendations to the Board on remuneration, recruitment, retention and termination policies and procedures for Senior Executives;
• Review and provide annual recommendations to the Board on the individual remuneration arrangements for the Managing Director, Senior Executives and risk and governance personnel (“Responsible Persons”);
• Review and provide annual recommendations to the Board on the remuneration principles for employees in Group Risk, Credit, Finance and Legal functions, on a group basis;
• Review and provide recommendations to the Board on the remuneration of any employees specified by the Australian Prudential Regulation Authority (“APRA”) as KMP or Responsible Persons;
• Review and provide recommendations to the Board on the remuneration for all remaining groups of employees not otherwise specified; and
• Consider and approve Non-Executive Director (“NED”) remuneration, including ensuring that the structure of NED remuneration is clearly distinguished from that of Senior Executives.
The HR & Remuneration Committee regularly reviews Remuneration Policy to ensure it adequately supports the Consolidated Entity’s overall risk management framework. As noted last year we have implemented the change to the nature of STI deferral from cash to restricted shares for all Senior Executives (including the Managing Director) from the FY 2013 award. The HR & Remuneration Committee meets at least six times per year and in the 2014 financial year, seven meetings were held.
2.1 Use of External Advisors and Remuneration Consultants
Where necessary, the Board seeks advice from independent experts and advisors, including remuneration consultants. Remuneration consultants are engaged by, and report directly to, the HR & Remuneration Committee which ensures, upon engagement, that the appropriate level of independence exists from the Consolidated Entity’s Management. Where the consultant’s engagement requires a recommendation, the recommendation is provided to, and discussed directly with the Chairman of the HR & Remuneration Committee.
During the year, the Board paid an amount of $63,275 to Egan & Associates in respect of remuneration advice covering a number of remuneration-related issues, including benchmarking and determination of pay for the Senior Executives. Egan & Associates provided no advice directly to Management in the 2014 year. The Board is satisfied that remuneration advice provided by external advisers during the year was free from undue influence by members of the Senior Executive to whom the advice related.
3. Remuneration PolicyThe Consolidated Entity’s executive reward policy is designed to balance five objectives:• Incentivise executives to pursue the short and long-term goals of the
Consolidated Entity within an appropriate risk control framework;
• Demonstrate a clear relationship between executive performance and remuneration;
• Align the interest of management with those of the shareholders;
• Provide sufficient rewards to ensure the Consolidated Entity attracts and retains suitably qualified and experienced executives for key roles; and
• Ensure that an element of these rewards is deferred to assist in appropriate risk-based decision-making and behaviour.
The HR & Remuneration Committee monitors and reshapes remuneration programs to support these underlying objectives, responds to proposed and enacted legislation and regulatory initiatives, and adjusts to changes in the business cycle.
4. Executive Remuneration FrameworkThe remuneration structure in place for the Senior Executives (including the Managing Director) is consistent with the Consolidated Entity’s Remuneration Policy, and is based on a total remuneration approach comprising an appropriate mix of fixed (salary and benefits) and variable pay in the form of cash and equity-based incentives.
4.1 Current remuneration frameworkTotal remuneration for the Senior Executives consists of the following three components:
• Fixed remuneration;
• Short term incentives - at-risk remuneration consisting of cash and equity; and
• Long term incentives - at-risk equity remuneration.
4.2 Fixed remuneration
The Senior Executives (including the Managing Director) are offered a competitive fixed component of pay and rewards that reflect the core performance requirements and expectations of their roles. The level of fixed remuneration is approved by the Board and reviewed at least annually. It is referenced to market data provided by remuneration consultants, to ensure that it has regard to remuneration within the financial services sector. The fixed remuneration for the Managing Director and Senior Executives is set out in Table 10 of this report.

ANNUAL REPORT 201414
(Continued) Year Ended 31 August 2014
REMUNERATION REPORT
Business objectives and the STI Plan design features are reviewed annually by the HR & Remuneration Committee prior to the commencement of the plan year. The Board has determined that deferral for the Senior Executives (including the Managing Director) will be into shares subject to restrictions on disposal from the FY 2013 STI award. The restricted shares provide an additional incentive to act in the shareholders’ longer-term interests over the two year deferral period. The decision to release deferred STI will be at the discretion of the Board, which consults with the Chief Risk Officer (“CRO”) in making such a decision.
Table 1 2014 STI Plan
Overview The 2014 STI Plan is an incentive plan under which participants have the opportunity to receive amounts in cash and equity, having regard for quantifiable results achieved within appropriate risk management parameters.
Participants Senior Executives (including the Managing Director (“MD”)), being those individuals who have the ability to influence achievement of the Board’s objectives.
STI Opportunity The STI opportunity for each participant is stated as a percentage of total fixed remuneration (“TFR”). For the 2014 STI Plan, the STI opportunity ranges are as follows:
MD 0 - 150% of TFR
COO,GE Business Banking, Agribusiness & Financial Markets, GE Retail and Online Banking, GE Virgin Money
0 - 140% of TFR
CRO & CFO 0 - 100% of TFR
CIO & GE Corporate Affairs, Investor Relations and Govern-ment Relations
0 - 100% of TFR
Link between performance and award
The performance measures are:
• The Consolidated Entity’s performance against target NPAT;
• The Consolidated Entity’s Cost to Income ratio;
• Individual performance criteria; and
• Adherence with the Consolidated Entity’s risk framework and expected behaviours.
Additionally, NPAT acts as a gateway for the other performance measures in the STI. Achievement of a threshold of 90% of target NPAT is required for payments under the STI Plan to occur. If performance does not meet the NPAT threshold, payment of STI is at the discretion of the Board. In exercising this discretion the Board will have regard for a range of factors which are outlined in Section 4.5. From 2015, this hurdle will change from NPAT to Earnings Per Share (“EPS”) reflecting feedback from investors.
Measure Weighting Rationale for use of this measure
How does this measure operate?
Net Profit After Tax 50% The NPAT measure is included as it is a direct and transparent measure of the financial performance of the Consolidated Entity.
As the level of NPAT increases, the quantum of STI payable in respect of the NPAT component increases, up to the maximum potential payout indicated above.
4.3 Short term incentive - At-risk remuneration
The short term incentive links individual performance with that of the Con-solidated Entity. It is designed to ensure that the participants have a per-formance-focussed work environment, whilst exercising an appropriate level of risk.Responsible Persons (as defined by CPS 520) and Senior Executives partic-ipated in the 2014 STI Plan, under which the participants receive payments dependent upon the achievement of specified, quantifiable results and within appropriate risk management parameters.

Bank of Queensland Limited and its Controlled Entities A.B.N. 32 009 656 740. 15
(Continued) Year Ended 31 August 2014
REMUNERATION REPORT
Link between performance and award (continued)
Measure Weighting Rationale for use of this measure
How does this measure operate?
Cost to Income Ratio 10% The Cost to Income ratio is included as a measure within the STI Plan to assist in driving a cost manage-ment discipline and align participants with the financial growth of the Consolidated Entity. This measure directly aligns with the operational excellence component of the Consolidated Entity’s strategy.
Participants receive a per-centage of the STI payment if the Consolidated Entity achieves its budgeted Cost to Income ratio, increasing on a sliding scale as the ratio improves and decreasing as performance deteriorates.
Individual performance criteria, including:• Strategic Initiatives • Customer in Charge• Grow the Right Way• There’s Always a Better Way• Loved Like No Other• Demonstration of appro-
priate leadership behaviours
40% These measures are selected to reflect the Consolidated Entity’s short-term and long-term objectives.
Personal performance meas-ures are agreed annually and are role specific. Individual performance criteria consider multiple factors including individual behaviours, the business results and/or strategic accomplishments of the business or function, and people management, together with adherence to risk criteria.
Performance period Performance will be assessed over the financial year. Payments under the STI will generally be made in October, following assessment of performance over the relevant performance period.
Change of control In the event of a change of control, all STIs will either remain on foot or be paid out on a pro rata basis or in full (depending on the circumstances). The restriction on deferred STI (Restricted shares) will either remain on foot or be lifted depending on the circumstances of the change in control.
Dividends Senior Executives who hold restricted shares as part of deferred STI receive dividends.
Deferral When any STI payment exceeds $100,000, 50% of the total amount awarded is deferred. For Senior Executives (including the MD), the deferral is into restricted shares for a period of 2 years (50% vesting at the end of year 1 and 50% at the end of year 2). Restricted shares are ordinary BOQ shares held by a trustee on behalf of participants and subject to disposal restrictions.
The restricted shares will be released to the individual at the end of the deferral period subject to continued employment and the Board determining that no “forfeiture” events have occurred. The Board retains discretion to determine what constitutes a “claw-back” event but such events can include breaches of risk KPI’s, departure to a direct competitor and instances where there has been a material misstatement in the financial statements.
Forfeiture The STI award and / or any deferred component will only be awarded to KMP’s who are employed by the BOQ Group as at the relevant STI Bonus payment date and who have not given notice of resignation prior to this date. Once awarded, restricted shares remain subject to disposal restrictions and will be forfeited where the participant:
1. Resigns in order to take up employment with a defined competitor; or
2. Takes up employment with a direct competitor within 3 months of ceasing employment; or
3. Ceases employment by reason of summary dismissal or for reasons associated with a breach of their Agreement or other employment terms or any policy of the Company or a related Company; or
4. Is deemed by the Board to have committed an act of fraud, material misstatement, financial mismanagement, gross misconduct or a serious breach of their duties obligations in relation to the Company’s affairs.
The deferred portion of an MD / Senior Executive’s STI award may also be forfeited where the Board determines that risk conditions have not been met during the deferral period. Advice may be sought from the CRO in making this determination.
ANNUAL REPORT 201416
(Continued) Year Ended 31 August 2014
REMUNERATION REPORT
Forfeiture (continued) For clarity, following the resignation of Mr Stuart Grimshaw as MD, he forfeited his 2014 STI entitlement and his 2012 unvested DARs. Mr Grimshaw retained his 2013 restricted shares, as none of the forfeiture conditions were deemed to exist. The 2013 restricted shares will vest in line with their vesting conditions, however the Board retains the right to claw back these shares should it be decided that risk conditions have not been met.
4.3.1 Performance against STI awarded
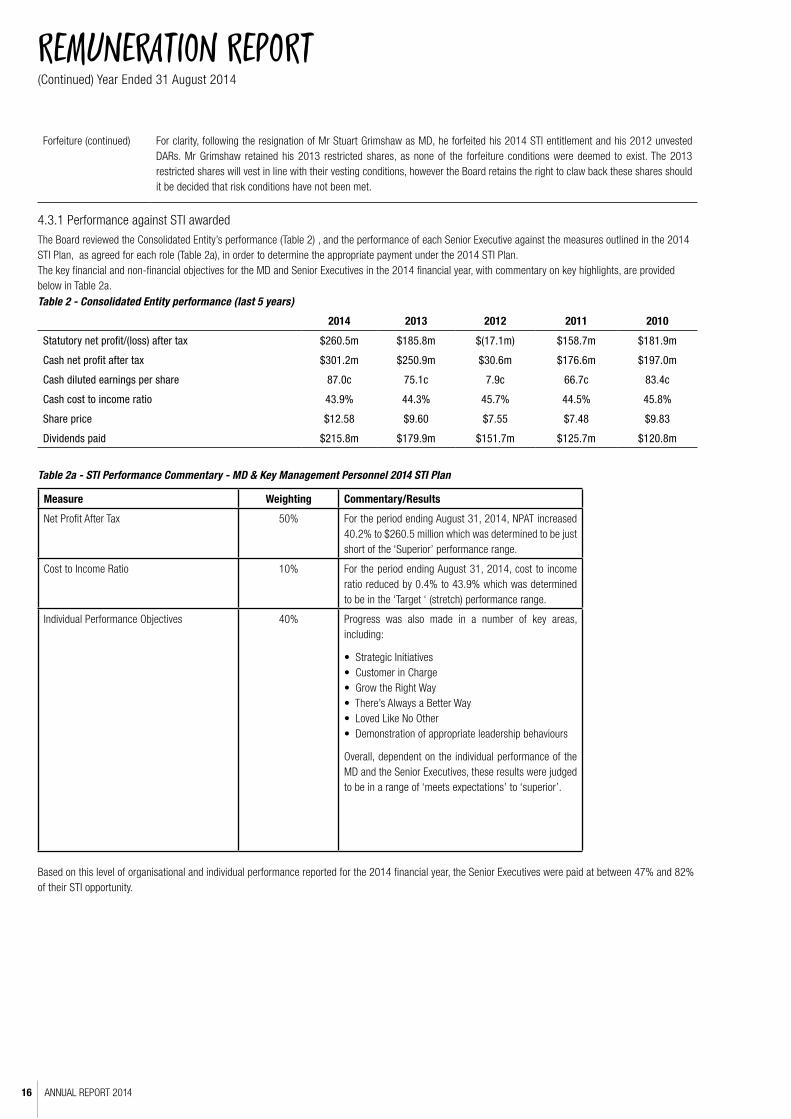
The Board reviewed the Consolidated Entity’s performance (Table 2) , and the performance of each Senior Executive against the measures outlined in the 2014 STI Plan, as agreed for each role (Table 2a), in order to determine the appropriate payment under the 2014 STI Plan.The key financial and non-financial objectives for the MD and Senior Executives in the 2014 financial year, with commentary on key highlights, are provided below in Table 2a.Table 2 - Consolidated Entity performance (last 5 years)
2014 2013 2012 2011 2010
Statutory net profit/(loss) after tax $260.5m $185.8m $(17.1m) $158.7m $181.9m
Cash net profit after tax $301.2m $250.9m $30.6m $176.6m $197.0m
Cash diluted earnings per share 87.0c 75.1c 7.9c 66.7c 83.4c
Cash cost to income ratio 43.9% 44.3% 45.7% 44.5% 45.8%
Share price $12.58 $9.60 $7.55 $7.48 $9.83
Dividends paid $215.8m $179.9m $151.7m $125.7m $120.8m
Table 2a - STI Performance Commentary - MD & Key Management Personnel 2014 STI Plan
Measure Weighting Commentary/Results
Net Profit After Tax 50% For the period ending August 31, 2014, NPAT increased 40.2% to $260.5 million which was determined to be just short of the ‘Superior’ performance range.
Cost to Income Ratio 10% For the period ending August 31, 2014, cost to income ratio reduced by 0.4% to 43.9% which was determined to be in the ‘Target ‘ (stretch) performance range.
Individual Performance Objectives 40% Progress was also made in a number of key areas, including:
• Strategic Initiatives • Customer in Charge• Grow the Right Way• There’s Always a Better Way• Loved Like No Other• Demonstration of appropriate leadership behaviours
Overall, dependent on the individual performance of the MD and the Senior Executives, these results were judged to be in a range of ‘meets expectations’ to ‘superior’.
Based on this level of organisational and individual performance reported for the 2014 financial year, the Senior Executives were paid at between 47% and 82% of their STI opportunity.

Bank of Queensland Limited and its Controlled Entities A.B.N. 32 009 656 740. 17
(Continued) Year Ended 31 August 2014
REMUNERATION REPORT
4.4 Long-term incentive remuneration
The Board considers the granting of equity remuneration to Senior Executives
and the MD to be an important component in aligning their interests to those
of shareholders. This includes encouraging behaviour that supports the
risk management framework and the long-term financial soundness of the
Consolidated Entity.
The Board reviews the structure and quantum of the long-term incentives
on an annual basis to ensure their effectiveness, and recognise the potential
impact of participants on the Consolidated Entity’s future performance.
Senior Executives participated in the 2014 Award Rights Plan under which
the participants receive rights to acquire shares at no cost, subject to
achievement of performance and service conditions. No amount is payable
by employees for the grant or exercise of these award rights. The Award
Rights Plan was approved by shareholders on 11 December 2008 and
further ratified at the AGM on 8 December 2011.
There are two types of award rights that can be granted to Senior Executives
under the plan - Performance Award Rights (“PARs”) and Deferred Award
Rights (“DARs”). Eligibility, quantum and mix of PARs and DARs varies based
upon a participant’s accountabilities, contribution, potential and seniority.
From the 2014 year the Board has made a decision not to award DARs to
Senior Executives.
Grants of PARs are made to Senior Executives (including the MD) and
other identified key senior managers due to the important role they play
in achieving the longer-term business goals of the Consolidated Entity.
PARs have performance hurdles which will allow the Board to ensure that
incentives are aligned with the Consolidated Entity’s future strategies and
the interests of shareholders.
DARs are awarded to a broader group of employees below Senior Executive to promote employee retention and productivity. The number of DARs awarded to an individual employee depends on their position and relative performance and potential, as determined under the normal performance review and development process undertaken for all employees. The maximum number of DARs allocated per employee is capped by the Board.
Table 3 provides an overview of the 2014 PARs and DARs Plans.
The maximum LTI award for each Senior Executive is stated as a percentage of the Senior Executive’s total fixed remuneration. For the 2014 LTI allocation for Senior Executives, the Board based allocations on a maximum face value of 100% of fixed remuneration for PARs, with no DARs being issued to this group.
There are no voting or dividend rights attached to unvested PAR and DAR awards. Upon exercise of Award Rights, participants receive BOQ ordinary shares to which voting and dividend rights are attached. In the event of a change of control, all LTI awards will either remain on foot or vest on a pro rata basis or in full (depending on the circumstances).
Through its Securities Trading Policy, the Consolidated Entity has guidelines restricting Directors and Executives dealing in the Consolidated Entity’s securities. This policy addresses margin lending and hedging of risk associated with Directors’ and Executives’ ownership of the Consolidated Entity’s securities. All employees are prohibited from entering into hedging arrangements in relation to their unvested employee shares, securities or options.
The 2008 PARs tested in October 2011 did not vest at all, the 2009 PARs which were tested in October 2012 vested at 54%, and the 2010 PARs which were tested in October 2013 vested at 52%.
4.4.1 Vesting of LTI in FY2014
PARs and DARs that were granted under the LTI in prior years vested during the current financial year, in line with the relevant award rights plans. Details are shown below in section 6.
Table 3 Performance Award Rights (PARs) Deferred Award Rights (DARs)
Participants MD, Senior Executives and other identified key senior manag-ers.
Up to 2014, eligibility has included a broader employee group than PARs, which could include the MD and Senior Executives. From 2014 onwards, the MD and Senior Executives are no longer eligible to receive DARs.
Link between performance and award
PARs vest based on the Consolidated Entity’s TSR performance measured against a Peer Group over a 3 year period. TSR is a measure of the entire return a shareholder would derive from holding an entity’s securities over a period, taking into ac-count factors such as changes in the market value of the secu-rities and dividends paid over the period. The Board has relative TSR performance as a measure because it reflects the returns made to shareholders relative to other comparable securities and provides a meaningful reward for executives where the Company outperforms peers.The Peer Group consists of the S&P / ASX 200 companies, ex-cluding: • all entities in the resources sector • all real estate investment trusts• all entities in the energy and utilities sectors• telecommunications companies whose headquarters
are offshore
DARs are linked with continued employment and adherence to risk management principles with the intent on focussing em-ployees on the Consolidated Entity’s performance and potential. The vesting conditions for DARs include continued employment with the Consolidated Entity and meeting risk parameters.

ANNUAL REPORT 201418
(Continued) Year Ended 31 August 2014
REMUNERATION REPORT
4.4.1 Vesting of LTI in FY2014 (continued)
Table 3 Performance Award Rights (PARs) Deferred Award Rights (DARs)
Link between performance and award (continued)
Additionally, the Board may add or exclude such other companies as it considers appropriate. No such exclusions or inclusions have been made to this group since implementation of the scheme in 2008, other than to reflect companies moving in to, or out of, the ASX 200 or being delisted.
Vesting schedule One half of an employee’s PARs vest if the Consolidated Entity’s TSR performance over the three year holding period is in the top 50% of the Peer Group. All of the PARs vest if the Consolidated Entity’s TSR performance is in the top 25%. For TSR performance between those targets, a pro-rata of the PARs between one half and 100% would vest.None of the PARs vest if the Consolidated Entity’s TSR performance is in the bottom 50% of the Peer Group.
DARs granted during FY 2014 vest proportionately over 3 years in the ratio of 20% (at the end of Year 1), 30% (at the end of Year 2) and 50% (at the end of Year 3).
Performance period The performance period is three years.
Forfeiture - all participants excluding Senior Executive and the MD
If an employee ceases employment for serious misconduct involv-ing fraud or dishonesty, their PARs (whether exercisable or not) will lapse. If an employee resigns or is terminated for other reasons, vested PARs may, at the Board’s discretion, be exercised within 90 days of the employee ceasing employment. PARs which have not vested may, at the Board’s discretion, vest on a pro rata basis and become exercisable if the employment ceases for reasons including a transfer of employment to an Own-er-Managed Branch (“OMB”), retirement, redundancy, death, total and permanent disablement.
If an employee ceases employment for serious misconduct involv-ing fraud or dishonesty, their DARs (whether exercisable or not) will lapse. If an employee resigns or is terminated for other reasons, vested DARs may generally be exercised within 90 days of the employee ceasing employment. DARs which have not vested may, at the Board’s discretion, vest on a pro rata basis and become exercisable if the employment ceases for reasons including a transfer of employment to an OMB, retirement, redundancy, death, total and permanent disablement. Otherwise, unvested DARs will lapse on cessation of employment.
Forfeiture - Senior Executive and the MD
Upon termination, the unvested PARs held by the MD and CRO (CRO initial 2012 grant only) currently remain on-foot and vest ac-cording to the vesting schedule and subject to the performance hurdles. This ensures that these key executives remain aligned to, and have regard for, the long term financial performance of the Consolidated Entity post-employment.The rationale for allowing the MD and CRO to retain unvested PARs is that it promotes the long-term creation of shareholder value post-employment as all unvested PARs remain at risk and subject to previously agreed hurdle measures. Mr Grimshaw was not allo-cated any LTI in the 2014 offer.A similar arrangement in relation to the treatment of these hurdled equity rights is intended to be extended to all Senior Executives. It is the Board’s intention for this change to apply to both future PAR offers and, subject to any necessary approvals, existing unvested PARs. The Board has previously had discretion over the accelerated vesting of these equities, but instead of accelerated vesting on de-parture, some or all unvested PARs may remain on foot at the Boards discretion for their full vesting period and only vest in accordance with the plan rules and performance hurdles.

Bank of Queensland Limited and its Controlled Entities A.B.N. 32 009 656 740. 19
(Continued) Year Ended 31 August 2014
REMUNERATION REPORT
4.5 Application of discretion in the management of MD and Senior Executive Remuneration
Whilst the performance of the MD and Senior Executives is assessed against a range of performance measures, the Board and the HR & Remuneration Committee recognise that there are still a range of factors which must be taken into account when considering overall remuneration outcomes. The HR & Remuneration Committee may make discretionary adjustments to the outcomes for the MD and Senior Executives that may impact their remuneration negatively or positively. Through this process, remuneration outcomes have been adjusted both positively and negatively in the last three years.
Criteria used by the HR & Remuneration Committee to apply discretionary adjustments include:
• factors either not known or relevant at the beginning of a financial year, which can impact performance positively or negatively during the course of the financial year;
• the degree of stretch implicit in the measures and targets and the context in which the targets were set;
• whether the operating environment during the financial year was materially different than forecast;
• comparison with the performance of the Group relative to its competitors;
• the emergence of any major positive or negative risk or reputational issues;
• the quality of the financial result as shown by its composition and consistency;
• whether leadership behaviours and BOQ’s CANDO values have been consistently demonstrated throughout the year; and
• any other matters that the Board and the HR & Remuneration Committee deemed to be relevant and which are not outlined above.
At the end of the year the HR & Remuneration Committee reviews performance against objectives and applies any adjustments it considers appropriate. The HR & Remuneration Committee then recommends STI outcomes for the MD and each Senior Executive to the Board for approval, thereby ensuring the Board retains oversight of final awards.
5. Non-Executive Director remuneration
Remuneration Framework
Non-Executive Directors’ (“NEDs”) fees are set based upon the need to at-tract and retain individuals of appropriate calibre. Fees are reviewed annual-ly by the HR & Remuneration Committee having regard to advice provided by independent remuneration specialists to ensure market comparability.
The Chairman’s fees are determined independently to the fees of other di-rectors and are also based upon information provided by independent remu-neration specialists. The Chairman is not present at any discussions relating to the determination of his own remuneration.
In order to maintain independence and impartiality, NEDs do not receive any performance-related remuneration.
Fee Pool
NED fees are determined within an aggregate fee pool limit, which is periodically recommended for approval by shareholders. The maximum currently stands at $2,600,000 (inclusive of superannuation) and was approved by shareholders on 27 November 2013. The increase in the fee pool was made principally to allow the Board flexibility in dealing with changes to the size and composition of the Board as a means of ensuring that an appropriate mix of skills and experience is maintained. During the course of the 2014 year two new Directors were appointed to the Board, increasing the Board from eight members to ten.
The NED fees were increased during the 2014 financial year, in line with recommendations made by the independent remuneration specialist. The increase in NED fees in 2014 was the first fee increase since 2010. The fees for the 2014 financial year are set out in the table below.
Directors’ Annual Fees The current NEDs’ fees comprise:
Directors’ Annual Fees
01/09/13 - 30/06/14 Chairman /
Committee Chair $
01/09/13 - 30/06/14 Directors / Committee Members
$
01/07/14 - 31/08/14 Chairman /
Committee Chairs $
01/07/14 - 31/08/14 Directors / Committee Members
$
Fixed component of remuneration for Directors (1) - 135,000 - 150,000
Chairman (1) (2) 355,000 400,000
Additional remuneration is paid to Non-Executive Directors for committee work:
Audit Committee 45,000 17,500 45,000 22,500
Risk Committee 45,000 17,500 45,000 22,500
Nomination & Governance Committee 15,000 10,000 15,000 10,000
Human Resources and Remuneration Committee 25,000 10,000 35,000 17,500
Investment Committee (3) 2,250 1,500 2,250 2,250
Due Diligence Committee (3) 2,250 1,500 2,250 2,250
Information Technology Committee 20,000 10,000 35,000 17,500
(1) Committee members received one fee for serving on both the Bank and the subsidiary committees. Separate fees were received for serving on the Bank and St Andrew’s committees. (2) The Chairman receives no additional remuneration for involvement with Committees. (3) Per deliberative meeting.

ANNUAL REPORT 201420
(Continued) Year Ended 31 August 2014
REMUNERATION REPORT
5. Non-Executive Director remuneration (continued)
Remuneration Framework
Equity Participation
NEDs do not receive shares, award rights or share options.
Retirement Benefits
NEDs are no longer provided with retirement benefits apart from statutory superannuation. The accumulated value of NED retirement benefits was frozen effective from 31 August 2003. The balance of the accrued benefits was increased annually by an amount equivalent to the increase in CPI. The balance of the accrued benefits is nil at 31 August 2014 (2013: Nil).
6. Remuneration disclosuresThe MD and KMP receive a mix of cash, deferred equity and long term incentives which is tested over the following three years, depending on service and performance. To assist shareholders in understanding the actual amount of remuneration an executive received in the financial year in review, the Board has again included in the remuneration disclosures a table that provides a summary of the remuneration that the MD and KMP actually received in relation to the 2014 financial year.
6.1 Non-Statutory remuneration disclosureTables 4 and 5 on the following page set out:
• fixed remuneration (base remuneration, fringe benefits and employer superannuation contributions);
• variable cash remuneration (split between the portion of the 2014 STI paid in October 2014 and excluding the portion of the STI deferred until FY 2015 and FY 2016);
• Other benefits and termination benefits; and
• the value of previous years’ long term incentive awards that vested during the 2014 financial year.
These are non-statutory disclosures. The statutory disclosures for the year ended 31 August 2014 are provided in Tables 6 to 9 and differ to these non-statutory disclosures.
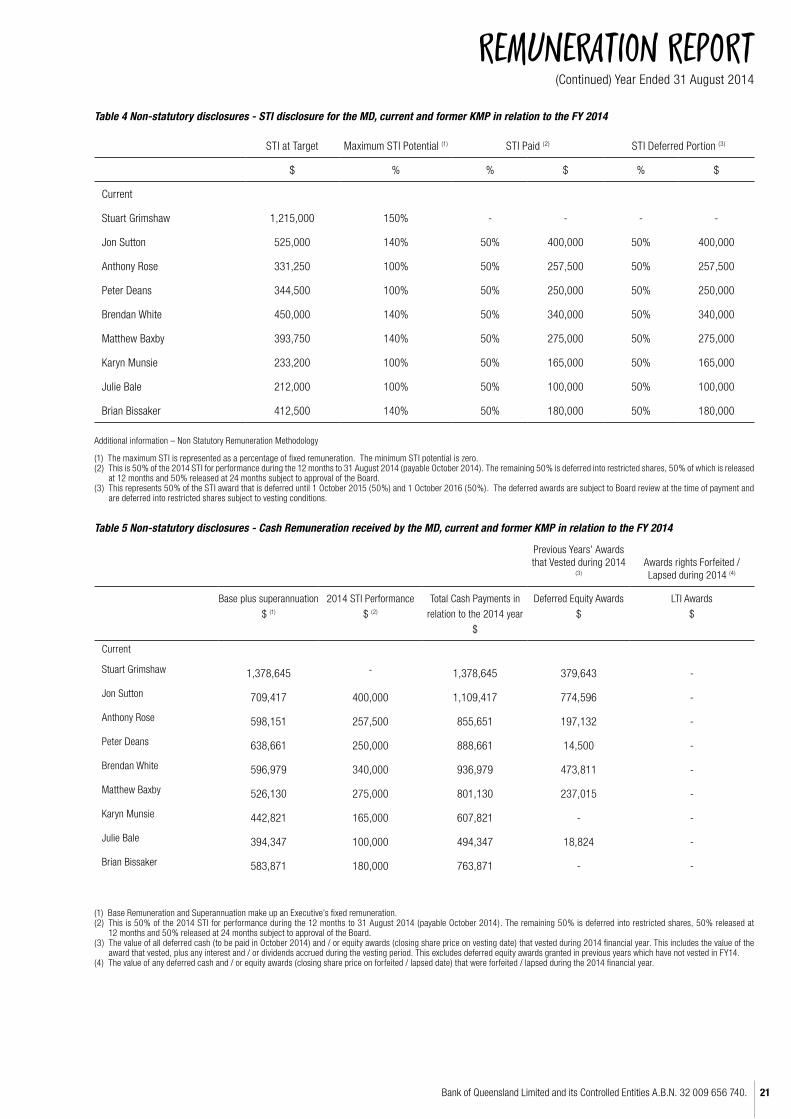
Bank of Queensland Limited and its Controlled Entities A.B.N. 32 009 656 740. 21
(Continued) Year Ended 31 August 2014
REMUNERATION REPORT
Table 4 Non-statutory disclosures - STI disclosure for the MD, current and former KMP in relation to the FY 2014
STI at Target Maximum STI Potential (1) STI Paid (2) STI Deferred Portion (3)
$ % % $ % $
Current
Stuart Grimshaw 1,215,000 150% - - - -
Jon Sutton 525,000 140% 50% 400,000 50% 400,000
Anthony Rose 331,250 100% 50% 257,500 50% 257,500
Peter Deans 344,500 100% 50% 250,000 50% 250,000
Brendan White 450,000 140% 50% 340,000 50% 340,000
Matthew Baxby 393,750 140% 50% 275,000 50% 275,000
Karyn Munsie 233,200 100% 50% 165,000 50% 165,000
Julie Bale 212,000 100% 50% 100,000 50% 100,000
Brian Bissaker 412,500 140% 50% 180,000 50% 180,000
Additional information – Non Statutory Remuneration Methodology
(1) The maximum STI is represented as a percentage of fixed remuneration. The minimum STI potential is zero.(2) This is 50% of the 2014 STI for performance during the 12 months to 31 August 2014 (payable October 2014). The remaining 50% is deferred into restricted shares, 50% of which is released
at 12 months and 50% released at 24 months subject to approval of the Board.(3) This represents 50% of the STI award that is deferred until 1 October 2015 (50%) and 1 October 2016 (50%). The deferred awards are subject to Board review at the time of payment and
are deferred into restricted shares subject to vesting conditions.
Table 5 Non-statutory disclosures - Cash Remuneration received by the MD, current and former KMP in relation to the FY 2014
Previous Years’ Awards that Vested during 2014
(3)
Awards rights Forfeited / Lapsed during 2014 (4)
Base plus superannuation
$ (1)
2014 STI Performance
$ (2)
Total Cash Payments in
relation to the 2014 year
$
Deferred Equity Awards
$
LTI Awards
$
Current
Stuart Grimshaw 1,378,645 - 1,378,645 379,643 -
Jon Sutton 709,417 400,000 1,109,417 774,596 -
Anthony Rose 598,151 257,500 855,651 197,132 -
Peter Deans 638,661 250,000 888,661 14,500 -
Brendan White 596,979 340,000 936,979 473,811 -
Matthew Baxby 526,130 275,000 801,130 237,015 -
Karyn Munsie 442,821 165,000 607,821 - -
Julie Bale 394,347 100,000 494,347 18,824 -
Brian Bissaker 583,871 180,000 763,871 - -
(1) Base Remuneration and Superannuation make up an Executive’s fixed remuneration.(2) This is 50% of the 2014 STI for performance during the 12 months to 31 August 2014 (payable October 2014). The remaining 50% is deferred into restricted shares, 50% released at
12 months and 50% released at 24 months subject to approval of the Board.(3) The value of all deferred cash (to be paid in October 2014) and / or equity awards (closing share price on vesting date) that vested during 2014 financial year. This includes the value of the
award that vested, plus any interest and / or dividends accrued during the vesting period. This excludes deferred equity awards granted in previous years which have not vested in FY14.(4) The value of any deferred cash and / or equity awards (closing share price on forfeited / lapsed date) that were forfeited / lapsed during the 2014 financial year.

ANNUAL REPORT 201422
(Continued) Year Ended 31 August 2014
REMUNERATION REPORT
6.2 Statutory disclosures
The following tables include details of the nature and amount of each major element of the remuneration of each Director and Senior Executive of the Consolidated Entity, calculated in accordance with accounting standards. The amounts shown in Table 6 to Table 9 below may differ from those shown above in Table 4 and Table 5.
Table 6 Director’s Remuneration
Details of the nature and amount of each major element of the remuneration of each Director of the Consolidated Entity are as outlined in the table below.
Short-termPost-employment
(3)
Other long-term
(4) Termination benefits Share based payments Total
S300A (1)(e)(i) Proportion of remuneration performance
related
S300A (1)(e)(vi) Value of options
and rights as proportion of remuneration
Salary and fees $
STI at risk $
Non-Monetary benefits (1)
$Other cash benefits (2)
$Total
$ $ $ $Rights(5)
$Shares and units
$ $ % %
Executive Director
Stuart Grimshaw Managing Director
2014 1,360,784 - 64,557 - 1,425,341 17,861 7,511 - 1,431,196 (6) 292,969 3,174,878 54% 45%
2013 1,276,857 703,125 79,807 - 2,059,789 16,607 3,389 - 526,996 292,969 2,899,750 53% 18%
Non-Executive Directors
Steve Crane2014 209,750 - - - 209,750 17,943 - - - - 227,693 - -
2013 161,379 - - - 161,379 14,447 - - - - 175,826 - -
Roger Davis2014 362,500 - - - 362,500 17,717 - - - - 380,217 - -
2013 250,429 - - - 250,429 19,198 - - - - 269,627 - -
Carmel Gray2014 192,500 - - - 192,500 17,943 - - - - 210,443 - -
2013 194,410 - - - 194,410 16,698 - - - - 211,108 - -
Michelle Tredenick2014 189,583 - - - 189,583 17,630 - - - - 207,213 - -
2013 187,000 - - - 187,000 16,539 - - - - 203,539 - -
David Willis2014 213,333 - - - 213,333 17,943 - - - - 231,276 - -
2013 172,717 - - - 172,717 15,542 - - - - 188,259 - -
Richard Haire 2014 219,583 - - - 219,583 17,943 - - - - 237,526 - -
2013 214,875 - - - 214,875 16,806 - - - - 231,681 - -
Neil Berkett 2014 177,875 - - - 177,875 12,781 - - - - 190,656 - -
2013 14,719 - - - 14,719 1,131 - - - - 15,850 - -
Margaret Seale 2014 99.353 - - - 99,353 9,267 - - - - 108,620 - -
Bruce Carter 2014 95,083 - - - 95,083 8,876 - - - - 103,959 - -
(1) The Bank has also paid insurance premiums in respect of Directors’ and Officers’ Liability Insurance which is not reflected in the above table as there is no appropriate basis for allocation.(2) This includes accrued annual leave paid out on retirement.(3) This includes superannuation benefits and interest which is accrued at the CPI rate on Director retirement benefits which was frozen effective from 31 August 2003.(4) Comprises long service leave accrued or utilised during the financial year.(5) The fair value of the rights is calculated at the date of grant using an industry accepted option pricing model and allocated to each reporting period evenly over the period from grant date to vesting date. The value disclosed is the portion of the fair value of the rights allocated to this period.(6) Representing the unamortised balance that Mr Grimshaw retains under his employment contract.

Bank of Queensland Limited and its Controlled Entities A.B.N. 32 009 656 740. 23
(Continued) Year Ended 31 August 2014
REMUNERATION REPORT
Short-termPost-employment
(3)
Other long-term
(4) Termination benefits Share based payments Total
S300A (1)(e)(i) Proportion of remuneration performance
related
S300A (1)(e)(vi) Value of options
and rights as proportion of remuneration
Salary and fees $
STI at risk $
Non-Monetary benefits (1)
$Other cash benefits (2)
$Total
$ $ $ $Rights(5)
$Shares and units
$ $ % %
Executive Director
Stuart Grimshaw Managing Director
2014 1,360,784 - 64,557 - 1,425,341 17,861 7,511 - 1,431,196 (6) 292,969 3,174,878 54% 45%
2013 1,276,857 703,125 79,807 - 2,059,789 16,607 3,389 - 526,996 292,969 2,899,750 53% 18%
Non-Executive Directors
Steve Crane2014 209,750 - - - 209,750 17,943 - - - - 227,693 - -
2013 161,379 - - - 161,379 14,447 - - - - 175,826 - -
Roger Davis2014 362,500 - - - 362,500 17,717 - - - - 380,217 - -
2013 250,429 - - - 250,429 19,198 - - - - 269,627 - -
Carmel Gray2014 192,500 - - - 192,500 17,943 - - - - 210,443 - -
2013 194,410 - - - 194,410 16,698 - - - - 211,108 - -
Michelle Tredenick2014 189,583 - - - 189,583 17,630 - - - - 207,213 - -
2013 187,000 - - - 187,000 16,539 - - - - 203,539 - -
David Willis2014 213,333 - - - 213,333 17,943 - - - - 231,276 - -
2013 172,717 - - - 172,717 15,542 - - - - 188,259 - -
Richard Haire 2014 219,583 - - - 219,583 17,943 - - - - 237,526 - -
2013 214,875 - - - 214,875 16,806 - - - - 231,681 - -
Neil Berkett 2014 177,875 - - - 177,875 12,781 - - - - 190,656 - -
2013 14,719 - - - 14,719 1,131 - - - - 15,850 - -
Margaret Seale 2014 99.353 - - - 99,353 9,267 - - - - 108,620 - -
Bruce Carter 2014 95,083 - - - 95,083 8,876 - - - - 103,959 - -
(1) The Bank has also paid insurance premiums in respect of Directors’ and Officers’ Liability Insurance which is not reflected in the above table as there is no appropriate basis for allocation.(2) This includes accrued annual leave paid out on retirement.(3) This includes superannuation benefits and interest which is accrued at the CPI rate on Director retirement benefits which was frozen effective from 31 August 2003.(4) Comprises long service leave accrued or utilised during the financial year.(5) The fair value of the rights is calculated at the date of grant using an industry accepted option pricing model and allocated to each reporting period evenly over the period from grant date to vesting date. The value disclosed is the portion of the fair value of the rights allocated to this period.(6) Representing the unamortised balance that Mr Grimshaw retains under his employment contract.

ANNUAL REPORT 201424
(Continued) Year Ended 31 August 2014
REMUNERATION REPORT
Table 7 Senior Executive Remuneration
Details of the nature and amount of each major element of the remuneration of each Senior Executive of the Consolidated Entity are as outlined in the table below.
Short-term Post-employment (3)
Other long-term
(4) Termination benefits Share based payments Total
S300A (1)(e)(i) Proportion of remuneration performance
related
S300A (1)(e)(vi) Value of options
and rights as proportion of remuneration
Salary and fees $
STI at risk (1) $
Other cash benefits (2)
$
Total
$ $
$
$
Rights(5)
$
Shares and units
$ $
%
%
Executives
Jon Sutton2014 691,556 400,000 49,808 1,141,364 17,861 3,126 - 393,782 366,915 1,923,048 48% 20%
2013 691,410 367,500 49,808 1,108,718 16,607 1,536 - 435,793 673,207 2,235,861 25% 19%
Anthony Rose2014 580,290 257,500 - 837,790 17,861 2,755 - 330,779 196,354 1,385,539 45% 24%
2013 599,604 213,750 - 813,354 16,607 1,350 - 301,402 171,416 1,304,129 26% 23%
Peter Deans2014 620,800 250,000 49,808 920,608 17,861 3,241 - 237,092 192,063 1,370,865 44% 17%
2013 592,421 210,950 49,808 853,179 16,607 1,423 - 106,442 87,896 1,065,547 31% 10%
Brendan White2014 579,118 340,000 - 919,118 17,861 2,831 - 345,428 261,396 1,546,634 50% 22%
2013 583,491 287,350 - 870,841 16,607 1,415 - 407,970 206,050 1,502,883 29% 27%
Matthew Baxby2014 508,269 275,000 - 783,269 17,861 2,393 - 298,028 217,896 1,319,447 48% 23%
2013 512,627 247,950 - 760,577 16,607 1,186 - 289,289 176,367 1,244,025 31% 23%
Karyn Munsie 2014 424,960 165,000 - 589,960 17,861 1,266 - 94,421 129,015 832,523 47% 11%
2013 349,022 128,900 - 477,922 12,758 509 - - 45,199 536,388 32% -
Julie Bale 2014 376,486 100,000 - 476,486 17,861 1,176 - 91,891 80,277 667,691 38% 14%
2013 238,396 79,200 - 317,596 10,991 361 - 14,496 25,740 369,184 28% 4%
Brian Bissaker 2014 566,010 180,000 - 746,010 17,861 1,404 - 121,662 110,917 997,854 41% 12%
2013 184,860 60,950 - 245,810 5,438 277 - 5,155 11,972 268,652 27% 2%
(1) STI at risk reflects 50% of the amounts paid or accrued in respect of the year ended 31 August 2014. Refer to Section 4.3 “Executive remuneration framework” for a discussion of the Bank’s short-term incentive arrangements.(2) This includes accrued annual leave paid out on retirement and other cash benefits.(3) This includes superannuation and salary sacrificed benefits.(4) Comprises long service leave accrued or utilised during the financial year.(5) The fair value of the rights is calculated at the date of grant using an industry accepted option pricing model and allocated to each reporting period evenly over the period from grant date to vesting date. The value disclosed is the portion of the fair value of the options and rights allocated to this reporting period.

Bank of Queensland Limited and its Controlled Entities A.B.N. 32 009 656 740. 25
(Continued) Year Ended 31 August 2014
REMUNERATION REPORT
Short-term Post-employment (3)
Other long-term
(4) Termination benefits Share based payments Total
S300A (1)(e)(i) Proportion of remuneration performance
related
S300A (1)(e)(vi) Value of options
and rights as proportion of remuneration
Salary and fees $
STI at risk (1) $
Other cash benefits (2)
$
Total
$ $
$
$
Rights(5)
$
Shares and units
$ $
%
%
Executives
Jon Sutton2014 691,556 400,000 49,808 1,141,364 17,861 3,126 - 393,782 366,915 1,923,048 48% 20%
2013 691,410 367,500 49,808 1,108,718 16,607 1,536 - 435,793 673,207 2,235,861 25% 19%
Anthony Rose2014 580,290 257,500 - 837,790 17,861 2,755 - 330,779 196,354 1,385,539 45% 24%
2013 599,604 213,750 - 813,354 16,607 1,350 - 301,402 171,416 1,304,129 26% 23%
Peter Deans2014 620,800 250,000 49,808 920,608 17,861 3,241 - 237,092 192,063 1,370,865 44% 17%
2013 592,421 210,950 49,808 853,179 16,607 1,423 - 106,442 87,896 1,065,547 31% 10%
Brendan White2014 579,118 340,000 - 919,118 17,861 2,831 - 345,428 261,396 1,546,634 50% 22%
2013 583,491 287,350 - 870,841 16,607 1,415 - 407,970 206,050 1,502,883 29% 27%
Matthew Baxby2014 508,269 275,000 - 783,269 17,861 2,393 - 298,028 217,896 1,319,447 48% 23%
2013 512,627 247,950 - 760,577 16,607 1,186 - 289,289 176,367 1,244,025 31% 23%
Karyn Munsie 2014 424,960 165,000 - 589,960 17,861 1,266 - 94,421 129,015 832,523 47% 11%
2013 349,022 128,900 - 477,922 12,758 509 - - 45,199 536,388 32% -
Julie Bale 2014 376,486 100,000 - 476,486 17,861 1,176 - 91,891 80,277 667,691 38% 14%
2013 238,396 79,200 - 317,596 10,991 361 - 14,496 25,740 369,184 28% 4%
Brian Bissaker 2014 566,010 180,000 - 746,010 17,861 1,404 - 121,662 110,917 997,854 41% 12%
2013 184,860 60,950 - 245,810 5,438 277 - 5,155 11,972 268,652 27% 2%
(1) STI at risk reflects 50% of the amounts paid or accrued in respect of the year ended 31 August 2014. Refer to Section 4.3 “Executive remuneration framework” for a discussion of the Bank’s short-term incentive arrangements.(2) This includes accrued annual leave paid out on retirement and other cash benefits.(3) This includes superannuation and salary sacrificed benefits.(4) Comprises long service leave accrued or utilised during the financial year.(5) The fair value of the rights is calculated at the date of grant using an industry accepted option pricing model and allocated to each reporting period evenly over the period from grant date to vesting date. The value disclosed is the portion of the fair value of the options and rights allocated to this reporting period.
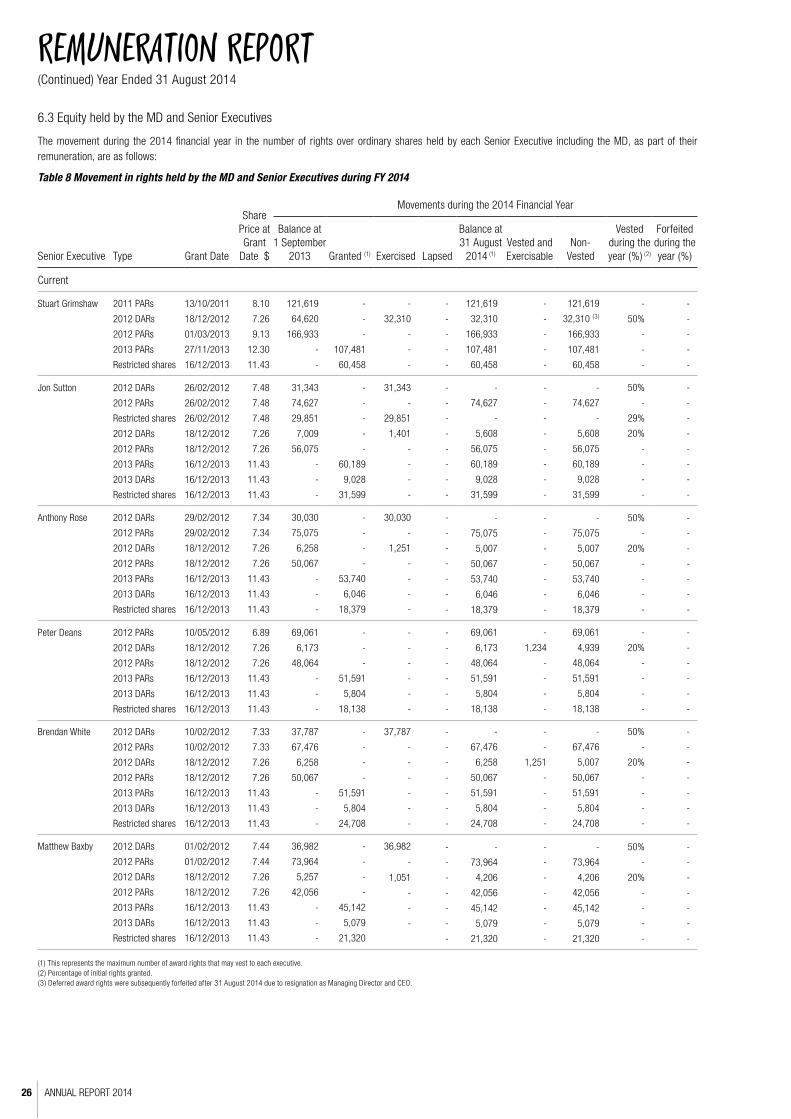
ANNUAL REPORT 201426
REMUNERATION REPORT
6.3 Equity held by the MD and Senior Executives
The movement during the 2014 financial year in the number of rights over ordinary shares held by each Senior Executive including the MD, as part of their remuneration, are as follows:
Table 8 Movement in rights held by the MD and Senior Executives during FY 2014
Senior Executive Type Grant Date
Share Price at Grant
Date $
Movements during the 2014 Financial Year
Balance at 1 September
2013 Granted (1) Exercised Lapsed
Balance at 31 August
2014 (1)
Vested and Exercisable
Non- Vested
Vested during the year (%) (2)
Forfeited during the year (%)
Current
Stuart Grimshaw 2011 PARs
2012 DARs
2012 PARs
2013 PARs
Restricted shares
13/10/2011
18/12/2012
01/03/2013
27/11/2013
16/12/2013
8.10
7.26
9.13
12.30
11.43
121,619
64,620
166,933
-
-
-
-
-
107,481
60,458
-
32,310
-
-
-
-
-
-
-
-
121,619
32,310
166,933
107,481
60,458
-
-
-
-
-
121,619
32,310 (3)
166,933
107,481
60,458
-
50%
-
-
-
-
-
-
-
-
Jon Sutton 2012 DARs
2012 PARs
Restricted shares
2012 DARs
2012 PARs
2013 PARs
2013 DARs
Restricted shares
26/02/2012
26/02/2012
26/02/2012
18/12/2012
18/12/2012
16/12/2013
16/12/2013
16/12/2013
7.48
7.48
7.48
7.26
7.26
11.43
11.43
11.43
31,343
74,627
29,851
7,009
56,075
-
-
-
-
-
-
-
-
60,189
9,028
31,599
31,343
-
29,851
1,401
-
-
-
-
-
-
-
-
-
-
-
-
-
74,627
-
5,608
56,075
60,189
9,028
31,599
-
-
-
-
-
-
-
-
-
74,627
-
5,608
56,075
60,189
9,028
31,599
50%
-
29%
20%
-
-
-
-
-
-
-
-
-
-
-
-
Anthony Rose 2012 DARs
2012 PARs
2012 DARs
2012 PARs
2013 PARs
2013 DARs
Restricted shares
29/02/2012
29/02/2012
18/12/2012
18/12/2012
16/12/2013
16/12/2013
16/12/2013
7.34
7.34
7.26
7.26
11.43
11.43
11.43
30,030
75,075
6,258
50,067
-
-
-
-
-
-
-
53,740
6,046
18,379
30,030
-
1,251
-
-
-
-
-
-
-
-
-
-
-
-
75,075
5,007
50,067
53,740
6,046
18,379
-
-
-
-
-
-
-
-
75,075
5,007
50,067
53,740
6,046
18,379
50%
-
20%
-
-
-
-
-
-
-
-
-
-
-
Peter Deans 2012 PARs
2012 DARs
2012 PARs
2013 PARs
2013 DARs
Restricted shares
10/05/2012
18/12/2012
18/12/2012
16/12/2013
16/12/2013
16/12/2013
6.89
7.26
7.26
11.43
11.43
11.43
69,061
6,173
48,064
-
-
-
-
-
-
51,591
5,804
18,138
-
-
-
-
-
-
-
-
-
-
-
-
69,061
6,173
48,064
51,591
5,804
18,138
-
1,234
-
-
-
-
69,061
4,939
48,064
51,591
5,804
18,138
-
20%
-
-
-
-
-
-
-
-
-
-
Brendan White 2012 DARs
2012 PARs
2012 DARs
2012 PARs
2013 PARs
2013 DARs
Restricted shares
10/02/2012
10/02/2012
18/12/2012
18/12/2012
16/12/2013
16/12/2013
16/12/2013
7.33
7.33
7.26
7.26
11.43
11.43
11.43
37,787
67,476
6,258
50,067
-
-
-
-
-
-
-
51,591
5,804
24,708
37,787
-
-
-
-
-
-
-
-
-
-
-
-
-
-
67,476
6,258
50,067
51,591
5,804
24,708
-
-
1,251
-
-
-
-
-
67,476
5,007
50,067
51,591
5,804
24,708
50%
-
20%
-
-
-
-
-
-
-
-
-
-
-
Matthew Baxby 2012 DARs
2012 PARs
2012 DARs
2012 PARs
2013 PARs
2013 DARs
Restricted shares
01/02/2012
01/02/2012
18/12/2012
18/12/2012
16/12/2013
16/12/2013
16/12/2013
7.44
7.44
7.26
7.26
11.43
11.43
11.43
36,982
73,964
5,257
42,056
-
-
-
-
-
-
-
45,142
5,079
21,320
36,982
-
1,051
-
-
-
-
-
-
-
-
-
-
-
73,964
4,206
42,056
45,142
5,079
21,320
-
-
-
-
-
-
-
-
73,964
4,206
42,056
45,142
5,079
21,320
50%
-
20%
-
-
-
-
-
-
-
-
-
-
-
(1) This represents the maximum number of award rights that may vest to each executive.(2) Percentage of initial rights granted.(3) Deferred award rights were subsequently forfeited after 31 August 2014 due to resignation as Managing Director and CEO.
(Continued) Year Ended 31 August 2014

Bank of Queensland Limited and its Controlled Entities A.B.N. 32 009 656 740. 27
REMUNERATION REPORT
6.3 Equity held by the MD and Senior Executives (continued)
Table 8 Movement in rights held by the MD and Senior Executives during FY 2014 (continued)
Senior Executive Type Grant Date
Share
Price at Grant
Date $
Movements during the 2014 Financial Year
Balance at 1 September
2013 Granted (1) Exercised Lapsed
Balance at 31 August
2014Vested and Exercisable
Non- Vested
Vested during the year (%) (2)
Forfeited during the year (%)
Current
Julie Bale 2013 May DARs
2013 PARs
2013 DARs
Restricted shares
18/12/2012
16/12/2013
16/12/2013
16/12/2013
7.26
11.43
11.43
11.43
8,010
-
-
-
-
30,095
3,386
6,810
1,602
-
-
-
-
-
-
-
6,408
30,095
3,386
6,810
-
-
-
-
6,408
30,095
3,386
6,810
20%
-
-
-
-
-
-
-
Karyn Munsie 2013 PARs
2013 DARs
Restricted shares
16/12/2013
16/12/2013
16/12/2013
11.43
11.43
11.43
37,833
5,675
11,083
-
-
-
-
-
-
37,833
5,675
11,083
-
-
-
37,833
5,675
11,083
-
-
-
-
-
-
Brian Bissaker 2013 May PARs
2013 PARs
2013 DARs
Restricted shares
14/05/2013
16/12/2013
16/12/2013
16/12/2013
9.68
11.43
11.43
11.43
31,748
-
-
-
-
47,291
3,547
5,241
-
-
-
-
-
-
-
-
31,748
47,291
3,547
5,241
-
-
-
-
31,748
47,291
3,547
5,241
-
-
-
-
-
-
-
-
(1) This represents the maximum number of award rights that may vest to each executive.(2) Percentage of initial rights granted.
(Continued) Year Ended 31 August 2014

ANNUAL REPORT 201428
(Continued) Year Ended 31 August 2014
REMUNERATION REPORT
6.3 Equity held by the MD and Senior Executives (continued)
The table below shows the total value of any rights that were granted, exercised or lapsed to the MD and Senior Executives.
Table 9 Value of rights held by the MD and Senior Executives during FY 2014
Senior Executive Grant Grant Date
Fair value per right at grant
date $
Value at grant date
$ (1) Exercise Date
Exercise price $ (2)
Value at Exercise
Date
$ (3)
Expiry / Lapsing
Date
Value at Expiry / Lapsing
Date
$
Current
Stuart Grimshaw 2011 PARs2012 DARs (4)
2012 PARs2013 PARsRestricted shares
13/10/201118/12/2012
01/03/201327/11/2013 16/12/2013
5.36 6.55
2.73 6.07
11.43
651,878 423,261
455,727 652,410 691,035
- 24/12/2013 30/12/2013
- - -
- 12.10 12.18
- - -
- 388,652
2,314 - - -
13/10/201618/12/2017 18/12/201718/12/201727/11/2018 16/12/2015
- - - - - -
Jon Sutton 2012 DARs
2012 PARsRestricted shares
2012 DARs2012 PARs2013 PARs2013 DARsRestricted shares
26/02/2012
26/02/201226/02/2012
18/12/201218/12/201216/12/201316/12/2013 16/12/2013
6.60
5.18 6.70
6.20 1.74 (4)
7.6310.38 11.43
413,734
386,568 700,000
43,456 97,571
459,242 93,711
361,177
01/05/201307/05/2014
- 05/01/201307/07/2013 05/01/201405/02/2014
-- - -
9.9311.95
- 7.618.88
12.2310.84
-- - -
311,246374,549
- 227,166397,611365,078
15,187 -- - -
05/05/201705/05/201716/12/201709/01/201409/01/201409/01/201418/12/201718/12/201716/12/2018 16/12/2018 16/12/2015
-- --- - - - --
Anthony Rose 2012 DARs
2012 PARs2012 DARs2012 PARs2013 PARs2013 DARsRestricted shares
29/02/2012
29/02/201218/12/201218/12/201216/12/201316/12/2013 16/12/2013
6.60
5.18 6.20
1.74 (5)
7.63 10.38 11.43
198,198
388,888 38,800 87,117
410,036 62,757
210,072
30/10/201325/07/2014
- 15/01/2014
--- -
11.9612.57
- 11.89
--- -
179,579188,739
- 14,874
--- -
05/05/201705/05/201716/12/201718/12/201718/12/201716/12/2018 16/12/2018 16/12/2015
--- - -- - -
Peter Deans 2012 PARs2012 DARs2012 PARs2013 PARs2013 DARsRestricted shares
10/05/201218/12/201218/12/201216/12/201316/12/2013 16/12/2013
3.70 6.20
1.74 (5)
7.63 10.38 11.43
255,526 38,273 83,631
393,639 60,246
207,317
-- -- - -
-- -- - -
-- -- - -
16/12/201718/12/201718/12/201716/12/201816/12/2018 16/12/2015
-- - -- -
Brendan White 2012 DARs
2012 PARs2012 DARs2012 PARs2013 PARs 2013 DARsRestricted shares
10/02/2012
10/02/201218/12/201218/12/201216/12/201316/12/2013 16/12/2013
6.60
5.18 6.20
1.74 (5)
7.6310.38 11.43
498,788
349,526 38,800 87,117
393,63960,246
282,412
01/05/201303/06/2014
-- -- - -
9.9312.00
-- -- - -
375,225453,444
-- -- - -
05/05/201705/05/201716/12/201718/12/201718/12/201716/12/2018
16/12/201816/12/2015
---- -- - -
(1) Represents rights held at 1 September 2013 or granted during the 2014 financial year.(2) Closing share price on exercise of rights have a nil exercise price.(3) Closing share price on exercise date multiplied by the number of rights exercised during the year.(4) Deferred award rights were subsequently forfeited after 31 August 2014 due to resignation as Managing Director and CEO. (5) The fair value as based on a valuation period from 18 October 2012 to grant date. The Bank’s total shareholder return over this period was below the peer group, decreasing the vesting probability and reducing the fair
value calculation.

Bank of Queensland Limited and its Controlled Entities A.B.N. 32 009 656 740. 29
(Continued) Year Ended 31 August 2014
REMUNERATION REPORT
6.3 Equity held by the MD and Senior Executives (continued)
Table 9 Value of rights held by the MD and Senior Executives during FY 2014 (continued)
Senior Executive Grant Grant Date
Fair value per right at grant
date $
Value at grant date
$ (1) Exercise Date
Exercise price $ (2)
Value at Exercise
Date
$ (3)
Expiry / Lapsing
Date
Value at Expiry / Lapsing
Date
$
Current
Matthew Baxby 2012 DARs
2012 PARs2012 DARs2012 PARs2013 PARs 2013 DARsRestricted shares
01/02/2012
01/02/201218/12/201218/12/201216/12/201316/12/2013 16/12/2013
6.60
5.18 6.20
1.74 (4) 7.63
10.3811.43
244,081
383,134 32,593 73,177
344,43352,720
243,688
30/10/201309/07/2013
- 09/07/2014
--- -
11.9612.15
- 12.15
--- -
221,152224,666
- 12,770
--- -
05/05/201705/05/201716/12/201718/12/201718/12/201716/12/2018
16/12/2018 16/12/2015
--- - --- -
Julie Bale 2012 DARs2013 PARs 2013 DARsRestricted shares
18/12/201216/12/201316/12/2013 16/12/2013
6.20 7.63
10.38 11.43
49,662 229,625
35,147 77,838
17/01/2014-- -
12.28-- -
19,673 ---
18/12/201716/12/2018
16/12/2018 16/12/2015
--- -
Karyn Munsie 2013 PARs2013 DARsRestricted shares
16/12/201316/12/210316/12/2013
7.6310.3811.43
288,66658,907
126,679
---
---
---
16/12/201816/12/201816/12/2015
---
Brian Bissaker 2013 May PARs2013 PARs2013 DARsRestricted shares
14/05/201316/12/201316/12/2013 16/12/2013
2.397.63
10.38 11.43
75,878360,830 36,818 59,905
--- -
--- -
--- -
18/12/201816/12/2018
16/12/2018 16/12/2015
--- -
(1) Represents rights held at 1 September 2013 or granted during the 2014 financial year.(2) Closing share price on exercise of rights have a nil exercise price.(3) Closing share price on exercise date multiplied by the number of rights exercised during the year.(4) The fair value as based on a valuation period from 18 October 2012 to grant date. The Bank’s total shareholder return over this period was below the peer group, decreasing the vesting probability and reducing the fair
value calculation.

ANNUAL REPORT 201430
(Continued) Year Ended 31 August 2014
6.4 Equity Instruments - holdings and movements
The movement during the reporting period in the number of rights over ordinary shares in Bank of Queensland Limited held directly, indirectly or beneficially, by Senior Executives, including their personally related entities, is as follows:
Managing Director and Award rights
All Award rights refer to rights over ordinary shares of Bank of Queensland Limited, which are exercisable on a one-for-one basis. During the reporting period, the following rights over ordinary shares were granted to executives under Award Rights:
Held at 1 September
2013Granted as
remuneration Exercised(1) Forfeited
Held at 31 August
2014
Vested during the
year
Vested and exercisable at
31 August 2014
Executive Director
Stuart Grimshaw - DARs 64,620 - 32,310 - 32,310 (2) 32,310 -
- PARs 288,552 107,481 - - 396,033 - -
- Restricted shares - 60,458 - - 60,458 - -
Executives
Anthony Rose - DARs 36,288 6,046 31,281 - 11,053 16,266 -
- PARs 125,142 53,740 - - 178,882 - -
- Restricted shares - 18,379 - - 18,379 - -
Peter Deans - DARs 6,173 5,804 - - 11,977 1,234 1,234
- PARs 117,125 51,591 - - 168,716 - -
- Restricted shares - 18,138 - - 18,138 - -
Brendan White - DARs 44,045 5,804 37,787 - 12,062 39,038 1,251
- PARs 117,543 51,591 - - 169,134 - -
- Restricted shares - 24,708 - - 24,708 - -
Matthew Baxby - DARs 42,239 5,079 38,033 - 9,285 19,542 -
- PARs 116,020 45,142 - - 124,180 - -
- Restricted shares - 21,320 - - 21,230 - -
Jon Sutton - DARs 38,352 9,028 32,744 - 14,636 32,744 -
- PARs 130,702 60,189 - - 190,891 - -
- Restricted shares 29,851 31,599 29,851 - 31,599 29,851 -
Julie Bale - DARs 8,010 3,386 1,602 - 9,794 1,602 -
- PARs - 30,095 - - 30,095 - -
- Restricted shares - 6,810 - - 6,810 - -
Karyn Munsie - DARs - 5,675 - - 5,675 - -
- PARs - 37,833 - - 37,833 - -
- Restricted shares - 11,083 - - 11,083 - -
Brian Bissaker - DARs - 3,547 - - 3,547 - -
- PARs 31,748 47,291 - - 79,039 - -
- Restricted shares - 5,241 - - 5,241 - -
(1) Includes award rights vested during the prior financial year.
(2) Deferred award rights were subsequently forfeited after 31 August 2014 due to resignation as Managing Director and CEO.
The vesting of PARs is conditional on the Consolidated Entity’s TSR performance measured against a Peer Group over a 2 to 3 year period.
No rights held by Senior Executives are vested but not exercisable at 31 August 2014.
REMUNERATION REPORT

Bank of Queensland Limited and its Controlled Entities A.B.N. 32 009 656 740. 31
(Continued) Year Ended 31 August 2014
6.4. Equity Instruments - holdings and movements (continued)
Movement in shares
The number of shares held directly, indirectly or beneficially by each Director or Senior Executive is as follows:
Ordinary shares
Held at 1 September
2013Purchases /
(Sales)
Received on exercise of award rights / restricted
shares
Held at 31 August
2014
Executive Director
Stuart Grimshaw 3,506 (32,405) 32,310 3,411
Directors
Steve Crane 25,678 2,964 - 28,642
Roger Davis 15,235 2,046 - 17,281
Carmel Gray 10,946 1,263 - 12,209
Michelle Tredenick 2,433 8,202 - 10,635
David Willis 1,512 258 - 1,770
Richard Haire 4,000 347 - 4,347
Neil Berkett 10,600 12,665 - 23,265
Margaret Seale - 9,543 - 9,543
Bruce Carter - 6,854 - 6,854
Executive
Jon Sutton 76,120 (138,715) 62,595 -
Anthony Rose 30,030 (26,032) 31,281 35,279
Peter Deans - 2,093 - 2,093
Brendan White 3,273 (37,730) 37,787 3,330
Matt Baxby 29,586 (29,586) 38,033 38,033
Karyn Munsie - 1,279 - 1,279
Julie Bale - (1,602) 1,602 -
REMUNERATION REPORT
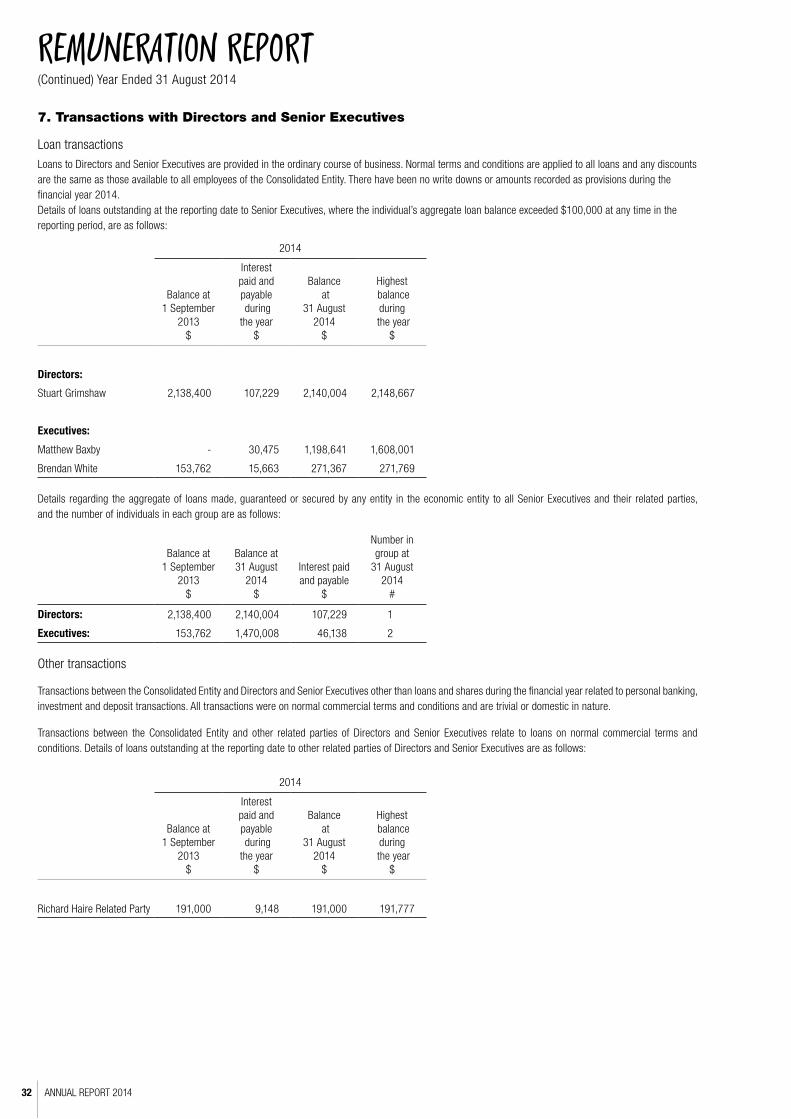
ANNUAL REPORT 201432
(Continued) Year Ended 31 August 2014
REMUNERATION REPORT
7. Transactions with Directors and Senior Executives
Loan transactions
Loans to Directors and Senior Executives are provided in the ordinary course of business. Normal terms and conditions are applied to all loans and any discounts are the same as those available to all employees of the Consolidated Entity. There have been no write downs or amounts recorded as provisions during the financial year 2014.Details of loans outstanding at the reporting date to Senior Executives, where the individual’s aggregate loan balance exceeded $100,000 at any time in the reporting period, are as follows:
2014
Balance at 1 September
2013$
Interest paid and payable during the year
$
Balance at
31 August 2014
$
Highest balance during
the year$
Directors:
Stuart Grimshaw 2,138,400 107,229 2,140,004 2,148,667
Executives:
Matthew Baxby - 30,475 1,198,641 1,608,001
Brendan White 153,762 15,663 271,367 271,769
Details regarding the aggregate of loans made, guaranteed or secured by any entity in the economic entity to all Senior Executives and their related parties, and the number of individuals in each group are as follows:
Balance at 1 September
2013$
Balance at 31 August
2014$
Interest paid and payable
$
Number in group at
31 August 2014
#
Directors: 2,138,400 2,140,004 107,229 1
Executives: 153,762 1,470,008 46,138 2
Other transactions
Transactions between the Consolidated Entity and Directors and Senior Executives other than loans and shares during the financial year related to personal banking, investment and deposit transactions. All transactions were on normal commercial terms and conditions and are trivial or domestic in nature.
Transactions between the Consolidated Entity and other related parties of Directors and Senior Executives relate to loans on normal commercial terms and conditions. Details of loans outstanding at the reporting date to other related parties of Directors and Senior Executives are as follows:
2014
Balance at 1 September
2013$
Interest paid and payable during the year
$
Balance at
31 August 2014
$
Highest balance during
the year$
Richard Haire Related Party 191,000 9,148 191,000 191,777
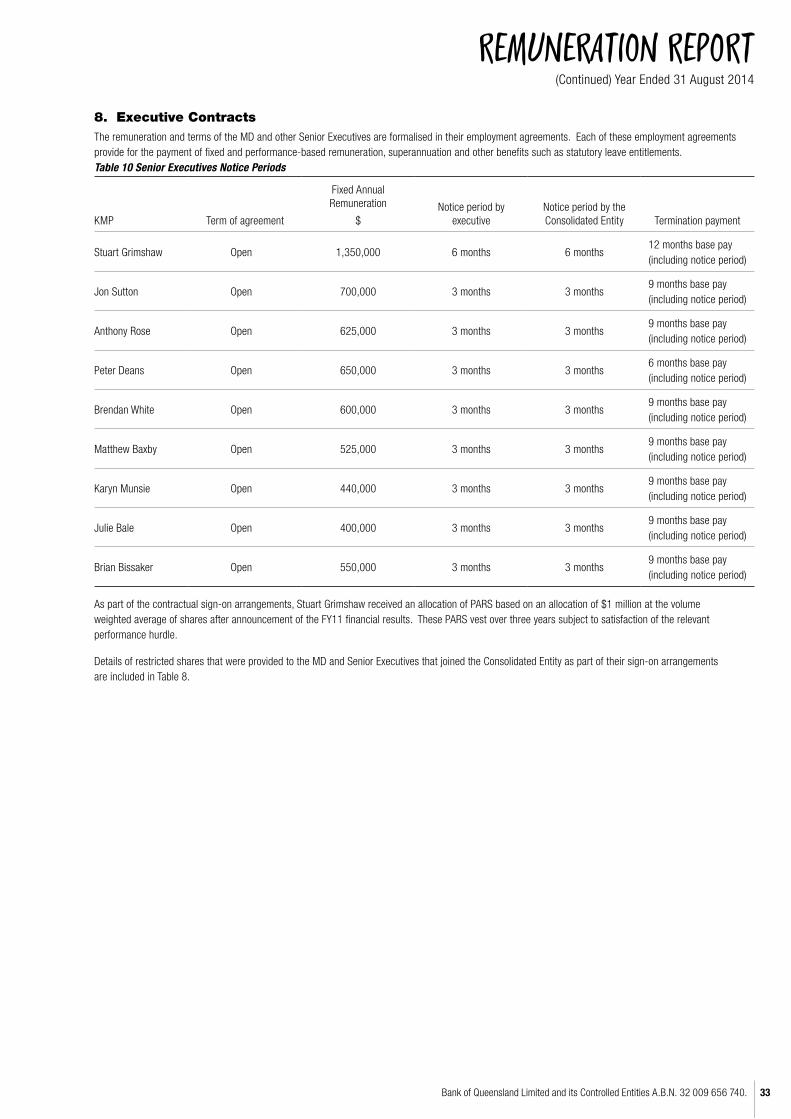
Bank of Queensland Limited and its Controlled Entities A.B.N. 32 009 656 740. 33
(Continued) Year Ended 31 August 2014
REMUNERATION REPORT
8. Executive ContractsThe remuneration and terms of the MD and other Senior Executives are formalised in their employment agreements. Each of these employment agreements provide for the payment of fixed and performance-based remuneration, superannuation and other benefits such as statutory leave entitlements. Table 10 Senior Executives Notice Periods
KMP Term of agreement
Fixed Annual Remuneration
$Notice period by
executiveNotice period by the Consolidated Entity Termination payment
Stuart Grimshaw Open 1,350,000 6 months 6 months12 months base pay (including notice period)
Jon Sutton Open 700,000 3 months 3 months9 months base pay (including notice period)
Anthony Rose Open 625,000 3 months 3 months9 months base pay (including notice period)
Peter Deans Open 650,000 3 months 3 months6 months base pay (including notice period)
Brendan White Open 600,000 3 months 3 months9 months base pay (including notice period)
Matthew Baxby Open 525,000 3 months 3 months9 months base pay (including notice period)
Karyn Munsie Open 440,000 3 months 3 months9 months base pay (including notice period)
Julie Bale Open 400,000 3 months 3 months9 months base pay (including notice period)
Brian Bissaker Open 550,000 3 months 3 months9 months base pay (including notice period)
As part of the contractual sign-on arrangements, Stuart Grimshaw received an allocation of PARS based on an allocation of $1 million at the volume weighted average of shares after announcement of the FY11 financial results. These PARS vest over three years subject to satisfaction of the relevant performance hurdle.
Details of restricted shares that were provided to the MD and Senior Executives that joined the Consolidated Entity as part of their sign-on arrangements are included in Table 8.
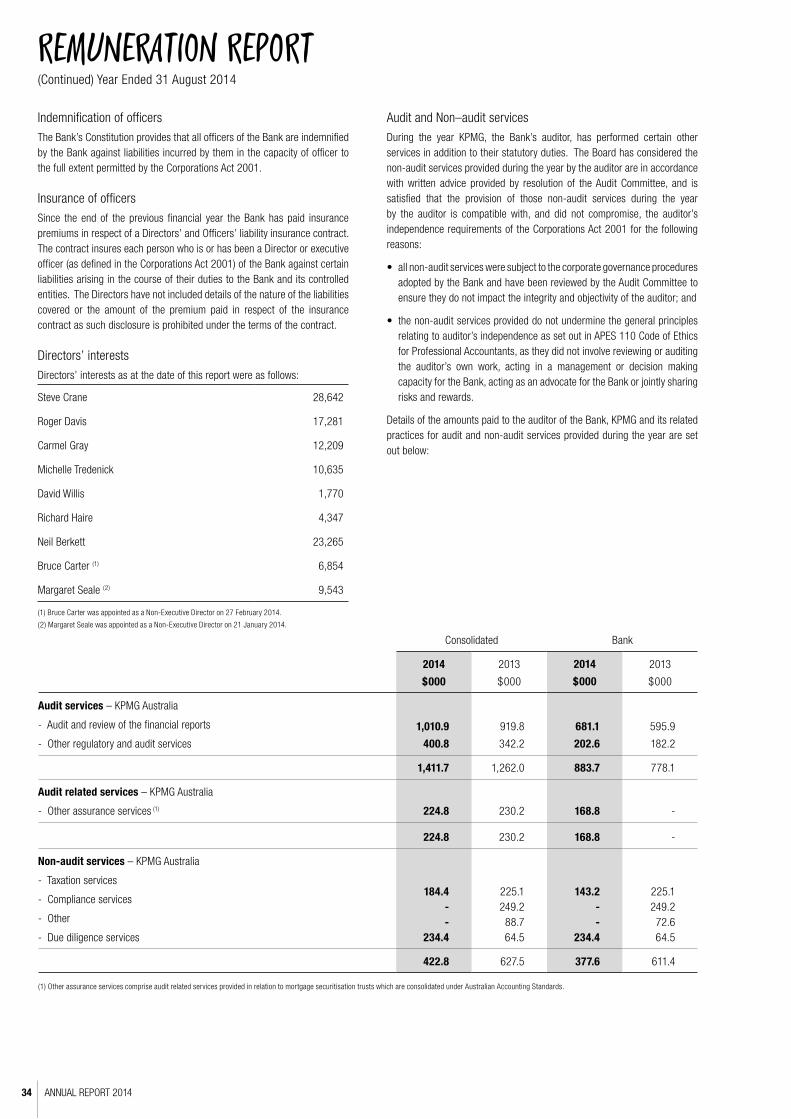
ANNUAL REPORT 201434
(Continued) Year Ended 31 August 2014
REMUNERATION REPORT
Indemnification of officers
The Bank’s Constitution provides that all officers of the Bank are indemnified by the Bank against liabilities incurred by them in the capacity of officer to the full extent permitted by the Corporations Act 2001.
Insurance of officers
Since the end of the previous financial year the Bank has paid insurance premiums in respect of a Directors’ and Officers’ liability insurance contract. The contract insures each person who is or has been a Director or executive officer (as defined in the Corporations Act 2001) of the Bank against certain liabilities arising in the course of their duties to the Bank and its controlled entities. The Directors have not included details of the nature of the liabilities covered or the amount of the premium paid in respect of the insurance contract as such disclosure is prohibited under the terms of the contract.
Directors’ interests
Directors’ interests as at the date of this report were as follows:
Steve Crane 28,642
Roger Davis 17,281
Carmel Gray 12,209
Michelle Tredenick 10,635
David Willis 1,770
Richard Haire 4,347
Neil Berkett 23,265
Bruce Carter (1) 6,854
Margaret Seale (2) 9,543
(1) Bruce Carter was appointed as a Non-Executive Director on 27 February 2014.
(2) Margaret Seale was appointed as a Non-Executive Director on 21 January 2014.
Audit and Non–audit services
During the year KPMG, the Bank’s auditor, has performed certain other services in addition to their statutory duties. The Board has considered the non-audit services provided during the year by the auditor are in accordance with written advice provided by resolution of the Audit Committee, and is satisfied that the provision of those non-audit services during the year by the auditor is compatible with, and did not compromise, the auditor’s independence requirements of the Corporations Act 2001 for the following reasons:
• all non-audit services were subject to the corporate governance procedures adopted by the Bank and have been reviewed by the Audit Committee to ensure they do not impact the integrity and objectivity of the auditor; and
• the non-audit services provided do not undermine the general principles relating to auditor’s independence as set out in APES 110 Code of Ethics for Professional Accountants, as they did not involve reviewing or auditing the auditor’s own work, acting in a management or decision making capacity for the Bank, acting as an advocate for the Bank or jointly sharing risks and rewards.
Details of the amounts paid to the auditor of the Bank, KPMG and its related practices for audit and non-audit services provided during the year are set out below:
Consolidated Bank
2014
$000
2013
$000
2014
$000
2013
$000
Audit services – KPMG Australia
- Audit and review of the financial reports
- Other regulatory and audit services
1,010.9
400.8
919.8
342.2
681.1
202.6
595.9
182.2
1,411.7 1,262.0 883.7 778.1
Audit related services – KPMG Australia
- Other assurance services (1) 224.8 230.2 168.8 -
224.8 230.2 168.8 -
Non-audit services – KPMG Australia
- Taxation services
- Compliance services
- Other
- Due diligence services
184.4--
234.4
225.1249.288.764.5
143.2--
234.4
225.1249.2
72.664.5
422.8 627.5 377.6 611.4
(1) Other assurance services comprise audit related services provided in relation to mortgage securitisation trusts which are consolidated under Australian Accounting Standards.
Bank of Queensland Limited and its Controlled Entities A.B.N. 32 009 656 740. 35
(Continued) Year Ended 31 August 2014
REMUNERATION REPORT
Lead Auditor’s Independence Declaration
The lead auditor’s independence declaration is set out on page 38 and forms part of the Directors’ report for the year ended 31 August 2014.
Rounding of amounts
The Bank is a company of a kind referred to in ASIC Class Order 98/100 dated 10 July 1998 (as amended by Class Order 04/667 dated 15 July 2004) and in accordance with that Class Order, amounts in this financial report and Directors’ report have been rounded off to the nearest million dollars, unless otherwise stated.
Signed in accordance with a resolution of the Directors:
Roger Davis Richard Haire Chairman Director
8 October 2014 8 October 2014

ANNUAL REPORT 201436
LEAD AUDITOR’S INDEPENDENCE DECLARATION
Lead Auditor’s Independence Declaration under Section 307C of the Corporations Act 2001
To the Directors of Bank of Queensland Limited
I declare that, to the best of my knowledge and belief, in relation to the audit for the financial year ended 31 August 2014 there have been:
(i) no contraventions of the auditor independence requirements as set out in the Corporations Act 2001 in relation to the audit; and
(ii) no contraventions of any applicable code of professional conduct in relation to the audit.
KPMG
Martin McGrath Partner
Sydney 8 October 2014
KPMG, an Australian partnership and a member firm of the KPMG network of independent member firms affiliated with KPMG International Cooperative (“KPMG International” ), a Swiss entity.
Liability limited by a scheme approved under Professional Standards Legislation.

Bank of Queensland Limited and its Controlled Entities A.B.N. 32 009 656 740. 37
CORPORATE GOVERNANCE
OverviewDirectors and Management of Bank of Queensland Limited (the “Bank” or “BOQ”) and its subsidiaries (the “Group”) are committed to excellence in corporate governance. In striving to achieve its objectives, the Group endeavours to be a bank that looks after its staff, values and services its customers, rewards its shareholders and partners with the community - and prove ‘It’s Possible to Love a Bank’.
Corporate governance is not just about compliance, but about our values and our behaviour. We believe in excellence in corporate governance because it is in the best interests of the Group and all of its stakeholders.
The Board has over many years developed and implemented policies and practices which at the time of publishing this statement are consistent with the applicable ASX Corporate Governance Principles and Recommendations, Second Edition with 2010 Amendments (‘Principles’) updated by the ASX Corporate Governance Council in 2010, and the corporate governance standards set out in Prudential Standard CPS 510 “Governance”. In addition, the Board has adopted a Fit and Proper Policy, as required by CPS 520 “Fit and Proper”, which sets out the requirements for regulated authorised deposit-taking institutions to assess the competencies and fitness for office of persons appointed as directors, senior managers and auditors. The Bank’s subsidiaries St Andrew’s Insurance (Australia) Pty Ltd (‘SAI’) and St Andrew’s Life Insurance Pty Ltd (‘SALI’) (together, the “St Andrew’s Group”) are subject to APRA’s prudential supervision as insurance companies, and subject to similar Corporate Governance and Fit and Proper standards as those applicable to authorised deposit-taking institutions.
On 31 July 2014, the Bank settled the acquisition of Investec Bank (Australia) Limited (now re-named BOQ Specialist Bank Limited, or ‘BOQS’). Pending the completion of the full integration of BOQS into the Bank’s Group structure, BOQS will operate as a separate authorised deposit-taking institution, and so must also comply with CPS 510, CPS 520 and the corporate governance standards which apply to the Bank. BOQS is a wholly owned-subsidiary of the Bank.
The Group’s policies comply with all of these standards. The Nomination & Governance Committee is responsible for reviewing the Group’s corporate governance framework and policies, and makes recommendations to the Board in relation to governance improvements. As part of its process of continual improvement, the Bank has carried out a full review of all of its corporate governance policies during the year, and where necessary, has refined its codes, policies and charters.
The Group’s key policies, Board and Committee charters and a checklist detailing its compliance with the Principles appear on the Company’s website at the following address: www.boq.com.au/aboutus_corporate_governance.htm
The Group is required to disclose in this report the extent to which it has followed the best practice recommendations in the Principles throughout the 2014 financial year. The Group has followed those recommendations throughout the year. A summary of the Group’s corporate governance policies and practices, organised in order of the Principles, is set out below. The Third Edition of the Principles is to take effect from the commencement of the Bank’s 2015 financial year. Where it is in a position to do so now, the Bank has also provided information which would be required to be disclosed under the Third Edition of the Principles. Otherwise, the Bank has complied with the Second Edition of the Principles.
Principle 1: Lay solid foundations for management and oversight
BOQ Board and Management
The BOQ Board Charter sets out the key governance principles adopted by the BOQ Board in governing the Group. There is a functional difference between the Board’s role and responsibilities and that of Management, which is recognised in the Board Charter.
Board Responsibilities
The responsibilities of the Board include:
• the overall corporate governance of the Group, such as:
• Monitoring the effectiveness of the Group’s governance practices;
• overseeing regulatory compliance; and
• ensuring the Group observes appropriate ethical standards.
• the overall strategy and direction of the Group, including approving, monitoring and reviewing Management’s implementation and performance against strategic, financial and operational plans;
• the appointment of the Managing Director & CEO, including the delegation of powers to the Managing Director & CEO within authorised discretionary levels;
• approving the appointment and removal of senior executives reporting directly to the Managing Director & CEO;
• the appointment of Directors to subsidiary companies of the Group;
• succession planning, including Board and Committee composition; and
• overseeing the Group’s process for making timely and balanced disclosure of all material information concerning the Group that a reasonable person would expect to have a material effect on the price or value of its securities.
In order to fulfil these responsibilities, the Board reserves to itself certain powers including:
Board Operation
• establishing Board Committees;
• reviewing the Board’s performance, and those of its Committees, in carrying out key responsibilities;
• acting within the overall policies established by the Board from time to time;
Strategy
• providing leadership, and reviewing and approving the Group’s strategic plan at least annually;
Financial
• overseeing the integrity of the Group’s accounting and corporate reporting systems;
• approving annual budgets and major capital expenditure;
• reviewing and approving financial results;
• determining dividend policy and the amount and timing of dividends to be paid;
ANNUAL REPORT 201438
CORPORATE GOVERNANCE(Continued)
Principle 1: Lay solid foundations for management and oversight (continued)
Risk Management
• setting the risk appetite for the Group;
• monitoring the effectiveness of risk management of the Group, including reviewing and approving risk management policies, operational risk policies and procedures and systems of internal controls within the Group, to ensure that they take account of changing risk profiles of Group entities;
• ensuring that areas of significant business risk are identified and effectively managed;
• monitoring the environmental, social and governance impact of the Group’s activities;
• ensuring the Bank maintain compliance with the obligations and responsibilities under APRA Prudential Standard CPS 220 Risk Management;
Human Resources
• determining the terms and conditions of appointment of the Managing Director & CEO, and the executives reporting directly to the Managing Director & CEO, including the right to suspend, remove or dismiss the Managing Director & CEO from executive office;
• setting targets for and assessing the performance of the Managing Director & CEO;
• approving the remuneration framework for the Group;
• reviewing succession plans for the Managing Director & CEO and senior executives;
• establishing transparent, measurable objectives for achieving diversity across the Group and articulation of the corporate benefits arising from employee and board diversity;
• in relation to Directors of subsidiary companies within the Group, determining the terms and conditions surrounding their appointment and the fees payable in respect of their appointment, assessing their performance and retaining the right to remove them from the board of the subsidiary company; and
General
• dealing with all matters which are outside discretions conferred on the Managing Director & CEO.
BOQ Board Committees
The Board has established the following Committees:
• Audit Committee
• Risk Committee
• Human Resources and Remuneration Committee
• Nomination & Governance Committee
• Information Technology Committee
A separate Charter has been prepared for each Committee and is reviewed at least annually. The composition of the Board Committees is also reviewed at least annually. Details of the current membership of the Board Committees are contained in the Directors’ Report.
The powers of the Board are also governed by the Bank’s constitution. A copy of the constitution is available on the Bank’s website at the following address: www.boq.com.au/aboutus_corporate_governance.htm.
Management Responsibilities
The role of Management is the day-to-day running of the Group, within the overall strategy and frameworks approved by the Board.
Certain powers are delegated to the Managing Director & CEO, Key Management Personnel and Management including:
• developing strategy for approval by the Board;
• financial and capital management and reporting;
• operations;
• information technology;
• brand management;
• managing the current business of the Group and acquiring new business;
• customer relationship service;
• developing and maintaining key external relationships, including with investors, media, analysts and industry participants;
• human resources, people development, performance and the creation of a safe and enjoyable workplace;
• risk management;
• reporting to the Board on the performance of the Group and its management; and
• performing duties that are delegated by the Board.
BOQ Group APRA Regulated Subsidiaries
St Andrew’s Group
The St Andrews Group offers general and life insurance products. The St Andrew’s Group board comprises five non-executive directors, of which three are independent. All members of the St Andrew’s Group Board are also members of the St Andrew’s Group Audit & Risk Committee (the ‘A&R Committee’). The BOQ Group Human Resources & Remuneration Committee also acts for the St Andrew’s Group.
The following specific policies have been adopted by the St Andrew’s Group board, and appear on the BOQ website – SAI Board Charter, SALI Board Charter, SAI & SALI Policy on Independence of Directors, SAI & SALI Board Performance & Renewal Policy, SAI & SALI Audit & Risk Committee Charter. Where not replaced by a specific policy, other BOQ Group policies apply.
The Boards of these entities comply with Prudential Standards CPS 510 Governance and 520 Fit and Proper.
BOQ Specialists
The membership of the BOQS Board mirrors that of the BOQ Board, and complies with CPS 510 and 520. The BOQS Board has its own Charter and the BOQ Group Board Committees have been appointed to act for BOQS. Where not replaced by a specific BOQS policy, other BOQ Group policies referred to in this Statement apply to BOQS. These documents appear on the BOQ website.
Fit & Proper Assessments
All new and existing Directors are subject to an assessment of their fitness and propriety to hold office, both at the time of initial appointment and then annually, under the Bank’s Fit and Proper Policy. This policy was established to comply with CPS 520 and also applies to the St Andrews Group and BOQS. This Policy requires an assessment of each Director’s or potential Director’s qualifications and experience against documented criteria for the competencies required for the office. The assessment includes checks on the Director’s propriety such as police checks and bankruptcy checks.
Similar initial and annual assessments are undertaken for ‘Responsible Persons’, as defined in CPS 520 as including senior managers who are considered by the Bank to make, or participate in making, decisions that affect the financial soundness of the Group, the operation of its businesses and monitoring and management of risks.

Bank of Queensland Limited and its Controlled Entities A.B.N. 32 009 656 740. 39
CORPORATE GOVERNANCE(Continued)
Principle 1: Lay solid foundations for management and oversight (continued)
Senior Management Performance Evaluations
The Board undertakes an annual formal performance review of the Managing Director & CEO, in accordance with key financial and non-financial performance indicators (‘KPIs’) set by the Board.
Management has a program of formal half and full year performance reviews for all levels of Management, and the review program includes the annual setting of KPIs by the Managing Director & CEO for his direct reports at the start of the financial year. These KPIs are then cascaded down into individual KPIs for each member of Management.
A formal evaluation of each individual’s performance against their KPIs is undertaken following the conclusion of the half year and the full financial year. The results of this process are then incorporated into the annual remuneration review. Performance reviews have been carried out in accordance with the program for all levels of Management, with the exception of the former Managing Director & CEO, who left the organisation on 31 August 2014.
The Group has a written agreement with each of its senior executives which sets out the terms of their appointment.
Company Secretary
The Company Secretary of a listed entity plays an important role in supporting the effectiveness of the Board and its Committees. The Company Secretary’s role includes managing the Board processes; providing assistance with the preparation of agendas for Board and Board Committee meetings, in consultation with the Chair of the Board or Committee; preparation of Minutes of Board and Board Committee meetings; maintaining the Company Registers; ensuring all statutory obligations and regulatory requirements are met (including continuous disclosure obligations); ensuring directors’ and members’ meetings are properly called and held; advising the Board on good practices; and participating in risk management initiatives.
The Company Secretary has a direct reporting line to Chairman of the Board and is accountable to the Board, through the Chairman, for the proper functioning of the Board.
All Directors have unfettered access to the Company Secretary. The decision to appoint or remove the Company Secretary is a responsibility reserved by the Board.
Information in relation to the qualifications of the Company Secretary appears in the Directors’ Report.
Principle 2: Structure the Board to add valueBoard Structure
On 12 August 2014, the Managing Director & CEO, Mr Stuart Grimshaw, announced his resignation and left the Company on 31 August 2014. As the result, the Board currently has nine Directors (including the Chairman), all of whom are Non-Executive Directors (Ms Margaret Seale was appointed to the Board on 21 January 2014 and Mr Bruce Carter was appointed on 27 February 2014). The position of Managing Director & CEO, when it is filled, is an Executive Director role.
Skills & Experience
The Board considers that individually and collectively, the Directors have an appropriate mix of skills, qualifications and experience to enable them to appropriately discharge their duties effectively.
The Board has robust succession planning in place and plans ahead to ensure that membership contains a diverse range of skills and experience that are relevant to the business undertaken by the Bank, both now and into the future.
As part of this process, a board skills matrix is used which addresses factors such as age, gender, location of residence, professional network, and professional experience and qualifications, in order to promote a diverse range of views.
The Board seeks to ensure that its members have a diverse range of skills and experience that reflect the breadth of operation of the Bank’s business and its future strategy. Accordingly, the Board has been structured to include suitably qualified men and women with experience in financial markets, insurance, banking, funds and wealth management, strategy, superannuation, information technology and agribusiness. Several members also hold directorships on other ASX listed entities.
The skills and experience of the Directors and their length of service, membership of Board committees and record of attendance at meetings, are set out in the Directors’ Report. Detailed information about the professional experience of Directors standing for election or re-election at the Annual General Meeting is provided in the Notice of Meeting.
Prior to their commencement, all new directors are required to sign formal letters of appointment.
The Bank delivers an induction program to assist all new Board members to introduce them to the working environment of the Group. As part of the induction, new Board members are given a detailed overview on the Group’s business operations, copies of all material Group policies and procedures, information on the functions and responsibilities of the Board, Board Committees and Management, and meetings between new Board members and Group Executives and other Senior Management are held.
During the course of a financial year, education sessions are provided to the Board on topical matters.
Every Director and Committee of the Board has the right to seek independent professional advice in connection with carrying out their duties at the expense of the Bank. Prior written approval of the Chairman is required.
Nomination
The Board seeks to ensure that it has an appropriate mix of skills and diversity in its membership. The Nomination & Governance Committee monitors the skills and experience of existing Directors and the balance between this experience and any new skills which may be required and which may lead to consideration of appointments of new Directors. The Nomination & Governance Committee considers Board and Committee succession planning, the process for evaluating the performance of the Board, its Committees and subsidiary Boards, the Chairman and individual Directors, and has oversight of the process of selecting the Managing Director & CEO.
When appointing a new Director, the Board has regard to the Board Performance Review & Renewal Policy and considers the need to balance the skills, tenure, experience, diversity and perspectives of its directors as a whole, and endeavours to achieve an appropriate mix of these factors to enable the Board to facilitate achievement of the Group’s strategic goals. Potential candidates for board positions are sourced using the Board’s contacts and market intelligence, as well as through the services of specialist external advisers. When considering whether to support an incumbent Director’s nomination for election or re-election, the Board considers that Director’s performance to date, and the skills, experience and diversity that the Director brings to the Board.
The names and qualifications of those appointed to the Nomination & Governance Committee, and number of meetings of the Nomination & Governance Committee, during the financial year are set out in the Directors’ Report. The Charter of the Nomination & Governance Committee, which details its duties, objectives, responsibilities and membership requirements, appears on the Bank’s website at the following address: www.boq.com.au/aboutus_corporate_governance.htm.
ANNUAL REPORT 201440
CORPORATE GOVERNANCE(Continued)
Principle 2: Structure the Board to add value (continued)
Independence
The Board assesses a potential Non-Executive Director’s independence prior to their initial appointment and then on at least an annual basis, or, if it feels it is warranted, depending upon disclosures made by individual Directors.
It is the responsibility of the Board to determine the independence of Directors in accordance with the Independence of Directors Policy and the Board has assessed that all of the current non-executive Directors are “independent”. No Directors have any relationship, association, interest or position of the type described in Box 2.3 of the Principles, such that they are not considered to be independent.
In reaching its decision regarding individual director independence, the Board reserves the right (except in the case of the Audit Committee membership) to consider a director to be independent even though they may not meet one or more of the specific thresholds or tests set out in the Independence of Directors Policy, having regard to the underlying policy of the independence requirement and the qualitative nature of the director’s circumstances.
The Independence of Directors Policy takes into account whether Directors have relationships with the Bank, its shareholders or advisers which are likely to materially interfere with the exercise of the Director’s unfettered and independent judgment, having regard to all the circumstances. The Bank has established both quantitative and qualitative guidelines to determine the materiality, which include the value of a contractual relationship being the greater of $500,000 or 5% of the other company’s consolidated gross revenues and the strategic importance of the relationship. A copy of the policy is available on the ‘Corporate Governance’ page on the Bank’s website.
The Board Charter requires that all Directors bring an independent mind to bear on all matters coming before the Board for consideration. The Bank does not consider that the length of service on the Board of any of the independent Directors is currently a factor affecting the Director’s ability to act independently and in the best interests of the Bank. The Board generally judges independence against the ability, integrity and willingness of the Director to act, and places less emphasis on length of service as a matter which impairs independence.
At the commencement of each Board meeting, all Non-Executive Directors confer privately without the presence of Management.
Board and Director Performance
The Bank conducts its business in a complex and constantly changing regulatory and business environment. It is important that the Board review its own performance and that of its Committees from time to time, with the objective of achieving and maintaining a high level of performance in such an environment.
Under the Board Performance Review and Renewal Policy, the performance of the Board is formally assessed annually. While the Board believes in the value of a review, it does not consider that a full-scale review is necessarily required every year. From time to time, the Board uses the assistance of an external facilitator and progress against any recommendations arising from the review are considered by the Board, together with any new issues which may have arisen.
The Chairman meets at least once a year with each individual Director to discuss Board and Committee performance and the individual Director’s performance, and at least once a year on a formal basis with the Managing Director & CEO to discuss management’s view of the Board’s performance, the performance of Board Committees and the level of interaction with, and support of, management. Informal meetings on such matters are held between the Chairman and the Managing Director throughout the year.
An evaluation of director performance will have regard to factors including the following:
• The expectation that each Director will actively seek a full appreciation of the business of the Bank (or subsidiary, as applicable) including key business drivers, the risks facing the Bank (or subsidiary) and applicable risk management policies, the regulatory environment in which the company operates and banking, finance and insurance sector issues (as applicable to the company);
• The expectation that each Director will actively participate in open, honest discussion and bring an independent mind to bear on matters before the Board and the Committees on which the Director serves;
• The expectation that Directors and the Board as a whole will perform their duties:
• the interests of shareholders and other stakeholders;
• in a manner consistent with the Bank’s CANDO behaviours – Collaborative, Accountable, No problems, Do what we say & Openness; and
• in accordance with the duties and obligations imposed by applicable laws.
• Attendance at briefings, seminars and ongoing training programs.
In addition, the Chairman is available to the Board and to senior executives at any time to discuss Board and Board Committee performance.
During the 2013/14 financial year, the Board engaged an independent external facilitator to undertake a review of Board and Committee performance.
The rationale for the review was to allow the Chairman and the Board to obtain an objective view of the operation of the Board. As part of this process, the facilitator sought and obtained input from each Director and members of senior management through the completion of interviews and/or an online questionnaire.
Based on the information provided and material reviewed, the external facilitator rated the Board’s and the Committees’ practices across a range of criteria including, the effectiveness of the Board, the performance of the Committees, and the quality of meetings (including issues such as, the effectiveness of agendas and papers, the working relationship between the Board and Management and the performance of Board members). A comprehensive report, detailing the findings of the review and recommending areas for discussion and improvement, was presented to the Board for discussion. The Chairman and the Board continue to discuss and explore ways to improve Board and Committee performance.
The Board considers that the benefits gained from the review include the improvement of Board and Committee processes and effectiveness.
Principle 3: Promote ethical and responsible decision-making
Code of Conduct
The Group’s Code of Conduct sets out the principles which all Directors, officers, employees, agents, owner-managers and their staff and contractors are expected to uphold in order to promote the interests of the Group and its shareholders and drive its relationships with employees, customers and the community. The Code details the Group’s expectations regarding ethical standards, professionalism, respect for the law, conflicts of interest, confidentiality, environment and good corporate citizenship. Through annual training and enforcement of the Code, the Group actively promotes ethical and responsible decision-making within the Group.
The Code of Conduct is available on the Bank’s website.

Bank of Queensland Limited and its Controlled Entities A.B.N. 32 009 656 740. 41
CORPORATE GOVERNANCE(Continued)
Principle 3: Promote ethical and responsible decision-making (continued)
Securities Trading Policy
The Group’s Securities Trading Policy provides a framework to assist Directors, employees, owner-managers, agents and contractors of the Bank to understand their legal obligations with respect to insider trading. The Group’s Securities Trading Policy meets the requirements of the ASX Listing Rules and is located in the Corporate Governance section of the Bank’s website.
Diversity
In order to attract and retain a diverse workforce, the Group is committed to maintaining a workforce that reflects the diversity of the Australian population and to providing an environment in which all employees are treated fairly and equitably, and where diversity is embraced.
In line with this commitment, the Group’s Diversity Policy seeks to ensure a workplace where:
• All employees are valued and respected for their skills, experiences and perspectives;
• Structures, policies and procedures are in place to assist employees to balance their work, family and other responsibilities effectively;
• Decision-making processes in recruitment take account of diversity;
• Employees have access to opportunities based on merit;
• The Group’s culture is free from discrimination, harassment and bullying; and
• Employment decisions are transparent, equitable and procedurally fair.
The Group recognises that diversity encompasses many different factors (such as gender, age, cultural background and disability) and it works actively to promote an inclusive working environment.
Gender Diversity
The Group is committed to facilitating the inclusion of women in all ranks within the organisation, and removing barriers that may restrict career progression. To support this position, the Diversity Policy stipulates that selection process for Board and senior management appointments is to involve the creation of a short-list of candidates for the appointment which must include an equal balance of gender wherever possible. Further, all managers and employees are responsible for behaving in a way that does not discriminate against other employees, prospective employees, agents, contractors, customers and suppliers, and are expected to promote the spirit of diversity and equal opportunity to the full.
The Group’s Human Resources & Remuneration Committee is responsible for overseeing diversity issues within the Group and annually assesses the Group’s progress against its stated diversity targets and objectives, which are as follows:
• to increase the representation of women on its Board;
• to continue to grow the number of women in senior roles, with a target of 25% of women in senior management roles by 2015;
• encouraging the participation of women in leadership programs; and
• encouraging women to participate in the Bank’s My Mentor Program.
The Board has determined that by 2017 it wants to achieve a target of 27% of women in senior management roles.
The percentage of women employed by the Group is detailed below:
2010/11 2011/12 2012/13 2013/14
Board
% of the Board who are female 22% 22% 25% 30%
Senior Management
% of Senior Management who are female 17.9% 14% 22% 22.5%
% of total workforce who are female 60% 57% 57% 56%
Part – time employees
% of total workforce who work part-time 12.2% 9.9% 10% 9.7%
% of part-time workforce who are female 95% 92% 91% 92%
Casual employees
% of casual workforce who are female 82% 86% 76% 66%

ANNUAL REPORT 201442
CORPORATE GOVERNANCE(Continued)
Principle 3: Promote ethical and responsible decision-making (continued)The Group’s Senior Management roles are defined as Levels 1-4 of the Bank’s occupational categories. At the end of the 2013/14 financial year, the employee breakdown by gender across the Group is as follows:
Category Male Female
Board of Directors
Independent Non-Executive Directors 6 3
Managing Director & CEO (Level 1) 1 -
7 3
Employees*
Senior Management:
Group Executives (Level 2) 6 2
General Managers (Level 3) 21 4
Heads of Divisions (Level 4) 36 15
Total of Levels 2 - 4: 63 21
Other Management: 116 57
All Other Employees: 581 931
Total Employees* 767 1,012
*Includes full-time permanent, part-time permanent, full-time contract, part-time contract and casual staff, but not employees of Owner-Managed Branches.
The My Mentor Program is designed to support the building of the Group’s female leadership pipeline and has been run in Brisbane since 2012. 58 women participated in the Program during 2013/14, compared to 62 in the prior financial year. During the course of 2015, the Program will be offered to women in the Group’s subsidiaries, BOQ Specialist Bank Limited, BOQ Finance Limited and Virgin Money (Australia) Pty Ltd in Sydney, and SAI and SALI in Perth. To date, 21.4% of participants who have completed the program have been subsequently promoted. 49.6% of participants in the Group’s management training are women (62% in 2012, 67% in 2013).
In addition, the former Managing Director & CEO was an active participant in the Queensland Male Champions of Change group. The Male Champion of Change Group was formed in April 2010 by the Australian Sex Discrimination Commissioner, and comprises of some of Australia’s most influential and diverse male Chief Executive Officers and Chairpersons who aim to use their individual and collective influence and commitment to ensure the issue of women’s representation in leadership is elevated on the national business agenda. The Acting CEO is continuing the Bank’s involvement with this group.
Other Diversity enhancements
The Group has continued to build upon the work undertaken in prior years to ensure that it has an engaged, flexible and diverse workplace. The following steps were taken towards achieving this objective:
• The further refinement of the Group’s recruitment processes to require that external recruitment agencies and search firms to remove all gender identifiers (as well as name, address and age) from resumes of candidates applying for positions with Job Grades between levels 1 - 5. The aim of this measure is to boost the number of women in Senior Management and Executive positions and to remove any unconscious bias, so that managers make hiring decisions from a position of neutrality to gender, age and race;
• The completion of Unconscious Bias and Harassment, Discrimination & Bullying training by Group Executives, their senior leadership teams, and the internal recruitment team. An e-learning tool which is compulsory for all managers and employees was also launched during the year;
• The completion of a second gender pay equity review, under which remuneration decision-making processes were reviewed, a gender-based job evaluation process was undertaken and an action plan was created to address the causes of any inequities; and
• The development of a Flexible Work Policy for the Group. Rather than an employee having to prove to their manager why their position should be flexible, the onus is on the manager to prove why it cannot be. The Bank’s leaders are aware of the expectation that the Bank will provide flexible work opportunities to all our employees.
A copy of the Diversity Policy is available on the ‘Corporate Governance’ page on the Bank’s website. The Group’s annual report to the Workplace Gender Equality Agency (WGEA) was submitted in May 2013 and is available on the WGEA website at: http://search.wgea.gov.au/.
Principle 4: Safeguard integrity in financial reporting
Audit Committee
The Audit Committee is comprised in accordance with the recommendations in the Principles and the requirements of APRA Prudential Standard CPS 510 Governance. The Audit Committee comprises non-executive members of the Board with the majority of members being independent directors. The Audit Committee is chaired by an independent director, who is not the Chairman of the Board, and has at least three members. The Committee’s charter requires that at least one member must have professional accounting or financial management expertise.
The Audit Committee assists the Directors in discharging the Board’s responsibilities of oversight and governance in relation to financial and audit matters. The Committee operates under a Charter approved by the Board, and is responsible for reviewing and making recommendations to the Board on the following issues:
• External financial reporting, APRA and ASIC reporting requirements;
• Adequacy of the external audit and the independence of the external auditor;
• The Group Assurance function across the Group, the scope of the internal audit work program, and Management’s responsiveness to findings from the internal audit process;
• Actuarial engagements and independence; and
• The Audit Committee will refer to the Risk Committee any matters that have come to the Audit Committee’s attention that are relevant for the Risk Committee for noting and consideration, or which should be dealt with by that Committee.
The Bank’s Group Assurance function reports to the Audit Committee in relation to the effectiveness of internal controls which may have a significant impact on the annual financial report.
The names and qualifications of those appointed to the Audit Committee, and number of meetings of the Audit Committee during the financial year are set out in the Directors’ Report.

Bank of Queensland Limited and its Controlled Entities A.B.N. 32 009 656 740. 43
CORPORATE GOVERNANCE(Continued)
Principle 4: Safeguard integrity in financial reporting (continued)
External Auditor
The Bank has established an Auditor Independence Policy, which is available on the website and requires the External Auditor to comply with the requirements of the Corporations Act 2001, APRA Prudential Standard CPS 510 ‘Governance’ and Accounting Professional and Ethical Standards Board APES 110 – Code of Ethics for Professional Accountants, section 290 ‘Independence’. The Policy requires that the lead partner and review partner of the External Auditor is rotated so that neither role is performed by the same partner for more than 5 years, or more than five years out of seven successive years.
The Bank has an External Auditor Evaluation Policy, and under this policy, the Audit Committee provides feedback to the Board annually in relation to the performance, capability and service provided by the External Auditor.
The External Auditor contributes to the safeguarding of the integrity of the Bank’s financial reporting. Accordingly, the Bank considers that the External Auditor must demonstrate the following attributes:
• Be an internationally recognised and respected accountancy firm which has access to expert accounting standards research and sufficient resources and technical expertise to carry out the engagement;
• Have partners and staff that possess professional standing and appropriate skills, knowledge and experience;
• An ability to provide high audit quality control processes and efficient audit services;
• Independence; and
• An ability to satisfy the terms of the Fit & Proper Policy.
The procedure adopted for the selection and appointment of the External Auditor may vary from time to time. The selection process may involve firms tendering by invitation or by the Bank holding an open tender.
Key aspects of the External Auditor selection and appointment process are as follows:
• The Audit Committee will annually review the External Auditor’s performance and independence and periodically benchmarks the cost and scope of the external audit engagement;
• The Audit Committee, in consultation with Management, will approve the scope of the audit, the terms of the annual engagement letter and audit fees;
• The Board is responsible for appointing the External Auditor, subject to shareholder approval; and
• Upon engagement, the External Auditor will have unfettered access to Management, staff, records and company facilities, and is permitted reasonable, agreed time to conduct the audit.
The External Auditor attends the Annual General Meeting and is available to answer questions from shareholders relevant to the audit.
Management Attestations
The officers who perform a Chief Executive Officer function and a Chief Financial Officer function state in writing to the Board that the Bank’s financial reports present a true and fair view, in all material respects, of the Bank’s financial condition and operational results in accordance with the relevant accounting standards.
Principle 5: Make timely and balanced disclosureThe Group’s Market Disclosure Policy provides a framework to assist the Group in achieving its aims of keeping the market informed of material information and enhancing its communication with the market, thereby ensuring its compliance with legal requirements.
The Group is committed to creating and maintaining an informed market in its securities and enhancing corporate governance by encouraging a culture of transparency in relation to its corporate activities. The Group will also provide relevant information to media organisations, to ensure the broadest possible communication with investors and the general market.
The Policy requires Group employees to notify a Designated Disclosure Officer when they become aware of information which may require release to the market. The Managing Director & CEO (or Acting CEO) and the Company Secretary are responsible for communications with the ASX. Continuous disclosure is a permanent item on the agenda for Board meetings. All announcements made by the Group to the ASX are accessible via the Bank’s website. A copy of the Market Disclosure Policy is available on the Bank’s website.
Principle 6: Respect rights of shareholders
BOQ aims to provide all security holders with ready access to information about the Bank by communicating timely and transparent information about the Bank’s business, financial performance, governance and prospects.
BOQ maintains a Shareholder Centre on its website which provides links for security holders to:
• View details of their holding through the Bank’s share registry provider’s secure website, as well as to access contact details for the share registry;
• View details on historical dividend payments and information on the Bank’s Dividend Reinvestment Plan;
• A financial calendar for the key events in the upcoming year, including results announcements, the annual general meeting and dividend payments;
• Details of how to elect to receive shareholder information electronically;
• Financial disclosures, including results announcements, annual reports and other investor presentations, as well as webcasts of previous announcements, presentations and annual general meetings;
• ASX announcements made by the Bank;
• Details of Annual General Meetings, which are webcast on the Bank’s website. Security holders have the opportunity to ask questions or make comment on the management of the Bank, including ahead of the meeting if they cannot attend the meeting in person;
• Details of the Bank’s preference shares and previous capital raisings; and
• Other regulatory disclosures required by APRA.
In addition, BOQ maintains an ‘About Us’ section on its website which provides links for security holders to:
• An overview of the Bank and its history;
• Photographs and profiles of the Directors and Management team;
• Electronic copies of media releases made by the Bank;
• A corporate governance page which contains electronic links to all of the Bank’s key governance documents including constitution, Board and Board sub-committee charters and numerous Bank policies; and
• Contact details for the Bank.

ANNUAL REPORT 201444
CORPORATE GOVERNANCE(Continued)
Principle 6: Respect rights of shareholders (continued)
BOQ operates an ongoing investor relations program to facilitate effective two-way communication with investors on the Bank’s market activities which involves:
• Half-yearly results briefings (made available via webcast on the Bank’s website) which allow for questions from market participants;
• Half-yearly post-results meetings with key institutional investors;
• Annual or semi-annual meetings with key proxy adviser groups;
• Meetings with domestic and international institutional investors;
• Presentations to institutional and retail brokers and their clients; and
• Responding to ad-hoc queries from analysts and investors (institutional and retail), as well as financial media, on the market releases made by the Bank.
These initiatives represent an opportunity for the Bank to provide investors, market participants and the general public with a greater understanding of the Bank’s business, financial performance, governance and prospects, whilst also providing investors and other market participants the opportunity to express their views to the Bank on matters of concern or interest to them. These views are gathered and communicated to Management and the Board wherever appropriate.
Principle 7: Recognise and Manage Risk
The Board believes that risk management is a critical part of the Bank’s operations and a comprehensive risk management program has been developed.
Management of risk is overseen by the Board and the Risk Committee, a sub-committee of the Board which assists the Board to discharge its responsibilities. The role of the Board in this respect is outlined in its Charter, which is summarised under Principle 1, above. The Risk Committee is responsible for performing its duties in accordance with its Charter and making recommendations to the Board on the effective discharge of its responsibilities for the key risk areas and for the management of the Group’s compliance obligations.
Other responsibilities of the Risk Committee include the following:
• Review of any changes anticipated for the economic and business environment, including consideration of emerging trends and other factors relevant to the Bank’s risk profile;
• Oversight of all regulatory and compliance requirements;
• Oversight of APRA statutory reporting requirements pertaining to risk matters, and deal promptly with APRA reviews;
• Oversight of adequacy of internal risk monitoring and reporting requirements; and
• Regular liaison with the Chairman of the Audit Committee on relevant audit matters that should come to the attention of the Risk Committee.
A copy of the Risk Committee’s Charter is available on the ‘Corporate Governance’ page of the Bank’s website. The names and qualifications of those appointed to the Risk Committee, and number of meetings of the Risk Committee during the financial year are set out in the Directors’ Report.
BOQ’s Risk Management Framework
BOQ has an integrated risk management framework in place to identify, assess, manage and report risks on a consistent and reliable basis. This framework has been developed to accord with the tolerance levels set out in the Group’s Risk Appetite Statement.
The risk management framework requires each business to manage the outcome of its risk-taking activities and allows it to benefit from the resulting risk-adjusted returns. Accountability for risk management is structured by a “Three Lines of Defence” model as follows:
First Line - Business Management. Management within each of BOQ’s business areas are responsible for managing the risks for their business. This includes agreeing with the Managing Director & CEO and Chief Risk Officer the level of risk they wish to take, determining and implementing an approach to the management of these risks, and using risk management outcomes and considerations as part of their day-today business making processes.
Second Line – BOQ Group Risk. Group Risk Management provides risk management expertise and oversight for business management risk-taking activities. Group Risk develop specialist policies and procedures for risk management and ensure they are embedded and in use as part of the day-to-day management of the business. Group Risk also establishes and maintains aligned and integrated risk management frameworks and monitors compliance with the frameworks, policies and procedures.
Third Line – Group Assurance. Group Assurance, BOQ’s internal audit function, provides independent assurance to key stakeholders regarding the adequacy and effectiveness of the Group’s system of internal controls, risk management procedures and governance processes. It is responsible for reviewing risk management frameworks and Business Unit practices for risk management and internal controls. To maintain independence and to prevent any conflict of interest, the Head of Group Assurance reports directly to the Chairman of the Audit Committee. The Group Assurance strategic plan is approved and monitored by the Audit Committee.
Management’s responsibility
Management is responsible for designing and implementing a risk management and internal control system to manage the Bank’s material business risk, and implementing the policies and controls established by the Board. To enable Management to effectively do this, a number of committees have been established, including an Asset and Liability Committee, an Executive Committee, an Executive Credit Committee and an Operational Risk Committee. Operating under their respective charters, each committee has a role in the effective management and oversight of risk management in BOQ. The Executive Committee is also charged with ensuring that the Group has appropriately trained and skilled staff to identify, measure and monitor risk throughout the business.
The Board has received a report from Management as to the effectiveness of the Group’s management of its material business risks, that the declaration provided in accordance with section 295A of the Corporations Act is founded on a sound system of risk management and internal control, and that the system is operating effectively in all material respects in relation to financial reporting risks.
Key Business Risks
BOQ is a diversified financial services organisation that offers a range of financial products and services to a number of different customer segments across a large geographic area (but predominantly Australia and New Zealand).

Bank of Queensland Limited and its Controlled Entities A.B.N. 32 009 656 740. 45
CORPORATE GOVERNANCE(Continued)
Principle 7: Recognise and Manage Risk (continued)The following categories of risk have been identified as the material business risks of BOQ under its risk management framework:
• Compliance Risk, being the risk to earnings of capital arising from violations of or non-conformance with laws, rules, regulations, prescribed practices or ethical standards. It also includes overseeing the establishment and maintenance of risk-based controls to mitigate the risks associated with money laundering and terrorism financing. The policies adopted to manage Compliance Risk include a Conflicts of Interest Policy, Whistleblowing Policy and Breach & Incident Management Process. The Group also undertakes a range of compliance training of employees to manage Compliance Risk, including in relation to Consumer Credit Insurance, Consumer Protection, Code of Banking Practice, National Consumer Credit Protection and Anti-money Laundering & Counter Terrorism Financing;
• Credit Risk, being the risk that a debtor or transactional counterparties will default and/or fail to meet their contractual obligations, and includes the risk of loss of value of assets due to deterioration in credit quality and credit concentration risk. This risk primarily arises from BOQ’s lending activities and the holding of various financial instruments for investment or liquidity purposes. BOQ has a set of well documented credit risk policies to manage these risks within the limits set by the Board. They include the Treasury Credit Policy, Large Exposures Policy, Sector Risk Concentration Policy, the Delegated Approval Authority Policy, and specific credit policies for each customer segment and their respective lending products;
• Insurance Risk, which is the risk that the BOQ incorrectly assesses its risk of exposure to financial loss and inability to meet its liabilities due to inadequate or inappropriate insurance product design, claims management or reinsurance management;
• Liquidity and Funding Risk, which is the risk that BOQ, although balance sheet solvent, cannot meet or generate sufficient cash resources to meet its payment obligations in full as they fall due, or can only do so at materially disadvantageous terms. BOQ’s Liquidity Policy and Liquidity Contingency Plan are used to manage this risk;
• Market Risk, which includes Traded Market Risk (the risk that the value of an investment will decrease due to moves in market factors such as foreign exchange rates, interest rates, equity prices, commodity price and credit spreads) and Non Traded Market Risk (the risks arising from the various structural dimensions of the balance sheet including Interest Rate Risk in the Banking Book (IRRBB), Liquidity, Funding, Securitisation and Capital Risk). BOQ has adopted a number of Treasury Risk Policies to manage Market Risk;
• Operational Risk, which is the risk of loss resulting from inadequate or failed internal processes, people and systems, or from external events. Operational risk management covers a wide variety of risks including legal risk, franchise risk, environmental sustainability, Enterprise Continuity Management (comprising business continuity management, crisis management and disaster recovery, IT Security and technology/system risk) and human resources risk management The Group has implemented a number of systems and policies to address Operational risks including a Code of Conduct, Outsourcing Policy (including off-shoring of services), Product Approval Policy, IT Security Policy, IT Risk Management Policy, Workplace Health & Safety Policy, Workplace Rehabilitation Policy and Harassment, Discrimination & Bullying Policy;
• Contagion Risk, being the risk that problems arising in other BOQ Group members compromise the financial and operational position of the Authorised Deposit-taking Institution in BOQ Group;
• Regulatory Risk, being the exposure to financial loss arising from the possibility that regulatory bodies, government departments or other authorised agencies make changes to existing rules and regulations, or introduce new rules or regulations that negatively impact the business strategies or activities of the Bank;
• Reputation Risk, being the risk to earnings or capital arising from negative public opinion resulting from the loss of reputation, public trust or standing, and is considered to be a risk derived from business activities and is considered in conjunction with the underlying risks resulting from those activities;
• Franchise Risk, being the risk to earning or capital arising from the need to transition to a corporate operating model. Site selection policies and procedures ensure that branches are only opened in locations that are considered sustainable;
• Residual Value Risk, being the risk of loss on the sale of leased equipment or assets that have been returned at the end of their contractual lease term. This risk arises in the operation of the BOQ Finance asset finance business on certain operating lease contracts. BOQ has a sophisticated residual value management process in place to determine the level of residual value risk it takes on individual lease contracts and portfolios of similar asset classes to manage this risk;
• Strategic Risk, being the potential for financial loss associated with the vulnerability of business earnings to changes in the strategic environment; and
• Project Risk, being the risk of loss due change management and operational risks undertaken in large projects. BOQ is undertaking a number of large transformational projects across its back office, IT and lending processes. This change management program introduces operational risk to the portfolio and may adversely impact on business earnings if not adequately managed.
Sustainability
The Group is aware of the increasing calls for business to address matters of economic, environmental and social sustainability, and the increasing demand from investors for greater transparency on these matters so they can properly assess investment risk. The Group has determined it does not have any material exposure to economic, environmental or social sustainability risks. These matters are continually monitored as part of the Group’s sustainability approach, the framework for which is available in the Shareholder Review.
Principle 8 : Remuneration
The Human Resources & Remuneration Committee is charged with assisting the Board to discharge its responsibilities regarding the public reporting of remuneration information, remuneration policies, director fees and entitlements and other matters such as diversity.
The Human Resources & Remuneration Committee is comprised solely of non-executive directors and has been in place for the whole of the financial year.
The Board has approved a Remuneration Policy which is in accordance with the APRA requirements set out in CPS 510 Governance (see the Directors’ Report). The remuneration of the Board, the Managing Director & CEO and Senior Management is overseen by the Human Resources & Remuneration Committee.
Structure of Remuneration
Non-Executive Directors’ remuneration is distinguished from the remuneration of the Managing Director & CEO and senior managers. Non-Executive Directors are remunerated by cash fees which reflect the time commitment and responsibilities of their role and superannuation contributions. Non-Executive Directors do not receive performance-based or equity-based remuneration. Shareholders approved an increase in the fee pool for the Non-Executive Directors at the 2013 Annual General Meeting, and following advice from an independent, external consultant, Non-Executive Directors’ fees were increased from 1 July 2014.

ANNUAL REPORT 201446
CORPORATE GOVERNANCE(Continued)
Principle 8 : Remuneration (continued)
The Managing Director & CEO (or Acting CEO) and senior managers are provided with remuneration packages which incorporate a balance of fixed and performance-based remuneration. The performance-based remuneration is based on specific performance targets which are aligned to short and long-term performance, and comprise cash and equity-based elements. Further details in relation to the quantum of remuneration for Non-Executive Directors, the Managing Director & CEO (or Acting CEO) and senior Management are provided in the Remuneration Report. Short-term incentives will be deferred when they meet the Board’s threshold amount and could take the form of cash or Restricted Shares. They will be subject to claw back in the event that employees’ behaviour is inconsistent with the Bank’s risk and compliance standards or if financial misstatement has occurred. All employees are benchmarked independently with respect to their performance-based remuneration. Any employee found not to have complied with these standards may, at Board discretion, become ineligible for an award in addition to any other appropriate measures that may be taken by the Bank in such cases. Where applicable, such employees remain ineligible for awards in any further periods until such time as the matter is resolved to the Board’s satisfaction. The Board has set a deferral period of up to two years. Vesting of deferred short term incentives is subject to Board approval and the Board may choose to request input from the Chief Risk Officer in making its decision.
Long term incentives have been delivered either as Deferred Award Rights (DARs), Performance Award Rights (PARs), or a combination of the two. However, from the end of the 2014 financial year, DARs will no longer be offered as part of Key Management Personnel remuneration packages. Awards of long term incentives are also contingent upon compliance with the Bank’s risk and compliance standards and forfeiture and claw back procedures similar to those for short term incentives apply.
Directors’ retirement benefits were frozen in 2003 and the practice discontinued. Directors are entitled on retirement to their accrued benefit as at 31 August 2003 (increased annually in line with CPI increases).
The Group’s Securities’ Trading Policy provides that all employees are strictly prohibited from entering into hedging arrangements (the use of financial products to protect against or limit the risk associated with equity instruments such as shares, securities or options) in relation to any employee shares, securities or options received as part of their performance-based remuneration, whether directly or indirectly. Any employee who attempts to hedge any shares, securities or options renders those instruments liable to forfeiture.
A copy of the Human Resources & Remuneration Committee Charter is available on the ‘Corporate Governance’ page of the Bank’s website. The names and qualifications of those appointed to the Committee, and number of meetings of the Committee during the financial year are set out in the Directors’ Report.
Website
The following documents appear in the Corporate Governance section of the Bank’s website, at the following address: www.boq.com.au/aboutus_corporate_governance.htm:
• Constitution
• Board Charter
• Policy on Independence of Directors
• Information Technology Committee Charter
• Nomination & Governance Committee Charter
• Audit Committee Charter
• Risk Committee Charter
• Human Resources & Remuneration Committee Charter
• Diversity Policy
• Market Disclosure Policy
• Securities Trading Policy
• St Andrew’s Group charters and policies
• BOQS charters and policies
• BOQ Group Fit and Proper Policy
• Code of Conduct
• AML / CTF Statement
• Award Rights Plan
• Restricted Share Plan

Bank of Queensland Limited and its Controlled Entities A.B.N. 32 009 656 740. 47
INCOME STATEMENTSYear Ended 31 August 2014
Section
Consolidated Bank
2014 $m
2013 $m
2014 $m
2013 $m
Interest income 2.1 2,112.0 2,297.4 2,026.1 2,236.6
Less: Interest expense 2.1 1,351.2 1,604.3 1,437.5 1,711.1
Net interest income 2.1 760.8 693.1 588.6 525.5
Other operating income 2.1 136.2 122.5 233.9 218.8
Net banking operating income 897.0 815.6 822.5 744.3
Premiums from insurance contracts 70.4 70.2 - -
Investment revenue 4.9 5.8 - -
Less: Claims and policyholder liability expense from insurance contracts 33.7 35.7 - -
Net insurance operating income 2.1 41.6 40.3 - -
Total operating income 2.1 938.6 855.9 822.5 744.3
Less: Expenses 2.2 469.4 465.5 421.4 418.9
Less: Impairment on loans and advances 3.4 86.2 114.6 62.8 87.2
Profit before income tax 383.0 275.8 338.3 238.2
Less: Income tax expense 2.3 122.5 90.0 100.7 68.5
Profit for the year 260.5 185.8 237.6 169.7
Profit attributable to:
Equity holders of the parent 260.5 185.8 237.6 169.7
Basic earnings per share - Ordinary shares (cents) 2.4 77.4 57.6
Diluted earnings per share - Ordinary shares (cents) 2.4 75.9 56.5
The income statements should be read in conjunction with the accompanying notes.

ANNUAL REPORT 201448
STATEMENTS OF COMPREHENSIVE INCOMEYear Ended 31 August 2014
Consolidated Bank
2014 $m
2013 $m
2014 $m
2013 $m
Profit for the year 260.5 185.8 237.6 169.7
Other comprehensive income, net of income tax
Items that may be reclassified subsequently to profit or loss
Cash flow hedges:
Net (losses) / gains taken to equity (26.9) 11.9 (26.1) (3.1)
Net gains transferred to profit and loss (0.5) (0.9) (0.5) (0.9)
Foreign currency translation differences on foreign operations 0.4 1.6 - -
Net losses on hedge of net investment in foreign operation (0.5) (1.6) - -
Change in fair value of assets available for sale 28.9 (4.2) 28.4 (3.9)
Other comprehensive income / (expense) for the year, net of income tax 1.4 6.8 1.8 (7.9)
Total comprehensive income for the year 261.9 192.6 239.4 161.8
Total comprehensive income attributable to:
Equity holders of the parent 261.9 192.6 239.4 161.8
The statements of comprehensive income should be read in conjunction with the accompanying notes.
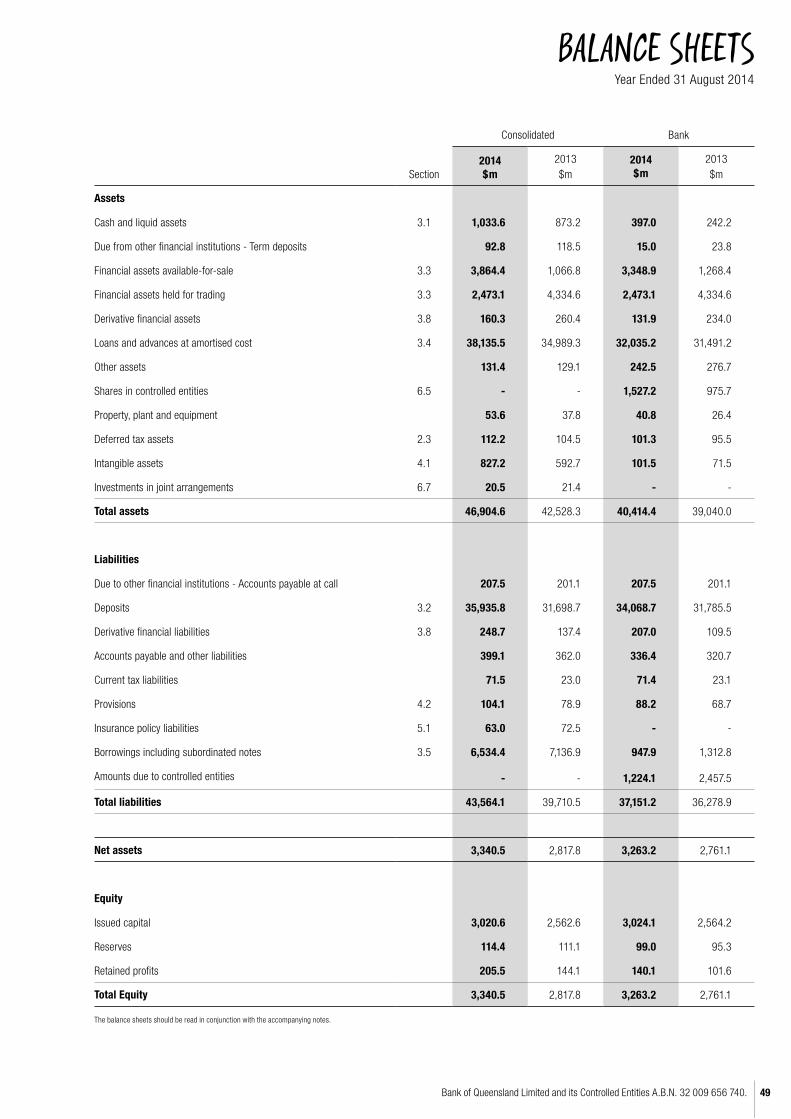
Bank of Queensland Limited and its Controlled Entities A.B.N. 32 009 656 740. 49
Year Ended 31 August 2014
BALANCE SHEETS
Section
Consolidated Bank
2014 $m
2013 $m
2014 $m
2013 $m
Assets
Cash and liquid assets 3.1 1,033.6 873.2 397.0 242.2
Due from other financial institutions - Term deposits 92.8 118.5 15.0 23.8
Financial assets available-for-sale 3.3 3,864.4 1,066.8 3,348.9 1,268.4
Financial assets held for trading 3.3 2,473.1 4,334.6 2,473.1 4,334.6
Derivative financial assets 3.8 160.3 260.4 131.9 234.0
Loans and advances at amortised cost 3.4 38,135.5 34,989.3 32,035.2 31,491.2
Other assets 131.4 129.1 242.5 276.7
Shares in controlled entities 6.5 - - 1,527.2 975.7
Property, plant and equipment 53.6 37.8 40.8 26.4
Deferred tax assets 2.3 112.2 104.5 101.3 95.5
Intangible assets 4.1 827.2 592.7 101.5 71.5
Investments in joint arrangements 6.7 20.5 21.4 - -
Total assets 46,904.6 42,528.3 40,414.4 39,040.0
Liabilities
Due to other financial institutions - Accounts payable at call 207.5 201.1 207.5 201.1
Deposits 3.2 35,935.8 31,698.7 34,068.7 31,785.5
Derivative financial liabilities 3.8 248.7 137.4 207.0 109.5
Accounts payable and other liabilities 399.1 362.0 336.4 320.7
Current tax liabilities 71.5 23.0 71.4 23.1
Provisions 4.2 104.1 78.9 88.2 68.7
Insurance policy liabilities 5.1 63.0 72.5 - -
Borrowings including subordinated notes 3.5 6,534.4 7,136.9 947.9 1,312.8
Amounts due to controlled entities - - 1,224.1 2,457.5
Total liabilities 43,564.1 39,710.5 37,151.2 36,278.9
Net assets 3,340.5 2,817.8 3,263.2 2,761.1
Equity
Issued capital 3,020.6 2,562.6 3,024.1 2,564.2
Reserves 114.4 111.1 99.0 95.3
Retained profits 205.5 144.1 140.1 101.6
Total Equity 3,340.5 2,817.8 3,263.2 2,761.1
The balance sheets should be read in conjunction with the accompanying notes.

ANNUAL REPORT 201450
STATEMENTS OF CHANGES IN EQUITYYear Ended 31 August 2014
ConsolidatedOrdinary shares
Employee benefits reserve
Equity reserve
for credit losses
Cashflow hedge reserve
Translation reserve
Available- for-sale reserve
Retained profits
Total equity
Year ended 31 August 2014 $m $m $m $m $m $m $m $m
Balance at beginning of the year 2,562.6 31.4 70.2 0.4 0.6 8.5 144.1 2,817.8
Total comprehensive income for the year
Profit - - - - - - 260.5 260.5
Other comprehensive income, net of income tax
Cash flow hedges:
Net losses taken to equity - - - (26.9) - - - (26.9)
Net gains transferred to profit and loss - - - (0.5) - - - (0.5)
Net losses on hedge of net investment in foreign operation
- - - - (0.5) - - (0.5)
Foreign currency translation differences on foreign operations
- - - - 0.4 - - 0.4
Change in fair value of assets available-for-sale - - - - - 28.9 - 28.9
Total other comprehensive income / (expense) - - - (27.4) (0.1) 28.9 - 1.4
Total comprehensive income / (expense) for the year - - - (27.4) (0.1) 28.9 260.5 261.9
Transactions with owners, recorded directly in equityContributions by and distributions to owners
Dividend reinvestment plan 65.6 - - - - - - 65.6
Dividends to shareholders - - - - - - (199.1) (199.1)
Equity settled transactions - 1.9 - - - - - 1.9
Treasury Shares (1) (1.5) - - - - - - (1.5)
Instutitional entitlement offer (2) 182.6 - - - - - - 182.6
Retail entitlement offer (2) 218.0 - - - - - - 218.0
Costs of capital issue (2) (6.7) - - - - - - (6.7)
Total contributions by and distributions to owners 458.0 1.9 - - - - (199.1) 260.8
Balance at the end of the year 3,020.6 33.3 70.2 (27.0) 0.5 37.4 205.5 3,340.5
(1) Treasury shares represent the value of shares held by a subsidiary that the Bank is required to include in the Consolidated Entity’s financial statements. No gain or loss is recognised in profit or loss on the purchase, sale, issue or cancellation of the Bank’s own equity instruments.
(2) As part of the acquisition of BOQ Specialist Bank Limited formerly Investec Bank (Australia) Limited, the Bank issued $393.9 million worth of new shares in two tranches. The institutional and retail tranches were for $182.6 million and $218.0 million respectively.
The statements of changes in equity should be read in conjunction with the accompanying notes.

Bank of Queensland Limited and its Controlled Entities A.B.N. 32 009 656 740. 51
STATEMENTS OF CHANGES IN EQUITY(Continued) Year Ended 31 August 2014
ConsolidatedOrdinary shares
Perpetual Equity
Preference shares
Employee benefits reserve
Equity reserve
for credit losses
Cashflow hedge reserve
Translation reserve
Available- for-sale reserve
Retained profits
Total equity
Year ended 31 August 2013 $m $m $m $m $m $m $m $m $m
Balance at beginning of the year 2,464.4 195.7 33.3 70.2 (10.6) 0.6 12.7 132.9 2,899.2
Total comprehensive income for the year
Profit - - - - - - - 185.8 185.8
Other comprehensive income, net of income tax
Cash flow hedges:
Net gains taken to equity - - - - 11.9 - - - 11.9
Net gains transferred to profit and loss
- - - - (0.9) - - - (0.9)
Net losses on hedge of net investment in foreign operation
- - - - - (1.6) - - (1.6)
Foreign currency translation differences on foreign operations
- - - - - 1.6 - - 1.6
Change in fair value of assets availa-ble-for-sale
- - - - - - (4.2) - (4.2)
Total other comprehensive income / (expense)
- - - - 11.0 - (4.2) - 6.8
Total comprehensive income / (expense) for the year
- - - - 11.0 - (4.2) 185.8 192.6
Transactions with owners, recorded directly in equityContributions by and distributions to owners
Exchange to CPS (1) (4.3) (175.8) - - - - - - (180.1)
Redemption of Perpetual Preference Shares (“PEPs”) (1)
- (19.9) - - - - - - (19.9)
Dividend reinvestment plan 62.7 - - - - - - - 62.7
Dividends to shareholders - - - - - - - (168.7) (168.7)
Dividends to PEPs - - - - - - - (5.9) (5.9)
Equity settled transactions - - (1.9) - - - - - (1.9)
Treasury Shares (2) 7.0 - - - - - - - 7.0
Acquisition of Virgin Money (Australia) Pty Limited (3)
32.8 - - - - - - - 32.8
Total contributions by and distributions to owners
98.2 (195.7) (1.9) - - - - (174.6) (274.0)
Balance at the end of the year 2,562.6 - 31.4 70.2 0.4 0.6 8.5 144.1 2,817.8
(1) On 24 December 2012, 1,801,339 PEPS shares were reinvested into CPS and the remaining 198,661 PEPS shares were redeemed on 15 April 2013.
(2) Treasury shares represent the value of shares held by a subsidiary that the Bank is required to include in the Consolidated Entity’s financial statements. No gain or loss is recognised in profit or loss on the purchase, sale, issue or cancellation of the Bank’s own equity instruments.
(3) On 30 April 2013, the Bank acquired 100% of Virgin Money (Australia) Pty Limited for consideration of $42.6 million. $30.6 million worth of new shares were issued in two tranches (Tranche 1 - 1,585,353 and Tranche 2 - 1,617,762) as part of the acquisition consideration. Refer to section 3.10(a) for further details.
The statements of changes in equity should be read in conjunction with the accompanying notes.

ANNUAL REPORT 201452
STATEMENTS OF CHANGES IN EQUITY(Continued) Year Ended 31 August 2014
BankOrdinary shares
Employee benefits reserve
Equity reserve
for credit losses
Cashflow hedge reserve
Available- for-sale reserve
Retained profits
Total equity
Year ended 31 August 2014 $m $m $m $m $m $m $m
Balance at beginning of the year 2,564.2 31.4 57.3 (2.2) 8.8 101.6 2,761.1
Total comprehensive income for the year
Profit - - - - - 237.6 237.6
Other comprehensive income, net of income tax
Cash flow hedges:
Net losses taken to equity - - - (26.1) - - (26.1)
Net gains transferred to profit and loss - - - (0.5) - - (0.5)
Change in fair value of assets available-for-sale - - - - 28.4 - 28.4
Total other comprehensive income / (expense) - - - (26.6) 28.4 - 1.8
Total comprehensive income / (expense) for the year - - - (26.6) 28.4 237.6 239.4
Transactions with owners, recorded directly in equityContributions by and distributions to owners
Dividend reinvestment plan 65.6 - - - - - 65.6
Dividends to shareholders - - - - - (199.1) (199.1)
Equity settled transactions - 1.9 - - - - 1.9
Treasury Shares (1) 0.4 - - - - - 0.4
Instutitional entitlement offer (2) 182.6 - - - - - 182.6
Retail entitlement offer (2) 218.0 - - - - - 218.0
Costs of capital issue (2) (6.7) - - - - - (6.7)
Total contributions by and distributions to owners 459.9 1.9 - - - (199.1) 262.7
Balance at the end of the year 3,024.1 33.3 57.3 (28.8) 37.2 140.1 3,263.2
(1) Treasury shares represent the value of shares held by a subsidiary that the Bank is required to include in the Consolidated Entity’s financial statements. No gain or loss is recognised in profit or loss on the purchase, sale, issue or cancellation of the Bank’s own equity instruments.
(2) As part of the acquisition of BOQ Specialist Bank Limited formerly Investec Bank (Australia) Limited, the Bank issued $393.9 million worth of new shares in two tranches. The institutional and retail tranches were for $182.6 million and $218.0 million respectively.
The statements of changes in equity should be read in conjunction with the accompanying notes.
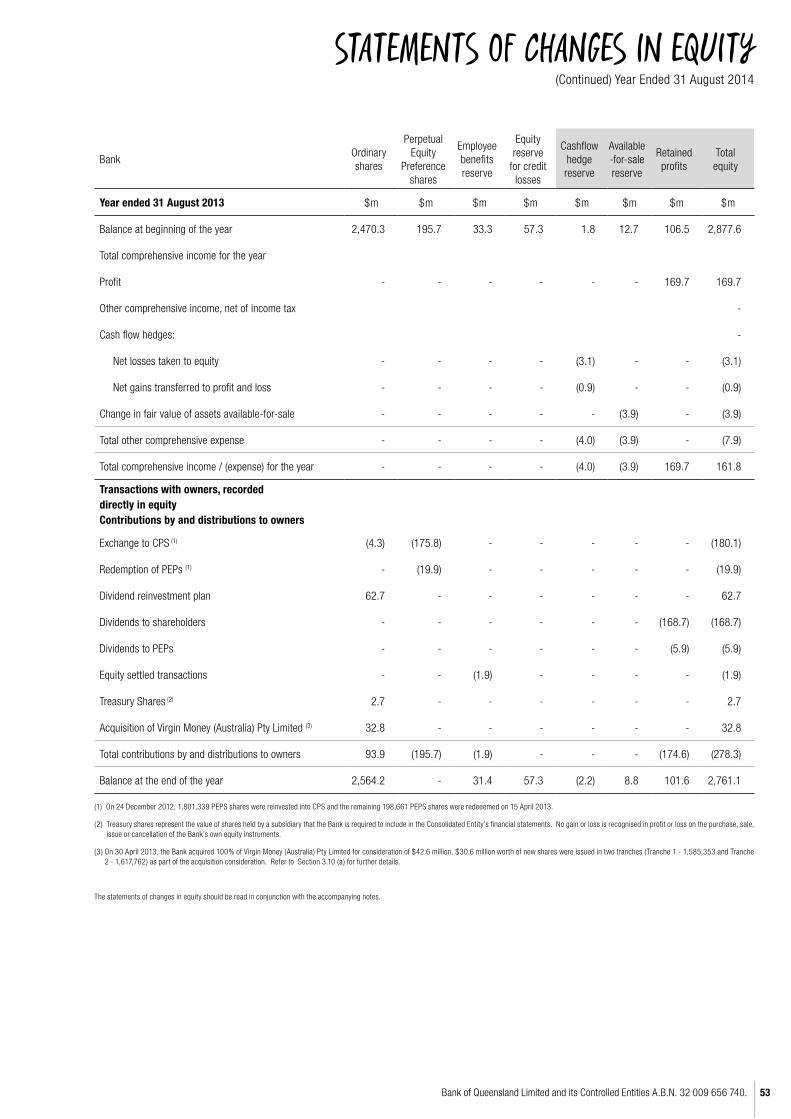
Bank of Queensland Limited and its Controlled Entities A.B.N. 32 009 656 740. 53
STATEMENTS OF CHANGES IN EQUITY(Continued) Year Ended 31 August 2014
BankOrdinary shares
Perpetual Equity
Preference shares
Employee benefits reserve
Equity reserve
for credit losses
Cashflow hedge reserve
Available -for-sale reserve
Retained profits
Total equity
Year ended 31 August 2013 $m $m $m $m $m $m $m $m
Balance at beginning of the year 2,470.3 195.7 33.3 57.3 1.8 12.7 106.5 2,877.6
Total comprehensive income for the year
Profit - - - - - - 169.7 169.7
Other comprehensive income, net of income tax -
Cash flow hedges: -
Net losses taken to equity - - - - (3.1) - - (3.1)
Net gains transferred to profit and loss - - - - (0.9) - - (0.9)
Change in fair value of assets available-for-sale - - - - - (3.9) - (3.9)
Total other comprehensive expense - - - - (4.0) (3.9) - (7.9)
Total comprehensive income / (expense) for the year - - - - (4.0) (3.9) 169.7 161.8
Transactions with owners, recorded directly in equityContributions by and distributions to owners
Exchange to CPS (1) (4.3) (175.8) - - - - - (180.1)
Redemption of PEPs (1) - (19.9) - - - - - (19.9)
Dividend reinvestment plan 62.7 - - - - - - 62.7
Dividends to shareholders - - - - - - (168.7) (168.7)
Dividends to PEPs - - - - - - (5.9) (5.9)
Equity settled transactions - - (1.9) - - - - (1.9)
Treasury Shares (2) 2.7 - - - - - - 2.7
Acquisition of Virgin Money (Australia) Pty Limited (3) 32.8 - - - - - - 32.8
Total contributions by and distributions to owners 93.9 (195.7) (1.9) - - - (174.6) (278.3)
Balance at the end of the year 2,564.2 - 31.4 57.3 (2.2) 8.8 101.6 2,761.1
(1) On 24 December 2012, 1,801,339 PEPS shares were reinvested into CPS and the remaining 198,661 PEPS shares were redeeemed on 15 April 2013.
(2) Treasury shares represent the value of shares held by a subsidiary that the Bank is required to include in the Consolidated Entity’s financial statements. No gain or loss is recognised in profit or loss on the purchase, sale, issue or cancellation of the Bank’s own equity instruments.
(3) On 30 April 2013, the Bank acquired 100% of Virgin Money (Australia) Pty Limited for consideration of $42.6 million. $30.6 million worth of new shares were issued in two tranches (Tranche 1 - 1,585,353 and Tranche 2 - 1,617,762) as part of the acquisition consideration. Refer to Section 3.10 (a) for further details.
The statements of changes in equity should be read in conjunction with the accompanying notes.

ANNUAL REPORT 201454
STATEMENTS OF CASH FLOWSYear Ended 31 August 2014
Section
Consolidated Bank
2014 $m
2013 $m
2014 $m
2013 $m
Cash flows from operating activities
Interest received 2,112.7 2,303.3 1,861.1 2,058.8
Fees and other income received 182.7 170.0 217.5 212.3
Dividends received 1.3 1.1 0.5 1.1
Interest paid (1,341.2) (1,604.4) (1,436.4) (1,701.1)
Cash paid to suppliers and employees (387.1) (393.0) (350.5) (367.3)
Operating income tax paid (80.0) (48.3) (77.1) (45.8)
488.4 428.7 215.1 158.0
(Increase) / decrease in operating assets:
Loans and advances at amortised cost (723.8) (966.9) (1,212.9) (1,037.1)
Other financial assets (243.5) 280.2 (55.2) 150.6
Increase / (decrease) in operating liabilities:
Deposits 1,920.5 543.8 2,289.7 509.6
Securitisation liabilities 3.5 (984.9) (65.2) - -
Net cash from operating activities 3.1 456.7 220.6 1,236.7 (218.9)
Cash flows from investing activities
Acquisition of BOQ Specialist Bank Limited (210.0) - (210.0) -
Acquisition of Virgin Money (Australia) Pty Limited - (5.9) - (5.9)
Cash acquired upon acquisition of BOQ Specialist Bank Limited 52.0 - - -
Payments for property, plant and equipment (31.0) (17.0) (22.3) (8.3)
Payments for intangible assets (51.7) (31.1) (47.9) (30.7)
Cash distribution received from equity accounted investments 4.3 2.4 - -
Capital contribution for equity accounted investments (0.2) (0.5) - -
Capital injection in BOQ Specialist Bank Limited - - (330.0) -
Proceeds from sale of property, plant and equipment 4.1 5.3 - 0.5
Net cash from investing activities (232.5) (46.8) (610.2) (44.4)
Cash flows from financing activities
Proceeds from issue of ordinary shares 400.6 - 400.6 -
Cost of capital issues (9.6) - (9.6) -
Proceeds from borrowings and foreign exchange instruments 719.7 1,631.2 719.8 1,631.0
Net proceeds from issue of Convertible Preference Shares (“CPS”) 3.5 - 111.8 - 111.8
Redemption of PEPS - (19.9) - (19.9)
Proceeds from other financing activities - - - 766.8
Repayment of other financing activities - - (429.7) (541.2)
Repayments of borrowings 3.5 (1,032.7) (1,582.3) (1,032.5) (1,582.1)
Payments for treasury shares (8.3) - (8.3) -
Dividends paid (133.5) (111.9) (133.5) (111.9)
Dividends received - - 21.5 23.3
Net cash from financing activities (63.8) 28.9 (471.7) 277.8
Net increase in cash and cash equivalents 160.4 202.7 154.8 14.5
Cash and liquid assets at beginning of year 873.2 670.5 242.2 227.7
Cash and liquid assets at end of year 3.1 1,033.6 873.2 397.0 242.2
The statements of cash flows should be read in conjunction with the accompanying notes.
Bank of Queensland Limited and its Controlled Entities A.B.N. 32 009 656 740. 55
NOTES TO THE FINANCIAL STATEMENTSYear Ended 31 August 2014
Section 1 Basis of preparation Page
1.1 Reporting entity 56
1.2 Basis of accounting 56
1.3 Use of estimates and judgements 56
Section 2 Financial performance
2.1 Operating income 57
2.2 Expenses 58
2.3 Income tax expense and deferred tax 59
2.4 Earnings per share 61
2.5 Dividends 62
2.6 Segment reporting 63
Section 3 Capital and balance sheet management
3.1 Cash and liquid assets 65
3.2 Deposits 66
3.3 Financial assets 66
3.4 Loans and advances at amortised cost 67
3.5 Borrowings including subordinated notes 69
3.6 Risk management 70
3.7 Financial instruments 80
3.8 Derivative financial instruments 84
3.9 Capital management 87
3.10 Capital and reserves 88
Section 4 Other assets and liabilities
4.1 Intangible assets 90
4.2 Provisions 92
Section 5 Insurance Business
5.1 Insurance business 93
Section 6 Other notes
6.1 Employee benefits 98
6.2 Commitments 99
6.3 Contingent liabilities 100
6.4 Related parties information 100
6.5 Controlled entities 102
6.6 Deed of cross guarantee 105
6.7 Investments in joint arrangements 107
6.8 Auditor’s remuneration 108
6.9 Events subsequent to balance date 108
6.10 Significant accounting policies and new accounting standards 109

ANNUAL REPORT 201456
NOTES TO THE FINANCIAL STATEMENTS(Continued) Year Ended 31 August 2014
SECTION 1. BASIS OF PREPARATION
1.1. REPORTING ENTITYBank of Queensland Limited (the “Bank”) is a company domiciled in Australia. The address of the Bank’s registered office is Level 17, 259 Queen Street, Brisbane, QLD, 4000 (+61 7 3336 2420). The consolidated financial report of the Bank for the financial year ended 31 August 2014 comprises the Bank and its subsidiaries (together referred to as the “Consolidated Entity”) and the Consolidated Entity’s interest in equity accounted investments. The Bank is a for-profit entity primarily involved in retail banking, leasing finance and insurance products.
1.2. BASIS OF ACCOUNTING
(a) Statement of compliance These general purpose financial statements have been prepared in accordance with Australian Accounting Standards and interpretations issued by the Australian Accounting Standards Board (“AASB”) and the Corporations Act 2001. The consolidated financial statements and notes thereto also comply with International Financial Reporting Standards (“IFRS”) as issued by the International Accounting Standards Board (“IASB”). The consolidated financial report was authorised for issue by the Directors on 8 October 2014.
(b) Basis of measurement The financial report is prepared on the historical cost basis with the exception of the following assets and liabilities which are stated at their fair value:
• derivative financial instruments;
• financial instruments designated at fair value;
• financial instruments classified as available-for-sale;
• assets and liabilities acquired through business combinations; and
• insurance policy liabilities.
(c) Functional and presentation currency The consolidated financial statements are presented in Australian dollars, which is the Bank’s functional currency.
(d) Rounding The Consolidated Entity is of a kind referred to in ASIC Class Order 98/100 dated 10 July 1998 and in accordance with that Class Order, amounts in this financial report and Directors’ report have been rounded off to the nearest million dollars, unless otherwise stated.
1.3. USE OF ESTIMATES AND JUDGEMENTS The preparation of a financial report in conformity with Australian Accounting Standards requires management to make judgements, estimates and assumptions that affect the application of policies and reported amounts of assets, liabilities, income and expenses. These estimates and associated assumptions are based on historical experience and various other factors that are believed to be reasonable under the circumstances, the results of which form the basis of making the judgements about carrying values of assets and liabilities that are not readily apparent from other sources. Actual results may differ from these estimates. These accounting policies have been consistently applied by each entity in the Consolidated Entity. The estimates and underlying assumptions are reviewed on an ongoing basis. Revisions to accounting estimates are recognised in the period in which the estimates are revised if the revision only affects that period, or in the period of the revision and future periods if the revision affects both current and future periods.
Information about significant areas of estimation uncertainty and critical judgements in applying accounting policies that have the most significant effect on the amounts recognised in the financial statements are described below:
• Provisions for impairment – Section 3.4; • Financial instruments – Section 3.7; • Intangible assets – Section 4.1; • Provisions – Section 4.2; • Insurance policy liabilities – Section 5.1; and • Contingent liabilities – Section 6.3.

Bank of Queensland Limited and its Controlled Entities A.B.N. 32 009 656 740. 57
NOTES TO THE FINANCIAL STATEMENTS(Continued) Year Ended 31 August 2014
SECTION 2. FINANCIAL PERFORMANCE 2.1. OPERATING INCOME
Consolidated Bank
2014
$m
2013
$m
2014
$m
2013
$m
Interest income
Loans and advances 1,916.6 2,084.3 1,603.0 1,765.0
Securities at fair value 195.4 213.1 423.1 471.6
Total interest income 2,112.0 2,297.4 2,026.1 2,236.6
Interest expense
Retail deposits 772.3 897.9 766.0 897.9
Wholesale deposits and borrowings 578.9 706.4 671.5 813.2
Total interest expense 1,351.2 1,604.3 1,437.5 1,711.1
Net interest income 760.8 693.1 588.6 525.5
Income from operating activities
Other customer fees and charges 101.0 102.1 99.4 101.9
Share of fee revenue paid to Owner Managed Branches (12.8) (14.2) (12.8) (14.2)
Securitisation income - - 72.5 55.7
Net income from financial instruments and derivatives at fair value 10.9 5.4 10.6 3.7
Commission 23.9 12.1 12.7 11.4
Management fee – controlled entities - - 23.7 24.9
Foreign exchange income – customer based 8.7 7.5 8.6 7.5
Net profit / (loss) on sale of property, plant and equipment (2.4) 3.2 (4.8) 0.1
Other income 6.9 6.4 24.0 27.8
136.2 122.5 233.9 218.8
Other operating income 136.2 122.5 233.9 218.8
Net insurance operating income 41.6 40.3 - -
Total operating income 938.6 855.9 822.5 744.3
Revenue - Accounting policy
Interest income and expense
Interest income and expense for all interest bearing financial instruments are recognised in the profit or loss using the effective interest rates of the financial assets or financial liabilities to which they relate.
Other operating income
Other operating income and expense (e.g. lending fees) that are considered an integral part of the effective interest rate on a financial asset or liability are included in the measurement of the effective interest rate. Non-yield related application and activation lending fee revenue is recognised when the loan is dis-bursed or the commitment to lend expires. Service fees that represent the recoupment of the costs of providing the service are recognised on an accruals basis when the service is provided.
Dividends are recognised when control of a right to receive consideration is established.

ANNUAL REPORT 201458
NOTES TO THE FINANCIAL STATEMENTS(Continued) Year Ended 31 August 2014
2.2. EXPENSESConsolidated Bank
2014
$m
2013
$m
2014
$m
2013
$m
Operating expenses
Advertising 16.9 12.4 13.4 11.8
Commissions to Owner Managed Branches 6.8 8.7 6.6 9.2
Communications and postage 20.1 22.5 19.4 21.3
Printing and stationery 4.6 4.0 4.3 3.8
Non-lending losses 33.7 47.5 33.6 47.5
Processing costs 25.4 25.0 25.4 25.0
Other 17.3 15.0 13.2 12.2
124.8 135.1 115.9 130.8
Administrative expenses
Professional fees 15.5 20.4 13.3 17.9
Directors fees 2.0 1.6 1.8 1.1
Other 6.4 8.3 10.3 9.3
23.9 30.3 25.4 28.3
IT expenses
Data processing 65.3 61.1 60.9 58.2
Amortisation and impairment – computer software (intangible) 14.7 18.6 12.9 16.5
Depreciation – IT equipment 1.3 1.5 0.8 0.8
81.3 81.2 74.6 75.5
Occupancy expenses
Lease rental 29.3 21.9 25.8 19.9
Depreciation - plant, furniture, equipment and leasehold improvements 7.5 7.7 7.1 6.5
Other 2.9 2.5 2.8 2.4
39.7 32.1 35.7 28.8
Employee expenses
Salaries and wages 149.7 144.5 129.7 123.7
Superannuation contributions 14.0 11.9 12.4 10.5
Amounts set aside to provision for employee entitlements 4.0 1.7 3.1 1.8
Payroll tax 10.4 8.4 9.0 7.1
Equity settled transactions 8.5 5.2 7.8 4.6
Other 7.2 7.0 6.8 6.4
193.8 178.7 168.8 154.1
Other
Amortisation – acquired intangibles 5.9 8.1 1.0 1.4
Expenses 469.4 465.5 421.4 418.9

Bank of Queensland Limited and its Controlled Entities A.B.N. 32 009 656 740. 59
NOTES TO THE FINANCIAL STATEMENTS(Continued) Year Ended 31 August 2014
2.3. INCOME TAX EXPENSE AND DEFERRED TAX
Income tax expense
The major components of income tax expense for the years ended 31 August 2014 and 2013 along with a reconciliation between pre-tax profit and tax expense are detailed below:
Consolidated Bank
2014
$m
2013
$m
2014
$m
2013
$m
Current tax expense
Current year 140.4 75.3 112.0 58.0
Adjustments for prior years (8.4) (3.2) (5.9) (1.8)
132.0 72.1 106.1 56.2
Deferred tax expense
Origination and reversal of temporary differences (9.5) 17.9 (5.4) 12.3
(9.5) 17.9 (5.4) 12.3
Total income tax expense 122.5 90.0 100.7 68.5
Attributable to:
Continuing operations 122.5 90.0 100.7 68.5
Deferred tax recognised in equity
Equity raising costs (2.9) - (2.9) -
Cash flow hedge reserve (8.9) 5.1 (9.5) (1.3)
Other 11.3 (1.8) 12.2 (1.7)
(0.5) 3.3 (0.2) (3.0)
Numerical reconciliations between tax expense and pre-tax profit
Profit before tax – continuing operations 383.0 275.8 338.3 238.2
Profit before tax 383.0 275.8 338.3 238.2
Income tax using the domestic corporate tax rate of 30% (2013: 30%) 114.9 82.7 101.5 71.5
Increase in income tax expense due to:
Non-deductible expenses 9.5 8.3 6.6 4.8
Decrease in income tax expense due to:
Other (1) (0.9) (0.4) (6.4) (7.3)
123.5 90.6 101.7 69.0
Under / (Over) provided in prior years (1.0) (0.6) (1.0) (0.5)
Income tax expense on pre-tax net profit 122.5 90.0 100.7 68.5
(1) In the Bank, this includes the impact of dividends received from subsidiary Group members which are eliminated at a Group level and franking credits.

ANNUAL REPORT 201460
NOTES TO THE FINANCIAL STATEMENTS(Continued) Year Ended 31 August 2014
2.3. INCOME TAX EXPENSE AND DEFERRED TAX (CONTINUED)Recognised deferred tax assets and liabilitiesDeferred tax assets and liabilities are attributable to the following:
Assets Liabilities Net
Consolidated
2014
$m
2013
$m
2014
$m
2013
$m
2014
$m
2013
$m
Accruals 5.3 5.0 - - 5.3 5.0
Capitalised expenditure - - (3.2) (11.4) (3.2) (11.4)
Provision for impairment 94.5 104.1 - - 94.5 104.1
Other provisions 22.9 10.3 - - 22.9 10.3
Equity reserves - - (5.9) (3.6) (5.9) (3.6)
Other 7.4 7.0 (8.8) (6.9) (1.4) 0.1
Tax assets / (liabilities) 130.1 126.4 (17.9) (21.9) 112.2 104.5
Bank
Accruals 2.3 3.1 - - 2.3 3.1
Capitalised expenditure - - (1.1) (9.6) (1.1) (9.6)
Provision for impairment 81.5 91.3 - - 81.5 91.3
Other provisions 19.5 9.6 - - 19.5 9.6
Equity reserves - - (5.3) (2.7) (5.3) (2.7)
Other 7.9 6.9 (3.5) (3.1) 4.4 3.8
Tax assets / (liabilities) 111.2 110.9 (9.9) (15.4) 101.3 95.5
Income tax - Accounting policy
Income tax expense comprises current and deferred tax. Income tax is recognised in profit or loss in the Income Statement except to the extent that it relates to items recognised directly in equity, or other comprehensive income.Current tax is the expected tax payable / receivable on the taxable income / loss for the year and any adjustment to the tax payable / receivable in respect of previous years. It is measured using tax rates enacted or substantially enacted at the reporting date.Deferred tax is recognised in respect of temporary differences between the carrying amounts of assets and liabilities for financial reporting purposes and the amounts used for taxation purposes. Deferred tax assets are recognised for unused tax losses and deductible temporary differences to the extent that it is probable that future taxable profits will be available against which they can be utilised. Deferred tax assets are reviewed at each reporting date and are reduced to the extent that it is no longer probable that the related tax benefit will be realised.Deferred tax is measured at the tax rates that are expected to be applied to temporary differences when they reverse, using tax rates enacted or substantially enacted at the reporting date. The measurement of deferred tax reflects the tax consequences that would follow the manner in which the Consolidated Entity expects, at the reporting date, to recover or settle the carrying amount of its assets and liabilities.
Tax Consolidation
The Bank is the head entity in the tax consolidated group comprising all the Australian wholly-owned subsidiaries. The implementation date for the tax-consolidated group was 1 September 2003.Current tax expense / income, deferred tax liabilities and deferred tax assets arising from temporary differences of the members of the tax-consolidated group are recognised in the separate financial statements of the members of the tax-consolidated group using a ‘group allocation’ approach by reference to the carrying amounts in the separate financial statements of each entity and the tax values applying under tax consolidation.Any current tax liabilities (or assets) and deferred tax assets arising from unused tax losses of the subsidiaries is assumed by the head entity in the tax-consolidated group and are recognised as amounts payable / (receivable) to / (from) other entities in the tax-consolidated group in conjunction with any tax funding arrangement amounts (refer below). Any difference between these amounts is recognised by the Bank as an equity contribution, or distribution from the subsidiary.Any subsequent period amendments to deferred tax assets arising from unused tax losses as a result of revised assessment of the probability of recoverability is recognised by the head entity only.

Bank of Queensland Limited and its Controlled Entities A.B.N. 32 009 656 740. 61
NOTES TO THE FINANCIAL STATEMENTS(Continued) Year Ended 31 August 2014
2.3. INCOME TAX EXPENSE AND DEFERRED TAX (CONTINUED)
Nature of tax funding and tax sharing arrangements
The Bank, in conjunction with other members of the tax-consolidated group, has entered into a tax funding agreement which sets out the funding obligations of members of the tax-consolidated group in respect of tax amounts. The tax funding agreement requires payments to / from the head entity equal to the current tax liability (asset) assumed by the head entity and any tax-loss deferred tax asset assumed by the head entity, resulting in the Bank recognising an inter-entity payable (receivable) equal in amount to the tax liability (asset) assumed. Contributions to fund the current tax liabilities are payable as per the Tax Funding Arrangement and reflect the timing of the head entity’s obligation to make payments for tax liabilities to the relevant tax authorities.The Bank, in conjunction with other members of the tax-consolidated group, has also entered into a Tax Sharing Agreement (“TSA”). The TSA provides for the determination of the allocation of income tax liabilities between the entities should the head entity default on its tax payment obligations. No amounts have been recognised in the financial statements in respect of this agreement as payment of any amounts under the TSA is considered remote.
Taxation of Financial Arrangements (“TOFA”)
TOFA began to apply to the tax-consolidated group on 1 July 2010. The regime aims to align the tax and accounting treatment of financial arrangements.The tax-consolidated group made a transitional election to bring pre-existing arrangements into TOFA. The deferred tax in relation to the transitional adjustment that this created was fully amortised in the 31 August 2014 financial year.
2.4. EARNINGS PER SHARE
Basic Earnings Per Share (“EPS”) is calculated by dividing the relevant earnings by the average weighted number of shares on issue. Diluted EPS takes into account the dilutive effect of all outstanding share rights vesting as ordinary shares.
Consolidated
2014
cents
2013 (2)
cents
Basic earnings per share - Ordinary shares (cents) 77.4 57.6
Diluted earnings per share - Ordinary shares (cents) 75.9 56.5
Earnings reconciliation $m $m
Net profit 260.5 185.8
Less other equity instrument dividends (1) - (2.7)
Basic earnings 260.5 183.1
Effect of PEPS (1) - 2.7
Effect of distributions on CPS 16.4 11.8
Effect of convertible notes - 0.6
Diluted earnings 276.9 198.2
Weighted average number of shares used as the denominator
2014
Number
2013
Number
Number for basic earnings per share
Ordinary shares 336,579,927 317,717,540
Number for diluted earnings per share
Ordinary shares 336,579,927 317,717,540
Effect of award rights 2,930,399 2,414,842
Effect of PEPS - 7,360,404
Effect of CPS 25,448,063 21,988,604
Effect of convertible notes - 1,277,927
364,958,389 350,759,317
(1) PEPS distribution on an accrual basis.(2) Comparatives for basic and diluted earnings per share have been adjusted for the effect of the rights issue that occurred during the current financial year.
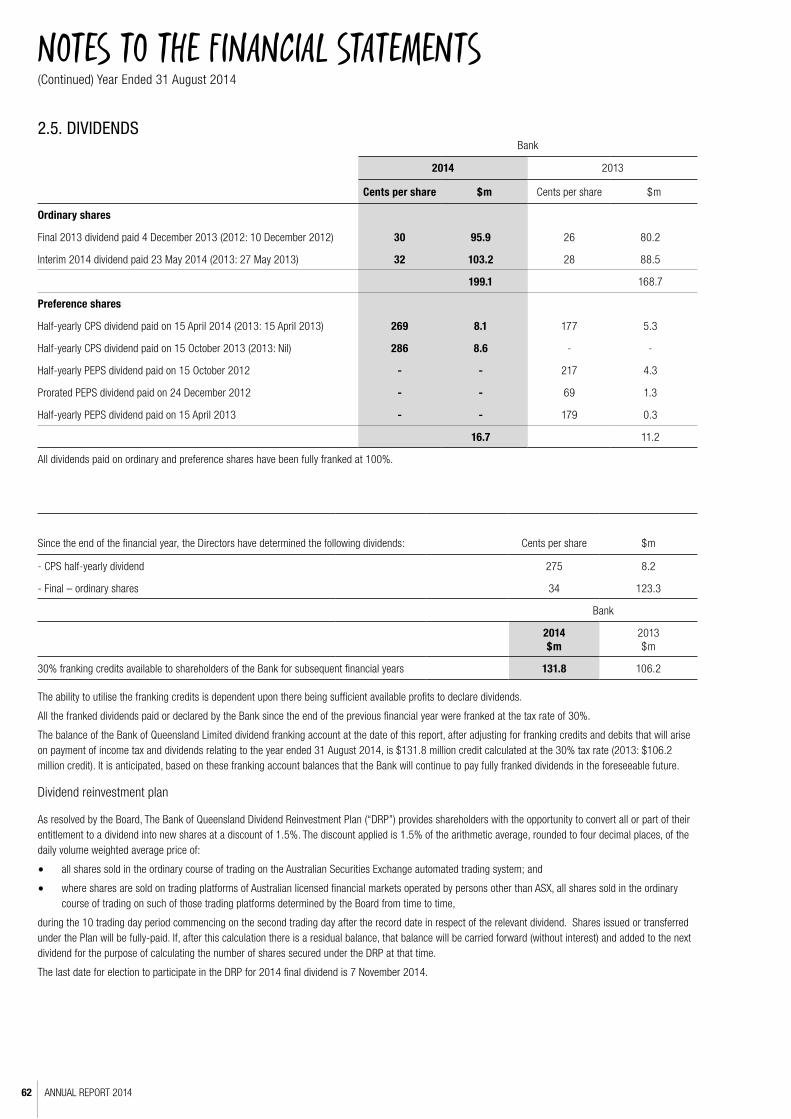
ANNUAL REPORT 201462
NOTES TO THE FINANCIAL STATEMENTS(Continued) Year Ended 31 August 2014
2.5. DIVIDENDSBank
2014 2013
Cents per share $m Cents per share $m
Ordinary shares
Final 2013 dividend paid 4 December 2013 (2012: 10 December 2012) 30 95.9 26 80.2
Interim 2014 dividend paid 23 May 2014 (2013: 27 May 2013) 32 103.2 28 88.5
199.1 168.7
Preference shares
Half-yearly CPS dividend paid on 15 April 2014 (2013: 15 April 2013) 269 8.1 177 5.3
Half-yearly CPS dividend paid on 15 October 2013 (2013: Nil) 286 8.6 - -
Half-yearly PEPS dividend paid on 15 October 2012 - - 217 4.3
Prorated PEPS dividend paid on 24 December 2012 - - 69 1.3
Half-yearly PEPS dividend paid on 15 April 2013 - - 179 0.3
16.7 11.2
All dividends paid on ordinary and preference shares have been fully franked at 100%.
Since the end of the financial year, the Directors have determined the following dividends: Cents per share $m
- CPS half-yearly dividend 275 8.2
- Final – ordinary shares 34 123.3
Bank
2014$m
2013$m
30% franking credits available to shareholders of the Bank for subsequent financial years 131.8 106.2
The ability to utilise the franking credits is dependent upon there being sufficient available profits to declare dividends.
All the franked dividends paid or declared by the Bank since the end of the previous financial year were franked at the tax rate of 30%.
The balance of the Bank of Queensland Limited dividend franking account at the date of this report, after adjusting for franking credits and debits that will arise on payment of income tax and dividends relating to the year ended 31 August 2014, is $131.8 million credit calculated at the 30% tax rate (2013: $106.2 million credit). It is anticipated, based on these franking account balances that the Bank will continue to pay fully franked dividends in the foreseeable future.
Dividend reinvestment plan
As resolved by the Board, The Bank of Queensland Dividend Reinvestment Plan (“DRP”) provides shareholders with the opportunity to convert all or part of their entitlement to a dividend into new shares at a discount of 1.5%. The discount applied is 1.5% of the arithmetic average, rounded to four decimal places, of the daily volume weighted average price of:
• all shares sold in the ordinary course of trading on the Australian Securities Exchange automated trading system; and
• where shares are sold on trading platforms of Australian licensed financial markets operated by persons other than ASX, all shares sold in the ordinary course of trading on such of those trading platforms determined by the Board from time to time,
during the 10 trading day period commencing on the second trading day after the record date in respect of the relevant dividend. Shares issued or transferred under the Plan will be fully-paid. If, after this calculation there is a residual balance, that balance will be carried forward (without interest) and added to the next dividend for the purpose of calculating the number of shares secured under the DRP at that time.
The last date for election to participate in the DRP for 2014 final dividend is 7 November 2014.

Bank of Queensland Limited and its Controlled Entities A.B.N. 32 009 656 740. 63
NOTES TO THE FINANCIAL STATEMENTS(Continued) Year Ended 31 August 2014
2.6. SEGMENT REPORTING
Segment informationThe Bank determines and presents operating segments based on the information that is provided internally to the Managing Director, who is the Bank’s Chief Operating Decision Maker. An operating segment is a component of the Bank that engages in business activities from which it may earn revenues and incur expenses, including revenues and expenses that relate to transactions with any of the Bank’s other components. All operating segments’ operating results are regularly reviewed by the Bank’s Managing Director to make decisions about resources to be allocated to the segment and assess its performance, and for which discrete financial information is available. Segment results that are reported to the Managing Director include items directly attributable to a segment as well as those that can be allocated on a reasonable basis. The Bank has determined and presented the following two segments based on information provided to the Chief Operating Decision Maker.Banking Retail banking, commercial, personal, small business loans, equipment, debtor finance, treasury, savings and transaction accounts.
Insurance Consumer credit insurance, life insurance, accidental death insurance, funeral insurance and motor vehicle gap insurance.
Management monitors the operating results of its business units separately for the purpose of making decisions about resource allocation and performance assessment. Segment performance is evaluated based on operating profit or loss which in certain respects is measured differently from operating profit or loss in the consolidated financial statements. Income taxes are managed within the individual operating segments and thus disclosed this way.
Transfer prices between operating segments are on an arm’s length basis in a manner similar to transactions with third parties.
No revenue from transactions with a single external customer or counterparty amounted to 10% or more of the Bank’s total revenue in 2014 or 2013.
The Consolidated Entity’s business segments operate principally in Australia.
The following table presents income and profit and certain asset and liability information regarding the Bank’s operating segments.
Banking Insurance Segment Total
2014$m
2013 (1)
$m2014$m
2013 (1)
$m2014$m
2013 (1)
$m
Income
External 897.4 816.5 41.2 39.4 938.6 855.9
Inter-segment 4.5 5.7 (1.5) (0.7) 3.0 5.0
Total operating income 901.9 822.2 39.7 38.7 941.6 860.9
Segment profit before income tax 351.8 248.7 31.2 27.1 383.0 275.8
Income tax expense 113.1 81.9 9.4 8.1 122.5 90.0
Segment profit after income tax 238.7 166.8 21.8 19.0 260.5 185.8
Results
Interest income 2,112.0 2,297.4 - - 2,112.0 2,297.4
Interest expense 1,351.2 1,604.3 - - 1,351.2 1,604.3
Depreciation and amortisation 23.5 27.8 - - 23.5 27.8
Impairment losses 86.2 114.6 - - 86.2 114.6
Assets 46,834.4 42,438.1 125.8 122.9 46,960.2 42,561.0
Liabilities 43,528.9 39,657.4 86.1 82.7 43,615.0 39,740.1
(1) The prior year has been restated so that the amounts are comparable to the current year.

ANNUAL REPORT 201464
NOTES TO THE FINANCIAL STATEMENTS(Continued) Year Ended 31 August 2014
2.6. SEGMENT REPORTING (CONTINUED)
The following table sets out the reconciliation between the operating segments and the consolidated entity:
2014$m
2013 (1)
$m2014$m
2013 (1)
$m
Revenue Profit before tax
Segment total 941.6 861.6 383.0 275.8
Elimination of inter-segment revenue (3.0) (5.7) - -
Consolidated total 938.6 855.9 383.0 275.8
Assets Liabilities
Segment total 46,960.2 42,561.0 43,615.0 39,740.1
Elimination of inter-segment bank accounts (55.1) (33.9) (55.1) (33.9)
Adjustment for other consolidation eliminations (0.5) 1.2 4.2 4.3
Consolidated total 46,904.6 42,528.3 43,564.1 39,710.5
(1) The prior year has been restated so that the amounts are comparable to the current year.
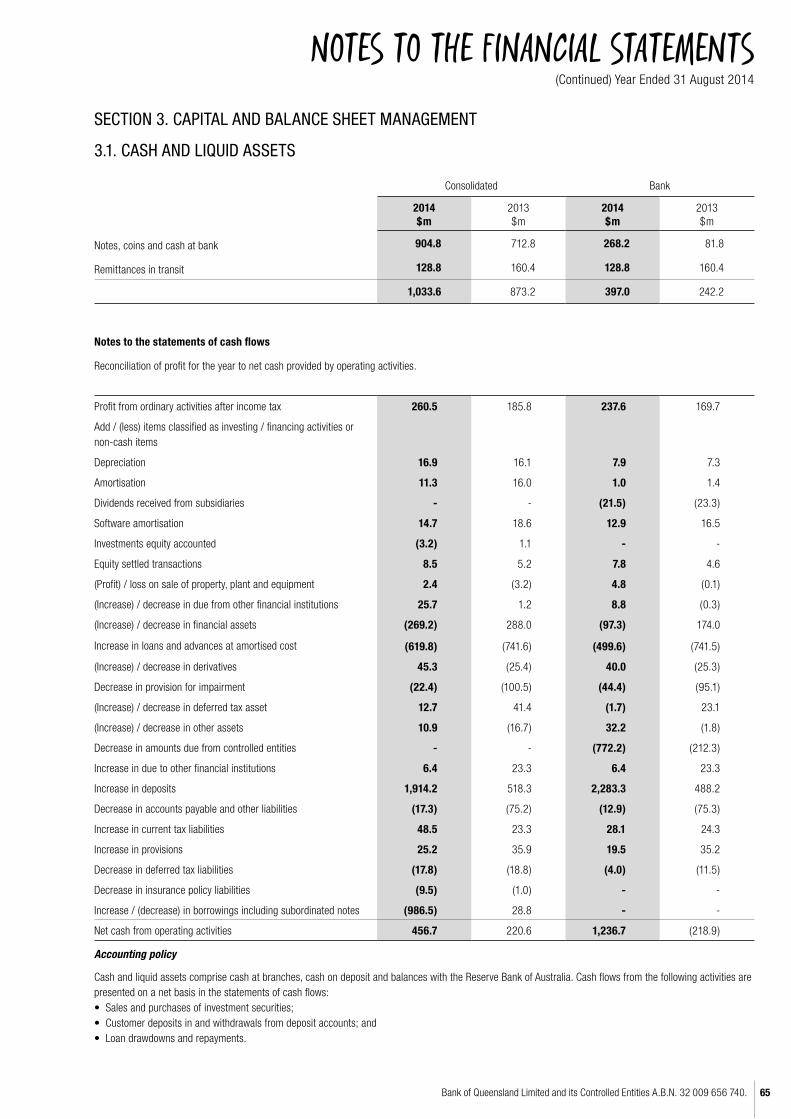
Bank of Queensland Limited and its Controlled Entities A.B.N. 32 009 656 740. 65
NOTES TO THE FINANCIAL STATEMENTS(Continued) Year Ended 31 August 2014
SECTION 3. CAPITAL AND BALANCE SHEET MANAGEMENT
3.1. CASH AND LIQUID ASSETS
Consolidated Bank
2014 $m
2013 $m
2014 $m
2013 $m
Notes, coins and cash at bank 904.8 712.8 268.2 81.8
Remittances in transit 128.8 160.4 128.8 160.4
1,033.6 873.2 397.0 242.2
Notes to the statements of cash flows
Reconciliation of profit for the year to net cash provided by operating activities.
Profit from ordinary activities after income tax 260.5 185.8 237.6 169.7
Add / (less) items classified as investing / financing activities or non-cash items
Depreciation 16.9 16.1 7.9 7.3
Amortisation 11.3 16.0 1.0 1.4
Dividends received from subsidiaries - - (21.5) (23.3)
Software amortisation 14.7 18.6 12.9 16.5
Investments equity accounted (3.2) 1.1 - -
Equity settled transactions 8.5 5.2 7.8 4.6
(Profit) / loss on sale of property, plant and equipment 2.4 (3.2) 4.8 (0.1)
(Increase) / decrease in due from other financial institutions 25.7 1.2 8.8 (0.3)
(Increase) / decrease in financial assets (269.2) 288.0 (97.3) 174.0
Increase in loans and advances at amortised cost (619.8) (741.6) (499.6) (741.5)
(Increase) / decrease in derivatives 45.3 (25.4) 40.0 (25.3)
Decrease in provision for impairment (22.4) (100.5) (44.4) (95.1)
(Increase) / decrease in deferred tax asset 12.7 41.4 (1.7) 23.1
(Increase) / decrease in other assets 10.9 (16.7) 32.2 (1.8)
Decrease in amounts due from controlled entities - - (772.2) (212.3)
Increase in due to other financial institutions 6.4 23.3 6.4 23.3
Increase in deposits 1,914.2 518.3 2,283.3 488.2
Decrease in accounts payable and other liabilities (17.3) (75.2) (12.9) (75.3)
Increase in current tax liabilities 48.5 23.3 28.1 24.3
Increase in provisions 25.2 35.9 19.5 35.2
Decrease in deferred tax liabilities (17.8) (18.8) (4.0) (11.5)
Decrease in insurance policy liabilities (9.5) (1.0) - -
Increase / (decrease) in borrowings including subordinated notes (986.5) 28.8 - -
Net cash from operating activities 456.7 220.6 1,236.7 (218.9)
Accounting policy
Cash and liquid assets comprise cash at branches, cash on deposit and balances with the Reserve Bank of Australia. Cash flows from the following activities are presented on a net basis in the statements of cash flows:• Sales and purchases of investment securities;• Customer deposits in and withdrawals from deposit accounts; and• Loan drawdowns and repayments.

ANNUAL REPORT 201466
NOTES TO THE FINANCIAL STATEMENTS(Continued) Year Ended 31 August 2014
3.2. DEPOSITSConsolidated Bank
2014 $m
2013 $m
2014 $m
2013 $m
Deposits at call 10,885.4 10,252.1 10,936.6 10,306.3
Term deposits 19,631.0 16,857.9 17,835.4 16,890.5
Certificates of deposit 5,419.4 4,588.7 5,296.7 4,588.7
Total 35,935.8 31,698.7 34,068.7 31,785.5
Concentration of deposits:
Retail deposits 26,614.7 23,968.0 24,811.3 24,022.2
Wholesale deposits 9,321.1 7,730.7 9,257.4 7,763.3
Total 35,935.8 31,698.7 34,068.7 31,785.5
3.3. FINANCIAL ASSETSConsolidated Bank
2014
$m
2013
$m
2014
$m
2013
$m
Held for trading
Floating rate notes and bonds 949.5 931.8 949.5 931.8
Negotiable certificates of deposit 1,448.7 2,812.3 1,448.7 2,812.3
Deposits at call - 176.0 - 176.0
Bank accepted bills - 377.6 - 377.6
Promissory notes 74.9 36.9 74.9 36.9
2,473.1 4,334.6 2,473.1 4,334.6
Available-for-sale
Debt instruments 3,854.8 1,057.0 3,339.4 1,258.6
Unlisted equity instruments 9.6 9.8 9.5 9.8
3,864.4 1,066.8 3,348.9 1,268.4
Total financial assets 6,337.5 5,401.4 5,822.0 5,603.0

Bank of Queensland Limited and its Controlled Entities A.B.N. 32 009 656 740. 67
NOTES TO THE FINANCIAL STATEMENTS(Continued) Year Ended 31 August 2014
3.4. LOANS AND ADVANCES AT AMORTISED COSTConsolidated Bank
2014
$m
2013
$m
2014
$m
2013
$m
Residential property loans – secured by mortgages 19,284.5 18,577.0 19,124.9 18,577.0
Securitised residential property loans – secured by mortgages 7,224.1 7,571.9 7,223.3 7,571.9
Total residential property loans – secured by mortgages 26,508.6 26,148.9 26,348.2 26,148.9
Personal loans 288.2 180.7 161.6 180.7
Overdrafts 330.2 387.3 330.2 387.3
Commercial loans 7,174.2 5,079.4 5,425.7 5,049.3
Credit cards 53.6 - - -
Leasing finance 4,527.0 3,909.6 - -
Gross loans and advances at amortised cost 38,881.8 35,705.9 32,265.7 31,766.2
Less:
Unearned lease finance income (456.3) (404.3) - -
Specific provision for impairment (152.7) (174.8) (127.6) (162.7)
Collective provision for impairment (137.3) (137.5) (102.9) (112.3)
Total loans and advances at amortised cost 38,135.5 34,989.3 32,035.2 31,491.2
Accounting policyLoans and advances at amortised cost Loans and advances are originated by the Bank and are recognised upon cash being advanced to the borrower. Loans and advances are initially recognised at fair value plus incremental direct transaction costs and subsequently measured at each reporting date at amortised cost using the effective interest method. Refer to the table below for impairment of loans and advances.
Provision for impairmentConsolidated Bank
2014
$m
2013
$m
2014
$m
2013
$m
Specific provision:
Balance at the beginning of the year 174.8 220.3 162.7 204.3
Add: Expensed during the year 93.5 151.6 69.6 122.6
Acquired during the year 7.6 - - -
Less: Bad debts written off net of recoveries (115.7) (195.1) (97.6) (162.8)
Transfers from collective provision 2.5 14.5 2.5 14.5
Unwind of discount (10.0) (16.5) (9.6) (15.9)
Balance at the end of the year 152.7 174.8 127.6 162.7
Collective provision:
Balance at the beginning of the year 137.5 192.6 112.3 165.8
Add: Released during the year (7.3) (37.0) (6.8) (35.4)
Acquired during the year 6.9 - - -
Impairment losses provided for / (written off) 2.7 (3.6) (0.1) (3.6)
Transfers to specific provision (2.5) (14.5) (2.5) (14.5)
Balance at the end of the year 137.3 137.5 102.9 112.3
Total provisions for impairment 290.0 312.3 230.5 275.0

ANNUAL REPORT 201468
NOTES TO THE FINANCIAL STATEMENTS(Continued) Year Ended 31 August 2014
3.4. LOANS AND ADVANCES AT AMORTISED COST (CONTINUED)Transfer of financial assetsThe Bank conducts a loan securitisation program whereby mortgage loans are packaged and sold to the REDS Securitisation and Warehouse Trusts (“RMBS Trusts”). The Bank also securitises Hire Purchase, Chattel Mortgages and Finance Leases which are packaged and sold to REDS EHP Securitisation Trusts (“REDS EHP Trusts”). Refer to Section 6.10 (a)(ii) for further information. The following table sets out the transferred financial assets that did not qualify for derecognition and associated liabilities from conducting the securitisation program.
Consolidated Bank
2014
$m
2013
$m
2014
$m
2013
$m
Transferred financial assets
Loans and advances at amortised cost 4,751.6 4,564.5 4,250.1 4,564.5
Lease receivables 613.2 899.1 - -
5,364.8 5,463.6 4,250.1 4,564.5
Associated financial liabilities
Securitisation liabilities - external investors 5,516.3 5,836.0 - -
Amounts due to controlled entities - - 4,367.9 4,865.8
5,516.3 5,836.0 4,367.9 4,865.8
For those liabilities that have recourse only to transferred assets:
Fair value of transferred assets 5,378.5 5,497.3 4,259.0 4,575.5
Fair value of associated liabilities (5,516.3) (5,836.0) (4,367.9) (4,865.8)
Net Position (137.8) (338.7) (108.9) (290.3)
Lease receivablesLoans and advances at amortised cost include the following finance lease receivables for leases of certain property and equipment where the Bank is the lessor.
Consolidated Bank
2014
$m
2013
$m
2014
$m
2013
$m
Gross investment in finance lease receivables:
Less than one year 1,679.3 1,572.6 - -
Between one and five years 2,758.9 2,312.1 - -
More than five years 88.8 24.9 - -
4,527.0 3,909.6 - -
Unearned lease finance income (456.3) (404.3) - -
Net investment in finance leases 4,070.7 3,505.3 - -
The net investment in finance leases comprise:
Less than one year 1,478.6 1,370.0 - -
Between one and five years 2,539.4 2,112.6 - -
More than five years 52.7 22.7 - -
4,070.7 3,505.3 - -
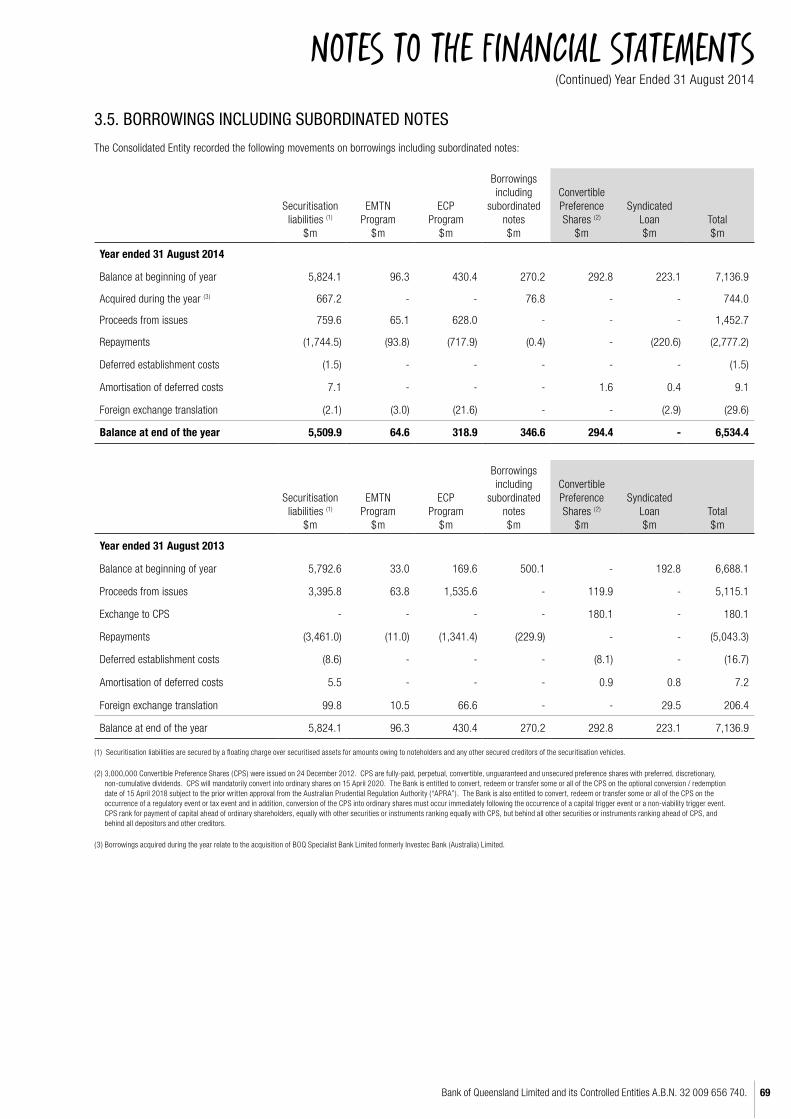
Bank of Queensland Limited and its Controlled Entities A.B.N. 32 009 656 740. 69
NOTES TO THE FINANCIAL STATEMENTS(Continued) Year Ended 31 August 2014
3.5. BORROWINGS INCLUDING SUBORDINATED NOTES
The Consolidated Entity recorded the following movements on borrowings including subordinated notes:
Securitisation liabilities (1)
$m
EMTN Program
$m
ECP Program
$m
Borrowings including
subordinated notes$m
Convertible Preference Shares (2)
$m
Syndicated Loan$m
Total$m
Year ended 31 August 2014
Balance at beginning of year 5,824.1 96.3 430.4 270.2 292.8 223.1 7,136.9
Acquired during the year (3) 667.2 - - 76.8 - - 744.0
Proceeds from issues 759.6 65.1 628.0 - - - 1,452.7
Repayments (1,744.5) (93.8) (717.9) (0.4) - (220.6) (2,777.2)
Deferred establishment costs (1.5) - - - - - (1.5)
Amortisation of deferred costs 7.1 - - - 1.6 0.4 9.1
Foreign exchange translation (2.1) (3.0) (21.6) - - (2.9) (29.6)
Balance at end of the year 5,509.9 64.6 318.9 346.6 294.4 - 6,534.4
Securitisation liabilities (1)
$m
EMTN Program
$m
ECP Program
$m
Borrowings including
subordinated notes$m
Convertible Preference Shares (2)
$m
Syndicated Loan$m
Total$m
Year ended 31 August 2013
Balance at beginning of year 5,792.6 33.0 169.6 500.1 - 192.8 6,688.1
Proceeds from issues 3,395.8 63.8 1,535.6 - 119.9 - 5,115.1
Exchange to CPS - - - - 180.1 - 180.1
Repayments (3,461.0) (11.0) (1,341.4) (229.9) - - (5,043.3)
Deferred establishment costs (8.6) - - - (8.1) - (16.7)
Amortisation of deferred costs 5.5 - - - 0.9 0.8 7.2
Foreign exchange translation 99.8 10.5 66.6 - - 29.5 206.4
Balance at end of the year 5,824.1 96.3 430.4 270.2 292.8 223.1 7,136.9
(1) Securitisation liabilities are secured by a floating charge over securitised assets for amounts owing to noteholders and any other secured creditors of the securitisation vehicles.
(2) 3,000,000 Convertible Preference Shares (CPS) were issued on 24 December 2012. CPS are fully-paid, perpetual, convertible, unguaranteed and unsecured preference shares with preferred, discretionary, non-cumulative dividends. CPS will mandatorily convert into ordinary shares on 15 April 2020. The Bank is entitled to convert, redeem or transfer some or all of the CPS on the optional conversion / redemption date of 15 April 2018 subject to the prior written approval from the Australian Prudential Regulation Authority (“APRA”). The Bank is also entitled to convert, redeem or transfer some or all of the CPS on the occurrence of a regulatory event or tax event and in addition, conversion of the CPS into ordinary shares must occur immediately following the occurrence of a capital trigger event or a non-viability trigger event. CPS rank for payment of capital ahead of ordinary shareholders, equally with other securities or instruments ranking equally with CPS, but behind all other securities or instruments ranking ahead of CPS, and behind all depositors and other creditors.
(3) Borrowings acquired during the year relate to the acquisition of BOQ Specialist Bank Limited formerly Investec Bank (Australia) Limited.

ANNUAL REPORT 201470
NOTES TO THE FINANCIAL STATEMENTS(Continued) Year Ended 31 August 2014
3.5. BORROWINGS INCLUDING SUBORDINATED NOTES (CONTINUED)
The Bank recorded the following movements on borrowings including subordinated notes:
EMTN Program
$m
ECP Program
$m
Borrowings including subordinated notes (1)
$m
Convertible Preference Shares(2)
$m
Syndicated Loan$m
Total$m
Year ended 31 August 2014
Balance at beginning of year 96.3 430.4 270.2 292.8 223.1 1,312.8
Proceeds from issues 65.1 628.0 - - - 693.1
Repayments (93.8) (717.9) (0.2) - (220.6) (1,032.5)
Amortisation of deferred costs - - - 1.6 0.4 2.0
Foreign exchange translation (3.0) (21.6) - - (2.9) (27.5)
Balance at end of the year 64.6 318.9 270.0 294.4 - 947.9
EMTN Program
$m
ECP Program
$m
Borrowings including subordinated notes (1)
$m
Convertible Preference Shares(2)
$m
Syndicated Loan$m
Total$m
Year ended 31 August 2013
Balance at beginning of year 33.0 169.6 499.9 - 192.8 895.3
Proceeds from issues 63.8 1,535.6 - 119.9 - 1,719.3
Exchange to CPS - - - 180.1 - 180.1
Repayments (11.0) (1,341.4) (229.7) - - (1,582.1)
Deferred establishment costs - - - (8.1) - (8.1)
Amortisation of deferred costs - - - 0.9 0.8 1.7
Foreign exchange translation 10.5 66.6 - - 29.5 106.6
Balance at end of the year 96.3 430.4 270.2 292.8 223.1 1,312.8
(1) Convertible Notes were issued in three tranches of $60 million (“Tranche 1”), $45 million (“Tranche 2”) and $45 million (“Tranche 3”), and are cumulative, convertible, subordinated notes due June 2020, and pay, sub-ject to a solvency condition, a monthly coupon equal to the 30 day bank bill rate plus 400 basis points. The Convertible Notes are unlisted with the final Tranche being Tranche 1, redeemed during the prior financial year.
(2) 3,000,000 Convertible Preference Shares (CPS) were issued on 24 December 2012. CPS are fully-paid, perpetual, convertible, unguaranteed and unsecured preference shares with preferred, discretionary, non-cumu-lative dividends. CPS will mandatorily convert into ordinary shares on 15 April 2020. The Bank is entitled to convert, redeem or transfer some or all of the CPS on the optional conversion / redemption date of 15 April 2018 subject to the prior written approval from the Australian Prudential Regulation Authority (“APRA”). The Bank is also entitled to convert, redeem or transfer some or all of the CPS on the occurrence of a regulatory event or tax event and in addition, conversion of the CPS into ordinary shares must occur immediately following the occurrence of a capital trigger event or a non-viability trigger event. CPS rank for payment of capital ahead of ordinary shareholders, equally with other securities or instruments ranking equally with CPS, but behind all other securities or instruments ranking ahead of CPS, and behind all depositors and other creditors.
3.6. RISK MANAGEMENT
The Consolidated Entity adopts a “managed risk” approach to its banking and insurance activities. As such, the articulation of a risk aware culture is prevalent throughout the Consolidated Entity’s credit, liquidity, market, operational, insurance risk and compliance policies and procedures. The Board has adopted policies in relation to the assessment, management and monitoring of these risks and ownership of the frameworks within which these risks are managed reside with the Chief Risk Officer. The Chief Risk Officer contributes towards the achievement of the Consolidated Entity’s corporate objectives through the operationalisation and progressive development of the Bank’s risk management function. In particular, improvement of the risk management function is focussed in a number of areas:1. the efficiency and effectiveness of the Consolidated Entity’s credit, liquidity, market, operational risk and compliance management process controls and
policies to support improved competitive advantage, support growth and enable improved cost controls;2. to provide management and the Board with risk reporting that contributes to the further development of sound corporate governance standards;3. to maintain regulatory compliance in line with regulators’ expectations;4. to provide a sound basis from which the Bank can progress to the required compliance level under the Basel II accord; and 5. to contribute to the Consolidated Entity achieving risk based performance management.Group Risk is an independent function and is responsible for providing the framework, policies and procedures for managing credit, liquidity, market, operational risk and compliance throughout the Group. Policies are set in line with the governing strategy and risk guidelines set by the Board.

Bank of Queensland Limited and its Controlled Entities A.B.N. 32 009 656 740. 71
NOTES TO THE FINANCIAL STATEMENTS(Continued) Year Ended 31 August 2014
3.6. RISK MANAGEMENT (CONTINUED)
Monitoring
The Consolidated Entity’s enterprise risk management framework incorporates active management and monitoring of a range of risks including (but not limited
to):
1. Market
2. Credit
3. Liquidity
4. Insurance
(a) Market riskMarket risk is the risk that movements in market rates and prices will result in profits or losses to the Bank. The objective of market risk management is to
manage and control market risk.
(i) Interest Rate Risk management
The operations of the Bank are subject to the risk of interest rate fluctuations as a result of mismatches in the timing of the repricing of interest rates on the
Bank’s assets and liabilities.
The figures in the table below indicate the potential increase in net interest income for an ensuing 12 month period of a 1% parallel shock increase to the yield
curve. A 1% decrease in the yield curve has an equal but opposite impact.
2014
%
2013
%
2014
$m
2013
$m
Exposure at the end of the year 1.16 0.90 8.6 6.2
Average monthly exposure during the year 1.19 0.78 8.8 5.4
High month exposure during the year 2.16 1.41 15.9 9.7
Low month exposure during the year (0.03) 0.16 (0.2) 1.1
(ii) Foreign exchange risk
It is the Bank’s policy not to carry material foreign exchange rate exposures. At balance date there are no material foreign exchange rate exposures.
The Bank uses cross currency swaps and foreign exchange forwards to hedge its exchange rate exposures arising from borrowing off-shore in foreign currencies. The Bank uses forward foreign exchange contracts to hedge potential exchange rate exposures created by customer-originated foreign currency transactions.
The Bank’s investment in its New Zealand subsidiary is hedged by forward foreign exchange contracts which mitigate the currency risk arising from the subsidiary’s net assets.
(iii) Traded market riskMarket risks attributable to trading activities are primarily measured using a parametric Value-at-Risk (“VaR”) based on historical data. The Bank estimates VaR as the potential loss in earnings from adverse market movements and is calculated over a 1-day time horizon to a 99% confidence level using 2 years of historical data. VaR takes account of all material market variables that may cause a change in the value of the trading portfolio. Although an important tool for the measurement of market risk, the assumptions underlying the model have some limitations:• VaR typically understates the losses that may occur beyond the 99% confidence level;• The reliance on historical data may prove insufficient to predict the severity of possible outcomes; and• A 1-day holding period assumes that it is possible to hedge or dispose of positions within that period. For certain illiquid assets or in certain market
situations this might not be possible.

ANNUAL REPORT 201472
NOTES TO THE FINANCIAL STATEMENTS(Continued) Year Ended 31 August 2014
3.6. RISK MANAGEMENT (CONTINUED)
(iii) Traded market risk (continued)As VaR is a statistical measure and only attempts to cover losses to a 99% confidence level, the Bank supplements this analysis with stress testing. Stress testing attempts to adequately assess the risks inherent in its trading activities by applying appropriate scenario analyses, whilst not addressing the likelihood of those outcomes.As an overlay, the individual market risks of interest rate, foreign exchange, credit and equity sensitivities are monitored and measured against limits delegated by the Asset-Liability Committee (“ALCO”). The portfolio (interest rate, foreign exchange, credit and equity) VaR for the Bank’s trading portfolio for the year was as follows:
Trading VaR
2014
$m
2013
$m
Average 0.65 0.80
Maximum 1.33 1.67
Minimum 0.28 0.35
(b) Credit risk Credit risk arises in the business from lending activities, the provision of guarantees including letters of credit and commitments to lend, investment in bonds and notes, financial market transactions and other associated activities. Credit risk is the potential loss arising from the possibility that customers or counterparties fail to meet contractual payment obligations to the Bank as they fall due. The Board of Directors have implemented a structured framework of systems and controls to monitor and manage credit risk comprising:• documented credit risk management principles which are disseminated to all staff involved with the lending process;• documented policies;• a process for approving risk, based on tiered delegated approval authorities, whereby the largest exposures are assessed by a committee consisting of
Group Executives and senior risk managers chaired by the Chief Risk Officer;• risk grading the Bank’s commercial exposures for facilities greater than $100,000 based on items inclusive of financial performance and stability,
organisational structure, industry segment and security support. Exposures within this segment of the portfolio are generally subject to annual review including reassessment of the assigned risk grade;
• an automated scorecard approval model for the Bank’s retail portfolio inclusive of home loans, personal loans, and lines of credit. This model is supported by experienced Risk Assessment Managers; and
• a series of management reports detailing industry concentrations, counterparty concentrations, loan grades and security strength ratings.The Consolidated Entity uses derivative financial instruments to hedge its exposure to foreign exchange and interest rate risks arising from operating, financing and investing activities. In accordance with its treasury policy, the Consolidated Entity can hold derivative financial instruments for trading purposes. Credit risk on derivative contracts used for these purposes is minimised as counterparties are recognised financial intermediaries with acceptable credit ratings determined by a recognised rating agency.
Maximum exposure to credit risk
The amounts disclosed are the maximum exposure to credit risk, before taking account of any collateral held or other credit enhancements. For financial assets recognised on the Balance Sheet, the exposure to credit risk equals their carrying amount. For customer commitments, the maximum exposure to credit risk is the full amount of the committed facilities as at the reporting date.

Bank of Queensland Limited and its Controlled Entities A.B.N. 32 009 656 740. 73
NOTES TO THE FINANCIAL STATEMENTS(Continued) Year Ended 31 August 2014
3.6. RISK MANAGEMENT (CONTINUED)
(b) Credit risk (continued)
Maximum exposure to credit risk (continued)
The carrying amount of the Consolidated Entity’s and Bank’s financial assets represents the maximum credit exposure. The maximum exposure to credit risk at the reporting date was:
Consolidated Bank
2014 $m
2013 $m
2014 $m
2013 $m
Cash and liquid assets 1,033.6 873.2 397.0 242.2
Due from other financial institutions 92.8 118.5 15.0 23.8
Other financial assets (including accrued interest) 6,398.7 5,462.5 5,881.9 5,662.6
Derivative financial instruments 160.3 260.4 131.9 234.0
Financial assets other than loans and advances 7,685.4 6,714.6 6,425.8 6,162.6
Gross loans and advances at amortised cost 38,881.8 35,705.9 32,265.7 31,766.2
Total financial assets 46,567.2 42,420.5 38,691.5 37,928.8
Customer commitments (1) 1,897.9 1,470.3 1,024.4 921.7
Total potential exposure to credit risk 48,465.1 43,890.8 39,715.9 38,850.5
(1) Refer to Note Section 6.2 for full details of customer commitments.
Distribution of financial assets by credit quality
Consolidated Bank
2014 $m
2013 $m
2014 $m
2013 $m
Neither past due or impaired
Gross loans and advances at amortised cost 37,459.1 33,958.4 31,003.7 30,134.1
Financial assets other than loans and advances 7,685.4 6,714.6 6,425.8 6,162.6
Past due but not impaired
Gross loans and advances at amortised cost 1,129.8 1,365.9 999.0 1,269.7
Impaired
Gross loans and advances at amortised cost 292.9 381.6 263.0 362.4
46,567.2 42,420.5 38,691.5 37,928.8
There is no individual exposure included in impaired assets which exceeds 5% of shareholders’ equity (2013: nil).The Bank holds collateral against loans and advances to customers in the form of mortgage interest over property, other registered securities over assets and guarantees and mortgage insurance. To mitigate credit risk, the Bank can take possession of the security held against the loans and advances as a result of customer default. To ensure reduced exposure to losses, the collateral held by the Bank as mortgagee in possession is realised promptly.Estimates of fair value are based on the value of collateral assessed at the time of borrowing, and generally are not updated except when a loan is individually assessed as impaired. An estimate of the collateral held against past due but not impaired and impaired loans and advances at amortised cost is outlined below. It is not practicable to determine the fair value of collateral held against performing loans.
Consolidated Bank
2014 $m
2013 $m
2014 $m
2013 $m
Held against past due but not impaired assets 1,593.2 1,679.0 1,485.8 1,608.1
Held against impaired assets 202.3 260.4 186.0 252.1
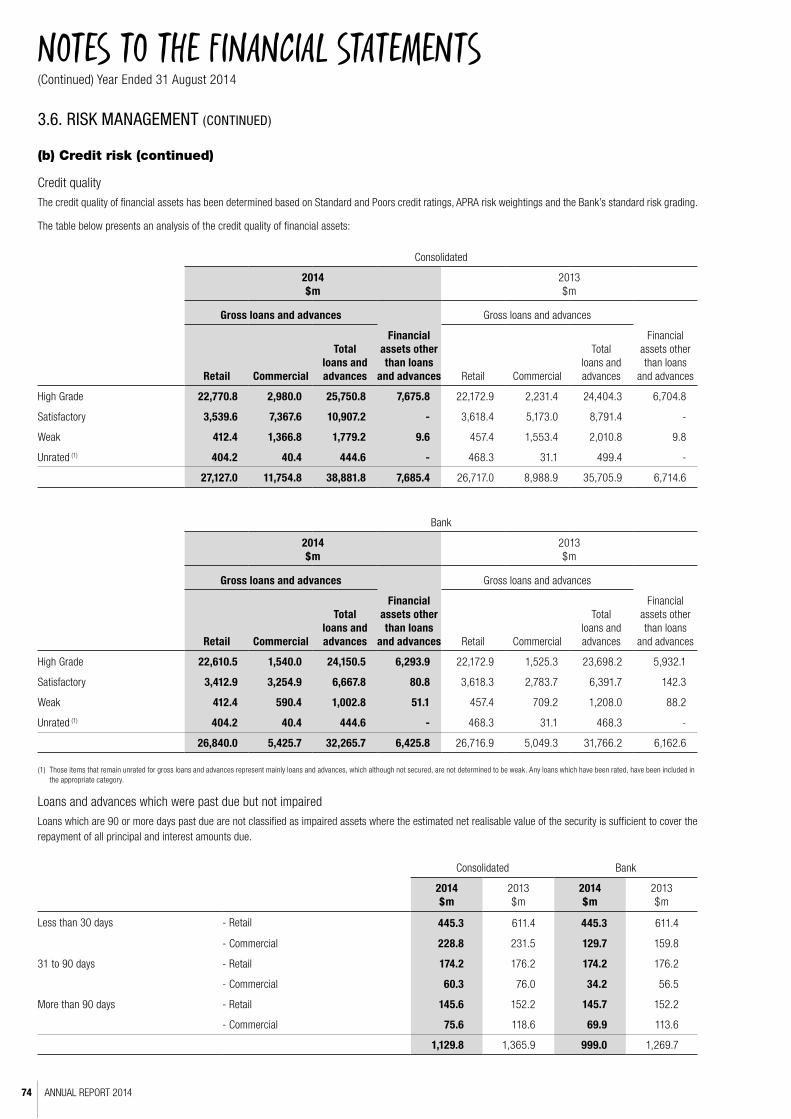
ANNUAL REPORT 201474
NOTES TO THE FINANCIAL STATEMENTS(Continued) Year Ended 31 August 2014
3.6. RISK MANAGEMENT (CONTINUED)
(b) Credit risk (continued)
Credit quality
The credit quality of financial assets has been determined based on Standard and Poors credit ratings, APRA risk weightings and the Bank’s standard risk grading.
The table below presents an analysis of the credit quality of financial assets:
Consolidated
2014 $m
2013 $m
Gross loans and advances Gross loans and advances
Retail Commercial
Total loans and advances
Financial assets other than loans
and advances Retail Commercial
Total loans and advances
Financial assets other than loans
and advances
High Grade 22,770.8 2,980.0 25,750.8 7,675.8 22,172.9 2,231.4 24,404.3 6,704.8
Satisfactory 3,539.6 7,367.6 10,907.2 - 3,618.4 5,173.0 8,791.4 -
Weak 412.4 1,366.8 1,779.2 9.6 457.4 1,553.4 2,010.8 9.8
Unrated (1) 404.2 40.4 444.6 - 468.3 31.1 499.4 -
27,127.0 11,754.8 38,881.8 7,685.4 26,717.0 8,988.9 35,705.9 6,714.6
Bank
2014 $m
2013 $m
Gross loans and advances Gross loans and advances
Retail Commercial
Total loans and advances
Financial assets other than loans
and advances Retail Commercial
Total loans and advances
Financial assets other than loans
and advances
High Grade 22,610.5 1,540.0 24,150.5 6,293.9 22,172.9 1,525.3 23,698.2 5,932.1
Satisfactory 3,412.9 3,254.9 6,667.8 80.8 3,618.3 2,783.7 6,391.7 142.3
Weak 412.4 590.4 1,002.8 51.1 457.4 709.2 1,208.0 88.2
Unrated (1) 404.2 40.4 444.6 - 468.3 31.1 468.3 -
26,840.0 5,425.7 32,265.7 6,425.8 26,716.9 5,049.3 31,766.2 6,162.6
(1) Those items that remain unrated for gross loans and advances represent mainly loans and advances, which although not secured, are not determined to be weak. Any loans which have been rated, have been included in the appropriate category.
Loans and advances which were past due but not impaired
Loans which are 90 or more days past due are not classified as impaired assets where the estimated net realisable value of the security is sufficient to cover the repayment of all principal and interest amounts due.
Consolidated Bank
2014 $m
2013 $m
2014 $m
2013 $m
Less than 30 days - Retail 445.3 611.4 445.3 611.4
- Commercial 228.8 231.5 129.7 159.8
31 to 90 days - Retail 174.2 176.2 174.2 176.2
- Commercial 60.3 76.0 34.2 56.5
More than 90 days - Retail 145.6 152.2 145.7 152.2
- Commercial 75.6 118.6 69.9 113.6
1,129.8 1,365.9 999.0 1,269.7

Bank of Queensland Limited and its Controlled Entities A.B.N. 32 009 656 740. 75
NOTES TO THE FINANCIAL STATEMENTS(Continued) Year Ended 31 August 2014
3.6. RISK MANAGEMENT (CONTINUED)
(b) Credit risk (continued)
Concentration of exposure for gross loans and advances at amortised cost
Concentration of credit risk exists when a number of counterparties are engaged in similar activities, or operate in the same geographical areas or industry sectors and have similar economic characteristics so that their ability to meet contractual obligations is similarly affected by changes in economic, political or other conditions.The Bank monitors concentrations of credit risk by geographical location for loans and advances. An analysis of these concentrations of credit risk at the report-ing date is shown below:
Consolidated Bank
Geographical concentration of credit risk for loans and advances at amortised cost (before provisions and unearned income):
2014 $m
2013 $m
2014 $m
2013 $m
Queensland 20,911.8 20,580.5 18,899.3 19,169.4
New South Wales 6,903.8 5,387.8 4,948.9 4,517.2
Victoria 6,185.2 5,659.0 4,854.0 4,849.3
Northern Territory 260.4 237.2 255.6 231.7
Australian Capital Territory 313.8 347.2 241.2 227.0
Western Australia 3,519.3 2,885.1 2,778.0 2,458.7
South Australia 369.7 213.8 110.7 120.3
Tasmania 182.9 196.9 178.0 192.6
International (New Zealand) 234.9 198.4 - -
38,881.8 35,705.9 32,265.7 31,766.2

ANNUAL REPORT 201476
NOTES TO THE FINANCIAL STATEMENTS(Continued) Year Ended 31 August 2014
3.6. RISK MANAGEMENT (CONTINUED)
(c) Liquidity riskLiquidity risk arises from the possibility that the Bank is unable to meet its financial obligations as they fall due. Liquidity risk is managed through a series of detailed policies, including the management of cash flow mismatches, the maintenance of a stable, core retail deposits base, the diversification of the funding base and the retention of adequate levels of high quality liquid assets.
The Consolidated Entity manages liquidity risk by maintaining adequate reserves and facilities by continuously monitoring forecast and actual cash flows, matching maturity profiles of financial assets and liabilities and liquidity scenario analysis.
Consolidated 2014
Carrying amount
$mAt Call
$m3 mths or less
$m3 to 12 mths
$m1 to 5 years
$mOver 5 years
$mPolicyholder
$m
Total contractual cash flows
$m
Financial liabilities
Due to other financial institutions 207.5 207.5 - - - - - 207.5
Deposits 35,935.8 12,301.2 12,969.3 8,371.0 2,917.8 16.8 - 36,576.1
Derivative financial instruments (1) 5.0 - 1.9 1.8 2.0 - - 5.7
Accounts payable and other liabilities 399.1 - 399.1 - - - - 399.1
Securitisation liabilities (2) 5,509.9 - 932.7 1,692.6 2,549.4 871.4 - 6,046.1
Borrowings including subordinated notes 1,024.5 - 69.7 347.6 723.7 - - 1,141.0
Insurance policy liabilities 63.0 - - - - - 63.0 63.0
Total 43,144.8 12,508.7 14,372.7 10,413.0 6,192.9 888.2 63.0 44,438.5
Derivative financial instruments (hedging relationship)
Contractual amounts payable - - 419.7 774.3 826.7 396.2 - 2,416.9
Contractual amounts receivable - - (408.3) (737.3) (724.8) (321.4) - (2,191.8)
112.6 - 11.4 37.0 101.9 74.8 - 225.1
Off balance sheet positions
Guarantees, indemnities and letters of credit - 252.2 - - - - - 252.2
Customer funding commitments - 1,645.7 - - - - - 1,645.7
- 1,897.9 - - - - - 1,897.9
Consolidated 2013
Carrying amount
$mAt Call
$m3 mths or less
$m3 to 12 mths
$m1 to 5 years
$mOver 5 years
$mPolicyholder
$m
Total contractual cash flows
$m
Financial liabilities
Due to other financial institutions 201.1 201.1 - - - - - 201.1
Deposits 31,698.7 10,310.4 13,627.5 6,601.0 1,657.9 - - 32,196.8
Derivative financial instruments (1) 3.4 - 1.4 1.2 1.1 - - 3.7
Accounts payable and other liabilities 362.0 - 362.0 - - - - 362.0
Securitisation liabilities (2) 5,824.1 - 868.4 1,087.7 3,379.9 1,227.7 - 6,563.7
Borrowings including subordinated notes 1,312.8 - 313.7 474.5 672.6 - - 1,460.8
Insurance policy liabilities 72.5 - - - - - 72.5 72.5
Total 39,474.6 10,511.5 15,173.0 8,164.4 5,711.5 1,227.7 72.5 40,860.6
(1) Derivative financial instruments other than those designated in a cashflow hedge relationship. (2) Repayment of securitisation bonds is forecast based on the expected repayment profile of the underlying assets of the Trusts.

Bank of Queensland Limited and its Controlled Entities A.B.N. 32 009 656 740. 77
NOTES TO THE FINANCIAL STATEMENTS(Continued) Year Ended 31 August 2014
3.6. RISK MANAGEMENT (CONTINUED)
(c) Liquidity risk (continued)
Consolidated 2013
Carrying amount
$mAt Call
$m3 mths or less
$m3 to 12 mths
$m1 to 5 years
$mOver 5 years
$mPolicyholder
$m
Total contractual cash flows
$m
Derivative financial instruments (hedging relationship)
Contractual amounts payable - - 485.7 772.4 620.0 224.0 - 2,102.1
Contractual amounts receivable - - (533.7) (802.1) (582.0) (225.6) - (2,143.4)
(103.3) - (48.0) (29.7) 38.0 (1.6) - (41.3)
Off balance sheet positions
Guarantees, indemnities and letters of credit - 235.7 - - - - - 235.7
Customer funding commitments - 1,234.6 - - - - - 1,234.6
- 1,470.3 - - - - - 1,470.3
Bank 2014
Carrying amount
$mAt Call
$m3 mths or less
$m3 to 12 mths
$m1 to 5 years
$mOver 5 years
$m
Total contractual cash flows
$m
Financial liabilities
Due to other financial institutions 207.5 207.5 - - - - 207.5
Deposits 34,068.7 12,333.8 11,925.3 7,705.7 2,690.9 - 34,655.7
Derivative financial instruments (1) 5.0 - 1.9 1.8 2.0 - 5.7
Accounts payable and other liabilities 336.4 - 336.4 - - - 336.4
Borrowings including subordinated notes 947.9 - 68.3 324.2 663.8 - 1,056.3
Amounts due to controlled entities 1,224.1 1,224.1 - - - - 1,224.1
Total 36,789.6 13,765.4 12,331.9 8,031.7 3,356.7 - 37,485.7
Derivative financial instruments (hedging relationship)
Contractual amounts payable - - 309.7 709.2 696.5 207.9 1,923.3
Contractual amounts receivable - - (314.8) (677.8) (618.1) (116.8) (1,727.5)
100.3 - (5.1) 31.4 78.4 91.1 195.8
Off balance sheet positions
Guarantees, indemnities and letters of credit - 227.7 - - - - 227.7
Customer funding commitments - 796.7 - - - - 796.7
- 1,024.4 - - - - 1,024.4
(1) Derivative financial instruments other than those designated in a cashflow hedge relationship.

ANNUAL REPORT 201478
NOTES TO THE FINANCIAL STATEMENTS(Continued) Year Ended 31 August 2014
3.6. RISK MANAGEMENT (CONTINUED)
(c) Liquidity risk (continued)
Bank 2013
Carrying amount
$mAt Call
$m3 mths or less
$m3 to 12 mths
$m1 to 5 years
$mOver 5 years
$m
Total contractual cash flows
$m
Financial liabilities
Due to other financial institutions 201.1 201.1 - - - - 201.1
Deposits 31,785.5 10,397.2 13,627.5 6,601.0 1,657.9 - 32,283.6
Derivative financial instruments (1) 3.4 - 1.4 1.2 1.1 - 3.7
Accounts payable and other liabilities 320.7 - 320.7 - - - 320.7
Borrowings including subordinated notes 1,312.8 - 313.7 474.5 672.6 - 1,460.8
Amounts due to controlled entities 2,457.5 2,457.5 - - - - 2,457.5
Total 36,081.0 13,055.8 14,263.3 7,076.7 2,331.6 - 36,727.4
Derivative financial instruments (hedging relationship)
Contractual amounts payable - - 457.3 699.8 420.3 18.2 1,595.6
Contractual amounts receivable - - (507.8) (738.5) (418.5) (11.4) (1,676.2)
(101.6) - (50.5) (38.7) 1.8 6.8 (80.6)
Off balance sheet positions
Guarantees, indemnities and letters of credit - 235.7 - - - - 235.7
Customer funding commitments - 686.0 - - - - 686.0
- 921.7 - - - - 921.7
(1) Derivative financial instruments other than those designated in a cashflow hedge relationship.

Bank of Queensland Limited and its Controlled Entities A.B.N. 32 009 656 740. 79
NOTES TO THE FINANCIAL STATEMENTS(Continued) Year Ended 31 August 2014
3.6. RISK MANAGEMENT (CONTINUED).
(d) Insurance risk
(i) Risk management objectives and policies for risk mitigation
Insurance risks are controlled through the use of underwriting procedures, adequate premium rates and policy charges and sufficient reinsurance arrangements, all of which are approved through a Board approved governance structure. Controls are also maintained over claims management practices to assure the correct and timely payment of insurance claims.
(ii) Strategy for managing insurance risk
Portfolio of risks
The Bank’s insurance subsidiaries issue consumer credit insurance, term life insurance, group life insurance, accidental death insurance and motor vehicle gap insurance contracts. The performance of the Bank’s insurance subsidiaries and its continuing ability to write business depends on its ability to pre-empt and control risks. The Bank’s insurance subsidiaries have a risk management strategy which has been approved by their respective Board’s. It summarises the approach to risk and risk management.
Risk strategy
In compliance with contractual and regulatory requirements, a strategy is in place to ensure that the risks underwritten satisfy objectives whilst not adversely affecting the Consolidated Entity’s ability to pay benefits and claims when due. The strategy involves the identification of risks by type, impact and likelihood, the implementation of processes and controls to mitigate the risks, and continuous monitoring and improvement of the procedures in place to minimise the chance of an adverse compliance or operational risk event occurring. Included in this strategy is the process for underwriting and product pricing to ensure products are appropriately priced. Capital management is also a key aspect of the Consolidated Entity’s risk management strategy. Capital requirements take account of all of the various regulatory reporting requirements to which the Consolidated Entity is subject.
Prudential capital requirements
Prudential capital requirements established by the APRA are in place to safeguard policyholders’ interests, which are primarily the ability to meet future claim payments to policyholders. These require the Company’s Capital Base to exceed the Prudential Capital Requirement throughout the year, not just at year end. The level of capital requirements also take into account specific risks faced by the Bank’s insurance subsidiaries.
(iii) Methods to limit or transfer insurance risk exposures
Reinsurance
The insurance subsidiary uses reinsurance arrangements to pass on or cede to reinsurers, risks that are outside of the subsidiary’s risk appetite.
Underwriting procedures
Strategic underwriting decisions are put into effect using the underwriting procedures detailed in the Bank’s insurance subsidiary’s Underwriting Policy. Such procedures include limits to delegated authorities and signing powers.
Claims management
Strict claims management procedures ensure timely and correct payment of claims in accordance with policy conditions.
Asset and liability management techniques
Assets are allocated to different classes of business using a risk based approach. The Bank’s insurance subsidiary has a mix of short and long term business and invests accordingly. Market risk is managed through investing in cash and deposits, bank issued commercial bills, cash management trusts and managed income funds. No more than 35% of shareholder funds and funds backing insurance policy liabilities can be invested with any one counterparty subject to counterparty credit ratings.
(v) Concentration of insurance risk
Insurance risks associated with human life events
The Bank’s insurance subsidiary aims to maintain a stable age profile and mix of the sexes within its portfolio of policyholders. This policy maintains a balance between the current and future profitability of the life business, and exposure to the significant external events. Despite the inevitable growth in policyholders at the age of retirement, the age profile and mix of sexes within the population of policyholders is sufficiently spread so that the risk concentration in relation to any particular age group is minimal.

ANNUAL REPORT 201480
NOTES TO THE FINANCIAL STATEMENTS(Continued) Year Ended 31 August 2014
3.7. FINANCIAL INSTRUMENTS
(a) Financial instrument classificationsIn addition to Loans and Advances and financial liabilities at amortised cost the Bank classifies its financial instruments into one of the following four categories upon initial recognition:
(i) Financial assets held for trading
Financial assets that are held as part of the Bank’s Trading Book (refer Section 3.3) are designated at fair value through the profit and loss. The Bank manages such financial assets and makes purchase and sale decisions based on their fair value in accordance with the Bank’s documented risk management or investment strategy. Upon initial recognition attributable transaction costs are recognised in profit or loss in the Income Statement when incurred. Financial instruments at fair value through the profit and loss are measured at fair value, and changes therein are recognised in profit or loss in the Income Statement.
(ii) Available-for-sale financial assets
Assets that are intended to be held for an indefinite period of time but which may be sold in response to changes in interest rates, exchange rates and liquidity needs are classified as available-for-sale. These assets are initially measured at fair value plus any directly attributable transaction costs, with any changes in fair value other than impairment losses (refer section 3.4), being recognised in other comprehensive income and accumulated in reserves in equity until the asset is sold. Interest income received on these assets is recorded as net interest income and any realised gains or losses recorded in other income in the Income Statement.
(iii) Receivables due from other financial institutions
Receivables due from other financial institutions are recognised and measured at amortised cost and include nostro balances (an account held with a foreign bank usually in a foreign currency) and settlement account balances.
(iv) Derivative financial instruments
The Consolidated Entity uses derivative financial instruments to hedge its exposure to foreign exchange and interest rate risks arising from operating, financing and investing activities. Refer to Section 3.8 for further information on Derivative Financial Instruments.
(b) Fair value of financial instrumentsThe financial assets and liabilities listed below are recognised and measured at fair value and therefore their carrying value equates to their face value:
• Available-for-sale financial assets;
• Financial assets and liabilities designated at fair value through the profit and loss;
• Derivatives; and
• Insurance policy liabilities.
The fair value estimates for instruments carried at amortised cost are based on the following methodologies and assumptions:
Cash and liquid assets, due from and to other financial institutions, accounts payable and other liabilities
The fair value approximates their carrying value as they are short term in nature or are receivable or payable on demand.
Loans and advances
Loans and advances are net of specific and collective provisions for doubtful debts and unearned income. The fair values of loans and advances that reprice within six months of year end are assumed to equate to the carrying value. The fair values of all other loans and advances are calculated using discounted cash flow models based on the maturity of the loans and advances. The discount rates applied are based on the current interest rates at the reporting date for similar types of loans and advances, if the loans and advances were performing at the reporting date. The differences between estimated fair values of loans and advances and carrying value reflect changes in interest rates and creditworthiness of borrowers since loan or advance origination.
Deposits
The fair value of non-interest bearing, call and variable rate deposits and fixed rate deposits repricing within six months is the carrying value. The fair value of other term deposits is calculated using discounted cash flow models based on the deposit type and its related maturity.
Borrowings including subordinated notes
The fair values are calculated based on a discounted cash flow model using a yield curve appropriate to the remaining maturity of the instruments.

Bank of Queensland Limited and its Controlled Entities A.B.N. 32 009 656 740. 81
NOTES TO THE FINANCIAL STATEMENTS(Continued) Year Ended 31 August 2014
3.7. FINANCIAL INSTRUMENTS (CONTINUED)
(c) Comparison of fair value to carrying amountsThe table below discloses the fair value of financial instruments where their carrying value is not a reasonable approximation of their fair value :
Consolidated Entity
Carrying value Fair value
Section2014 $m
2013 $m
2014 $m
2013 $m
Assets carried at amortised cost
Loans and advances at amortised cost 3.4 38,135.5 34,989.3 38,197.2 35,104.7
38,135.5 34,989.3 38,197.2 35,104.7
Liabilities carried at amortised cost
Deposits 3.2 (35,935.8) (31,698.7) (35,950.1) (31,766.7)
Borrowings including subordinated notes 3.5 (6,534.4) (7,136.9) (6,539.0) (7,168.7)
(42,470.2) (38,835.6) (42,489.1) (38,935.4)
Bank
Carrying Value Fair Value
2014 $m
2013 $m
2014 $m
2013 $m
Assets carried at amortised cost
Loans and advances at amortised cost 3.4 32,035.2 31,491.2 32,068.2 31,540.8
32,035.2 31,491.2 32,068.2 31,540.8
Liabilities carried at amortised cost
Deposits 3.2 (34,068.7) (31,785.5) (34,083.0) (31,853.5)
Borrowings including subordinated notes 3.5 (947.9) (1,312.8) (952.2) (1,344.6)
(35,016.6) (33,098.3) (35,035.2) (33,198.1)
The estimated fair values disclosed do not include the assets and liabilities that are not financial instruments.
Interest rates used for determining fair values
The interest rates used to discount estimated cash flows, when applicable, are based on the Group’s yield curve at the reporting date plus an adequate credit spread, and were as follows:
2014 2013
Derivatives, deposits and borrowings including subordinated notes 2.53% - 3.95% 2.51% - 4.58%
Leases 6.12% - 20.3% 6.24% - 13.5%
Loans and advances at amortised cost 4.65% - 7.30% 4.75% - 6.85%

ANNUAL REPORT 201482
NOTES TO THE FINANCIAL STATEMENTS(Continued) Year Ended 31 August 2014
3.7. FINANCIAL INSTRUMENTS (CONTINUED)
(d) Fair value hierarchy
The Consolidated Entity measures fair values using the following fair value hierarchy, which reflects the significance of the inputs used in making the measurements:
• Level 1: inputs that are quoted market prices (unadjusted) in active markets for identical instruments.
• Level 2: inputs other than quoted prices included within level 1 that are observable either directly or indirectly.
• Level 3: inputs that are unobservable i.e. there is no observable market data.
The table below analyses financial instruments carried at fair value, by valuation method. There were no material movements in Level 3 during the year.
2014
Consolidated EntityLevel 1
$mLevel 2
$mLevel 3
$mTotal $m
Instruments carried at fair value
Available-for-sale financial assets 1,893.0 1,961.8 9.6 3,864.4
Financial assets designated at fair value through profit and loss - 2,473.1 - 2,473.1
Derivative assets - 160.3 - 160.3
1,893.0 4,595.2 9.6 6,497.8
Derivative liabilities - (248.7) - (248.7)
1,893.0 4,346.5 9.6 6,249.1
2013
Consolidated EntityLevel 1
$mLevel 2
$mLevel 3
$mTotal $m
Instruments carried at fair value
Available-for-sale financial assets 426.2 630.8 9.8 1,066.8
Financial assets designated at fair value through profit and loss 134.2 4,200.4 - 4,334.6
Derivative assets - 260.4 - 260.4
560.4 5,091.6 9.8 5,661.8
Derivative liabilities - (137.4) - (137.4)
560.4 4,954.2 9.8 5,524.4
The fair value hierarchy classification of instruments in Section 3.7 (c) is Loans and advances level 3, Deposits and Borrowings including subordinated notes level 2.

Bank of Queensland Limited and its Controlled Entities A.B.N. 32 009 656 740. 83
NOTES TO THE FINANCIAL STATEMENTS(Continued) Year Ended 31 August 2014
3.7. FINANCIAL INSTRUMENTS (CONTINUED)
(d) Fair value hierarchy (continued)
2014
Bank Level 1
$mLevel 2
$mLevel 3
$mTotal $m
Instruments carried at fair value
Available-for-sale financial assets 1,254.6 2,084.8 9.5 3,348.9
Financial assets designated at fair value through profit and loss - 2,473.1 - 2,473.1
Derivative assets - 131.9 - 131.9
1,254.6 4,689.8 9.5 5,953.9
Derivative liabilities - (207.0) - (207.0)
1,254.6 4,482.8 9.5 5,746.9
2013
Bank Level 1
$mLevel 2
$mLevel 3
$mTotal $m
Instruments carried at fair value
Available-for-sale financial assets 426.2 832.4 9.8 1,268.4
Financial assets designated at fair value through profit and loss 134.2 4,200.4 - 4,334.6
Derivative assets - 234.0 - 234.0
560.4 5,266.8 9.8 5,837.0
Derivative liabilities - (109.5) - (109.5)
560.4 5,157.3 9.8 5,727.5
(e) Master netting or similar arrangements
There have been no financial assets or financial liabilities offset in the balance sheets. The Consolidated Entity has netting arrangements in place with counter parties on Derivative Financial Instruments and the effects of these netting arrangements if they were to be applied in the balance sheets has been disclosed at Section 3.8(c).
(f) Impairment of financial instruments policy
Financial assets other than loans and advances at amortised cost
The Consolidated Entity assesses at the end of each reporting period whether there is objective evidence that a financial asset or group of financial assets, not carried at fair value through profit and loss, is impaired. A financial asset is impaired if objective evidence indicates that a loss event has occurred after the initial recognition of the asset, and that the loss event had a negative effect on the estimated future cash flow of that asset that can be estimated reliably. In the case of equity securities classified as available-for-sale, a significant or prolonged decline in the fair value of a security below its cost is considered as an indicator that the securities are impaired. If any such evidence exists for available-for-sale financial assets, the cumulative loss - measured as the difference between the acquisition cost and the current fair value, less any impairment loss on that financial asset previously recognised in profit or loss in the Income Statement - is reclassified from equity and recognised in profit or loss in the Income Statement as a reclassification adjustment. Impairment losses recognised in profit or loss in the Income Statement on equity instruments classified as available-for-sale are not reversed through the profit or loss in the Income Statement. For available-for-sale debt securities, if any increase in the fair value can be related objectively to an event occurring after the impairment loss was recognised, then the impairment loss is reversed through profit of loss in the income statement.Loans and advances and other assets at amortised cost If there is evidence of impairment for any of the Consolidated Entity’s financial assets carried at amortised cost, the loss is measured as the difference between the asset’s carrying amount and the present value of estimated future cash flows, excluding future credit losses that have not been incurred. The cash flows are discounted at the financial asset’s original effective interest rate. The loss is recognised in profit or loss in the Income Statement.
(i) Specific impairment provisions
Impairment losses on individually assessed loans and advances are determined on a case-by-case basis. If there is objective evidence that an individual loan or advance is impaired, then a specific provision for impairment is raised. The amount of the specific provision is based on the carrying amount of the loan or advance, including the security held against the loan or advance and the present value of expected future cash flows. Any subsequent write-offs for bad debts are then made against the specific provision for impairment.

ANNUAL REPORT 201484
NOTES TO THE FINANCIAL STATEMENTS(Continued) Year Ended 31 August 2014
3.7. FINANCIAL INSTRUMENTS (CONTINUED)
(f) Impairment of financial instruments policy (continued)
(ii) Collective impairment provisions Where no evidence of impairment has been identified for loans and advances, these loans and advances are grouped together on the basis of similar credit characteristics for the purpose of calculating a collective impairment loss. Collective impairment provisions are based on historical loss experience adjusted for current observable data. The amount required to bring the collective provision for impairment to its required level is charged to profit or loss in the Income Statement.
3.8. DERIVATIVE FINANCIAL INSTRUMENTS
(a) Accounting for derivatives
The Consolidated Entity and Bank used derivative financial instruments for both hedging and trading purposes in the current year. Refer to Section 3.6(a) for an explanation of the Consolidated Entity’s and Bank’s risk management framework.
The Consolidated Entity uses derivative financial instruments to hedge its exposure to foreign exchange and interest rate risks arising from operating, financing and investing activities. In accordance with its Treasury policy, the Consolidated Entity can hold derivative financial instruments for trading purposes. Derivatives that do not qualify for hedge accounting are accounted for as trading instruments.
Derivative financial instruments are recognised initially at trade date fair value and are subsequently remeasured at fair value at the reporting date. The gain or loss on re-measurement is recognised immediately in profit or loss in the Income Statement. However, when derivatives qualify for hedge accounting, recognition of any resultant gain or loss depends on the nature of the hedge relationship as discussed below.
The fair value of interest rate swaps is the estimated amount that the Consolidated Entity would receive or pay to terminate the swap at the reporting date, taking into account current interest rates and the current creditworthiness of the swap counterparties. The fair value of forward exchange contracts is their quoted market price at the reporting date, being the present value of the quoted forward price. The fair value of futures contracts is their quoted market price.
Cash flow hedges
Where a derivative financial instrument is designated as a hedge of the variability of the cash flows of a recognised asset or liability, or a highly probable forecasted transaction, the effective part of any gain or loss on the derivative financial instrument is recognised directly in other comprehensive income and accumulated in reserves in equity. The ineffective portion of any gain or loss is recognised immediately in profit or loss in the Income Statement. If a hedge of a forecast transaction subsequently results in the recognition of a financial asset or a financial liability, then the associated gains and losses that were recognised directly in other comprehensive income are reclassified into profit or loss in the Income Statement in the same period or periods in which the asset acquired or liability assumed affects the Income Statement (i.e. when interest income or expense is recognised).
When a hedging instrument expires or is sold, terminated or exercised, or the Consolidated Entity revokes designation of the hedge relationship but if the hedged forecast transaction is still expected to occur, the cumulative gain or loss at that point remains in other comprehensive income and is recognised in accordance with the above policy when the transaction occurs. If the hedged transaction is no longer expected to take place, then the cumulative unrealised gain or loss is recognised immediately in profit or loss in the Income Statement.
Net investment hedge
Hedges of net investments in foreign operations are accounted for similarly to cash flow hedges. Any foreign currency gain or loss on the hedging instrument relating to the effective portion of the hedge is recognised in other comprehensive income and accumulated in reserves in equity. To the extent the hedge is ineffective, a portion is recognised immediately in the Income Statement within other income or other expenses.
Derivatives that do not qualify for hedge accounting
Certain derivative instruments do not qualify for hedge accounting. Changes in the fair value of any derivative instrument that does not qualify for hedge accounting are recognised immediately in the Income Statement and are included in other income. The Bank has not designated any hedges as fair value hedges.
(b) Fair value of derivatives
The following table summarises the notional and fair value of the Consolidated Entity’s and Bank’s commitments to derivative financial instruments at reporting date. Fair value in relation to derivative financial instruments is estimated using net present value techniques. The table on the following page set out the fair values of the derivative financial instruments at 31 August 2014.

Bank of Queensland Limited and its Controlled Entities A.B.N. 32 009 656 740. 85
NOTES TO THE FINANCIAL STATEMENTS(Continued) Year Ended 31 August 2014
3.8. DERIVATIVE FINANCIAL INSTRUMENTS (CONTINUED)
(b) Fair value of derivatives (continued)
Consolidated
2014 2013
Notional Amount
Fair Value
Asset / (Liability) Notional Amount
Fair Value
Asset / (Liability)
$m Asset
$mLiability
$m $m Asset $m
Liability $m
Derivatives at fair value through income statement
Interest Rate Swaps 21,491.2 23.9 (11.4) 18,519.9 18.8 (2.5)
Foreign Exchange Forwards 261.3 1.0 (1.3) 72.4 1.5 (0.9)
Futures 12,720.0 4.6 - 8,300.0 5.8 -
34,472.5 29.5 (12.7) 26,892.3 26.1 (3.4)
Derivatives held as cash flow hedges
Interest Rate Swaps 29,512.5 99.3 (173.7) 22,857.4 143.6 (94.6)
Cross Currency Swaps 577.6 29.7 (44.3) 914.5 57.4 (38.5)
Foreign Exchange Forwards 387.1 1.5 (17.9) 455.6 33.1 (0.9)
30,477.2 130.5 (235.9) 24,227.5 234.1 (134.0)
Derivatives designated as net investment hedges
Foreign Exchange Forwards 17.4 0.3 - 15.5 0.2 -
64,967.1 160.3 (248.7) 51,135.3 260.4 (137.4)
Bank
2014 2013
Notional Amount
Fair Value
Asset / (Liability) Notional Amount
Fair Value
Asset / (Liability)
$m Asset
$mLiability
$m $m Asset $m
Liability $m
Derivatives at fair value through income statement
Interest Rate Swaps 20,915.8 23.9 (3.7) 18,519.9 18.8 (2.5)
Foreign Exchange Forwards 422.8 2.3 (1.3) 87.9 1.7 (0.9)
Futures 12,720.0 4.6 - 8,300.0 5.8 -
34,058.6 30.8 (5.0) 26,907.8 26.3 (3.4)
Derivatives held as cash flow hedges
Interest Rate Swaps 29,512.5 99.3 (173.8) 22,857.4 143.6 (94.6)
Cross Currency Swaps 159.0 0.3 (10.3) 377.3 31.0 (10.6)
Foreign Exchange Forwards 387.1 1.5 (17.9) 455.6 33.1 (0.9)
30,058.6 101.1 (202.0) 23,690.3 207.7 (106.1)
64,117.2 131.9 (207.0) 50,598.1 234.0 (109.5)

ANNUAL REPORT 201486
NOTES TO THE FINANCIAL STATEMENTS(Continued) Year Ended 31 August 2014
3.8 DERIVATIVE FINANCIAL INSTRUMENTS (CONTINUED)
(c) Master netting or similar arrangements
The Consolidated Entity enters into derivative transactions under International Swaps and Derivatives Association (ISDA) master netting agreements. Amounts owed by each counterparty are aggregated into a single net amount that is payable by one party to another. The Consolidated Entity has not offset these amounts in the Balance Sheets and the following table sets out the effect of netting arrangements on derivative financial assets and derivative financial liabilities if they were to be applied. The Consolidated Entity normally settles on a net basis or realises the derivative assets and liabilities simultaneously.
The Consolidated Entity receives and gives collateral in the form of cash in respect of derivatives and such collateral is subject to standard industry terms.
2014
Gross amounts as presented in the Balance Sheets
Net amounts of recognised assets and liabilities offset
Cash collateralNet amounts if
offsetting applied in the balance sheets
Derivative financial assets 160.3 (84.0) - 76.3
Derivative financial liabilities (248.7) 84.0 51.2 (113.5)
2013
Gross amounts as presented in the Balance Sheets
Net amounts of recognised assets and liabilities offset
Cash collateralNet amounts if
offsetting applied in the balance sheets
Derivative financial assets 260.4 (71.5) - 188.9
Derivative financial liabilities (137.4) 71.5 - (65.9)
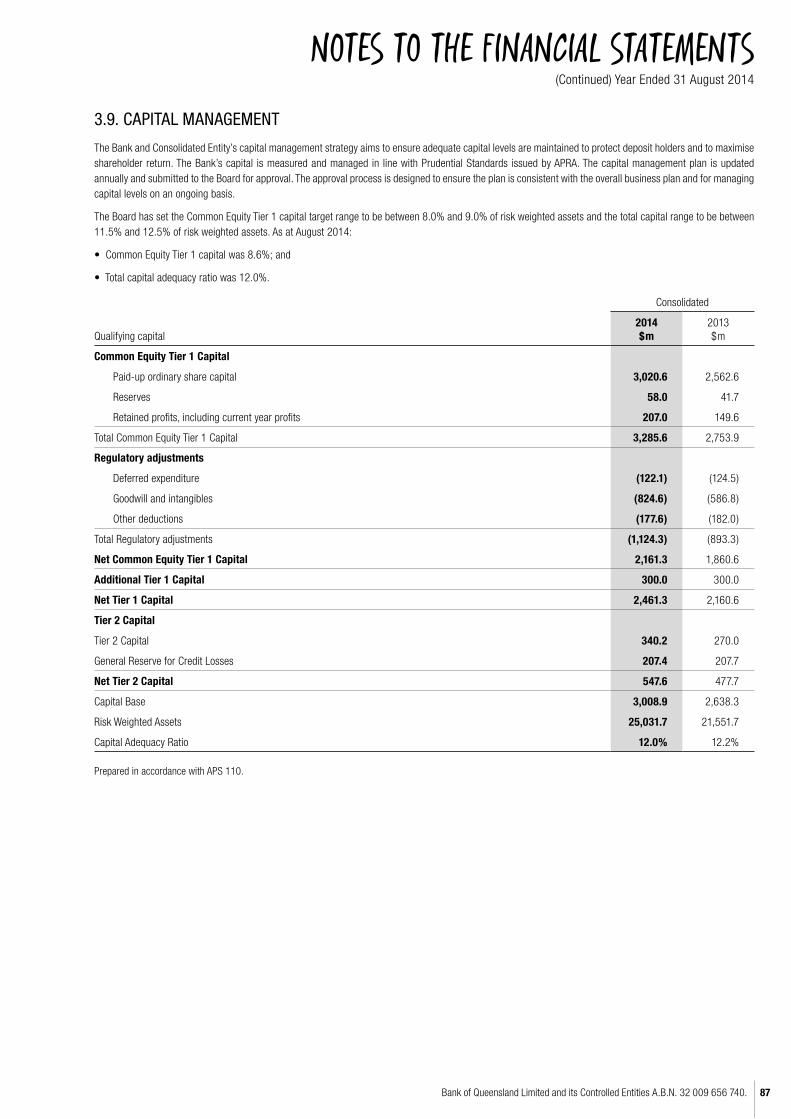
Bank of Queensland Limited and its Controlled Entities A.B.N. 32 009 656 740. 87
NOTES TO THE FINANCIAL STATEMENTS(Continued) Year Ended 31 August 2014
3.9. CAPITAL MANAGEMENT
The Bank and Consolidated Entity’s capital management strategy aims to ensure adequate capital levels are maintained to protect deposit holders and to maximise shareholder return. The Bank’s capital is measured and managed in line with Prudential Standards issued by APRA. The capital management plan is updated annually and submitted to the Board for approval. The approval process is designed to ensure the plan is consistent with the overall business plan and for managing capital levels on an ongoing basis.
The Board has set the Common Equity Tier 1 capital target range to be between 8.0% and 9.0% of risk weighted assets and the total capital range to be between 11.5% and 12.5% of risk weighted assets. As at August 2014:
• Common Equity Tier 1 capital was 8.6%; and
• Total capital adequacy ratio was 12.0%.
Consolidated
Qualifying capital2014 $m
2013 $m
Common Equity Tier 1 Capital
Paid-up ordinary share capital 3,020.6 2,562.6
Reserves 58.0 41.7
Retained profits, including current year profits 207.0 149.6
Total Common Equity Tier 1 Capital 3,285.6 2,753.9
Regulatory adjustments
Deferred expenditure (122.1) (124.5)
Goodwill and intangibles (824.6) (586.8)
Other deductions (177.6) (182.0)
Total Regulatory adjustments (1,124.3) (893.3)
Net Common Equity Tier 1 Capital 2,161.3 1,860.6
Additional Tier 1 Capital 300.0 300.0
Net Tier 1 Capital 2,461.3 2,160.6
Tier 2 Capital
Tier 2 Capital 340.2 270.0
General Reserve for Credit Losses 207.4 207.7
Net Tier 2 Capital 547.6 477.7
Capital Base 3,008.9 2,638.3
Risk Weighted Assets 25,031.7 21,551.7
Capital Adequacy Ratio 12.0% 12.2%
Prepared in accordance with APS 110.

ANNUAL REPORT 201488
NOTES TO THE FINANCIAL STATEMENTS(Continued) Year Ended 31 August 2014
3.10. CAPITAL AND RESERVES
(a) Ordinary Shares
Ordinary shares
Ordinary shares are classified as equity. Incremental costs directly attributable to the issue of ordinary shares and share options are recognised as a deduction from equity, net of any tax effects.
Treasury shares
Ordinary shares of the Bank may be purchased from time to time by a subsidiary of the Bank authorised to do so under the Bank’s Award Rights Plan. Where these shares remain unvested to employees thy are treated as treasury shares and deducted from capital as required by AASB 132 Financial Instruments: Presentation and Disclosure. No profit or loss is recorded on purchase, sale, issue or cancellation of these shares.
Consolidated Bank
2014 Number
2013 Number
2014 Number
2013 Number
Movements during the year
Balance at the beginning of the year – fully paid 319,810,294 308,797,525 319,810,294 308,797,525
Dividend reinvestment plan 5,437,296 7,809,654 5,437,296 7,809,654
Virgin Money (Australia) Pty Limited acquisition (1) - 3,203,115 - 3,203,115
BOQ Specialist Bank Limited (2) 37,269,245 - 37,269,245 -
Balance at the end of the year – fully paid 362,516,835 319,810,294 362,516,835 319,810,294
Treasury shares (included in ordinary shares above)
Balance at the beginning of the year 162,371 867,293 29,851 304,580
Net acquisitions and disposals during the year 135,208 (704,922) (29,851) (274,729)
Balance at the end of the year 297,579 162,371 - 29,851
(1) In the prior year, the Bank acquired 100% of Virgin Money (Australia) Pty Limited for $42.6m. $30.6 million of new shares were issued in two tranches (Tranche 1 - 1,585,353 and Tranche 2 - 1,617,762) as part of the acquisition consideration. Fair value of the ordinary shares issued was based on the listed share price of BOQ at 30 April 2013 of $10.24 per share.
(2) On 31 July 2014, the Bank acquired 100% of BOQ Specialist Bank Limited formerly Investec Bank (Australia) Limited. $210 million of the consideration was financed through the issue of new shares by way of Institutional Entitlement and Retail Entitlement offers.
Terms and conditions
Holders of ordinary shares are entitled to receive dividends as determined from time to time and are entitled to one vote per share at shareholders’ meetings. In the event of winding up of the Bank, ordinary shareholders rank after preference shareholders and creditors and are fully entitled to any residual proceeds of liquidation.
(b) Perpetual Equity Preference Shares (“PEPS”)
Preference shares
Preference share capital is classified as equity if it is non-redeemable. Dividends thereon are recognised as distributions within equity upon declaration by the Directors.
Preference share capital is classified as a financial liability if it is redeemable on a specific date. Dividends thereon are recognised as interest expense in the Income Statement as accrued.
Consolidated Bank
2014 Number
2013 Number
2014 Number
2013 Number
Balance at beginning of the year – fully paid - 2,000,000 - 2,000,000
Balance at end of the year – fully paid - - - -
On 15 April 2013, the Bank redeemed the 198,661 remaining PEPS on issue in accordance with the PEPS terms of issue. The remaining PEPS were redeemed at the redemption price of $100 per PEPS plus the final PEPS dividend paid on 15 April 2013.

Bank of Queensland Limited and its Controlled Entities A.B.N. 32 009 656 740. 89
NOTES TO THE FINANCIAL STATEMENTS(Continued) Year Ended 31 August 2014
3.10. CAPITAL AND RESERVES (CONTINUED)(c) Nature and purpose of reserves
Employee benefits reserve
The employee equity benefits reserve is used to record the value of share based payments provided to employees, including key management personnel, as part of their remuneration. Refer to Section 6.1 for further details of these plans.
Equity reserve for credit losses
Refer to significant accounting policies Section 6.10 (h).
Available-for-sale reserve
Changes in the fair value of investments, such as bonds and floating rate notes classified as available-for-sale financial assets, are recognised in other comprehensive income as described in Section 3.7 (a)(ii) and accumulated in a separate reserve within equity. Amounts are reclassified to profit or loss when the associated assets are sold or impaired.
Cash flow hedge reserve
The hedging reserve is used to record gains or losses on a hedging instrument in a cash flow hedge that are recognised in other comprehensive income, as described in Section 3.8 (a). Amounts are reclassified to profit or loss when the associated hedged transaction affects profit or loss.

ANNUAL REPORT 201490
NOTES TO THE FINANCIAL STATEMENTS(Continued) Year Ended 31 August 2014
SECTION 4. OTHER ASSETS AND LIABILITIES
4.1. INTANGIBLE ASSETS
Consolidated Bank
Goodwill$m
Customer related
intangibles and brands
$m
Computer software
$mOther$m
Total$m
Goodwill$m
Customer contracts
$m
Computer software
$mOther$m
Total$m
Cost
Balance as at 1 September 2012 444.4 107.4 203.8 7.4 763.0 8.1 5.0 191.0 2.1 206.2
Additions 43.6 - 29.0 2.1 74.7 - - 28.6 2.1 30.7
Disposals - - (2.0) - (2.0) - - (0.6) - (0.6)
Balance as at 31 August 2013 488.0 107.4 230.8 9.5 835.7 8.1 5.0 219.0 4.2 236.3
Balance as at 1 September 2013 488.0 107.4 230.8 9.5 835.7 8.1 5.0 219.0 4.2 236.3
Additions 213.7 - 50.7 1.0 265.4 - - 46.9 1.0 47.9
Disposals - - (5.4) - (5.4) - - (4.1) - (4.1)
Balance as at 31 August 2014 701.7 107.4 276.1 10.5 1,095.7 8.1 5.0 261.8 5.2 280.1
Amortisation and impair-ment losses
Balance as at 1 September 2012 - 60.7 144.2 3.5 208.4 - 5.0 140.5 1.4 146.9
Amortisation for the year - 14.6 18.6 1.4 34.6 - - 16.5 1.4 17.9
Balance as at 31 August 2013 - 75.3 162.8 4.9 243.0 - 5.0 157.0 2.8 164.8
Balance as at 1 September 2013 - 75.3 162.8 4.9 243.0 - 5.0 157.0 2.8 164.8
Amortisation for the year - 10.3 14.7 1.0 26.0 - - 12.9 1.0 13.9
Disposals - - (0.5) - (0.5) - - (0.1) - (0.1)
Balance as at 31 August 2014 - 85.6 177.0 5.9 268.5 - 5.0 169.8 3.8 178.6
Carrying amounts
Carrying amount as at 1 September 2012 444.4 46.7 59.6 3.9 554.6 8.1 - 50.5 0.7 59.3
Carrying amount as at 31 August 2013 488.0 32.1 68.0 4.6 592.7 8.1 - 62.0 1.4 71.5
Carrying amount as at 31 August 2014 701.7 21.8 99.1 4.6 827.2 8.1 - 92.0 1.4 101.5
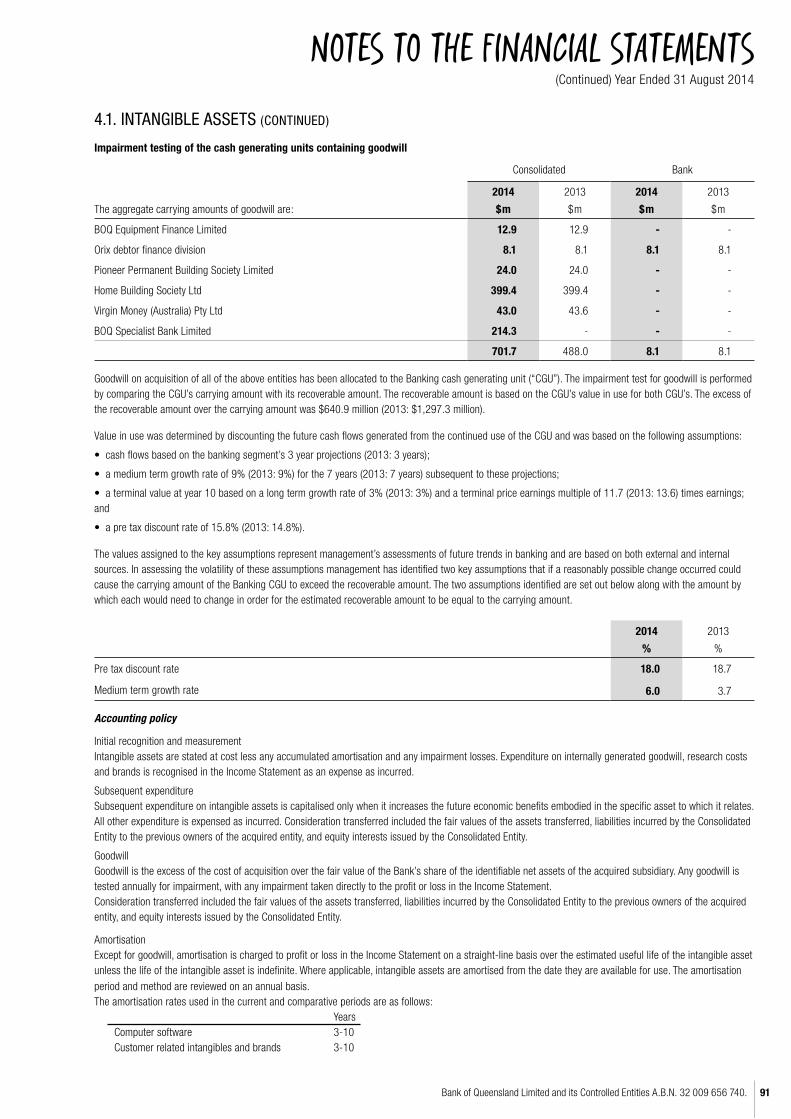
Bank of Queensland Limited and its Controlled Entities A.B.N. 32 009 656 740. 91
NOTES TO THE FINANCIAL STATEMENTS(Continued) Year Ended 31 August 2014
4.1. INTANGIBLE ASSETS (CONTINUED)
Impairment testing of the cash generating units containing goodwill
Consolidated Bank
The aggregate carrying amounts of goodwill are:
2014
$m
2013
$m
2014
$m
2013
$m
BOQ Equipment Finance Limited 12.9 12.9 - -
Orix debtor finance division 8.1 8.1 8.1 8.1
Pioneer Permanent Building Society Limited 24.0 24.0 - -
Home Building Society Ltd 399.4 399.4 - -
Virgin Money (Australia) Pty Ltd 43.0 43.6 - -
BOQ Specialist Bank Limited 214.3 - - -
701.7 488.0 8.1 8.1
Goodwill on acquisition of all of the above entities has been allocated to the Banking cash generating unit (“CGU”). The impairment test for goodwill is performed by comparing the CGU’s carrying amount with its recoverable amount. The recoverable amount is based on the CGU’s value in use for both CGU’s. The excess of the recoverable amount over the carrying amount was $640.9 million (2013: $1,297.3 million).
Value in use was determined by discounting the future cash flows generated from the continued use of the CGU and was based on the following assumptions:
• cash flows based on the banking segment’s 3 year projections (2013: 3 years);
• a medium term growth rate of 9% (2013: 9%) for the 7 years (2013: 7 years) subsequent to these projections;
• a terminal value at year 10 based on a long term growth rate of 3% (2013: 3%) and a terminal price earnings multiple of 11.7 (2013: 13.6) times earnings; and
• a pre tax discount rate of 15.8% (2013: 14.8%).
The values assigned to the key assumptions represent management’s assessments of future trends in banking and are based on both external and internal sources. In assessing the volatility of these assumptions management has identified two key assumptions that if a reasonably possible change occurred could cause the carrying amount of the Banking CGU to exceed the recoverable amount. The two assumptions identified are set out below along with the amount by which each would need to change in order for the estimated recoverable amount to be equal to the carrying amount.
2014
%
2013
%
Pre tax discount rate 18.0 18.7
Medium term growth rate 6.0 3.7
Accounting policy
Initial recognition and measurement Intangible assets are stated at cost less any accumulated amortisation and any impairment losses. Expenditure on internally generated goodwill, research costs and brands is recognised in the Income Statement as an expense as incurred.
Subsequent expenditure Subsequent expenditure on intangible assets is capitalised only when it increases the future economic benefits embodied in the specific asset to which it relates. All other expenditure is expensed as incurred. Consideration transferred included the fair values of the assets transferred, liabilities incurred by the Consolidated Entity to the previous owners of the acquired entity, and equity interests issued by the Consolidated Entity.
GoodwillGoodwill is the excess of the cost of acquisition over the fair value of the Bank’s share of the identifiable net assets of the acquired subsidiary. Any goodwill is tested annually for impairment, with any impairment taken directly to the profit or loss in the Income Statement. Consideration transferred included the fair values of the assets transferred, liabilities incurred by the Consolidated Entity to the previous owners of the acquired entity, and equity interests issued by the Consolidated Entity.
Amortisation Except for goodwill, amortisation is charged to profit or loss in the Income Statement on a straight-line basis over the estimated useful life of the intangible asset unless the life of the intangible asset is indefinite. Where applicable, intangible assets are amortised from the date they are available for use. The amortisation period and method are reviewed on an annual basis. The amortisation rates used in the current and comparative periods are as follows: Years Computer software 3-10 Customer related intangibles and brands 3-10

ANNUAL REPORT 201492
NOTES TO THE FINANCIAL STATEMENTS(Continued) Year Ended 31 August 2014
4.2. PROVISIONS Consolidated Bank
2014 $m
2013 $m
2014 $m
2013 $m
Employee benefits (1) 21.5 15.4 15.3 13.1
Leases 5.3 0.8 3.1 0.4
Product Review (2) 36.4 44.6 36.4 44.6
Provision for non-lending loss (3) 34.0 10.6 33.4 10.6
Other (4) 6.9 7.5 - -
Total 104.1 78.9 88.2 68.7
(1) Employee benefits provisions consist of annual leave and long service leave entitlements for employees. (2) Product review provision for customer refunds and review costs. (3) Included within the Non-lending losses provision is $31.5m in respect of the Storm Financial settlement. On 22 September 2014, the Bank announced an agreement to settle the outstanding Storm Financial proceed-ings which had been brought against the Bank by the Australia Securities and Investment Commission (ASIC) and a class action on behalf of borrowers advised by Storm Financial. Timing of settlement is unknown and subject to court approval of the agreed settlement provisions. (4) Other provisions include provision for non-lending losses and in the Consolidated Entity, insurance claims reserves.
Movements in provisions Movements in each class of provision during the year, other than employee benefits, are as follows:
Consolidated Bank
2014Leases
$m
Product Review
$mNon-lending
lossOther $m
Leases $m
Product Review
$mNon-lending
lossOther $m
Carrying amount at beginning of year 0.8 44.6 10.6 7.5 0.4 44.6 10.6 -
Additional provision recognised 5.6 - 33.0 (0.6) 3.6 - 32.5 -
Amounts utilised during the year (1.1) (8.2) (9.6) - (0.9) (8.2) (9.7) -
Carrying amount at end of year 5.3 36.4 34.0 6.9 3.1 36.4 33.4 -
Accounting policy
A provision is recognised in the Balance Sheet when the Consolidated Entity has a present legal or constructive obligation as a result of a past event, and it is probable that an outflow of economic benefits will be required to settle the obligation. If the effect is material, provisions are determined by discounting the expected future cash flows at a pre-tax rate that reflects current market assessments of the time value of money and, when appropriate, the risks specific to the liability.
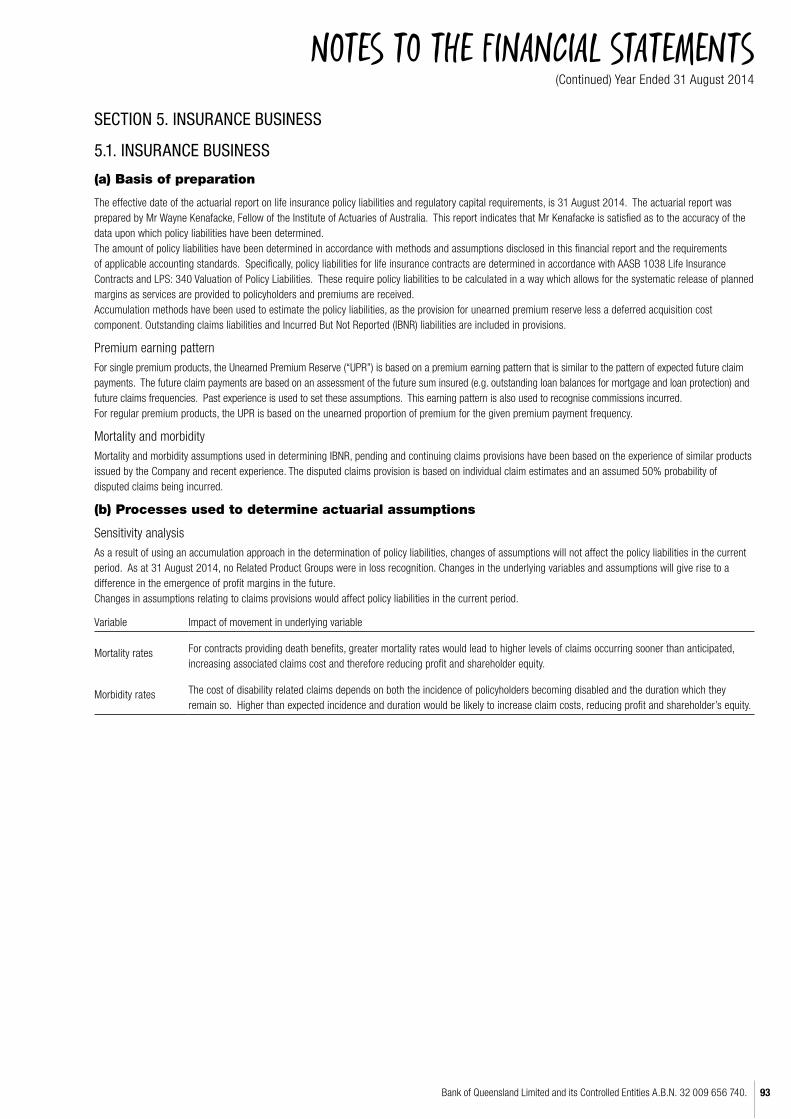
Bank of Queensland Limited and its Controlled Entities A.B.N. 32 009 656 740. 93
NOTES TO THE FINANCIAL STATEMENTS(Continued) Year Ended 31 August 2014
SECTION 5. INSURANCE BUSINESS
5.1. INSURANCE BUSINESS
(a) Basis of preparation
The effective date of the actuarial report on life insurance policy liabilities and regulatory capital requirements, is 31 August 2014. The actuarial report was prepared by Mr Wayne Kenafacke, Fellow of the Institute of Actuaries of Australia. This report indicates that Mr Kenafacke is satisfied as to the accuracy of the data upon which policy liabilities have been determined.The amount of policy liabilities have been determined in accordance with methods and assumptions disclosed in this financial report and the requirements of applicable accounting standards. Specifically, policy liabilities for life insurance contracts are determined in accordance with AASB 1038 Life Insurance Contracts and LPS: 340 Valuation of Policy Liabilities. These require policy liabilities to be calculated in a way which allows for the systematic release of planned margins as services are provided to policyholders and premiums are received.Accumulation methods have been used to estimate the policy liabilities, as the provision for unearned premium reserve less a deferred acquisition cost component. Outstanding claims liabilities and Incurred But Not Reported (IBNR) liabilities are included in provisions.
Premium earning pattern
For single premium products, the Unearned Premium Reserve (“UPR”) is based on a premium earning pattern that is similar to the pattern of expected future claim payments. The future claim payments are based on an assessment of the future sum insured (e.g. outstanding loan balances for mortgage and loan protection) and future claims frequencies. Past experience is used to set these assumptions. This earning pattern is also used to recognise commissions incurred.For regular premium products, the UPR is based on the unearned proportion of premium for the given premium payment frequency.
Mortality and morbidity
Mortality and morbidity assumptions used in determining IBNR, pending and continuing claims provisions have been based on the experience of similar products issued by the Company and recent experience. The disputed claims provision is based on individual claim estimates and an assumed 50% probability of disputed claims being incurred.
(b) Processes used to determine actuarial assumptions
Sensitivity analysis
As a result of using an accumulation approach in the determination of policy liabilities, changes of assumptions will not affect the policy liabilities in the current period. As at 31 August 2014, no Related Product Groups were in loss recognition. Changes in the underlying variables and assumptions will give rise to a difference in the emergence of profit margins in the future.Changes in assumptions relating to claims provisions would affect policy liabilities in the current period.
Variable Impact of movement in underlying variable
Mortality rates For contracts providing death benefits, greater mortality rates would lead to higher levels of claims occurring sooner than anticipated, increasing associated claims cost and therefore reducing profit and shareholder equity.
Morbidity rates The cost of disability related claims depends on both the incidence of policyholders becoming disabled and the duration which they remain so. Higher than expected incidence and duration would be likely to increase claim costs, reducing profit and shareholder’s equity.

ANNUAL REPORT 201494
NOTES TO THE FINANCIAL STATEMENTS(Continued) Year Ended 31 August 2014
5.1. INSURANCE BUSINESS (CONTINUED)
(c) Reconciliation of movements
2014 $m
2013 $m
Reconciliation of movements in insurance policy liabilities
Life Insurance contract policy liabilities
Gross life insurance contract liabilities at the beginning of the financial year 60.7 62.6
Decrease in life insurance contract policy liabilities (i) (8.8) (1.9)
Gross life insurance contract liabilities at the end of the financial year 51.9 60.7
Liabilities ceded under reinsurance
Opening balance at the beginning of the financial year (2.3) (2.8)
Decrease in life reinsurance assets (ii) 0.4 0.5
Closing balance at the end of the financial year (1.9) (2.3)
Net life policy liabilities at the end of the financial year 50.0 58.4
(i) plus (ii) = change in life insurance contract liabilities reflected in the Income Statement (8.4) (1.4)
Components of net life insurance contract liabilities
Future policy benefits 75.9 81.4
Future charges for acquisition costs (25.9) (23.0)
Total net life insurance contract policy liabilities 50.0 58.4
Components of general insurance liabilities
Unearned Premium Liability 12.1 13.3
Outstanding Claims Liability 0.9 0.8
13.0 14.1
Total Insurance Policy Liabilities 63.0 72.5
Note: Future policy benefits include the unearned premium components of the liability. The accumulation method has been used to calculate policy liabilities and components relating to expenses and profits are not separately calculated.
(d) Life Insurance Regulatory Capital requirementsThe regulatory capital requirement of each fund and for the subsidiary in total is the amount required to be held in accordance with LPS 110: Capital Adequacy. These are amounts required to meet the prudential standards prescribed by the Life Insurance Act 1995 to provide protection against the impact of fluctuations and unexpected adverse circumstances on the life company.
The methodology and bases for determining the Capital Base and regulatory capital requirements are in accordance with relevant Prudential Requirements.

Bank of Queensland Limited and its Controlled Entities A.B.N. 32 009 656 740. 95
NOTES TO THE FINANCIAL STATEMENTS(Continued) Year Ended 31 August 2014
5.1. INSURANCE BUSINESS (CONTINUED)
(d) Life Insurance Regulatory Capital requirements (continued)
2014
Statutory Fund No. 1
$m
Shareholders’ Fund
$m
Capital Base
Net Assets 29.0 0.9
Add / (subtract) regulatory adjustments to Net Assets (8.7) -
Total capital base 20.3 0.9
Asset risk charge 1.3 -
Operational risk charge 1.9 -
Total prescribed capital amount 3.2 -
Assets in excess of prescribed capital amount 17.1 0.9
Capital adequacy multiple 6.5 88.2
2014 $m
2013 $m
Composition of capital Base
Common equity tier 1 capital 29.9 33.4
Subtract regulatory adjustments to common equity tier 1 capital (8.7) (11.6)
Total capital base 21.2 21.8
Prescribed Capital Amount
Statutory Fund No. 1 3.2 3.4
Additional amount to meet company minimum 6.8 6.6
Total prescribed capital amount 10.0 10.0
Assets in excess of prescribed capital amount 11.2 11.8
Capital adequacy multiple 2.1 2.2

ANNUAL REPORT 201496
NOTES TO THE FINANCIAL STATEMENTS(Continued) Year Ended 31 August 2014
5.1. INSURANCE BUSINESS (CONTINUED)
(d) Life Insurance Regulatory Capital requirements (continued)
Disaggregated information life insurance (before consolidation adjustments)
Summarised Statement of Profit and Loss and Other Comprehensive Income2014 $m
2013 $m
Revenue
Life insurance premium revenue 56.2 62.3
Investment income 3.6 4.4
Net life insurance revenue 59.8 66.7
Expenses
Net claims and other liability expense from insurance contracts 26.6 35.0
Other expenses 5.5 7.4
32.1 42.4
Profit before income tax 27.7 24.3
Income tax expense (8.3) (7.3)
Profit after income tax 19.4 17.0
Statement of Sources of Profit for Statutory Funds
Operating profit after income tax arose from:
Components of profit related to movement in life insurance liabilities:
Planned margins of revenues over expenses released 16.7 15.3
Difference between actual and assumed experience 1.2 (0.1)
Investment earnings on assets in excess of life insurance policy liabilities and provision 1.4 1.2
Summarised Balance Sheet
Assets
Investment assets 99.0 98.5
Other assets 1.7 2.1
100.7 100.6
Liabilities
Net life insurance liabilities 46.8 50.2
Liabilities other than life insurance liabilities 24.0 16.9
70.8 67.1
Issued capital, reserves and retained profits
Directly attributable to shareholders 29.9 33.4
29.9 33.4
The life insurance business has no life investment contracts.
Accounting policy
Principles for life insurance
The life insurance operations of the Consolidated Entity are conducted within separate funds as required by the Life Insurance Act 1995 and is reported in aggregate with the Shareholders’ Fund in the Income Statement, Balance Sheet and Statement of Cash Flows of the Consolidated Entity. The life insurance operations of the Consolidated Entity comprise the selling and administration of life insurance contracts.Life insurance contracts involve the acceptance of significant insurance risk. Insurance risk is defined as significant if, and only if, an insured event could cause an insurer to pay significant additional benefits in any scenario, excluding scenarios that lack commercial substance (i.e. have no discernible effect on the economics of the transaction).

Bank of Queensland Limited and its Controlled Entities A.B.N. 32 009 656 740. 97
NOTES TO THE FINANCIAL STATEMENTS(Continued) Year Ended 31 August 2014
5.1. INSURANCE BUSINESS (CONTINUED)
Accounting policy (continued)
Any products sold that do not meet the definition of a life insurance contract are classified as life investment contracts. Insurance contracts include those where the insured benefit is payable on the occurrence of a specified event such as death, injury or disability caused by accident or illness. The insured benefit is either not linked or only partly linked to the market value of the investments held by the Consolidated Entity, and the financial risks are substantially borne by the Consolidated Entity.
Monies held in the statutory fund are subject to distribution and transfer restrictions and other requirements of the Life Insurance Act 1995. Under AASB 1038, the financial statements must include all assets, liabilities, revenues, expenses and equity, irrespective of whether they are designated as relating to shareholders or policy owners. Therefore, the Consolidated Entity’s financial statements comprise the total of all statutory funds and the Shareholders’ Fund.
Insurance contract liability
Profits of the insurance contract business are brought to account on a Margin on Services (“MoS”) basis in accordance with guidance provided by LPS 1.04: Valuation of Policy Liabilities as determined by APRA. Under MoS, profit is recognised as fees are received and services are provided to policyholders. When fees are received but the service has not been provided, the profit is deferred. Losses are expensed when identified.
Consistent with the principle of deferring unearned profit is the requirement to defer expenditure associated with the deferred profit. MoS permits costs associated with the acquisition of policies to be charged to profit or loss in the Income Statement over the period that the policy will generate profits. Costs may only be deferred to the extent that a policy is expected to be profitable.
Profit arising from life insurance is based on actuarial assumptions, and calculated as the excess of premiums and investment earnings less claims, operating expenses and the amortisation of acquisition costs that will be incurred over the estimated life of the policies. The profit is systematically recognised over the estimated time period the policy will remain in force.Under MoS, insurance contract liabilities may be valued using an accumulation approach where this does not result in a material difference to the projection approach. The accumulation approach is deemed appropriate by the Directors and the appointed actuary. Under this approach, premiums received are deferred and earned in accordance with the underlying incidence of risk. Costs of acquiring insurance contracts, both direct and indirect, are deferred to the extent that related product groups are expected to be profitable. Where a related product group is not expected to be profitable, the insurance contract liability is increased by the excess of the present value of future expenses over future revenues.
Revenue Recognition
Premiums in respect of life insurance contracts are recognised as revenue in the Income Statement from the date of attachment of risk. Premiums with no due date are recognised as revenue on a received basis. Premiums with a regular due date are recognised as revenue on an accruals basis. Unpaid premiums are only recognised as revenue during the days of grace or where secured by the surrender value of the policy and are included in the intergroup balance in the Balance Sheet.Investment income is recognised on an accruals basis. Realised and unrealised gains and losses are included in the Income Statement as investment income.
Claims expense – insurance contracts Claims incurred all relate to the provision of services, including the bearing of risks, and are treated as expenses. Claims are recognised when the liability to the policyholder under the policy contract has been established. Claims recognition is based upon:• cost estimates for losses reported to the close of the financial year; and• estimated incurred, but not reported losses, based upon past experience.Deferred acquisition costs - Life insurance contracts The fixed and variable costs of acquiring new life insurance business are deferred to the extent that such costs are deemed recoverable from future premiums or policy charges. These costs include commission, policy issue and underwriting costs, certain advertising costs and other sales costs. Acquisition costs deferred are limited to the lesser of the actual costs incurred and the allowance for the recovery of such costs in the premium or policy charges. The actual acquisition costs incurred are recorded in profit or loss in the Income Statement. The value and future recovery of these costs are assessed in determining policy liabilities. This has the effect that acquisition costs are deferred within the policy liability balance and amortised over the period that they will be recovered from premiums or policy charges.
Critical Accounting Judgements and Estimates:
The Consolidated Entity’s insurance subsidiary makes estimates and assumptions that affect the reported amounts of assets and liabilities within the next financial year. Estimates and judgements are continually evaluated and are based on historical experience and other factors, including expectations of future events that are believed to be reasonable under the circumstances. The areas where critical accounting judgements and estimates are applied are noted below.
Policy liabilities
Policy liabilities for life insurance contracts are computed using statistical or mathematical methods, which are expected to give approximately the same results as if an individual liability was calculated for each contract. The computations are made by suitably qualified personnel on the basis of recognised actuarial methods, with due regard to relevant actuarial principles. The methodology takes into account the risks and uncertainties of the particular classes of life insurance business written. The key factors that affect the estimation of these liabilities and related assets are:
• The cost of providing benefits and administering these insurance contracts;
• Mortality and morbidity experience on life insurance products, including enhancements to policyholder benefits; and
• Discontinuance experience, which affects the Bank’s ability to recover the cost of acquiring new business over the lives of the contracts.
In addition, factors such as regulation, competition, interest rates, taxes, securities market conditions and general economic conditions affect the level of these liabilities.

ANNUAL REPORT 201498
NOTES TO THE FINANCIAL STATEMENTS(Continued) Year Ended 31 August 2014
SECTION 6. OTHER NOTES
6.1. EMPLOYEE BENEFITS
(a) Superannuation commitmentsThe Consolidated Entity contributes to defined contribution superannuation plans which comply with the Superannuation Industry (Supervision) Act 1993.
Basis of contributions
Employee superannuation contributions are based on various percentages of employees’ gross salaries. The Consolidated Entity’s contributions are also based on various percentages of employees’ gross salaries.
The Consolidated Entity is under no legal obligation to make superannuation contributions except for the minimum contributions required under the Superannuation Guarantee Legislation.
During the year, employer contributions were made, refer to Section 2.2.
(b) Share based payments
(i) Description of share based payments
Long-Term Incentives - Award Rights
The Award Rights Plan was approved by shareholders on 11 December 2008. It is an equity based program under which Award Rights are granted as long-term incentives. The two types of award rights currently granted to executives under the plan are PARs and DARs. No amount is payable by employees for the grant or exercise of these award rights.
PARs
PARs have a vesting framework based on TSR of the Bank as measured against a Peer Group over a 2 to 3 year period. That Peer Group consists of the S&P / ASX 200 from time to time excluding selected entities in resources, real estate investment trusts, telecommunications (offshore headquartered), energy and utilities and such other inclusions and exclusions as the Board considers appropriate. TSR is a measure of the entire return a shareholder would obtain from holding an entity’s securities over a period, taking into account factors such as changes in the market value of the securities and dividends paid over the period.One half of an employee’s PARs will vest if the Bank’s TSR performance over the three year period is in the top 50% of the Peer Group. All of the PARs vest if the Bank’s TSR performance is in the top 25%. For TSR performance between those targets, a relative proportion of the PARs between 50% and 100% would vest.Vested PARs are generally exercisable within 5 years after they are granted (approximately 2 years after vesting). a
DARs
There are no market performance hurdles or vesting conditions for DARs but the holder must remain an employee of the Bank. Vested DARs are generally exercisable within 5 years after they are granted (approximately 2 to 4 years after vesting).
Restricted Shares
The Consolidated Entity has used shares with restrictions on disposal as a non-cash, share based component of both short term and long term incentive awards.The number of award rights and restricted shares on issue is as follows:
Deferred Award Rights Performance Award Rights Restricted Shares
2014 ’000
2013 ’000
2014 ’000
2013 ’000
2014 ’000
2013 ’000
Balance at beginning of the year 1,029 1,112 1,462 1,099 29 204
Granted during the year 408 515 904 756 198 -
Forfeited / expired during the year (39) (136) (90) (352) - -
Exercised during the year (457) (462) (78) (41) (30) (175)
Outstanding at the end of the year 941 1,029 2,198 1,462 197 29
(ii) Measurement of fair values
The fair value of the PARs and DARs has been measured using the trinomial pricing methodology.Restricted shares have been valued based on the volume weighted average price of ordinary shares in BOQ sold on the ASX during a 10 day trading period. The shares vest on the respective expiry dates and meeting certain service conditions.
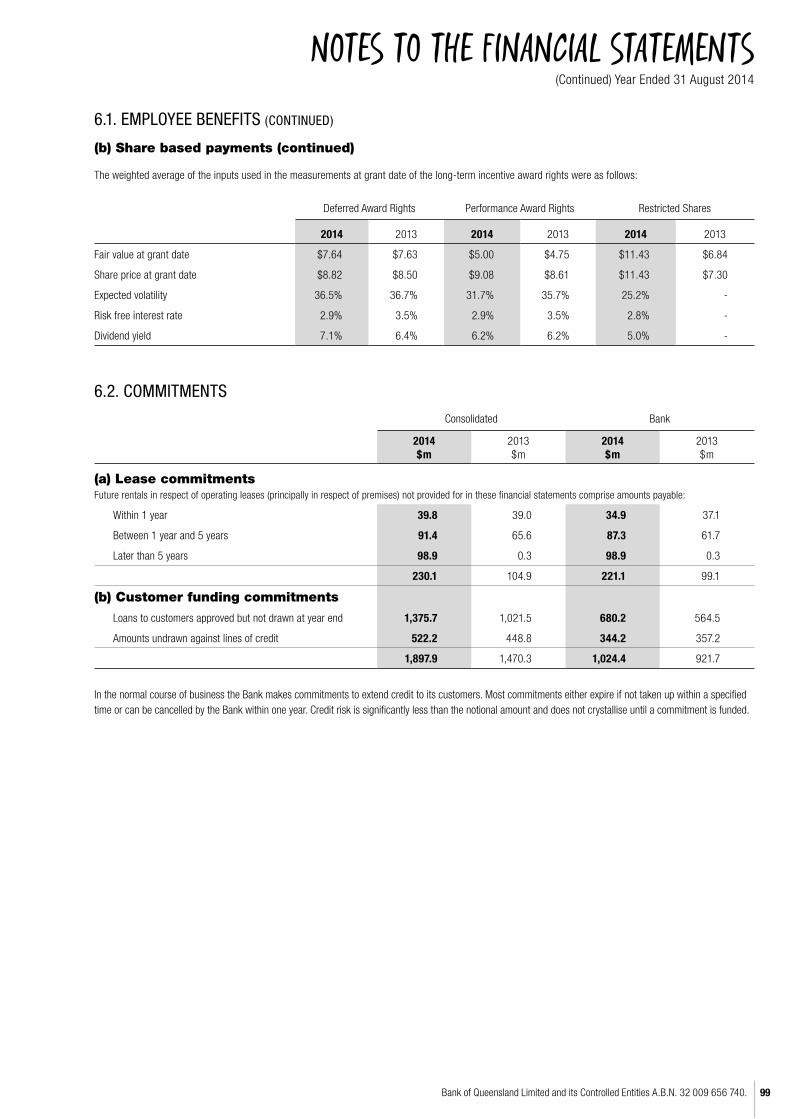
Bank of Queensland Limited and its Controlled Entities A.B.N. 32 009 656 740. 99
NOTES TO THE FINANCIAL STATEMENTS(Continued) Year Ended 31 August 2014
6.1. EMPLOYEE BENEFITS (CONTINUED)
(b) Share based payments (continued)
The weighted average of the inputs used in the measurements at grant date of the long-term incentive award rights were as follows:
Deferred Award Rights Performance Award Rights Restricted Shares
2014 2013 2014 2013 2014 2013
Fair value at grant date $7.64 $7.63 $5.00 $4.75 $11.43 $6.84
Share price at grant date $8.82 $8.50 $9.08 $8.61 $11.43 $7.30
Expected volatility 36.5% 36.7% 31.7% 35.7% 25.2% -
Risk free interest rate 2.9% 3.5% 2.9% 3.5% 2.8% -
Dividend yield 7.1% 6.4% 6.2% 6.2% 5.0% -
6.2. COMMITMENTS
Consolidated Bank
2014 $m
2013 $m
2014 $m
2013 $m
(a) Lease commitmentsFuture rentals in respect of operating leases (principally in respect of premises) not provided for in these financial statements comprise amounts payable:
Within 1 year 39.8 39.0 34.9 37.1
Between 1 year and 5 years 91.4 65.6 87.3 61.7
Later than 5 years 98.9 0.3 98.9 0.3
230.1 104.9 221.1 99.1
(b) Customer funding commitments
Loans to customers approved but not drawn at year end 1,375.7 1,021.5 680.2 564.5
Amounts undrawn against lines of credit 522.2 448.8 344.2 357.2
1,897.9 1,470.3 1,024.4 921.7
In the normal course of business the Bank makes commitments to extend credit to its customers. Most commitments either expire if not taken up within a specified time or can be cancelled by the Bank within one year. Credit risk is significantly less than the notional amount and does not crystallise until a commitment is funded.

ANNUAL REPORT 2014100
NOTES TO THE FINANCIAL STATEMENTS(Continued) Year Ended 31 August 2014
6.3. CONTINGENT LIABILITIES
Consolidated Bank
2014 $m
2013 $m
2014 $m
2013 $m
Guarantees 239.9 227.3 215.4 227.3
Letters of credit 12.3 8.4 12.3 8.4
252.2 235.7 227.7 235.7
Guarantees, indemnities and letters of credit
There are contingent liabilities arising in the normal course of business for which there are equal and opposite contingent assets and against which no loss is
anticipated. Guarantees are provided to third parties on behalf of customers. The credit risks of such facilities are similar to the credit risks of loans and advances.
Legal proceedings
On 13 February 2014 judgement was given in favour of the Bank for proceedings involving the Bank by a number of former Owner-Managers in NSW. An appeal
has been filed in relation to this judgement. At this stage no estimate of any potential liability can be made.
6.4. RELATED PARTIES INFORMATION
(a) Controlled entities
Details of interests in material controlled entities are set out in Section 6.5.
During the year there have been transactions between the Bank and all of its controlled entities. The Bank conducted normal banking business with its
operating controlled entities. Amounts owing to or from controlled entities do not attract interest, except in respect of BOQ Equipment Finance Limited, St
Andrew’s Australia Services Pty Ltd, BOQ Finance (Aust) Ltd, BOQ Finance (NZ) Ltd and Virgin Money (Australia) Pty Limited where interest is charged on normal
terms and conditions.
The Bank receives management fees from B.Q.L. Management Pty Ltd and BOQ Equipment Finance Limited.
The Bank has a related party relationship with equity accounted joint ventures, refer to Section 6.7.
(b) Key management personnel compensation
Key management personnel have authority and responsibility for planning, directing and controlling the activities of the Bank and the Consolidated Entity,
including Directors and other executives.
Key management personnel compensation included in ‘administrative expenses’ and ‘employee expenses’ (refer to Section 2.2) is as follows:
Consolidated and Bank
2014 $
2013 $
Short-term employee benefits 9,599,506 9,343,008
Post-employment benefits 298,792 263,992
Long term employee benefits 25,703 11,446
Termination benefits - 755,978
Share based employment benefits 5,192,081 3,554,972
15,116,082 13,929,396
Individual Directors and executives compensation disclosures
Information regarding individual Directors and executives compensation and some equity instruments disclosures as permitted by Corporations Regulation
2M.3.03 is provided in the Remuneration Report section of the Directors’ report.
Apart from the details disclosed in the Remuneration Report, no Director has entered into a material contract with the Bank since the end of the previous
financial year and there were no material contracts involving Directors’ interest existing at year end.

Bank of Queensland Limited and its Controlled Entities A.B.N. 32 009 656 740. 101
NOTES TO THE FINANCIAL STATEMENTS(Continued) Year Ended 31 August 2014
6.4. RELATED PARTIES INFORMATION (CONTINUED)
(c) Other financial instrument transactions with key management personnel and personally-related entities
A number of key management personnel or their related parties hold positions in other entities that result in them having control or significant influence over the financial or operating policies of those entities. Financial instrument transactions with key management personnel and personally-related entities during the financial year arise out of the provision of banking services, the acceptance of funds on deposit, the granting of loans and other associated financial activities. The terms and conditions of the transactions with management personnel and their related parties were no more favourable than those available, or which might reasonably be expected to be available on similar transactions to non-Director related entities on an arm’s length basis.
The following are transactions undertaken between the Consolidated Entity and key management personnel as at 31 August 2014:
Balance as at For the period (1)
01/09/13$
31/08/14$
Total Loan Repayments
$
Total LoanRedraws /
Further Advances
$
Total Loan / Overdraft interest
$
Total Fees on Loans /
Overdraft$
Term Products (Loans / Advances) (2,292,172) (3,619,345) 791,954 (1,965,439) (153,368) (320)
Balance as at For the period (1)
01/09/12 (2)
$31/08/13
$
Total Loan Repayments
$
Total LoanRedraws /
Further Advances
$
Total Loan / Overdraft interest
$
Total Fees on Loans /
Overdraft$
Term Products (Loans / Advances) (1,210,036) (2,292,172) 493,850 (2,603,395) (91,740) (113)
(1) Amounts are included only for the period that the Director / Executive is classified as a member of the key management personnel.
(2) Balance as at 1 September 2012 will not equal 31 August 2012 closing balance due to changes in key management personnel during the year.
Other transactions
Transactions between the Consolidated Entity and Key Management Personnel (other than loans/advances and shares) during the financial year related to personal banking, investment and deposit transactions. These transactions are considered trivial or domestic in nature, were on normal commercial terms and conditions and in the ordinary course of business.
Transactions between the Consolidated Entity and other related parties of Key Management Personnel relate to loans on normal commercial terms and conditions. Details of loans outstanding at the reporting date to other related parties of Directors and Senior Executives are as follows:
2014
Balance at 1 September
2013$
Interest paid and payable during the year
$
Balance at31 August
2014$
Highest balance during
the year$
Richard Haire Related Party 191,000 9,148 191,000 191,777

ANNUAL REPORT 2014102
NOTES TO THE FINANCIAL STATEMENTS(Continued) Year Ended 31 August 2014
6.5. CONTROLLED ENTITIES (a) Particulars in relation to material controlled entitiesThe Group’s principal subsidiaries at 31 August 2014 are set out below. Unless otherwise stated, they have share capital consisting solely of ordinary shares that are held directly by the Group. The Bank owns 100% of all subsidiaries with nil ownership interest held by non-controlling interests. The country of incorporation or registration is also their principal place of business.
Place of business/country of incorpo-
rationParent entity’s
interestAmount of Investment
(at cost) Principal activities
Controlled entities:2014 2013 2014
$m2013$m
B.Q.L. Management Pty Ltd Australia 100% 100% - - Trust management
B.Q.L. Nominees Pty Ltd Australia 100% 100% - - Dormant
B.Q.L. Properties Limited Australia 100% 100% 5.0 5.0 Dormant
Queensland Electronic Switching Pty Ltd Australia 100% 100% - - Dormant
BOQ Equipment Finance Limited Australia 100% 100% 0.1 0.1 Asset Finance & Leasing
St Andrew’s Australia Services Pty Ltd Australia 100% 100% 15.4 15.4 Insurance
Series 2005-2 REDS Trust Australia - 100% - - Securitisation
REDS Warehouse Trust No.1 Australia 100% 100% - - Securitisation
REDS Warehouse Trust No.2 Australia 100% 100% - - Securitisation
Series 2006-1E REDS Trust Australia 100% 100% - - Securitisation
Series 2007-1E REDS Trust Australia 100% 100% - - Securitisation
Series 2007-2 REDS Trust Australia 100% 100% - - Securitisation
Series 2008-1 REDS Trust Australia 100% 100% - - Securitisation
Series 2008-2 REDS Trust Australia 100% 100% - - Securitisation
Series 2009-1 REDS Trust Australia 100% 100% - - Securitisation
REDS Warehouse Trust No.3 Australia 100% 100% - - Securitisation
Series 2010-1 REDS Trust Australia 100% 100% - - Securitisation
Series 2010-2 REDS Trust Australia 100% 100% - - Securitisation
Series 2012-1E EHP REDS Trust Australia 100% 100% - - Securitisation
Series 2012-1E REDS Trust Australia 100% 100% - - Securitisation
Series 2013-1 EHP REDS Trust Australia 100% 100% - - Securitisation
Series 2013-1 REDS Trust Australia 100% 100% - - Securitisation
Pioneer Permanent Limited Australia 100% 100% 60.1 60.1 Dormant
BOQ Home Limited (1) Australia 100% 100% 600.2 600.2 Dormant
Home Financial Planning Pty Ltd Australia 100% 100% - - Dormant
Home Credit Management Ltd Australia 100% 100% - - Investment holding entity
Statewest Financial Services Ltd Australia 100% 100% - - Dormant
Statewest Financial Planning Pty Ltd Australia 100% 100% - - Dormant
BOQ Share Plans Nominee Pty Ltd Australia 100% 100% - - Trust management
Bank of Queensland Limited Employee Share Plans Trust
Australia 100% 100% - - Trust management
St Andrew’s Life Insurance Pty Ltd Australia 100% 100% - - Life Insurance
St Andrew’s Insurance (Australia) Pty Ltd Australia 100% 100% - - General Insurance
BOQ Finance (Aust) Limited Australia 100% 100% 230.2 230.2 Asset Finance & Leasing
BOQ Funding Pty Ltd Australia 100% 100% - - Financing and credit
BOQ Credit Pty Limited Australia 100% 100% - - Asset Finance & Leasing
BOQ Funding Pty Limited Australia 100% 100% - - Asset Finance & Leasing
(1) Entity was formerly known as Pioneer Permanent Building Society Limited.(2) Entity was formerly known as Home Building Society Ltd.

Bank of Queensland Limited and its Controlled Entities A.B.N. 32 009 656 740. 103
NOTES TO THE FINANCIAL STATEMENTS(Continued) Year Ended 31 August 2014
6.5. CONTROLLED ENTITIES (CONTINUED)
(a) Particulars in relation to material controlled entities (continued)Place of business/country of incorpo-
rationParent entity’s
interestAmount of Investment
(at cost) Principal activities
Controlled entities:2014 2013 2014
$m2013$m
BOQ Finance (NZ) Limited New Zealand 100% 100% 22.1 22.1 Asset Finance & Leasing
Equipment Rental Billing Services Pty Ltd Australia 100% 100% - - Dormant
Hunter Leasing Ltd Australia 100% 100% - - Dormant
Newcourt Financial (Australia) Pty Limited Australia 100% 100% - - Dormant
Virgin Money (Australia) Pty Limited Australia 100% 100% 42.6 42.6 Financial services
Virgin Money Home Loans Pty Limited Australia 100% 100% - - Dormant
Virgin Money Financial Services Pty Ltd Australia 100% 100% - - Financial services
BOQ Specialist Bank Limited Australia 100% - 551.5 -Professional Finance and Asset Finance & Leasing
BOQ Specialist Pty Ltd Australia 100% - - - Professional Finance
BOQ Asset Finance and Leasing Pty Ltd Australia 100% - - - Asset Finance & Leasing
1,527.2 975.7
(b) Significant restrictions
In accordance with Prudential Standard APS 222, the Bank and its subsidiaries that form part of the Extended Licensed Entities are restricted from having unlimited exposures to related entities, including general guarantees. These related entities are as follows:
• Virgin Money (Australia) Pty Limited;
• Virgin Money Home Loans Pty Limited;
• Virgin Money Financial Services Pty Ltd;
• St Andrews Australia Services Pty Ltd;
• St Andrews Life Insurance Pty Ltd
• St Andrews Insurance (Australia) Pty Ltd;
• BOQ Specialist Bank Limited;
• BOQ Specialist Pty Ltd; and
• BOQ Asset Finance and Leasing Pty Ltd.
(c) Disposal of controlled entities
Series 2005-2 REDS Trust was closed on 12 June 2014.
(d) Acquisition of controlled entities
On 31 July 2014, the Bank acquired 100% of BOQ Specialist Limited formerly known as the Professional Finance and Asset Finance & Leasing businesses of Investec Bank (Australia) Limited (Investec) for consideration of $210 million. The purchase was funded through a $400 million fully-underwritten, renounceable entitlement offer, as well as excess capital.
BOQ Specialist Limited focuses on providing banking, advisory and investment products and services to a wide range of private, corporate and institutional clients. The Bank purchased BOQ Specialist Limited for further diversification of the business and for the access to a niche market in Professional Finance. In the period from 1 August 2014 to 31 August 2014 BOQ Specialist Bank Limited contributed a profit after tax of $3.1 million. The effect of the provisional accounting on the Consolidated Entity’s assets and liabilities is set out on the following page.

ANNUAL REPORT 2014104
NOTES TO THE FINANCIAL STATEMENTS(Continued) Year Ended 31 August 2014
(d) Acquisition of controlled entities (continued)
The provisional acquisition accounting had the following effect on the consolidated entity’s assets and liabilities:
Recognised values on acquisition
$m
Pre-acquisition carrying amounts
$m
Assets
Cash and liquid assets 52.0 52.0
Other financial assets 544.5 544.4
Loans and advances at amortised cost 2,504.1 2,507.8
Other assets 13.2 13.2
Property, plant & equipment 3.0 3.0
Deferred tax assets 1.8 -
Total assets 3,118.6 3,120.4
Liabilities
Deposits (2,328.1) (2,325.6)
Derivative financial instruments (7.6) (7.6)
Accounts payable and other liabilities (42.6) (42.6)
Borrowings including subordinated notes (744.0) (744.0)
Deferred tax liabilities (0.6) (0.6)
Total liabilities (3,122.9) (3,120.4)
Net identifiable assets and liabilities (4.3) -
Goodwill and other identifiable assets on acquisition 214.3
Total Consideration 210.0
Consideration paid, satisfied in cash 210.0
Cash acquired (52.0)
Net cash outflow 158.0
At 31 August 2014, the acquisition accounting balances were provisional due to ongoing work related to various matters which will impact the acquisition accounting entries.

Bank of Queensland Limited and its Controlled Entities A.B.N. 32 009 656 740. 105
NOTES TO THE FINANCIAL STATEMENTS(Continued) Year Ended 31 August 2014
6.6. DEED OF CROSS GUARANTEE
Pursuant to ASIC Class Order 98/1418 (as amended) dated 19 August 2005, certain wholly-owned subsidiaries are relieved from the Corporations Act 2001 requirements for preparation, audit and lodgement of financial reports, and Directors’ reports.
It is a condition of the Class Order that the Bank and each of the subsidiaries enter into a Deed of Cross Guarantee. The effect of the Deed is that the Bank guarantees to each creditor payment in full of any debt in the event of winding up of any of the subsidiaries under certain provisions of the Corporations Act 2001. If a winding up occurs under other provisions of the Act, the Bank will only be liable in the event that after six months any creditor has not been paid in full. The subsidiaries have also given similar guarantees in the event that the Bank is wound up.
The subsidiaries to the Deed are:
• B.Q.L. Properties Limited;
• BOQ Equipment Finance Limited;
• B.Q.L. Management Pty Ltd;
• St Andrew’s Australia Services Pty Ltd;
• B.Q.L. Nominees Pty Ltd;
• Queensland Electronic Switching Pty Ltd;
• BOQ Share Plans Nominee Pty Ltd;
• Pioneer Permanent Limited;
• BOQ Home Limited;
• Home Credit Management Ltd;
• StateWest Financial Services Limited;
• BOQ Finance (Aust) Limited;
• BOQ Credit Pty Limited;
• BOQ Funding Pty Limited;
• Equipment Rental Billing Services Pty Ltd;
• Hunter Leasing Ltd; and
• Newcourt Financial (Australia) Pty Limited.
A summarised consolidated Income Statement and consolidated Balance Sheet, comprising the Bank and its controlled entities which are a party to the Deed, after eliminating all transactions between parties to the Deed of Cross Guarantee, at 31 August 2014 is set out as follows:
SUMMARISED INCOME STATEMENT AND RETAINED PROFITS
Consolidated
2014 $m
2013 $m
Profit before tax 368.3 273.3
Less: Income tax expense (110.7) (80.7)
Profit for the year 257.6 192.6
Retained profits at beginning of year 144.2 138.2
Dividends to shareholders (199.1) (174.6)
Retained profits at end of year 202.7 156.2
Profit attributable to:
Equity holders of the parent 257.6 192.7
Profit for the year 257.6 192.7

ANNUAL REPORT 2014106
NOTES TO THE FINANCIAL STATEMENTS(Continued) Year Ended 31 August 2014
6.6. DEED OF CROSS GUARANTEE (CONTINUED)
BALANCE SHEET
Consolidated
Assets 2014 $m
2013 $m
Cash and liquid assets 430.9 350.9
Due from other financial institutions - Term Deposits - 1.9
Financial assets available-for-sale 2,472.6 4,333.6
Financial assets held for trading 3,348.9 1,268.4
Derivative assets 131.9 234.0
Loans and advances at amortised cost 35,592.4 34,992.4
Other assets 252.8 284.2
Shares in controlled entities 645.9 92.4
Property, plant and equipment 41.6 29.6
Deferred tax assets 111.5 104.5
Intangible assets 564.0 543.6
Investments in joint arrangements 20.5 21.4
Total assets 43,613.0 42,256.9
Liabilities
Due to other financial institutions - Accounts Payable at call 233.2 201.1
Deposits 33,648.0 31,705.3
Derivative liabilities 207.0 109.5
Accounts payable and other liabilities 372.7 348.9
Current tax liabilities 71.4 23.0
Provisions 94.9 73.9
Borrowings including subordinated notes 941.6 1,300.9
Amounts due to controlled entities 4,712.2 5,666.6
Total liabilities 40,281.0 39,429.2
Net assets 3,332.0 2,827.7
Equity
Issued capital 3,017.8 2,562.6
Reserves 111.5 108.9
Retained profits 202.7 156.2
Total equity 3,332.0 2,827.7

Bank of Queensland Limited and its Controlled Entities A.B.N. 32 009 656 740. 107
NOTES TO THE FINANCIAL STATEMENTS(Continued) Year Ended 31 August 2014
6.7. INVESTMENTS IN JOINT ARRANGEMENTSThe consolidated entity holds interests in a number of collectively and individually immaterial joint ventures that are accounted for using the equity method. The principal activity of the joint venture entities is land subdivision, development and sale. Set out below are the joint ventures of the Consolidated Entity as at 31 August 2014 which, in the opinion of the directors, are immaterial to the Consolidated Entity. Australia is the place of business and also the country of incorporation for all joint ventures. The proportion of ownership interest is the same as the proportion of voting rights held.
Percentage Ownership Interest Carrying amount
2014 (%)
2013 (%)
2014 $m
2013 $m
Ocean Springs Pty Ltd (Brighton) 9.31 9.31 11.6 12.6
Dalyellup Beach Pty Ltd (Dalyellup) 17.08 17.08 8.4 8.5
Wanneroo North Pty Ltd (The Grove) - 21.42 - -
East Busselton Estate Pty Ltd (Provence) 25.00 25.00 0.4 0.2
Coastview Nominees Pty Ltd (Margaret River) 5.81 5.81 0.1 0.1
Provence 2 Pty Ltd (Provence 2) 25.00 25.00 - -
Total equity accounted investments 20.5 21.4
Summary financial information for equity accounted joint ventures, not adjusted for the percentage of ownership held by the consolidated entity and fair value adjustments on acquisition, is contained below:
2014
$m2013 $m
Profit from continuing operations 39.6 26.0
Post-tax profit from discontinued operations - -
Other comprehensive income - -
Total comprehensive income 39.6 26.0
Accounting policy
The Consolidated Entity’s investments in joint venture entities are accounted for under the equity method of accounting in the consolidated financial statements. These are entities in which the Consolidated Entity has joint control over all operational decisions and activities.
Under the equity method, the investments in joint ventures are recognised at the cost of acquisition and the carrying value is subsequently adjusted by the Consolidated Entity’s share of the joint venture entity’s profit or loss and movement in post-acquisition reserves, after adjusting to align the accounting policies with that of the Consolidated Entity’s.
The Consolidated Entity’s share of the joint venture entity’s net profit or loss is calculated based on the sale of land, together with any tax expense, and is brought to account based on the proportion of settled land sales contracts.

ANNUAL REPORT 2014108
NOTES TO THE FINANCIAL STATEMENTS(Continued) Year Ended 31 August 2014
6.8. AUDITOR’S REMUNERATION
Consolidated Bank
2014 $’000
2013 $’000
2014 $’000
2013 $’000
Audit services – KPMG Australia
- Audit and review of the financial reports 1,010.9 919.8 681.1 595.9
- Other regulatory and audit services 400.8 342.2 202.6 182.2
1,411.7 1,262.0 883.7 778.1
Audit related services – KPMG Australia
- Other assurance services (1) 224.8 230.2 168.8 -
224.8 230.2 168.8 -
Non-audit services – KPMG Australia
- Taxation services 188.4 225.1 143.2 225.1
- Compliance services - 249.2 - 249.2
- Other - 88.7 - 72.6
- Due diligence services 234.4 64.5 234.4 64.5
422.8 627.5 377.6 611.4(1) Other assurance services comprise audit related services provided in relation to mortgage securitisation trusts which are consolidated under Australian Accounting Standards.
6.9. EVENTS SUBSEQUENT TO BALANCE DATE
Other than as disclosed below, no matters or circumstances have arisen since the end of the financial year and up until the date of this report which significantly
affects the operations of the Bank, the results of those operations, or the state of affairs of the Bank in subsequent years.
Dividends have been determined after 31 August 2014, refer to Section 2.5.
The financial effect of the above transaction has not been brought to account in the financial statements for the year ended 31 August 2014.
On 22 September 2014, the Bank announced an agreement to settle the outstanding Storm Financial proceedings which had been brought against the Group
by the Australian Securities and Investment Commission (ASIC) and a class action on behalf of borrowers advised by Storm Financial. Refer to Section 4.2 for
further details.
Bank of Queensland Limited and its Controlled Entities A.B.N. 32 009 656 740. 109
NOTES TO THE FINANCIAL STATEMENTS(Continued) Year Ended 31 August 2014
6.10. SIGNIFICANT ACCOUNTING POLICIES & NEW ACCOUNTING STANDARDS The accounting policies set out below have been applied consistently to all periods presented in the consolidated financial report, and have been applied consistently across the Consolidated Entity.
(a) Basis of consolidation(i) Subsidiaries
Subsidiaries are entities controlled by the Bank. Control exists when the Bank has the power, directly or indirectly, to govern the financial and operating policies of an entity so as to benefit from its activities. In assessing control, potential voting rights that presently are exercisable or convertible are taken into account. The financial statements of subsidiaries are included in the consolidated financial report from the date that control commences until the date that control ceases. In the Bank’s financial statements, investments in subsidiaries are carried at cost.
(ii) Securitisation
The Bank conducts a loan securitisation program whereby mortgage loans are packaged and sold to the REDS Securitisation and Warehouse Trusts (“RMBS Trusts”). The Bank also securitises Hire Purchase, Chattel Mortgages and Finance Leases which are packaged and sold to REDS EHP Securitisation Trusts (“REDS EHP Trusts”).
Consolidated Entity
The Consolidated Entity receives the residual income distributed by the RMBS and REDS EHP Trusts after all payments due to investors and associated costs of the program have been met and as a result the Consolidated Entity is considered to retain the risks and rewards of the RMBS Trusts and as a result do not meet the de-recognition criteria of AASB 139 Financial Instruments: Recognition and Measurement.
The RMBS Trusts fund their purchase of the loans by issuing floating-rate debt securities. The securities are issued by the RMBS Trusts. These are represented as borrowings of the Consolidated Entity however the Consolidated Entity does not stand behind the capital value or the performance of the securities or the assets of the RMBS Trusts. The Consolidated Entity does not guarantee the payment of interest or the repayment of principal due on the securities. The loans subject to the securitisation program have been pledged as security for the securities issued by the RMBS Trusts. The Consolidated Entity is not obliged to support any losses that may be suffered by investors and does not intend to provide such support.
The Bank does however provide the securitisation programs with arm’s length services and facilities including the management and servicing of the leases securitised. The Bank has no right to repurchase any of the securitised assets and no obligation to do so, other than in certain circumstances where there is a breach of warranty within 120 days of the sale or when certain criteria are met under the Clean up Provision per the Trust Deed Supplement.
The transferred assets are equitably assigned to the securitisation trusts. The investors in the securities issued by the Trusts have full recourse to the assets transferred to the Trusts. The Bank receives the residual income distributed by the Trusts after all payments due to investors and associated costs of the program have been met and as a result the Bank is considered to retain the risks and rewards of the Trusts.
Bank
Interest rate risk from the RMBS and REDS EHP Trusts is transferred back to the Bank by way of interest rate and basis swaps. Accordingly, under AASB 139 the original sale of the mortgages from the Bank to the RMBS Trusts does not meet the de-recognition criteria set out in AASB 139. The Bank continues to reflect the securitised loans in their entirety and also recognises a financial liability to the RMBS Trusts. The interest payable on the intercompany financial asset / liability represents the return on an imputed loan between the Bank and the Trusts and is based on the interest income under the mortgages, the fees payable by the Trusts and the interest income or expense not separately recognised under the interest rate and basis swaps transactions between the Bank and the Trusts.
All transactions between the Bank and the Trusts are eliminated on consolidation.
(iii) Transactions eliminated on consolidation
Intra-group balances, and any unrealised gains and losses or income and expenses arising from intra-group transactions, are eliminated in preparing the consolidated financial statements.
Unrealised losses are eliminated in the same way as unrealised gains, but only to the extent that there is no evidence of impairment.
(iv) Derecognition of financial assets and liabilities
Financial assets are derecognised when the contractual rights to receive cash flows from the assets have expired, or where the Bank has transferred its contractual rights to receive the cash flows of the financial assets and substantially all the risks and rewards of ownership. Financial liabilities are derecognised when they are extinguished, i.e. when the obligation is discharged, cancelled or expired.
(b) Foreign currency
Foreign currency transactions
Transactions in foreign currencies are translated at the foreign exchange rate ruling at the date of the transaction. Monetary assets and liabilities denominated in foreign currencies at the reporting date are translated into Australian dollars at the foreign exchange rate ruling at that date. Non-monetary items in a foreign currency that are measured at historical cost are translated using the exchange rate at the date of the transaction. Foreign exchange differences arising on translation are recognised in the profit and loss.
Where a foreign currency transaction is part of a hedge relationship it is accounted for as above, subject to the Hedge Accounting rules set out in Section 3.8, Derivative financial instruments.
Foreign operations
The consolidated entity has no foreign operations, all overseas activities are carried out through non-incorporated branches.
(c) New accounting standardsThe following, are the amendments to standards and interpretations applicable for the first time to the current year:
• AASB 10 Consolidated Financial Statements - Establishes a new control model and broadens the situations when an entity is considered to be controlled. The standard replaces the guidance on control and consolidation of AASB 127 Consolidated and Separate and Separate Financial Statements. This new standard did not have a material impact on the Consolidated Entity, as assessments made identified that there are no new entities under the new control model which were not previously consolidated.

ANNUAL REPORT 2014110
NOTES TO THE FINANCIAL STATEMENTS(Continued) Year Ended 31 August 2014
6.10. SIGNIFICANT ACCOUNTING POLICIES & NEW ACCOUNTING STANDARDS (CONTINUED)
(c) New accounting standards (continued) • AASB 11 Joint Arrangements - This standard replaces AASB
131 Interests in Joint Ventures and introduces a principles based approach to joint arrangements accounting. The standard uses the principle of control in AASB 10 to define joint control. Accounting for a joint arrangement is dependent on the nature of the rights and obligations arising from the joint arrangement. This new standard did not have a material impact on the Consolidated Entity.
• AASB 12 Disclosure of Interests in Other Entities - This standard includes all disclosures relating to an entity’s interests in subsidiaries, joint arrangements, associates and structured entities. The Consolidated Entity has assessed all of its interests in subsidiaries and joint arrangements and has adequately disclosed the details of these in the financial statements. This new standard did not have a material impact on the Consolidated Entity.
• AASB 13 Fair Value Measurement - Establishes a new single framework for measuring fair value and making disclosures about fair value measurement. AASB 13 also expands the disclosure requirements for all assets or liabilities carried at fair value. The Consolidated Entity has recorded additional fair value hierarchy disclosures in the financial statements regarding financial assets and liabilities and level 3 assets and liabilities.
• AASB 119 Employee Benefits - The main change introduced by this standard is to revise the accounting for defined benefit plans. The amendment removes the options for accounting for the liability, and requires that the liabilities arising from such plans is recognised in full with actuarial gains and losses being recognised in other comprehensive income. The standard also changes the definition of short-term employee benefits. The distinction between short-term and other long-term employee benefits is now based on whether the benefits are expected to be settled wholly within 12 months after the reporting date. From 1 July 2013 the Consolidated Entity changed the basis for determining the classification of annual leave between ‘short-term employee benefits’ and ‘other long-term employee benefits’. This change did not result in a material impact to the Consolidated Entity.
• AASB 2012-2 Amendments to Australian Accounting Standards - Disclosures: Offsetting Financial Assets and Financial Liabilities - Amends AASB 7 Financial Instruments: Disclosures to require disclosure of the effect or potential effect of netting arrangements, including rights of set-off associated with the entity’s recognised financial assets and financial liabilities, on the entity’s financial position, when all the offsetting criteria of AASB 132 are not met. The result of these amendments has been an expansion to the Consolidated Entitiy’s disclosures with respect to the offsetting of financial assets and financial liabilities in Sections 3.6 and 3.7.
All other amendments to standards applicable for the 2014 year end do not impact the Consolidated Entity.
The following standards and amendments have been identified as those which may impact the Bank and the majority were available for early adoption at 31 August 2014 but have not been applied in these financial statements.
• AASB 9 Financial Instruments was issued and introduces changes in the classification and measurement of financial assets and financial liabilities. The standard also introduces new requirements for hedge accounting that align hedge accounting more closely with risk management. This standard becomes mandatory for the Consolidated Entity’s 31 August 2018 financial statements. The potential effects on adoption of the amendments are yet to be determined.
• AASB 2012-3 Amendments to Australian Accounting Standards - Offsetting Financial Assets and Financial Liabilities - This amendment adds application guidance to AASB 132 Financial Instruments: Presentation to address inconsistencies identified in applying some of the offsetting criteria of AASB 132. The potential effects on adoption of the amendments are yet to be determined.
(d) Business combinationsAcquisitions on or after 1 July 2009
The Consolidated Entity has adopted revised AASB 3 Business Combinations (2008) for business combinations occurring in the financial year starting 1 July 2009. All business combinations occurring on or after 1 July 2009 are accounted for by applying the acquisition method. The Consolidated Entity has also adopted AASB 10 Consolidated Financial Statements (2013) which has superseded AASB 127 Consolidated and Separate Financial Statements (2018).
For every business combination, the Group identifies the acquirer, which is the combining entity that obtains control of the other combining entities or businesses. The Group controls an entity if it is exposed to, or has rights to, variable returns from its involvement with the entity and has the ability to affect those returns through its power over the investee.
Contingent Liabilities
A contingent liability of the acquiree is assumed in a business combination only if such a liability represents a present obligation and arises from a past event, and its fair value can be measured reliably.
Transactions Costs
Transaction costs that the Group incurs in connection with a business combination, such as a finders fee, legal fees, due diligence fees and other professional and consulting fees are expensed as incurred.
(e) Impairment of non-financial assets Non-financial assets other than deferred tax assets are reviewed for impairment whenever events or changes in circumstances indicate that the carrying amount may not be recoverable. For goodwill, and intangible assets with an indefinite life, the recoverable amount is estimated each year at the same time.
The Bank conducts an annual internal review of non-financial asset values to assess for any indicators of impairment. If any indication of impairment exists, an estimate of the asset’s recoverable amount is calculated.
For the purposes of assessing impairment, assets are grouped at the lowest levels for which there are separately identifiable cash inflows that are largely independent of the cash inflows from other assets or groups of assets - Cash Generating Units (“CGU”). An impairment loss is recognised in profit or loss in the Income Statement for the amount by which the asset’s carrying amount exceeds its recoverable amount. Impairment losses recognised in respect of CGUs are allocated first to reduce the carrying amount of goodwill allocated to the units, and then to reduce the carrying amounts of the other assets in the unit on a pro rata basis.
This grouping is subject to an operating segment ceiling test. Non-financial assets, other than goodwill, that suffered impairment are tested for possible reversal of the impairment whenever events or changes in circumstances indicate that the impairment may have reversed. An impairment loss in respect of goodwill is not reversed.
Bank of Queensland Limited and its Controlled Entities A.B.N. 32 009 656 740. 111
NOTES TO THE FINANCIAL STATEMENTS(Continued) Year Ended 31 August 2014
6.10. OTHER ACCOUNTING POLICIES (CONTINUED)
(e) Impairment of non-financial assets (continued)Calculation of recoverable amount
The recoverable amount of a non-financial asset or CGU is the greater of their fair value less costs to sell and value in use. In assessing value in use, the estimated future cash flows are discounted to their present value using a pre-tax discount rate that reflects current market assessments of the time value of money and the risks specific to the asset.
(f) Leases Finance Leases
Finance leases in which the Bank is the lessor, are recorded in the Balance Sheet as loans and advances at amortised cost. They are recorded on the commencement of the lease as the net investment in the lease, being the present value of the minimum lease payments.
The Consolidated Entity does not have finance leases as lessee.
Operating Leases
Operating leases in which the Bank is the lessee, are expensed on a straight-line basis over the term of the lease, except where an alternative basis is more representative of the pattern of benefits to be derived from the leased property. When an operating lease terminates before the lease period expires, any payment required to be made to the lessor by way of penalty is recognised as an expense in the period in which termination takes place.
(g) Goods and services taxRevenues, expenses and assets are recognised net of the amount of goods and services tax (“GST”), except where the amount of GST incurred is not recoverable from the Australian Tax Office (“ATO”). In these circumstances the GST is recognised as part of the cost of acquisition of the asset or as part of the expense.
(h) Equity reserve for credit losses The Bank is required by APRA to maintain a general provision for credit losses. As the Bank is unable to hold a general provision under current accounting standards, the Bank has created an equity reserve for credit losses. The equity reserve for credit losses and the eligible component of the collective provision for impairment are aggregated for the purpose of satisfying the APRA requirement for a general reserve for credit losses. Receivables and payables are stated with the amount of GST included. The net amount of GST recoverable from, or payable to, the ATO is included as a current asset or liability in the Balance Sheet.
Cash flows are included in the Statements of Cash Flows on a gross basis. The GST components of cash flows arising from investing and financing activities which are recoverable from, or payable to, the ATO are classified as operating cash flows.
(i) Employee benefits(i) Wages, Salaries and Annual Leave
Liabilities for employee benefits for wages, salaries and annual leave represents present obligations resulting from employees’ services provided up to the reporting date, calculated at discounted amounts based on remuneration wage and salary rates that the Bank expects to pay as at reporting date including related on-costs.
(ii) Long Service Leave
The provision for employee benefits to long service leave represents the present value of the estimated future cash outflows to be made resulting from employees’ services provided to reporting date. The provision is calculated using expected future increases in wage and salary rates including related on-costs, and expected settlement dates based on turnover history and is discounted using the rates attached to national government bonds at reporting date which most closely match the terms of maturity of the related liabilities.
(iii) Superannuation plan
The Bank contributes to a number of defined contribution superannuation plans which comply with the Superannuation Industry (Supervision) Act 1993. Contributions are charged to profit or loss in the Income Statement as they are made.
(iv) Share based payments
The Consolidated Entity currently operates an Award Rights Plan for equity-settled compensation. The plan allows Consolidated Entity employees to acquire shares in the Bank. The fair value of options and rights granted is recognised as an employee expense with a corresponding increase to the Employee Benefits Reserve. The fair value is measured at grant date and spread over the period during which the employees become unconditionally entitled to the options and rights. The fair value of the options and rights granted is measured using industry accepted option pricing methodologies, taking into account the terms and conditions upon which the options and rights are granted. The fair value of the options and rights is expensed over the vesting period. Where options and rights do not vest due to failure to meet a non market condition (e.g. employee service period) the expense is reversed. Where options and rights do not vest due to failure to meet a market condition (e.g. Total Shareholder Return test) the expense is not reversed.
(j) Property, plant & equipmentRecognition and initial measurement
Items of property, plant and equipment are stated at cost or deemed cost less accumulated depreciation and accumulated impairment losses. The cost of self-constructed assets includes the cost of materials, direct labour and an appropriate proportion of production overheads.Subsequent Costs
Subsequent additional costs are only capitalised when it is probable that future economic benefits in excess of the originally assessed performance of the assets will flow to the Bank in future years. Where these costs represent separate components, they are accounted for as separate assets and are separately depreciated over their useful lives. Costs that do not meet the criteria for subsequent capitalisation are expensed as incurred.
Subsequent Measurement
The Bank has elected to use the cost model to measure property, plant and equipment after recognition. The carrying value is the initial cost less accumulated depreciation and any accumulated impairment losses.

ANNUAL REPORT 2014112
NOTES TO THE FINANCIAL STATEMENTS(Continued) Year Ended 31 August 2014
6.10. OTHER ACCOUNTING POLICIES (CONTINUED)
(j) Property, plant & equipment (continued)Depreciation
Depreciation is charged to the profit or loss in the Income Statement on a straight-line basis over the estimated useful lives of each part of an item of property, plant and equipment. Land is not depreciated. The estimated useful lives are as follows: Years IT Equipment 3-10 Plant, furniture and equipment 3-25 Leasehold improvements 11 (or term of lease if less)
The residual value if not significant, is reassessed annually.

Bank of Queensland Limited and its Controlled Entities A.B.N. 32 009 656 740. 113
DIRECTORS’ DECLARATIONYear Ended 31 August 2014
1 In the opinion of the Directors of Bank of Queensland Limited (the “Bank”):
(a) the consolidated financial statements and notes and the remuneration report included within the Directors’ report set out on pages 4 to 36, are in accordance with the Corporations Act 2001, including:
(i) giving a true and fair view of the financial position of the Bank and Consolidated Entity as at 31 August 2014 and of their performance, for the year ended on that date; and
(ii) complying with Australian Accounting Standards and the Corporations Regulations 2001; and
(b) there are reasonable grounds to believe that the Bank will be able to pay its debts as and when they become due and payable.
2 There are reasonable grounds to believe that the Bank and the Controlled Entities identified in Section 6.5 (a) will be able to meet any obligations or liabilities to which they are or may become subject to by virtue of the Deed of Cross Guarantee between the Bank and those Controlled Entities pursuant to ASIC Class Order 98/1418.
3 The Directors have been given the declarations required by Section 295A of the Corporations Act 2001 from the Acting Chief Executive Officer and Chief Financial Officer for the financial year ended 31 August 2014.
4 The Directors draw attention to Section 1.2 (a) to the financial statements, which includes a statement of compliance with International Financial Reporting Standards.
Signed in accordance with a resolution of the Directors:
Roger Davis Richard Haire Chairman Director
8 October 2014 8 October 2014

ANNUAL REPORT 2014114
INDEPENDENT AUDITOR’S REPORT TO THE MEMBERS
INDEPENDENT AUDITOR’S REPORT TO THE MEMBERS OF BANK OF QUEENSLAND LIMITED
Report on the financial report
We have audited the accompanying financial report of Bank of Queensland Limited (the “Bank”), which comprises the Balance Sheets as at 31 August 2014, and Income Statements, Statements of Comprehensive Income, Statements of Changes in Equity and Statements of Cash Flows for the year ended on that date, Sections 1 to 6 comprising a summary of significant accounting policies and other explanatory information and the Directors’ Declaration of the Bank and the Consolidated Entity comprising the Bank and the entities it controlled at the year’s end or from time to time during the financial year.
Directors’ responsibility for the financial report
The Directors of the Bank are responsible for the preparation of the financial report that gives a true and fair view in accordance with Australian Accounting Standards and the Corporations Act 2001 and for such internal control as the Directors determine is necessary to enable the preparation of the financial report that is free from material misstatement whether due to fraud or error. In Section 1.2 (a), the Directors also state, in accordance with Australian Accounting Standard AASB 101 Presentation of Financial Statements, that the financial report of the Bank and its controlled entities comply with International Financial Reporting Standards.
Auditor’s responsibility
Our responsibility is to express an opinion on the financial report based on our audit. We conducted our audit in accordance with Australian Auditing Standards. These Auditing Standards require that we comply with relevant ethical requirements relating to audit engagements and plan and perform the audit to obtain reasonable assurance whether the financial report is free from material misstatement.
An audit involves performing procedures to obtain audit evidence about the amounts and disclosures in the financial report. The procedures selected depend on the auditor’s judgement, including the assessment of the risks of material misstatement of the financial report, whether due to fraud or error. In making those risk assessments, the auditor considers internal control relevant to the entity’s preparation of the financial report that gives a true and fair view in order to design audit procedures that are appropriate in the circumstances, but not for the purpose of expressing an opinion on the effectiveness of the entity’s internal control. An audit also includes evaluating the appropriateness of accounting policies used and the reasonableness of accounting estimates made by the Directors, as well as evaluating the overall presentation of the financial report.
We performed the procedures to assess whether in all material respects the financial report presents fairly, in accordance with the Corporations Act 2001 and Australian Accounting Standards, a true and fair view which is consistent with our understanding of the Bank’s and the Consolidated Entity’s financial position and of their performance.
We believe that the audit evidence we have obtained is sufficient and appropriate to provide a basis for our audit opinion.
Independence
In conducting our audit, we have complied with the independence requirements of the Corporations Act 2001.
Auditor’s opinion
In our opinion:(a) the financial report of Bank of Queensland Limited is in accordance with the Corporations Act 2001, including: (i) giving a true and fair view of the Bank’s and the Consolidated Entity’s financial position as at 31 August 2014 and of their performance for the year ended
on that date; and (ii) complying with Australian Accounting Standards and the Corporations Regulations 2001.(b) the financial report of the Bank and the Consolidated Entity also complies with International Financial Reporting Standards as disclosed in Section 1.2 (a).
KPMG, an Australian partnership and a member firm of the KPMG network of independent member firms affiliated with KPMG International Cooperative (“KPMG International” ), a Swiss entity.
Liability limited by a scheme approved under Professional Standards Legislation.

Bank of Queensland Limited and its Controlled Entities A.B.N. 32 009 656 740. 115
INDEPENDENT AUDITOR’S REPORT TO THE MEMBERS(Continued)
REPORT ON THE REMUNERATION REPORT
We have audited the Remuneration Report included on pages 14 to 35 of the Directors’ Report for the year ended 31 August 2014. The Directors of the Bank are responsible for the preparation and presentation of the Remuneration Report in accordance with Section 300A of the Corporations Act 2001. Our responsibility is to express an opinion on the Remuneration Report, based on our audit conducted in accordance with Australian Auditing Standards.
Auditor’s opinion
In our opinion, the Remuneration Report of Bank of Queensland Limited for the year ended 31 August 2014, complies with Section 300A of the Corporations Act 2001.
KPMG
Martin McGrathPartner Sydney 8 October 2014
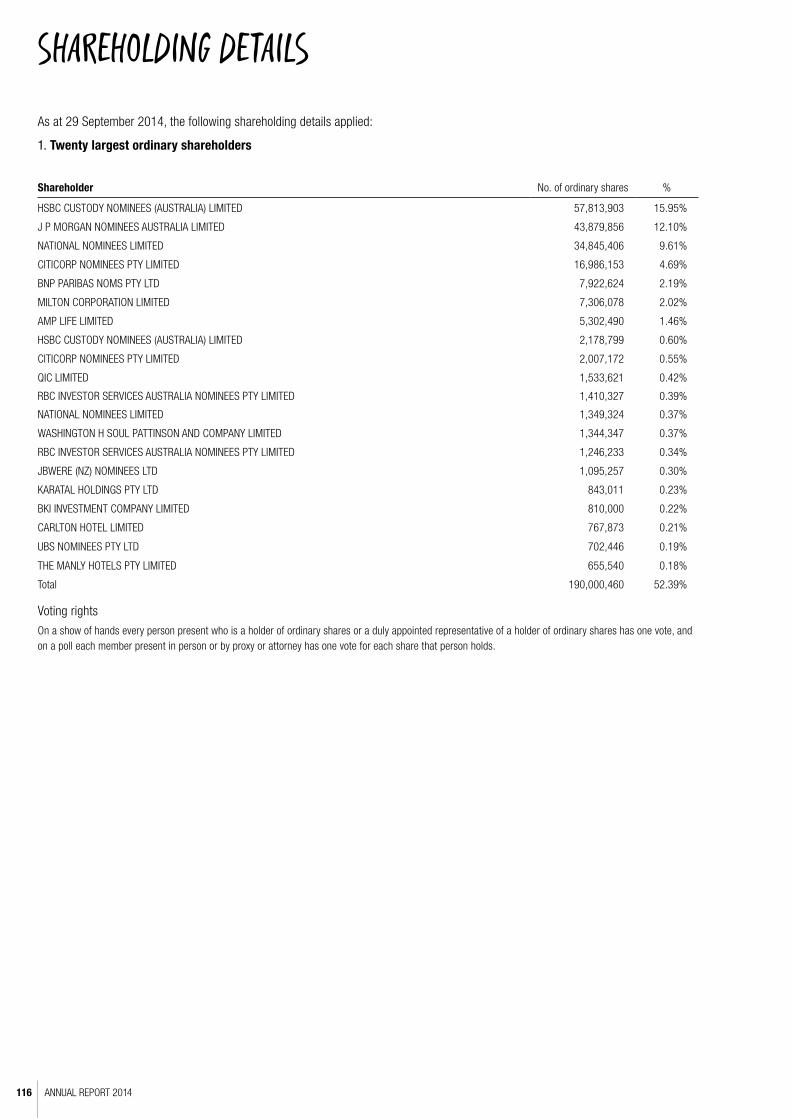
ANNUAL REPORT 2014116
SHAREHOLDING DETAILS
As at 29 September 2014, the following shareholding details applied:
1. Twenty largest ordinary shareholders
Shareholder No. of ordinary shares %
HSBC CUSTODY NOMINEES (AUSTRALIA) LIMITED 57,813,903 15.95%
J P MORGAN NOMINEES AUSTRALIA LIMITED 43,879,856 12.10%
NATIONAL NOMINEES LIMITED 34,845,406 9.61%
CITICORP NOMINEES PTY LIMITED 16,986,153 4.69%
BNP PARIBAS NOMS PTY LTD 7,922,624 2.19%
MILTON CORPORATION LIMITED 7,306,078 2.02%
AMP LIFE LIMITED 5,302,490 1.46%
HSBC CUSTODY NOMINEES (AUSTRALIA) LIMITED 2,178,799 0.60%
CITICORP NOMINEES PTY LIMITED 2,007,172 0.55%
QIC LIMITED 1,533,621 0.42%
RBC INVESTOR SERVICES AUSTRALIA NOMINEES PTY LIMITED 1,410,327 0.39%
NATIONAL NOMINEES LIMITED 1,349,324 0.37%
WASHINGTON H SOUL PATTINSON AND COMPANY LIMITED 1,344,347 0.37%
RBC INVESTOR SERVICES AUSTRALIA NOMINEES PTY LIMITED 1,246,233 0.34%
JBWERE (NZ) NOMINEES LTD 1,095,257 0.30%
KARATAL HOLDINGS PTY LTD 843,011 0.23%
BKI INVESTMENT COMPANY LIMITED 810,000 0.22%
CARLTON HOTEL LIMITED 767,873 0.21%
UBS NOMINEES PTY LTD 702,446 0.19%
THE MANLY HOTELS PTY LIMITED 655,540 0.18%
Total 190,000,460 52.39%
Voting rights
On a show of hands every person present who is a holder of ordinary shares or a duly appointed representative of a holder of ordinary shares has one vote, and on a poll each member present in person or by proxy or attorney has one vote for each share that person holds.

Bank of Queensland Limited and its Controlled Entities A.B.N. 32 009 656 740. 117
(Continued)
SHAREHOLDING DETAILS
As at 29 September 2014, the following shareholding details applied:
2. Twenty largest CPS shareholders
Shareholder No. of ordinary shares %
J P MORGAN NOMINEES AUSTRALIA LIMITED 102,078 3.40%
MILTON CORPORATION LIMITED 50,000 1.67%
NATIONAL NOMINEES LIMITED 44,738 1.49%
NAVIGATOR AUSTRALIA LTD 42,231 1.41%
HSBC CUSTODY NOMINEES (AUSTRALIA) LIMITED 41,858 1.40%
UBS WEALTH MANAGEMENT AUSTRALIA NOMINEES PTY LTD 37,542 1.25%
DOMER MINING CO PTY LTD 32,200 1.07%
NULIS NOMINEES (AUSTRALIA) LIMITED 25,746 0.86%
MR JOHN HARRISON VALDER & MRS KAY ORMONDE VALDER 19,500 0.65%
BNP PARIBAS NOMS PTY LTD 16,400 0.55%
WENTHOR PTY LTD 15,000 0.50%
CITICORP NOMINEES PTY LIMITED 11,393 0.38%
F & B INVESTMENTS PTY LIMITED 10,000 0.33%
EASTCOTE PTY LTD 10,000 0.33%
THE AUSTRALIAN NATIONAL UNIVERSITY 10,000 0.33%
SOUTHERN METROPOLITAN CEMETERIES 10,000 0.33%
JILLIBY PTY LTD 9,500 0.32%
CANTALA PTY LTD 9,150 0.31%
BCITF (QLD) 8,800 0.29%
BAPTIST INVESTMENTS AND FINANCE LTD 8,546 0.28%
Total 514,682 17.96%
Voting rights
The CPS do not give the holders any voting rights at any general shareholders meetings, except in certain circumstances.
3. Distribution of equity security holders
Ordinary Shares CPS
Category 2014 2013 2014 2013
1 - 1,000 56,165 56,120 6,214 6,332
1,001 - 5,000 26,067 24,722 355 355
5,001 - 10,000 4,847 4,164 19 22
10,001 - 100,000 2,463 2,134 11 15
100,000 - and over 71 77 1 -
Total 89,613 87,217 6,600 6,724
The number of ordinary shareholders holding less than a marketable parcel is 3,246.
The number of convertible preference shareholders holding less than a marketable parcel is nil.

ANNUAL REPORT 2014118
(Continued)
SHAREHOLDING DETAILS
4. Partly Paid Shares
There are no partly paid shares.
5. There are currently no substantial shareholders in the Bank
6. Stock exchange listing
The shares of Bank of Queensland Limited (“BoQ”) and CPS (“BOQPD”) are quoted on the Australian Securities Exchange.
7. Options
At 31 August 2014 there were no options over unissued ordinary shares.
8. On market buy-back
There is no current on market buy-back.
9. Other information
Bank of Queenland Limited is a publicly listed company limited by shares and is incorporated and domiciled in Australia.
SHAREHOLDER INFORMATION
Bank of Queensland Limited and its Controlled Entities A.B.N. 32 009 656 740. 119
SHARE REGISTRYLink Market Services Limited Level 15 324 Queen Street Brisbane Qld 4000
Australia: 1800 779 639 International: +61 2 8280 7626 Facsimile: +61 2 9287 0303
Email: [email protected] linkmarketservices.com.au
COMPANY DETAILSBank of Queensland Limited Level 17, BOQ Centre 259 Queen Street Brisbane Qld 4000
Telephone: +61 7 3212 3333 Investor Relations: +61 7 3212 3990 Facsimile: +61 7 3212 3399
boq.com.au twitter.com/boq facebook.com/BOQOnline
CUSTOMER SERVICE1300 55 72 72 (within Australia) +61 7 3336 2420 (overseas)
ABN 32 009 656 740 CAN 009 656 740
KEY SHAREHOLDER DATES
2014
Final ex-dividend date 3 November 2014
Final dividend record date 6 November 2014
Final dividend payment date 27 November 2014
Annual General Meeting 27 November 2014
2015
Financial half year end 28 February 2015
Interim results and dividend announcement 26 March 2015
Interim ex-dividend date 16 April 2015
Interim dividend record date 20 April 2015
Interim dividend payment date 12 May 2015
Financial full year end 31 August 2015
Full year results and dividend announcement 8 October 2015
Final ex-dividend date 29 October 2015
Final dividend record date 2 November 2015
Final dividend payment date 24 November 2015
Annual General Meeting 26 November 2015
*dividend dates for ordinary shares only

ANNUAL REPORT 2014120
We’ve laid the foundations for bui lding a t ruly loveable bank and our hard work is star ting
to make a difference .At the Asia-Pacific Banking & Finance Awards we were recognised as the 2014 Financial Institution of the Year (non big four banks).
Independent Roy Morgan research shows our customer satisfaction and advocacy scores are significantly above the average of the major banks, placing us third overall compared to our 11 most
direct competitors.
This is a great result but we know we can do more – we want to be Australia’s most loved bank. Ambitious? Sure.
But by making it even easier for our customers to deal with us, growing our business in the right way, finding better ways to
do things and making sure our culture is built around customer service, we believe we can give people an even
better experience.
Our competitive advantage has always been the close relationships we have with our customers. But now we’re taking it to the next level and we’ll get there by putting the customer at the heart of
everything we do.

ISO 14001Environmental Management System in use.
Manufactured using elemental chlorine free (ECF) pulps.
Pulp is sourced only from responsibly managed forests.
YOU’RE WHY WE DOWHAT WE DO


