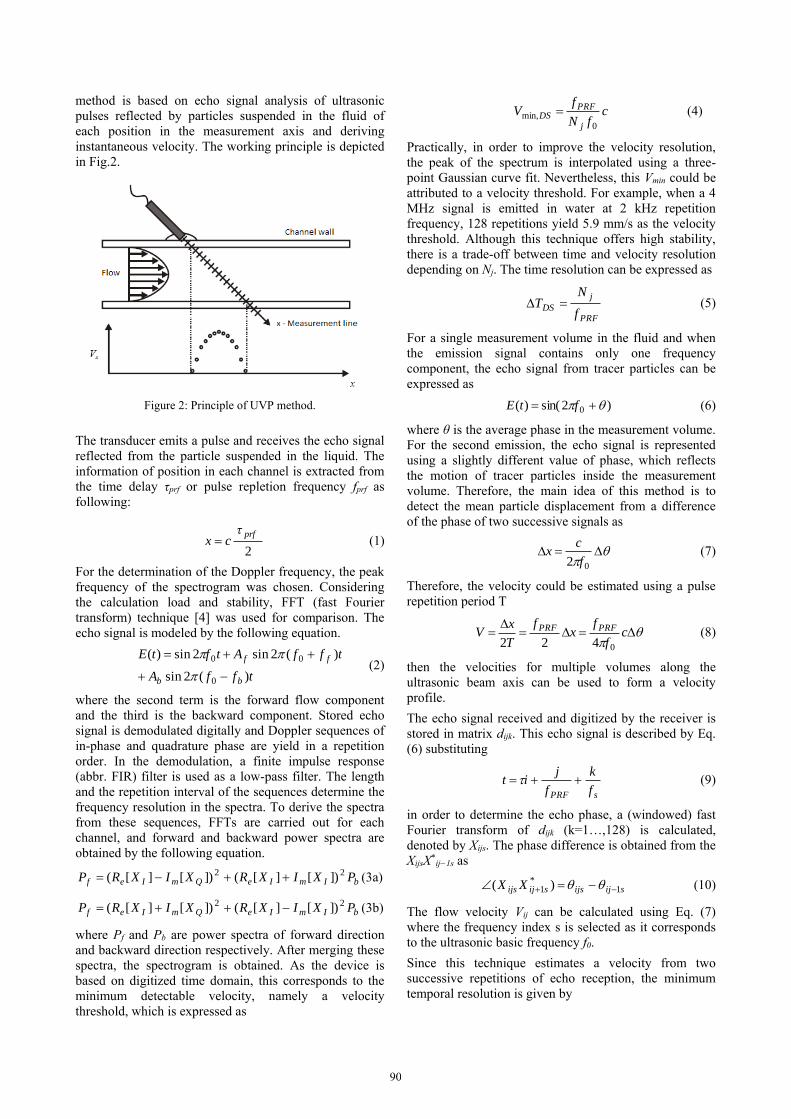
Low Velocity Measurement on The Joule-Heating Flow by Ultrasound Velocity Profiler Method
Jiaju Zhou1, Tomonori Ihara2, and Hiroshige Kikura1
1 Tokyo Institute of Technology, 2-12-1 Ookayama, Tokyo 152-8550, Japan 2 Tokyo University of Marine Science and Technology, 2-1-6 Etchujima, Tokyo 135-8533, Japan
A development ultrasound velocity profiler method was tested on the Joule-heating flow in a cubic cavity. The
Joule-heating flow was observed in simplify cubic model and also observed in a real glass melter model by UVP
method. However, due to velocity resolution of the time repetition method is low, the very slow velocity flow
was difficult to measure. A new UVP method named phase difference method was developed for very slow
velocity measurement. In this study, the new method was tested on the Joule-heating flow in a cubic cavity for
the validation. The Joule-heating cavity is accomplished by passing an alternative current employing a pair of
plate electrodes immersed on a facing plane of the liquid in order to generate internal heat source by connecting
them with a constant voltage (65V). The electrode surfaces are assumed to be iso-potential and the rest of the
boundaries are treated as electrically and thermally insulated. Test section is located in the middle plane between
two electrodes. One-dimensional continuous velocity profiles are observed by UVP. As a result, although there
are several problems of the phase difference method, the phase difference method can be applied for Joule-
heating flow measurement.
Keywords: UVP, Phase difference, Joule-heating, Chaotic flow, Low velocity measurement.
1. Introduction
High-level radioactive waste (HLW) is already produced
in all over the world as a waste from nuclear power plants,
and the method to reprocess HLW becomes an important
issue to solve. In the reprocessing, HLW is dissolved into
High-Level Radioactive Liquid Waste (HLLW), and
HLLW is poured into molten borosilicate glass in a glass
melter to make stable mixture of HLLW and glass for
geological disposal. In Japan, Liquid Fed Ceramic Melter
(LFCM) type glass melter (Fig. 1) is being developed for
the reprocessing.
Figure 1: LFCM glass melter.
The glass melter is composed of an upper cubic part and
a lower pyramid-shape part. The glass melter applies
Joule-heating to generate molten glass, and the melter can
mix HLLW and molten glass by convective flow mainly
induced by Joule-heating. These volumetric heating in
lower part and cooled in the upper part make continuous
chaotic flow behavior, named as ‘chaotic steady state.’
[1] In fact, the chaotic flow behavior in the glass melter is
difficult to understand, and the melter operation
sometimes aborted when an accident is observed in the
melter. Understanding the chaotic flow behavior is
important for the effective melter operation, however,
there are many effects on the flow behavior: those are
electrode cooling, cold cap, platinum group, foaming
reagent, etc. Thus, former studies about the chaotic flow
behavior was executed using a simple cubic cavity shown
on Fig 3. For simplification.
However, the flow behavior depends on the shape of the
cavity, it is also important to observe the actual flow in
the cavity which has similar shape to the real glass melter.
The flow behavior in the sloping bottom cavity was
different from the flow behavior in the cubic cavity under
several conditions. [2] The most important change from
cubic cavity to sloping bottom cavity was the flow in the
bottom parts of the cavity. In the sloping bottom cavity,
the non-flow area can be observed by 2-D visualization,
the flow in this area was very slow. As the velocity
resolution of the time repetition method is not enough,
the flow in the bottom of the cavity is difficult to measure.
Ihara et al developed new UVP method named phase
difference method for very low velocity field. [3] To
apply the phase difference method, Ihara also developed
new system by LabVIEW. [3] However, the Joule-
heating flow is affected by thermal field, electromagnet
field and flow field. These three field lead flow is
completed and the echo of ultrasound signal is difficult to
receive. In this paper, phase difference method was tried
to apply in the Joule-heating flow and compare with
previous study.
2. Principle of Phase Difference Method
UVP measurement system inherits advantages of
ultrasonic measurement methods such as non-intrusive,
applicable for opaque flow and time-series velocity
measurement, especially for the unstable flow
measurement. On the other hand, this technique has some
difficulties such that the ultrasonic velocity depends on
the temperature along the measurement line. The UVP
10th International Symposium on Ultrasonic Doppler Methods for Fluid Mechanics and Fluid Engineering Tokyo Japan (28-30. Sep., 2016)
89
method is based on echo signal analysis of ultrasonic
pulses reflected by particles suspended in the fluid of
each position in the measurement axis and deriving
instantaneous velocity. The working principle is depicted
in Fig.2.
Figure 2: Principle of UVP method.
The transducer emits a pulse and receives the echo signal
reflected from the particle suspended in the liquid. The
information of position in each channel is extracted from
the time delay τprf or pulse repletion frequency fprf as
following:
2
prfτcx (1)
For the determination of the Doppler frequency, the peak
frequency of the spectrogram was chosen. Considering
the calculation load and stability, FFT (fast Fourier
transform) technique [4] was used for comparison. The
echo signal is modeled by the following equation.
tffA
tffAtftE
bb
ff
)(2sin
)(2sin2sin)(
0
00
(2)
where the second term is the forward flow component
and the third is the backward component. Stored echo
signal is demodulated digitally and Doppler sequences of
in-phase and quadrature phase are yield in a repetition
order. In the demodulation, a finite impulse response
(abbr. FIR) filter is used as a low-pass filter. The length
and the repetition interval of the sequences determine the
frequency resolution in the spectra. To derive the spectra
from these sequences, FFTs are carried out for each
channel, and forward and backward power spectra are
obtained by the following equation.
bImIeQmIef PXIXRXIXRP 22 ])[][(])[][( (3a)
bImIeQmIef PXIXRXIXRP 22 ])[][(])[][( (3b)
where Pf and Pb are power spectra of forward direction
and backward direction respectively. After merging these
spectra, the spectrogram is obtained. As the device is
based on digitized time domain, this corresponds to the
minimum detectable velocity, namely a velocity
threshold, which is expressed as
cfN
fV
j
PRFDS
0min, (4)
Practically, in order to improve the velocity resolution,
the peak of the spectrum is interpolated using a three-
point Gaussian curve fit. Nevertheless, this Vmin could be
attributed to a velocity threshold. For example, when a 4
MHz signal is emitted in water at 2 kHz repetition
frequency, 128 repetitions yield 5.9 mm/s as the velocity
threshold. Although this technique offers high stability,
there is a trade-off between time and velocity resolution
depending on Nj. The time resolution can be expressed as
PRF
j
DSf
NT (5)
For a single measurement volume in the fluid and when
the emission signal contains only one frequency
component, the echo signal from tracer particles can be
expressed as
)2sin()( 0 ftE (6)
where θ is the average phase in the measurement volume.
For the second emission, the echo signal is represented
using a slightly different value of phase, which reflects
the motion of tracer particles inside the measurement
volume. Therefore, the main idea of this method is to
detect the mean particle displacement from a difference
of the phase of two successive signals as
02 f
cx (7)
Therefore, the velocity could be estimated using a pulse
repetition period T
cf
fx
f
T
xV PRFPRF
0422 (8)
then the velocities for multiple volumes along the
ultrasonic beam axis can be used to form a velocity
profile.
The echo signal received and digitized by the receiver is
stored in matrix dijk. This echo signal is described by Eq.
(6) substituting
sPRF f
k
f
jit (9)
in order to determine the echo phase, a (windowed) fast
Fourier transform of dijk (k=1…,128) is calculated,
denoted by Xijs. The phase difference is obtained from the
XijsX*ij−1s as
sijijssijijs XX 1*
1 )( (10)
The flow velocity Vij can be calculated using Eq. (7)
where the frequency index s is selected as it corresponds
to the ultrasonic basic frequency f0.
Since this technique estimates a velocity from two
successive repetitions of echo reception, the minimum
temporal resolution is given by
90
PRFPD
fT
2 (11)
The maximum velocity that can be detected, Vmax, is the
same as for the Doppler method because the range of Δθ
remains between −π and π. Numeric simulations suggest
that the velocity threshold of the phase difference method
can be affected by quantization error. However, its
practical performance has not been investigated.
3. Experiment Apparatus
The dimension of cavity is shown as Fig. 3. Two carbon
electrode plates are placed on opposing side wall. The
cubic cavity is used in former study.
In this experiment, the work fluid was 80wt% glycerin-
water solution, and 0.5wt% LiCl was added into the fluid
to lead fluid possess the conductivity. After the glycerin-
water solution mixed, nylon powder was added into the
fluid as a reflected powder. About 1.3 kg fluid was used
in the experiment.
Figure 3: Joule-heating cavity in experiment.
The room temperature was keep at 20°C. The initial
temperature of the fluid was also 20°C. Cooling
temperature of the top surface was 20°C as the room
temperature by using copper heat sinks and a water
circulator at top surface. The electrodes side was
adiabatic condition. The experimental apparatus is shown
on Fig. 4. AC power was applied in the experiment to
generate Joule-heating. A chiller was connected to the
heat sink and keep the cooling temperature. UVP
transducer was set at the bottom of the cavity. The UVP
measurement was shown as Fig. 5. It is composed of
three hardware components: an ultrasonic pulser/receiver,
a digitizer and a personal computer (PC). The
pulser/receiver (JPR-10CN, Japan Probe Co., Ltd.) drives
an ultrasonic transducer with square burst signal whose
pulse-width corresponds to the transducer frequency.
Both of them were connected to the PC and the
specialized software control each other. Applied voltages,
frequency, burst cycle and PRF (pulse repetition
frequency) are controlled by the PC through a USB
interface. A low noise preamplifier (PR-40A, Japan
Probe Co., Ltd.) is used with the pulser/receiver, and
compensates for the attenuation of the ultrasound in the
fluid; its gain is +40 dB. To improve the signal-to-noise
ratio (SNR), a band-pass filter is integrated into the
amplifier. The echo signal is acquired by a 12-bit
digitizer (PXI-5105, National Instruments Inc.) and
stored in its 128 MB onboard memory. 1-D velocity
profile of the Joule-heating flow in the cubic cavity was
measured by this system.
Figure 4: Experimental apparatus.
Figure 5: Structure of pulse receiver UVP.
The experiment was started when voltage was applied
between the electrodes, it leads Joule-heating occurring in
the cavity. After sufficient time from heating started and
when the temperature tended to a stable state.
4. Verification of Phase Difference Method
Considering if the electrodes surface was cooling, the
flow in the bottom was difficult to measure, the
electrodes surface changed to adiabatic. Therefore, just
the top surface of the cavity was cooling, and the other
surface were adiabatic. Under this condition, the chaotic
flow occurred in the whole cavity. Therefore, the reflect
powder won’t be decreased during the experiment and
easy to catch the echo from the ultrasound signal.
The flow profile in the cubic cavity was measured by
phase difference method and compare with the time
repetition method. The flow behavior in the center line of
cubic cavity measured by phase difference method is
shown as the Fig. 6(a), and the Fig. 6(b) shows the data
was measured by the time repetition method. The similar
chaotic flow can be observed in almost whole of the
cavity. The chaotic flow occurred almost in the whole
cavity. However, in the bottom of the cavity, the phase
difference method shows more noise than time repetition
91
method. In the time repetition method, the bottom parts
just show no flow. However, in the phase difference
method, the flow in the bottom parts is complete and
difficult to analyze. To know the flow profile in the
cavity, 30s average data is shown in Fig. 7.
(a) Phase difference method
(b) Conventional method
Figure 6: Flow behavior at the center line.
Figure 7: 30s average profile of phase difference method.
It can be find that flow measurement was not start at
0mm position, the noise observed by the phase difference
method was the echo from wall. The phase difference
method was easy to be affected by the noise near the
transducer. However, in the cavity, the echo of ultrasound
signal from reflect powder can be recognized well, the
chaotic Joule-heating flow was observed by the phase
difference method clearly. Therefore, the phase
difference method can be applied for the Joule-heating
flow measurement. The flow measurement in the bottom
of the sloping bottom cavity, which the velocity was very
low almost no flow can be expected.2013
5. Conclusion
A new UVP measurement method, phase difference
method was developed for low velocity measurement.
New soft system and phase difference method was tested
for applying to the Joule-heating flow measurement. The
Joule-heating flow in a simple cubic cavity was measured
by the phase difference method. The electrodes surface
under the cooling condition was applied to test the new
system, and the electrodes surface under the adiabatic
condition was applied to test the phase difference method.
The result of phase difference method measurement was
compared with the time repetition method. The following
conclusions were carried out by the experiment.
The new UVP system can be applied in the Joule-heating
flow. When the repetition number of high, few reflect
powder field is difficult to measure. However, the
velocity profile can be observed by the average data. In
addition, If the reflect powder can keep in a high mount,
the low flow field can be measured.
The phase difference method has noise near the wall,
however, the flow in the cavity can be measured by the
phase different method.
The phase difference method can be considered apply in
the sloping bottom cavity to observe the flow behavior in
the sloping bottom part.
References
[1] Tsuzuki N, et al.: The numerical analysis on unsteady
flow in the cavity whit Joule-heating, 48th Heat Transfer
Symposium of Japan, Volume III, 727-728 (2011).
[2] Zhou J, et al.: Effect of Cavity Shape on Chaotic Flow
Behavior by Joule-Heating, ISFMFE2014, No. 90196
(2014).
[3] Ihara T, et al.: Ultrasonic velocity profiler for very low
velocity field, Flow Measurement and Instrumentation, 34
(2013), 127–133.
[4] Chihara K, et al.: The microcomputer-based ultrasonic
pulsed Doppler flowmeter system, IEICE Transactions, 63
(1980), 351–352.
92