75
Low voltage network solutions closedown report/June 2014 Page 1 of 75 Low Voltage Network Solutions A First Tier Low Carbon Networks Fund Project Closedown Report

Low voltage network solutions closedown report/June 2014 Page 1 of 75
Low Voltage Network Solutions A First Tier Low Carbon Networks Fund Project
Closedown Report

Low voltage network solutions closedown report/June 2014 Page 2 of 75
CONTENTS
1 EXECUTIVE SUMMARY 4
1.1 Aims 4
1.2 Methodology 4
1.3 Outcomes 5
1.4 Key Learning 6
1.5 How and when to monitor at LV 10
1.6 Comparison with WPD’s ‘LV Network Templates’ 11 1.7 Comparison with Smart Grid Forum’s analysis in WS3 Transform 12
1.8 Conclusions 12
2 PROJECT BACKGROUND 13
3 PROJECT SCOPE 13
4 SUCCESS CRITERIA 14
5 DETAILS OF WORK CARRIED OUT (TRIALLED METHODS) 14
5.1 Selection of LV distribution networks to be monitored 14
5.2 LV monitoring 15 5.3 Data collection approach 25
5.4 University of Manchester’s methods 27
6 PROJECT OUTCOMES AND LEARNING 35
6.1 Monitoring installation and data collection 35
6.2 Performance of monitored LV networks 36
6.3 Assessing load estimates for the whole network 39
6.4 Electricity North West’s Future Capacity Headroom Model 40
6.5 Characterising challenges on LV networks with LCTs 43
6.6 Assessment of potential network solutions 46 6.7 Characterising LV network feeders for further analysis 47
6.8 Recommendations on deployment of LV monitoring 50
6.9 Comparison with WPD’s ‘LV Network Templates’ project 53
6.10 Comparison with Smart Grid Forum’s analysis in WS3 Transform 54
6.11 Impact on Technology Readiness Levels 58
7 PERFORMANCE COMPARED TO AIMS AND SUCCESS CRITERIA 58
8 REQUIRED MODIFICATIONS 60
9 VARIANCE IN COSTS AND BENEFITS 62
9.1 Cost variance (updated March 2017) 62
9.2 Benefits variance 63
10 LESSONS LEARNT FOR FUTURE PROJECTS 63
10.1 Review of the Methods used in this project 63
10.2 Completed dissemination activities 64 10.3 Planned dissemination activities 65
11 PLANNED IMPLEMENTATION 66

Low voltage network solutions closedown report/June 2014 Page 3 of 75
11.1 Using LV monitoring and models to support other trials 66
11.2 Improving processes for installing LV monitoring and data collection 67 11.3 Reviewing policy on what and when to monitor on LV networks 67
11.4 Ongoing performance evaluation of LV networks. 69
11.5 Future implications for LV planning, operations and connections 70
12 FACILITATE REPLICATION 70
13 APPENDICES 72
14 LIST OF FIGURES AND TABLES 74
GLOSSARY
EV Electric Vehicle
EHP Electric Heat Pump
FCH Future Capacity Headroom (Model)
GIS Geographical Information System
GPRS General Packet Radio Service
IFI Innovation Funding Incentive
LCNF Low Carbon Networks Fund
LCT Low Carbon Technology
LV Low Voltage
HV High Voltage
µCHP Micro Combined Heat and Power
OpenDSS Open (source) Distribution System Simulator
PV Photovoltaic
THD Total Harmonic Distortion
WS3 Work Stream 3 (of the Smart Grid Forum)

Low voltage network solutions closedown report/June 2014 Page 4 of 75
1 EXECUTIVE SUMMARY
1.1 Aims
‘LV Network Solutions’ was a three-year project delivered by Electricity North West as under the First Tier of the Low Carbon Networks fund.
The project aimed to
• trial and develop procedures to install low voltage (LV) monitoring without customer interruptions on 200 low voltage networks,
• increase understanding of current low voltage network performance,
• for the monitored networks, work with the University of Manchester to allow them to develop detailed electrical models to assess hosting capacity and potential network solutions under increasing penetrations of low carbon technologies (LCTs), and
• across the whole low voltage (LV) and high voltage (HV) network, improve existing estimates of load, and develop a tool to estimate future loads and capacity headroom.
1.2 Methodology
Having developed an equipment specification in consultation with the University of Manchester and PB Power, a tender process identified GridKey and Nortech as the monitoring equipment suppliers. Electricity North West worked with them to develop their products and appropriate installation procedures, both for substation and midpoint/ endpoint feeder monitoring.
200 distribution substations were selected for monitoring, representing a range of network situations but with a focus on ground-mounted transformers and areas with photovoltaics (PV). Some substitutions were made after site surveys identified practical or safety issues with some potential installations.
At the 200 substations, monitoring was installed during 2012 and 2013 to measure parameters in total for the transformers and at the head of each low voltage feeder. A live installation approach - using Rogowski current coils and novel voltage connections - enabled deployment of monitors without causing customer interruptions. Monitoring data was sent by GPRS back to Electricity North West’s iHost server and then exported to the University of Manchester.
The University used the available monitoring data to make the first ever detailed assessment of the performance of the Electricity North West LV network. This evaluation covered issues such as transformer utilisation, substation busbar voltages, the voltage unbalance factor across phases, power factor, neutral currents and indicative values of total harmonic distortion.
In parallel to the monitoring, the University developed a method to build models of the monitored networks. This used Electricity North West’s detailed GIS network and policy data (lengths, connectivity and impedances) and GIS customer data (types and locations), loading this into the OpenDSS modelling platform. This allowed a three-phase four-wire analysis of the monitored low voltage networks. The University ensured the network models were accurate by using the monitoring data to validate the network topology, working with Electricity North West to review open-point positions/ status if the initial validation failed. The challenge in this stage of the work reflects the issue which all DNOs face with their translating their LV data – which has been fit for purpose up to now - into systems for further analysis.

Low voltage network solutions closedown report/June 2014 Page 5 of 75
In terms of profiles for load and low carbon technologies, the University reviewed the range of potential profiles available for use with the network models. For load they compared diversified ELEXON load profiles for the Electricity North West area, domestic demand profiles from the Loughborough CREST tool, and ‘allocated’ load profiles matching the monitoring data. For LCTs, they identified for use in their modelling the most suitable trial data for electric vehicles, heat pumps, PV and micro combined heat and power, to represent the diversity of LCT impacts on LV networks.
Using its models of the monitored networks, the University of Manchester then developed a Monte Carlo method to assess the hosting capacity of networks in terms of the percentage of customers who could adopt a particular low carbon technology before any voltage or thermal issue arises. The analysis considered the effects of residential photovoltaic panels (PV), electric heat pumps (EHP), electric vehicles (EV, slow overnight, slow evening and fast overnight) and micro combined heat and power units (µCHP). This method was also applied to investigate specific examples of LV network solutions eg on-load tap changers, network meshing and a traditional reinforcement method.
The ‘LV Network Solutions’ project also recognised that detailed monitoring and modelling was only being applied to a small fraction of the LV network. In a separate IFI project ‘Load Allocation’, Electricity North West developed a method for load estimation for the whole secondary network, based on existing connectivity data). ‘LV Network Solutions’ used this as a baseline to create a Future Capacity Headroom model to estimate thermal and voltage overloads in future scenarios of LCT uptake. The monitoring data was used to review the baseline load estimates produced by Load Allocation.
1.3 Outcomes
The project installed monitoring at 200 substations covering over 1000 feeders. It collected nearly 10,000 days of valid data up to January 2014, despite great challenges in data collection and archiving. Particularly given that this data includes information by phase and by feeder, rather than just transformer totals, this represents a truly significant step forward in terms of data collection characterising LV distribution networks in Great Britain. Based on the product development work done by GridKey with Electricity North West for this project, GridKey entered and won the 2012 UK Energy Innovation award for the ‘Best Smart Grid Technology’. The GridKey product also came joint top in the comparison by WPD and UKPN in the 2013 Low Carbon Networks Fund First Tier project ‘Assessing Substation Measurement Equipment’.
The monitoring data enabled:
• Detailed performance analysis of transformer utilisation, substation voltage, voltage unbalance and power factor for the monitored parts of the low voltage network,
• Validation of the models constructed by the University, for both this project and the First Tier project ‘Voltage Management at Low Voltage Busbars’,
• Creation of ‘allocated’ load profiles which match the monitoring data, for use in further analysis of the monitored networks beyond this project.
• Validation of Electricity North West’s Load Allocation method for half-hourly load estimates. At distribution transformer level this was shown to be better than using the diversified ELEXON load profiles. However the review also highlighted areas for improvement and concerns with the accuracy of feeder-level load estimates.
• In combination with network data, identification of representative LV feeders for further analysis.

Low voltage network solutions closedown report/June 2014 Page 6 of 75
Monitoring data continues to be collected and made available to the business via Electricity North West’s iHost server, with installation of LV monitoring now transferred to business-as-usual, to support further innovation projects and performance evaluation of networks with LCT clusters.
The University of Manchester developed and validated 25 detailed models of underground LV networks. The models were used them in a probabilistic assessment of LCT hosting capacity and of specific network solutions.
The methodology and analysis carried out by The University of Manchester represents a major step forward compared to what has been done previously, both by Distribution Network Operators and in other industry and academic analysis.
1.4 Key Learning
The key learning in this project can be divided into the following areas.
• How to monitor at LV – appropriate products and procedures
• Performance evaluation of monitored LV networks, and comparison of a monitoring data with other load estimates
• Creating a future capacity headroom model for the whole secondary network.
• Developing detailed network models from network data and profiles, a probabilistic assessment method, and the challenges in doing this modelling
• Learning from those detailed models to assess the hosting capacity of LV networks for LCTs, and potential network solutions, with implications for future operating and planning policy.
• What and when to monitor at LV going forward
1.4.1 Learning how to monitor at LV
Electricity North West has successfully developed the techniques to deploy LV monitoring without customer interruption at low cost, and is already using this in other business-as-usual projects and innovation trials. As a follow on from this project, a set of standard reports is being developed from iHost for business-as-usual review of performance data.
However the installation of monitoring equipment, commissioning of the data flow, and the continuous collection of monitoring data were extremely challenging parts of this project. Lessons were learnt around resourcing, SIM-card registration and fault finding. Software and firmware upgrades were required during the project to the monitoring devices and iHost servers to collect and archive the data. Although outsourcing for the purposes of the trial would have been simpler, this project derived maximum learning by addressing these issues directly and thus helps to develop an enduring business approach.
The project produced specifications and detailed procedures for installation of LV monitoring without customer interruptions at substations. Pre-installation survey and careful attention in planning and commissioning the data collection are crucial to a smooth deployment. The Code of Practice, specification and jointing procedures are published by this project to facilitate replication by others.
The project also developed a specification and techniques for installation of feeder midpoint and endpoint monitoring without customer interruptions, including developing a Smart Joint to allow both voltage and current to be monitored at a cable midpoint. This low cost

Low voltage network solutions closedown report/June 2014 Page 7 of 75
technique has been taken forward in a separate installation programme supporting a number of other innovation and performance evaluation projects, in total delivering 200 additional monitors along 100 selected underground feeders from the monitored substations - 100 mid and 100 end points.
1.4.2 Performance evaluation of monitored LV networks
Review of the monitoring data confirmed that all substations were currently operating within the limits defined in policy. The data also provided information on seasonal differences in load factor for different substations. From the sample of substations, which itself favoured PV, 15% of monitored substations were found to have some limited reverse power flow.
In terms of voltage performance at the busbars, the daily average voltages with 10 minute sampling varied between 237V and 253V. Most substations (63%) have a daily average voltage between 241V and 248V.
The performance evaluation also considered the busbar voltage variations between maximum and minimum, over the course of a day with 10-minute sampling. In the vast majority of substations (93%) the difference between maximum and minimum busbar voltage was less than 11.5V, although this ranged between 5V and 18V considering all substations. Ignoring the lowest and highest 2.5% of voltage readings each day but considering all substations, the difference between maximum and minimum busbar voltage was between 3V and 9V. This evaluation provides valuable information about the average and range of busbar voltages to be managed in any voltage control scheme.
Based on the voltage evaluation, a small number of substations merit further investigation. In particular, nine substations had voltages consistently above 253V, four had very occasional low voltages below 216V, and potentially seven have occasional voltage unbalance factors exceeding 2%. Depending on the voltage drop to the customer location, these voltages are still potentially compliant with BSEN50160 at customer locations, and there may be no adverse customer experience. However these sites have been suggested for further investigation in a new innovation project ‘Customer Voltage & Power Quality Limits’ which aims to review a combination of quantitative network data and qualitative customer data to determine whether short duration or lower level excursions outside statutory limits cause any noticeable effects for customers.
The monitoring found significant variation in the average current THD per feeder varied between 2% and 98%, although most feeders (65%) were found to have between 10% and 20% average current THD. The average current THD increased significantly in feeders with PV, particularly for feeders where more than 30% of customers have PV. This is an important finding in the context of expected growth in PV connections. The ‘Customer Voltage & Power Quality Limits’ project will also be investigating harmonics further by extending the capability of the monitoring installed in this project beyond providing indicative values of total harmonic distortion of current, to a more robust assessment of total harmonic distortion of voltage.
Separately, some high neutral currents are being checked to review whether action needs to be taken to rebalance load across phases.
The performance evaluation included a review of power factor at all monitored substations, with significant variability between substations; some with power factor consistent close to unity, others with much greater variability and lower values. Some of the power factor results need to be interpreted in the context of reverse power flow. Electricity North West does not consider the power factor results indicate any problem to be resolved. However based on the monitored data on power factor, a change was made to the default power factor assumption from 0.95 to 0.98 in the company’s existing ‘Load Allocation’ algorithm for estimating load across the whole secondary network.

Low voltage network solutions closedown report/June 2014 Page 8 of 75
More generally, the review of Load Allocation against a sample of monitoring data highlighted the importance of accuracy in how customers are allocated to specific network assets – customer allocation having been more carefully checked for the monitored networks than for the business-as-usual Load Allocation. Although the customer allocation was generally valid at distribution transformer level, it was inadequate for accurate load estimates at the low voltage feeder level. So similarly as for the challenges with LV network data mentioned before, DNOs face challenges adapting their existing information on what customers are served by what asset - which again has been fit for purpose up to now - into systems for further analysis.
However the review of the Load Allocation against the monitoring has recently led to various improvements in algorithm – including a review of the location of larger customers, and a change in treatment of certain transformers with spuriously low load estimates. Remaining differences can be explained by factors such as lack of diversity when estimating loads from small numbers of customers, and ‘unmetered’ loads such as street lighting and traffic controls, which are not considered by the Load Allocation model.
1.4.3 Future Capacity Headroom Model
Under the ‘LV Network Solutions’ project, Electricity North West created a Future Capacity Headroom (FCH) model of its LV and HV network between 2011 and 2013. As its baseline, this used the network connectivity and estimates of load from ‘Load Allocation’, picking out the peak days for each primary from Electricity North West’s Long Term Development Statement, and the background load growth assumptions applied in Electricity North West’s Grid and Primary load forecasting
Looking forward to 2015, 2023 and 2031, the model used the LCT uptake and profile assumptions from the Smart Grid Forum’s Transform model, alongside consultancy input on how to cluster the technology and spread it between local authority areas. For each type of secondary network asset (HV feeder sections, distribution transformers of various types and sizes, and LV feeders), the number of overloaded assets of each type was identified in each scenario and year. Given the uncertainty in exact location of future customer and LCT connections, the results for each individual asset were not expected to be meaningful in isolation, only in aggregate.
Alongside Transform, the FCH was used successfully by Electricity North West in 2012 and 2013 for scenario analysis assessing the potential scale of load-related interventions in the RIIO-ED1 regulatory periods. The FCH remains a tool for Electricity North West to use for the future, and the baseline Load Allocation data has been improved in 2014 as a consequence of comparison with the monitoring. However the subsequent outputs from the studies carried out by The University of Manchester (as detailed in the next section) provide greater insight into the value of detailed network, demand and LCT modelling with probabilistic analysis – this later work suggests both limitations to the Future Capacity Headroom Model and areas for improvement.
1.4.4 Development of network models and assessment method
The adopted detailed network modelling identified the benefits of:
• Three-phase four-wire modelling. The realistic modelling of LV networks (three phases plus neutral) allows catering for their inherent unbalance nature (due to both connectivity of consumers but also due to the demand itself) which can have significant effects on the quantification of impacts The utilisation of single-phase (balanced) network and load representations was found to underestimate the impacts of LCT in LV networks;

Low voltage network solutions closedown report/June 2014 Page 9 of 75
• Time-series analysis with a minimum of 10 minute resolution. This allows a much better representation of the interactions of demand with LCT and hence a better quantification of impacts throughout the day. Due to the BSEN50160 standard, analyses carried out with intervals longer than 10 minutes are likely to underestimate voltage impacts; and,
• Monte Carlo approach. Many simulations were carried out to cater for the diversity and uncertainties of customer behaviour, as well as LCT location, size and behaviour. This allowed presentation of the likelihood of potential impacts rather than ‘definite’ numbers, thus facilitating more informed decisions. Although too time-consuming for a business-as-usual analysis of networks, it provides great insight for policy level decisions.
The University reviewed available profile inputs to use in the modelling. This found that the domestic 1-minute resolution profiles produced by the CREST tool proved to be realistic, whereas ELEXON-based average profiles would only provide realistic loads for feeders with more than 50 customers (roughly half of the modelled sample). Given that a significant volume of LV networks are mostly domestic, the CREST tool can be used to provide the valuable demand profiles needed for power flow analyses where monitoring is not available. In addition, the utilisation of ELEXON-based profiles to assess LV feeders underestimates the technical problems due to their small resolution (30 minutes) and diversified nature. In terms of LCT profiles, the PV, EHP, EV and µCHP profiles produced throughout the project, although not validated with real measurements, are believed to be more realistic than other available profiles (eg Smart Grid Forum WS3).
The University applied its probabilistic analysis of hosting capacity (penetration level before a network issue arises) across multiple feeders. They tested the correlation of various metrics as predictors of hosting capacity, and some example network solutions. They also used mathematical clustering techniques on the combination of the network and monitoring data to categorise the feeders into 11 representative types. Whilst beyond the scope of this project, a method could be developed to allocate feeders to these representative types, this provides opportunities in future for probabilistic analysis to only be applied to a smaller number of representative feeders.
Although the validated network models and the probabilistic assessment method add significant value to the analysis, the construction of the models from real DNO network LV data was far from easy, and running the models is time consuming eg 40 hours per technology on a normal computer.
1.4.5 Learning from modelling LCT uptake and solutions
The University’s probabilistic impact assessment studies on their models of monitored underground LV networks with increasing LCT penetration identified the following.
• As uptake of PV increases, the first problem is always a voltage issue.
• As uptake of EHP and EV increases, the first occurrence of problems is driven by voltage and also by thermal issues. Indeed, 45% and 35% of the feeders have the first problem due to thermal issues for the EHP and EV cases, respectively.
• The utilisation of low resolution data (eg 15 min, 30 min and 60 min) for loads and generation profiles underestimates the impacts of LCT in LV networks, as does the use of a balanced load assumption.
• Among the feeders analysed, some do not present any problems with LCT penetration even at the maximum penetration level, including all those with less than 25 customers.

Low voltage network solutions closedown report/June 2014 Page 10 of 75
• The best individual metrics analysed to predict and explain the occurrence of voltage or thermal problems in LV feeders are the Initial Utilization Level and the Total Path Impedance. The combination of the Initial Utilization Level and the Total Path Impedance increases the coefficient of determination (correlation performance) for all the technologies. In fact, the multiplication of these two metrics produces coefficients of determination of 0.78, 0.88 and 0.79 for the PV, EHP and EV cases, respectively.
• An alternative easier to implement metric (in terms of access to input data) would be a combination of feeder length and number of customers, but this has a lower correlation metric of 0.61. This metric is currently being investigated as a means to target monitoring towards those feeders where network issues are more likely to occur.
The University applied their probabilistic methodology to investigate a selection of potential future network solutions – loop connection and the use of on-load tap changers.
The University investigated the interconnection of LV feeders for looped operation, both one by one and the network being completely meshed with every feeder connected to its neighbours. The University found meshing improves the utilisation of the network and its ability to host larger volumes of PV generation. Most of the problems are deferred to higher penetration levels; for the examined networks, the occurrence of the first problems moves from 40% of PV penetration level in the radial cases to 70% in the meshed operation (all feeders). Also, the results indicate that connecting different feeders leads to different scales of benefit depending on the feeder characteristics.
Applying the probabilistic methodology to investigate the use of on-load tap changers (OLTC), the University found the use of this device can improve the hosting capacity of the network when penetrations are ‘even’ among the feeders. For the studied network, voltage problems were deferred from 40% of PV penetration level without OLTC to 60% in the case with OLTC and busbar control. This figure increased to 80% in the case with remote control (furthest point in the network). This means it is possible to make staged investments (local control then remote control) in networks with progressive PV penetration. For the EV case, all the voltage problems were solved with the OLTC (local control) in the network analysed.
Considering the current cost of deploying devices for loop operation and OLTC-fitted transformers, the traditional cable-based reinforcement remains a cost-effective option to tackle medium penetration levels of LCT (up to 50%). Nonetheless, it is likely that the cost of the alternatives examined (nowadays in trial stage) will be reduced in the future and therefore are likely to become more attractive for wide-scale implementation.
1.5 How and when to monitor at LV
In parallel with reviewing interventions on the network, this project has made a series of recommendations relating to what and how to monitor at LV, summarised below.
• Both line-to-neutral voltages and phase currents (or active and reactive power) at the head of the feeders should be monitored.
• For performance evaluation of the network, the mean value of 10 minute sampling intervals (or close to this, eg 15 minutes) should be adopted to avoid underestimating voltage impacts in particular. For the monitoring of currents (or active and reactive power), hourly values are adequate. There is no significant benefit in adopting shorter sampling intervals (eg 1 or 5 minutes). If an operational solution with control is later adopted, sampling intervals can be adapted accordingly and could sometimes be longer.
• For voltage purposes, the end points of the corresponding feeders should be monitored given that the busbar would only work as a proxy if some knowledge of the feeders

Low voltage network solutions closedown report/June 2014 Page 11 of 75
exists. Mid points do not necessarily bring more critical information although they increase certainty and observability. However, for congestion purposes, currents at the head of the feeders should be monitored.
• The monitoring devices to be deployed, particularly at the substation, should ideally also monitor total harmonic distortions of voltage and neutral currents, given that high penetrations of LCT are likely to exacerbate these issues.
• When to monitor? LCT uptake may not necessarily lead to a network problem, so an approach which monitors first rather than intervenes first seems justified. The correlation metrics proposed in this project (or similar) should be adopted to find the most suitable penetration level of a given LCT for a feeder or LV network for which monitoring is required.
It should be recognised that the approach of directly monitoring the network to identify LCT impacts is likely in time to be superseded by the availability of smart meter data from customers. Electricity North West’s Smart Metering strategy was informed at a high level by the LV data challenges encountered by the ‘LV Network Solutions’ project. The strategy estimated that the benefits of smart meters to allow visibility of congested networks could be realised – with appropriate systems - once meters reach approximately 70% penetration ie the latter half of 2019. Thus the monitoring recommendations from this project are expected to be valid for at least the next five years - longer if suppliers’ smart meter rollout is delayed - but would not reflect the ongoing requirements for DNOs more generally.
1.6 Comparison with WPD’s ‘LV Network Templates’
Despite some similarities between ‘LV Network Solutions’ and WPD’s completed Second Tier Low Carbon Networks Fund project ‘LV Network Templates’ 2011-2013, the scope and objectives although aligned, are not the same.
The WPD project characterised LV networks by measuring different parameters at 824 substations. The ‘LV Network Solutions’ project (coming slightly later) had the advantage of deploying an LV monitoring solution without customer interruptions, but can validate the choice of a 10 minute sampling timeframe for monitoring.
By comparing similar networks with and without actual low carbon technologies (specifically PV and EHP), WPD qualitatively inferred the corresponding impacts. There was no network modelling, so most of the impact analysis was focused on the effects of LCT on the transformer capacity. ‘LV Network Solutions’ validates the conclusion that (predominantly) domestic LV networks are in general suitable for high penetrations of PV but not for EHP. WPD’s specific conclusion about de-rating PV capacity by 80% when considering its network impact is also consistent with the profiles and uncertainty methodology developed in this project. However, the WPD project suggests that overnight EV charging would not affect (mainly domestic) LV transformers. This is contrary to the findings of the ‘LV Network Solutions’ project. In addition from its feeder-level network modelling, ‘LV Network Solutions’ captures additional quantitative conclusions on LCT impacts on potential voltage and congestion issues, their likelihood and potential solutions.
Finally, although WPD’s analysis of feeder-end voltages was much more substantial, the analyses of the voltage monitoring from both projects do suggest that voltages are currently within statutory limits and an opportunity exists for busbar voltage reduction. Nonetheless, the network modelling that was performed within this project suggests this ‘opportunity’ has to be considered carefully, given that lowering voltages at the busbar might increase PV penetrations but might affect the ability of LV networks to host wide spread installations of EHP or EV. Further research is needed to find the optimal busbar voltages for different types of LV networks that allow them to cope – to some extent – with both voltage rise from PV but also voltage drops from EHP or EV which may occur at different times.

Low voltage network solutions closedown report/June 2014 Page 12 of 75
1.7 Comparison with Smart Grid Forum’s analysis in WS3 Transform
Given the familiarity of DNOs with the Smart Grid Forum’s Transform model, a qualitative comparison has been made with the analysis in ‘LV Network Solutions’. Although both models consider the likely impact of LCTs on distribution networks, fundamentally their analysis has different objectives, scope and detail.
Transform addresses questions of the likely mix of traditional and smart solutions for Great Britain’s distribution networks under different DECC decarbonisation scenarios to 2050, based on DNO-advised levels of network headroom. Rather than only considering LV, from LV it looks up throughout the distribution voltage levels up to transmission. Instead the detailed modelling for ‘LV Network Solutions’ asks at what % LCT uptake level would a problem occur at LV, and applying the detailed analysis method, how would selected example solutions perform? Nevertheless the comparison identifies various areas in which the learning from ‘LV Network Solutions’ could be used to benefit both future developments of Transform and future analysis by the Smart Grid Forum.
1.8 Conclusions
The work by the University of Manchester on LV network modelling (three-phase four-wire, 10 minute time series analysis, with real networks validated by monitoring, and the associated probabilistic Monte Carlo approach to dealing with uncertainty in profile and location) is a truly significant step forward in the analysis of LCT uptake on LV networks, particularly given that simpler modelling approaches underestimate the scale of network issues estimated. The detailed LV network monitoring data – including information by phase and by feeder – is equally a significant step forward compared to previous projects.
Electricity North West will be taking the findings of this project forward to create a new business-as-usual policy on how and when to implement LV monitoring, and also feeding a wider review of LV planning and connections policy. Electricity North West will continue to liaise with the University of Manchester as they continue their research using the networks and monitoring data provided in this project. An academic dissemination event is being planned, alongside further workshops for internal knowledge transfer.
The project has built the foundations for future deployment of LV monitoring – making significant contributions to the questions of both how and when to monitor in the context of increased LCT uptake. As such, this project has also directly contributed to a number of other low carbon and innovation projects at Electricity North West such as ‘Voltage Management at Low Voltage Busbars’, ‘Low Voltage Integrated Automation’, ‘Customer Voltage & Power Quality Limits’, monitoring of heat pump installations in partnership with the Japanese New Energy Development Organisation (NEDO). The monitoring technique is also being used in two of Electricity North West’s Second Tier Low Carbon Networks Fund projects - in ‘CLASS’ to ensure the voltage delivered to the customer is still within limits, and in ‘Smart Street’ as the foundation of the optimisation of voltage control for LCT uptake. This project has also influenced the planned LV modelling approach in ‘Smart Street’. Further information on ‘LV Network Solutions’ and on all of these projects is available at www.enwl.co.uk/thefuture.

Low voltage network solutions closedown report/June 2014 Page 13 of 75
2 PROJECT BACKGROUND
This section reproduces the ‘Problem’ and ‘Method’ as stated in the original project registration.
The transition to a low carbon future will affect distribution networks in many ways. It is expected that demand for electricity will rise as transportation is decarbonised by electric vehicles. Further demand will result from the electrification of heating in the form of heat pumps, which are expected to replace increasingly expensive to operate oil-fuelled and gas-fuelled heating systems. At the same time, rising retail prices and energy-efficient behaviour and appliances eg LED lighting, may mitigate some of the demand increase. In addition to changes in demand, government incentives such as feed-in-tariffs will encourage high penetration of various forms of generation on LV networks.
In order to begin to understand what these changes will mean to networks, network operators will need to measure the existing demand and voltage characteristics of networks at an increasingly granular level, and to develop models which enable them to forecast the effects of future scenarios for the penetration of customers' low-carbon technologies. At present, analogue data such as voltage and current is not routinely captured beyond the primary substation level. However, it is expected that as demands increase, it will be the low voltage networks that will experience both thermal and voltage problems ahead of the higher voltage networks. Given this, it is paramount that network operators quickly begin to fill the gaps in their understanding of the characteristics of low voltage networks and assets.
To address the Problem, Electricity North West intends to perform analysis on a representative sample of LV feeders. Electricity North West will install a range of metering equipment on the sample feeders, and fit voltage recording devices at distributed locations along the length of associated low voltage feeders. Electricity North West will also install power quality measurement devices to capture harmonics at selected locations to develop understanding of power quality issues. This data will be used to inform learning on the best available technologies needed to obtain the necessary data and the extent of instrumentation needed for enduring purposes.
Electricity North West will populate a database of network demand and voltage. This will hold time series data across the selected networks, including full network connectivity related to MPANs, over at least 18 months and possibly more. Electricity North West will develop capacity models of future low-carbon customer behaviour and their potential effects on networks, and use the obtained data from the measurement devices to calibrate these models. Using this Project, Electricity North West will ultimately develop new designs (incorporating new technologies) and operating practices which will help address future customer needs, without the need for extensive and potentially expensive network reinforcements in future price control periods. The focus of the project is on developing monitoring and learning to manage future network requirements, rather than to offset planned spending in the DPCR5 period.
3 PROJECT SCOPE
The ‘Scope’ here is as stated in the original project registration.
The project will deploy measurement, sensing and analogue recording instrumentation which will provide Electricity North West with greater understanding of the existing operating characteristics and demands of its LV networks. Electricity North West intends to identify a statistically meaningful sample of representative LV network feeders from its total population which will be used to map the characteristics of the total population. A number of phases will then follow: Phase 1 - Measurement and data collection; Phase 2a - Network modelling; Phase 2b - Calibration of models using measured data and other data; Phase 3 - Developing

Low voltage network solutions closedown report/June 2014 Page 14 of 75
appropriate LV future network solutions and validating the conclusions from other LCNF LV trials for the Electricity North West network.
Note – This Phase structure was not used in project management. Instead an approach better suited to the work activities was adopted, allowing different activities to progress in parallel. For example, the work contracted to the University of Manchester was managed with a set of deliverables in four work packages (see appendices).
4 SUCCESS CRITERIA
The following ‘Success Criteria’ are as stated in the original project registration.
• Identification of a statistically meaningful sample of representative networks;
• Establishing a database of network demand and voltage as time series data across the selected networks, including full network connectivity with MPANs;
• Construction of an LV/HV capacity model utilising newly obtained data and other existing data;
• Establishing minimum LV instrumentation requirements needed to support future network operation, the preferred technology types and their installation methods;
• Developing options for future operating practice and control, to help address future network requirements and assess the effectiveness of alternative technologies;
• Validate results of other LCNF projects such as the WPD Tier 2 Low Voltage Template project.
Section 7 reviews the project’s performance against these success criteria, and against the other additional success criteria from the ‘Scope’ of the project registration. In particular, the project deployed LV measurement instrumentation (including development of installation procedures and data collection); and it provided Electricity North West with greater understanding of the existing operating characteristics and demands of its LV networks.
5 DETAILS OF WORK CARRIED OUT (TRIALLED METHODS)
This section describes four areas of work.
• Selection of networks to be monitored
• Deployment of monitoring (approach to specification, tendering, installation and data retrieval/ export)
• Modelling and analysis by the University of Manchester, including development, validation and application of models to future scenarios of LCT uptake.
• Creation of the Future Capacity Headroom model
5.1 Selection of LV distribution networks to be monitored
In an iterative process as described below, two hundred substations and their associated networks were chosen to form part of the trial. This represents around 0.6% of Electricity North West’s total low voltage network, based simply on the number of substations.

Low voltage network solutions closedown report/June 2014 Page 15 of 75
The selection process began with considering what information was readily available on the LV network. Information about network length, impedance and customer density was not feasible to extract as the basis of a full bottom-up statistical analysis. Furthermore, before undertaking the analysis in this project, it was unclear which of these criteria would be the most relevant for the performance of the LV network or its potential to host low carbon technologies (LCTs).
A criteria-based approach was adopted for site selection, with the initial aim to broadly represent the range of circumstances of the LV network. The focus was on suburban underground networks, including a number with high PV penetration to enable analysis of the transition to a low-carbon economy, and mostly excluded networks presenting practical issues with monitor installation. Statistical analysis of the monitored networks was addressed later in the project (see sections 6.7 and Appendix J).
The starting point was criteria for a mix of networks suggested by the University of Manchester (eg urban, mixed, rural, with/ without PV, highly/ lightly loaded, old/ new, etc.), and this approach was then further developed by PB Power and Electricity North West into the following:
• Presence of low carbon technologies (primarily residential-scale PV systems);
• A spread of geographical location and composition of customers (eg urban, semi-urban, rural, etc.);
• Loading level (eg high peak demand relative to the transformer capacity);
• Number of feeders (also known as ways); and
• Avoiding substations recently subject to crime/ vandalism,
Substations were also chosen to provide monitoring data for the six sites in the parallel First Tier project ‘Voltage Management at LV Busbars’.
This led to an initial list of 200 substations subject to survey, where additional criteria were considered of safety and accessibility for the deployment of the monitoring kit, as described in further detail in section 5.2.2 on installation.
This resulted in some substations from the initial list being replaced with others of a similar type but without the practical constraints listed above. In the interests of deploying the monitoring on a reasonable timescale and budget, monitoring was not prioritised in these more difficult locations. If DNOs wish to deploy monitoring at a larger scale or at specific locations, additional costs may be involved in addressing these issues.
5.2 LV monitoring
In order to understand the operation of today’s low voltage networks and allow the University to validate their models, monitoring was deployed. The following parameters are directly measured by the monitors:
• RMS line to neutral voltage per phase,
• bi-directional RMS currents per phase, and neutral currents
• power factor per phase
• phase angle per phase

Low voltage network solutions closedown report/June 2014 Page 16 of 75
A very limited number of ambient substation temperatures were recorded but the results were not analysed in this project.
The following parameters are calculated:
• Active and reactive powers (per phase and neutral)
• Total harmonic distortion (THD) of currents or power (only considered as a proxy of THD of voltage).
All the measurements include identifiers for date, time, site, feature number (feeder), data concentrator serial number and phase. Parameters were recorded in total for the substation / transformer, and per feeder.
The monitoring data was transmitted back to and collected by Electricity North West, rather than relying on external hosting by a third party supplier or the University. This was to ensure that there would not just be learning second-hand from the LV monitoring data itself, but could understand the architecture requirements and to test out an enduring approach to own, handle and access the monitoring data within the company. The data from the monitoring devices were reported back to Electricity North West via the existing iHost system (provided by Nortech and upgraded during the project). See http://nortechonline.co.uk/products/ihost-platform/ for further information on the iHost platform.
A specification was agreed with Nortech and the University for the schema of monitoring data outputs to be exported to the University from iHost. Given the large volumes of monitoring data, this enabled the University to partially automate processing of monitoring data. Data transfer was done via comma separated variable (csv) files on hard disk drives. Both the iHost system and the University’s records of the monitoring data fulfil the aims in the project registration to populate a ‘database of network demands and voltages’.
Formats were also agreed for the transfer of GIS network models and customer MPAN data from Electricity North West to the University of Manchester, to enable the University to automate extraction and processing of these data types also.
5.2.1 Equipment selection and specification
The choice of equipment for this project was made following tender processes (separately for the main substation monitoring requirements, and then for the midpoint endpoint monitors).
For the initial substation monitoring tender, a tender specification was agreed with the University of Manchester, starting from their initial monitoring specifications and leading to a tender specification (see Appendices 3 and 4).
To maximise learning opportunities from the project, Electricity North West chose from the substation monitoring tender to go forward with two different products/ suppliers: the Envoy DNP3 from Nortech and the GridKey monitoring control unit (MCU). See the suppliers websites for further details http://nortechonline.co.uk/ www.GridKey.co.uk/system.html.
The choice in 2012 of two suppliers also reduced the risk to the project of one supplier defaulting, since both the GridKey and Nortech monitoring units were development units. However both suppliers were able to satisfy their contractual requirement to provide monitoring for 100 substations each.
Both manufacturers stated that their measurement units met the requirements of accuracy Class 1 of the active energy metering standard IEC 62053-21, and Class 2 of the similar reactive energy metering standard IEC 62053-23, which apply to the measurement of alternating current electrical active and reactive energy by static meters in 50Hz or 60Hz

Low voltage network solutions closedown report/June 2014 Page 17 of 75
networks. Tests of the metering to this standard cover accuracy at a nominal calibration point and across a range of currents, voltages, frequencies and power factors. There was no further calibration or accuracy testing of the monitoring equipment as part of the ‘LV Network Solutions’ project. Further information on accuracy and compliance is available from each manufacturer.
In the 2013 Low Carbon Networks Fund First Tier project ‘Assessing Substation Measurement Equipment’, run by WPD with UKPN, the GridKey system was assessed alongside a number of other systems (but not Nortech’s) for system accuracy and practicality of installation. The accuracy of the GridKey system was judged as ‘Good’, identifying that for currents above 25A, the RMS current error was less than 0.5%, well inside the Class 1 specifications of the system. The GridKey system came in overall joint first position in the WPD comparison of metering systems. This was a direct result of the development of the system and of the processes to install and use it, as described in the following sections, which were achieved as a result of the partnership relationship with Electricity North West on this project.
A key requirement in the tender process was that the monitoring units could be installed without customer interruptions. Achieving this required live working and the use of Rogowski coils rather than traditional current transformer (CT) monitoring. This requirement was met - no customers were disconnected during this project. However this requirement meant that the installation process had to be developed from scratch, as detailed in the next section.
All of the Nortech installations (100 substations) used traditional flexible Rogowski coils, but in around 75% of the GridKey installations, a new type of Rogowski coil from GridKey was used called a Gridhound, as shown in Figure 1. The Gridhound is intended to be more accurate than the usual flexible type of Rogowski coil but is rigid in construction. It is like a small fixed Current Transformer in appearance, with a hinged side opening which allows it to slip around a cable core and then be clicked back into place. The chosen method fixed four coils, including the neutral. As a precaution the serial number of every monitoring unit and Gridhound was recorded in case of a subsequent fault or failure in performance, so that individual batch production groups could be identified and their installation locations. None have failed so far however.
Figure 1 – Two Gridhounds with a GridKey Monitoring Control Unit (MCU)
If the core size was too large in diameter or there was not easy access to the insulated cores of the distribution cables, then flexible Rogowskis needed to be used (predominantly outdoor). This choice was identified at the pre-installation survey stage so that the correct

Low voltage network solutions closedown report/June 2014 Page 18 of 75
number of different coils could be ordered. Obvious checks were made to establish the condition of the core insulation and the possibility of the cores having rigid insulation around them, thus preventing the installation of Gridhound coils.
For the subsequent midpoint/endpoint tender, the learning from the original tender plus specifications for the housing were incorporated in an Electricity Specification document (see Appendix 5). A framework procurement agreement was put in place with GridKey after the midpoint/endpoint tender award.
5.2.2 Installation method
Monitoring equipment was installed in ground mounted distribution substations and at strategic pole mounted locations as per Figures 2 and 3. GridKey and Nortech provided installation guidance but neither was difficult to install – as an example GridKey’s high-level installation guide is provided in Appendix 8.
Figure 2 – GridKey substation monitoring on an open LV fuse board
Figure 3 – Nortech substation monitoring on a pole (left) and indoors (right)
The installation approach was developed into an Electricity North West Code of Practice on ‘Installation, Maintenance and Removal of Monitoring and Measuring Equipment’ and associated procedures, provided as Appendices 1 and 2. The rest of this section describes
GridKey monitoring unit up to five way (LV cables) with 3G communications and
Rogowski coil current sensors around each phase core and
Voltage clamp on busbars -Three Phase and Neutral/Earth

Low voltage network solutions closedown report/June 2014 Page 19 of 75
the installation approach adopted after the initial site selection, highlighting key points from the Code of Practice. This Code of Practice was written as a direct result of this project.
5.2.2.1 Development of a safe installation approach
The project was discussed with Electricity North West’s System Operation Office to ensure compliance with the company’s Safe Systems of Work and Safety Rules. The following rules were followed.
• All staff needed to be fully trained, have an LV Operational Authorisation and not work alone. Obviously but importantly, staff used the established personal protective equipment for this type of work.
• The safe method/process of installation had to be documented (see Appendices 1 and 2), approved and every member of staff working on the installations needed to be trained in this process. This was to cover how installations would be executed, taking into account the various situations that would be encountered and tasks required eg indoor substations with bare LV busbars, various types of outdoor substations with metal clad LV switchgear and other various types of plant, equipment and situations found. A new LV operational authorisation code was issued for this work.
• This process and training had to include the documentation and records, to ensure installations could be configured correctly into the iHost server and entered into an asset record system.
The installation approach was developed by the project, and a mix of direct labour and contract staff were used to deliver the substation installations.
The page overleaf shows an example of the notices installed in substations where monitoring was installed.

Low voltage network solutions closedown report/June 2014 Page 20 of 75
Voltage and Current Measuring Equipment is installed in this Substation
The equipment installed in this substation is installed as part of a Low Carbon network trial in partnership with Manchester University. The data is being analysed by the university and as a result the findings will be used to develop
new network policies which will improve our service to customers
Current
It is important that this equipment is maintained in position and is not interfered with. Please take care when carrying out work or operations. If it is disturbed or removed in the interests of operational work please inform Network Strategy or the Control Engineer.
The data collected by this monitoring equipment is being analysed and used by Manchester University so that the effects of the Low Carbon Economy of the future can be understood and new policies can be developed to improve our service to our customers.

Low voltage network solutions closedown report/June 2014 Page 21 of 75
5.2.2.2 Site Survey
The site surveys had three functions – safety, determining the number and type of ancillary items such as Rogowski coils required for each installation (to enable ordering of the appropriate equipment and management of costs), and a check of the data held on existing asset databases. This data included the number of ways, their position on the LV board, and the manufacturer of the LV board. A survey form suitable for this project was devised, and is shown in Appendix 6.
When proposing to install any equipment in electrical substations, a survey of the proposed workplace is vital, especially if work on or adjacent to the live electrical system is envisaged. This is necessary to establish a safe working procedure and work methodology. Particularly given that live working was a requirement of an installation approach without customer interruptions, and the wide variety of substations situations, this project found that careful substation survey to identify practical and safety issues before installation was of crucial importance.
Two hundred substations were initially surveyed. The rest of this section picks out key issues addressed in the survey and subsequent installation. Whether the substation was indoors or outdoors had a great influence on installation method, as described below in relation to security and available space. The most basic issue was whether there was available space to mount or stand the monitoring unit – thus explaining Electricity North West’s eventual preference for the smaller GridKey unit. However some installation situations were more fundamentally difficult eg pillar in pavement, outdoor substation in a wood, soil substation floor etc.
Indoor substations have the following attributes:
• Good security - equipment is installed inside a locked building.
• Often have suitable internal walls onto which the monitoring equipment and associated wiring can be fixed in a tidy manner.
• Often have open/exposed LV busbars on to which voltage connections can be made to provide voltage to the monitoring unit. Electricity North West approved and used a Martindale ‘G’ clamp fitted with a fused banana plug connection. When these were fitted, the voltage leads could be firstly connected to the monitors and then energised via the fused plug connection.
• If the LV Switchgear is contained inside a metal enclosure (as in a Transformer LV Take Off Chamber with insulated Busbars) then the installation method would be similar to the outside substation methodology including the voltage connection as described below.
Outdoor substations tend to be open to general intrusion, even though the security of the metal-clad distribution equipment is excellent. This can mean it is then more difficult to add monitoring equipment:
• The monitoring units are fully IP rated and are secure and locked. Even so, if it could be located safely inside an existing metal cabinet (LV cabinet say) then it would be.
• Otherwise a standing frame was developed which could be bolted to an existing concrete base and onto which could be fixed the monitoring unit.
• Nortech units came fully protected in a procured metal box which easily could be fixed in outdoor substations. The GridKey unit was a light plastic box which although fully IP rated and locked was felt to be more vulnerable. Where outdoor, they were installed

Low voltage network solutions closedown report/June 2014 Page 22 of 75
inside an outdoor meter cabinet as a measure of extra protection, as shown in Figure 4. No units so far have been interfered with.
Figure 4 – Electrotech Mounting Frame for Outdoor Installation, plus Cabinet for GridKey Monitoring Unit
• In outdoor substations and in some indoor, sensor wires were installed in conduits to keep them secure. In the case of voltage wires, where they ran outside monitoring units or metal enclosures in outdoor substations, they were installed in metallic earthed conduits. All metallic equipment was earthed.
Some substations (generally outdoor but some indoor) have LV busbars enclosed in metal cast-iron LV pillars, leaving little available space to insert any type of Rogowski coils, and the voltage and current leads, given the position of the cable ends. In some cases the clearances between live conductors or the internal condition would have involved extra work to install safe connections, and might have involved customer interruptions. Generally installing LV monitoring in cast iron pillars was avoided.
Approach to voltage connection
Exposed LV busbars could take the fused ‘G’ Clamps very easily. Shielded LV busbars posed more of a problem. Although ‘G’ Clamps could be fitted to exposed LV fuse connections, this was difficult in practice. An alternative approach was to use an LV fuse holder fitted with a fused ‘banana plug’ socket. This meant having a spare LV way on the LV board, or having a way which could be back fed from an LV Link Box (so that no supplies would be lost whilst the fuse holders were replaced).
Where fused ‘G’ Clamps or the approach with an LV fuse holder fitted with a fused ‘banana plug’ socket were not possible, fused auxiliary connections could be used, providing they were checked prior to use in line with Electricity North West’s current operational procedures. This was particularly important for the ABB range of boards which are currently subject to an operational restriction. Connections to the auxiliaries were made with approved crimped connections.
Approach for pole-mounted transformers (usually single LV overhead lines)
The installation methodology was to an approved design utilising approved established overhead LV live working techniques. The monitoring was generally installed on the transformer pole outside the HV limit of approach or on the first pole out. The LV fused connection was the usual line tap, and the current connection utilised Rogowski coils around each line conductor (including the neutral).
5.2.2.3 Development of substation monitoring products
This section describes the developments of substation monitoring products as an outcome of this project. A point worthy of note is that this project very much used prototype equipment.
The Nortech Envoy units were robust and accurate, but relatively large. The Nortech Envoy Remote Telemetry Unit (RTU) was very much based around utilising ‘off the shelf’ components rather than development from scratch. The units took both current and voltages

Low voltage network solutions closedown report/June 2014 Page 23 of 75
from the appropriate remote sensors (voltage bus bar connections and flexible Rogowski current coils) via a three phase modular power meter. The power meter is interrogated by a Nortech Envoy RTU using the industry standard DNP3.0 protocol to transfer the readings to the central iHost server over a 3G/GPRS connection.
Whilst the Nortech units were larger (housed in a steel proprietary IP rated box), and more expensive than the equivalent GridKey unit, they were a quality, robust and reliable alternative. Each unit was provided for a particular position on the network i.e. for a particular substation since the components required for each unit depended on the number of LV feeder ways in the substation. For every way in a substation there had to be the equivalent number of sensor meters and sensors. The unit made for an eight way substation was thus significantly larger than one produced for a three way substation. Nonetheless this fact did not present any undue problems to the installers, and manufacture, testing, delivery and installation went very smoothly.
Nortech have worked with many DNOs on similar projects and therefore the monitoring units were produced in a highly organised and controlled environment. The factory test included pre-installing the SIM cards and proving the 3G communication link prior to delivery, and therefore they were easy to install and performed well from the offset. One or two teething problems needed to be overcome e.g. some water seals failed when the unit was used in a pole mounted position. These minor issues were soon rectified.
The GridKey units offered potential to be a smaller, cheaper and more flexible solution, but beginning at a more experimental stage, they thus required more development as the project progressed. Appendix 9 provides further information on the product development work done by GridKey as part of the monitoring for ‘LV Network Solutions’, and identifies areas of learning which they are taking forward in their more general product development. For example during the project, there were some return visits to substations to replace early units with substandard memory cards. This would not be likely to occur with future installations. Furthermore, software and configuration updates can now be delivered remotely, and software was developed for a laptop which could be connected to the units via an infra-red puck. This software is now routinely used by Electricity North West when installing systems (including the mid and end point units) in order to allow on-site rather than just remote configuration of the units.
Based on the product development work done by GridKey with Electricity North West for the substation monitoring for the ‘LV Network Solutions’ project, GridKey entered and won the 2012 UK Energy Innovation award for the ‘Best Smart Grid Technology’ and the GridKey project. Subsequent work by Electricity North West and GridKey on midpoint/endpoint monitoring in the latter stages of this project is described in the next section.
5.2.2.4 The ‘Smart Joint’ midpoint installation method
The original project registration had envisaged voltage measurements along feeders, but without specifying method. During the development of their network models, the University suggested it would be very beneficial to have voltage and current measurements at points remote from the distribution substation. In response to this request Electricity North West investigated the practicalities of installing mid/end point feeder monitoring on underground cables.
It was decided to progress development of a solution using the relatively small GridKey measurement devices, and data concentrator (which was small and easily fixed within a feeder pillar).

Low voltage network solutions closedown report/June 2014 Page 24 of 75
A suitable housing was sourced via a local manufacturer (Ritherdon) to contain the GridKey data concentrator and local isolation – see Figure 5.
Figure 5 – Housing containing GridKey data concentrator
For provision of voltage to the unit, a standard 3-phase service joint would fulfil the requirements. However an approach needed to be developed for the current measurement.
In the substation installations, the current measuring device is called a ‘Gridhound’. The manufacturers of these devices were consulted to assess their suitability to be installed in a resin-filled cable joint. Once it was understood that the performance of the devices would be unaffected, Electricity North West used in-house experience to develop a joint which is now referred to as the ‘Smart Joint’.
Initially Electricity North West considered using one joint to hold both the voltage and current elements of the ‘Smart Joint’. This was discounted for the following reasons:
• Two smaller joints would require less exposed live LV cable thereby reducing the risk to the jointer.
• The 3 phase service joint is already a standard part of Electricity North West jointing procedures and using it would reduce development time and risk to the project.
• Having two joints allowed Electricity North West to use standard joint shells and less resin.
The most appropriate solution from both a safety and financial viewpoint then was to use two joints - one for the voltage measurement and one for the current measurement. Each current measurement joint required four Rogowski coil Gridhounds – one per phase and a neutral.
Figure 6 – Joint for Current Measurement
Using Electricity North West in-house expertise, a series of jointing procedures were developed to cover the different LV cable types likely to be encountered. The installation instructions for these ‘Smart Joints’ were included in the previously mentioned Code of Practice (see Appendix 1). The associated jointing procedures can be found in Appendix 2.
Once the design and procedures had been established, a ‘focus group’ was created in Electricity North West’s south operational area including a planning engineer, and two jointing teams.

Low voltage network solutions closedown report/June 2014 Page 25 of 75
The planning engineer planned the locations of the Mid and End points, produced the construction files and the initial data required for iHost and Master Asset Records e.g. address, XY coordinates, Feeder way which the units were to be attached.
The group then focused on the details of safe installation techniques, plus scheduling of civil works with excavation contractors, and customer care aspects eg letters explaining the reason for the pillars and regarding the position of metering cabinets in the road for the midpoint/endpoint monitors.
The first installation was then trialled on site at Droylesden, Manchester with the South Operational Engineers being familiarised with the new units. Training on commissioning the monitors to iHost was delivered based on the Code of Practice for substation monitoring, and familiarisation in working with GridKey and iHost configuration staff completed.
Staff from the South region were then used to handover/shadow planners and engineers in the Central and North regions to ensure a continuation of best practise. Initial jointer training occurred over two days at Electricity North West’s training centre and further training continued on site at the first few installations.
As these installations are more permanent than the substation installation, each cabinet was given an asset number and they are recorded both in Electricity North West’s GIS and Asset Management systems.
A further development was made by GridKey in the form of a ‘Smart Plug’. When inserting the Gridhounds current sensors (Rogowski coils) into a ‘Smart Joint’, it is possible for the jointer to install them reversed so they read negative current. Therefore GridKey developed a plug which switched the polarity and could be inserted in the roadside cabinet after the installation has been done (and the joint buried).
The primary benefit of midpoint endpoint data is expected to be improved performance evaluation of feeders, particularly voltage drop/rise and THD away from the substation and closer to customers. The University of Manchester’s analysis showed this is particularly relevant in the context of LCT uptake. The secondary benefits are that midpoint data could in the future be used to improve validation of network, to contribute to the creation of representative feeders (although extent of improvement tbc), and to improve the creation of monitoring-based ‘allocated’ demand profiles/ better assess the validity of alternative profiles.
Due to the small scope of installations within the timeframe of the project, the ‘LV Network Solutions’ project has not used or analysed any of the data collected from the midpoint endpoint monitoring. The contribution of the ‘LV Network Solutions’ project has been in developing the midpoint /endpoint monitoring method. The initial 25 feeder deployment has been transferred into a larger capital scheme for performance evaluation with midpoint/endpoint monitoring of 100 feeders (200 monitors). The method is also being used in a variety of other Electricity North West innovation projects (see section 11.1).
5.3 Data collection approach
To deal with data collection, storage and access, the data from the monitors was transferred via 3G to Electricity North West’s existing iHost server system supplied by Nortech. This approach meant that Electricity North West maximised learning about handling the data, and ensured ongoing access to the data. Leveraging an existing system procured outside of this First Tier project meant the data collection could be delivered to minimise additional cost. However an existing system does not mean no additional costs – for example network security issues and firewall permissions needed to be addressed for connecting new types of devices.

Low voltage network solutions closedown report/June 2014 Page 26 of 75
Figure 7 is a diagram supplied by Nortech to show the process of data collection from their ‘Envoy’ monitoring units, but the same approach is applied for GridKey monitors.
Figure 7 - Data Collection Approach from Monitors
There were two types of challenges in data collection – issues with registration of individual monitors, and issues with the bulk data collection and archiving. In many cases, continual and early engagement with IT, network security and telecoms colleagues is key to preventing or resolving problems. This highlights the increasing importance of these specialist skill areas for DNOs in the context of trying to increase visibility of the LV network and of customer behaviour with LCTs.
Considering issues with individual monitors first, the project tackled some issues with commissioning quality and communication reliability. In some locations, the mobile signal was weak and an additional aerial was fixed/ repositioned, with lessons learnt for subsequent installations. In the context of multiple Electricity North West projects requiring SIM cards for a variety of purposes, for this project, there needed to be careful management of multi-stage process for ordering and registering SIM cards for installation by GridKey/ Nortech in their units. The permissions needed to be correct at each stage (eg voice or data, private or public, appropriate access point number (APN)), and data needed to be captured all the correct combinations of mobile, serial and other reference numbers to allow fault finding. In some cases, the feature numbers of network assets were not correctly captured at the commissioning stage, leading to difficulties with later analysis until this was fixed.
Collecting and hosting the data from the monitoring devices was a source of considerable difficulties in this project, but also a source considerable learning. This was owing to a combination of both the volume and velocity of the data flow and the development nature of the monitoring equipment and associated data retrieval systems. Difficulties with storing and extracting the data were overcome by:
• Amending the one minute sampling rate to every 10 minutes. The initial one minute rate was chosen at the University’s request, but agreed a reduction to 10 minutes would be provide sufficient data to assess voltage compliance (see section 6.8 on monitoring recommendations).
RS-485 ModBus Link to Power Meter
GPRS/3G Network(Private APN secures communications
and provides gateway to ENWL)
Envoy fitted with SIM cardAssigned private, static IP Address by ENWLTime stamped data logs created every 1-10 mins
1 set of Rogowski coils fitted per LV way3 phases and Neutral measured
iHost server at ENWLConsists of communication
modules, database and web UI
Daily export producesCSV files to be used by
The University of Manchester
DNP3 Protocol between iHost and Envoy
Unsolicited event reporting transfers data logs in near real time
GPRS/3G

Low voltage network solutions closedown report/June 2014 Page 27 of 75
• A review of the iHost specification and an upgrade programme, working with Nortech as a supportive partner.
• Additional processing to reformat/ re-integrate various data archives with additional reference data into the formats required by the university.
Although these issues caused some delays and interruptions to the provision of monitoring data to the University of Manchester, sufficient days of high quality monitoring data were provided up to the end of January 2014 to permit the network model validation and analysis detailed in the rest of this report. Each deliverable report (written at different stages in the project) reflects the availability of monitoring data at the time of writing.
Some minor issues with individual monitors remain to be resolved, but the main problems with the collection of monitoring data were successfully resolved by the end of the project. The iHost data collection and storage processes now perform well and provide ongoing access for the company to LV monitoring data, plus periodic additional data for the University. Figure 8 shows an example of available data output. Further work is now required to streamline enduring processes for monitoring asset data collection (crucial for fault finding and redeployment) and expectations for system availability and disaster recovery.
Figure 8 – Example of a Voltage Graph from Monitored Data from iHost
5.4 University of Manchester’s methods
To assess the impacts of different penetrations of low carbon technologies (LCT) on LV networks, as well as to investigate the potential solutions, detailed and realistic models of the different components are required. These models include the LV networks, the individual household demands and the corresponding LCT.
The methodology and analysis carried out by The University represents a major step forward compared to what has been done previously by Distribution Network Operators (including LCNF projects). The adopted detailed network modelling identified the benefits of:
• Three-phase four-wire modelling. The realistic modelling of LV networks (three phases plus neutral) allows catering for their inherent unbalance nature (due to both connectivity of consumers but also due to the demand itself) which can have significant

Low voltage network solutions closedown report/June 2014 Page 28 of 75
effects on the quantification of impacts. The utilisation of single-phase (balanced) network and load representations was found to underestimate the impacts of LCT in LV networks;
• Time-series analysis with a minimum of 10 minute resolution. This allows a much better representation of the interactions of demand with LCT and hence a better quantification of impacts throughout the day. Owing to the BSEN50160 standard, analyses carried out with intervals longer than 10 minutes are likely to underestimate voltage impacts; and,
• Monte Carlo probabilistic assessment. Many simulations were carried out to cater for the diversity and uncertainties of customer behaviour, as well as LCT location, size and behaviour. This allowed presentation of the likelihood of potential impacts rather than ‘definite’ numbers, thus facilitating more informed decisions.
Electricity North West identified a number of key research questions to be answered by the University of Manchester, the academic partner, as part of this project. The key deliverables related to the methodology they adopted are detailed in the following appendices:
• Appendix B ‘Creation of non-validated computer-based models of monitored and generic LV networks ready to be used for planning studies’
• Appendix E ‘Production of validated LV networks’;
• Appendix H ‘Creation of aggregated profiles with and without new loads and DER based on monitored data’; and,
• Appendix I ‘What-if scenario impact studies based on validated and generic LV networks’.
• Appendix J ‘Characterisation of LV networks (feeders)‘
More details of the above aspects will be presented in the following sections, with the network characterisation in section 6.7.
5.4.1 Creation and validation of network models
Electricity North West made available to the University of Manchester electronic GIS-based data for the different monitored LV networks, MPAN data files and technical data within Codes of Practice. This data included the network topology, type of conductors, type of connections, location of MPANs, MPAN profile class, and details of small-scale generation per MPAN.
As detailed in Appendix B, the University developed a detailed process to translate this data into the distribution network analysis software package OpenDSS. This included the extraction of key data from the GIS-based files provided by Electricity North West (eg cable types, cable lengths, customer location, customer phase connection, etc.). In addition, due to the existence of unconnected segments (from millimetres to centimetres) in the GIS-based files, an algorithm was produced to ‘reconnect’ these elements. Detailed checks of the GIS-based data were carried out by the University with Electricity North West’s data management section, including MPAN numbers and link box positions, to avoid significant discrepancies.
Once processed, given that assumptions had to be made when data was not available, this data is then translated into a format readable by the distribution network analysis software package OpenDSS. This particular software was adopted due to its ability to run time-series three-phase power flow simulations as well as its flexibility to be scripted via the Component Object Model interface, allowing a realistic modelling but also an efficient management of

Low voltage network solutions closedown report/June 2014 Page 29 of 75
large volumes of data. Figure 9 illustrates the topology of two processed LV networks. The corresponding feeders are identified by colours. The substations are identified by a red triangle.
Figure 9 - Examples of two LV Networks
Detailed checks of the GIS-based data were carried out by the University with Electricity North West’s data management section at various stages, including MPAN numbers and link box positions, to avoid significant discrepancies.
Appendix E explains in detail the methodology used to validate the computer-based models of the studied LV feeders. This was necessary in order to verify whether the topology adopted in the models was the actual topology of the corresponding feeder. The methodology compares monitoring data at the head of each feeder with power flows based on Electricity North West’s diversified load assumptions per customer (derived from ELEXON profiles). This was also extended to cater for feeders with photovoltaic systems by adopting sun irradiance monitoring data from The University of Manchester.
This network validation methodology, although adequate for the data available, was found to be highly sensitive to the number of customers. The validation process worked best for feeders with more than 50 customers. Of the feeders analysed for the what-if LCT scenario analysis described in section 6.5, 53% had fewer than 50 customers. In these cases, the monitored loads at the head of the feeder are less likely to reflect the diversified load assumptions per profile class. This does not mean that the network topologies were expected to be wrong for these feeders, just that that the topology could not be validated by monitoring data.
5.4.2 Identification of Load and LCT profiles as inputs to modelling
Profiles of loads and LCT used in the modelling have been based on existing data (such as ELEXON-based profiles) or produced by other organisations (eg Loughborough University’s Domestic Demand and PV tool, aka CREST, and the profiles in the Transform model produced by Smart Grid Forum Work Stream 3).
The source and evaluation of profiles for individual household demand (load profiles) as well as for LCT, ie photovoltaic systems (PV profiles), electric heat pumps (EHP profiles), and electric vehicles (EV profiles) are described in Appendix H. The key messages for each profile type are described in this section.
3.899 3.9 3.901 3.902 3.903 3.904 3.905 3.906
x 105
3.984
3.985
3.986
3.987
3.988
3.989
x 105
[m]
[m]
Substation 2
3.905 3.9055 3.906 3.9065 3.907 3.9075 3.908 3.9085 3.909 3.9095 3.91
x 105
3.9275
3.928
3.9285
3.929
3.9295
3.93
3.9305
3.931
3.9315
x 105
[m]
[m]
Substation 1
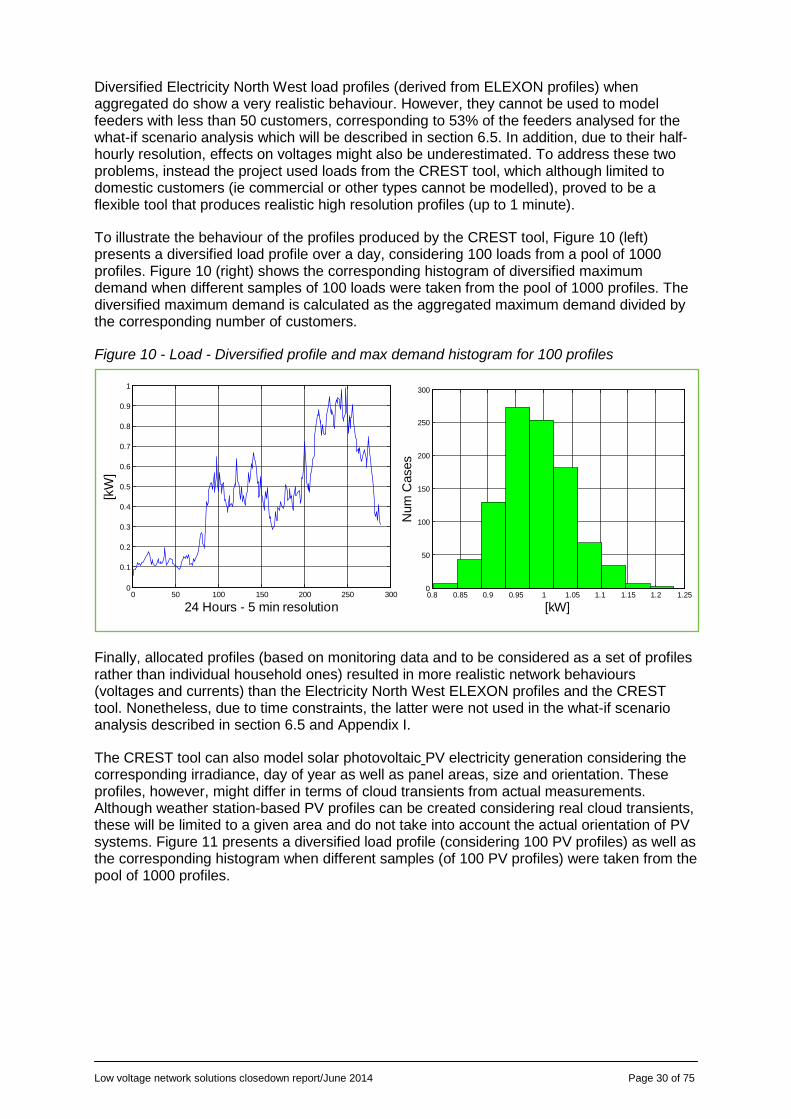
Low voltage network solutions closedown report/June 2014 Page 30 of 75
Diversified Electricity North West load profiles (derived from ELEXON profiles) when aggregated do show a very realistic behaviour. However, they cannot be used to model feeders with less than 50 customers, corresponding to 53% of the feeders analysed for the what-if scenario analysis which will be described in section 6.5. In addition, due to their half-hourly resolution, effects on voltages might also be underestimated. To address these two problems, instead the project used loads from the CREST tool, which although limited to domestic customers (ie commercial or other types cannot be modelled), proved to be a flexible tool that produces realistic high resolution profiles (up to 1 minute).
To illustrate the behaviour of the profiles produced by the CREST tool, Figure 10 (left) presents a diversified load profile over a day, considering 100 loads from a pool of 1000 profiles. Figure 10 (right) shows the corresponding histogram of diversified maximum demand when different samples of 100 loads were taken from the pool of 1000 profiles. The diversified maximum demand is calculated as the aggregated maximum demand divided by the corresponding number of customers.
Figure 10 - Load - Diversified profile and max demand histogram for 100 profiles
Finally, allocated profiles (based on monitoring data and to be considered as a set of profiles rather than individual household ones) resulted in more realistic network behaviours (voltages and currents) than the Electricity North West ELEXON profiles and the CREST tool. Nonetheless, due to time constraints, the latter were not used in the what-if scenario analysis described in section 6.5 and Appendix I.
The CREST tool can also model solar photovoltaic PV electricity generation considering the corresponding irradiance, day of year as well as panel areas, size and orientation. These profiles, however, might differ in terms of cloud transients from actual measurements. Although weather station-based PV profiles can be created considering real cloud transients, these will be limited to a given area and do not take into account the actual orientation of PV systems. Figure 11 presents a diversified load profile (considering 100 PV profiles) as well as the corresponding histogram when different samples (of 100 PV profiles) were taken from the pool of 1000 profiles.
0 50 100 150 200 250 3000
0.1
0.2
0.3
0.4
0.5
0.6
0.7
0.8
0.9
1
24 Hours - 5 min resolution
[kW
]
0.8 0.85 0.9 0.95 1 1.05 1.1 1.15 1.2 1.250
50
100
150
200
250
300
[kW]
Num
Cas
es

Low voltage network solutions closedown report/June 2014 Page 31 of 75
Figure 11 – PV - Diversified profile and max demand histogram for 100 profiles
Electric Heat Pump (EHP) profiles developed in this report were based on real heat requirements of different houses in England considering the outside temperature and also the real characteristics of EHP. The methodology has the advantage of allowing adjustment to the scale the profiles to model different insulation level and also allows the creation of ground source heat pump profiles. The average maximum demand increases from 0.8 kW to about 3.0 kW with EHP (air source heat pump installed in modern houses). Figure 12 presents a diversified load profile (considering 100 EHP profiles) as well as the corresponding histogram when different samples (of 100 EHP profiles) were taken from the pool of 1000 profiles.
Figure 12 - EHP - Diversified profile and max demand histogram for 100 profiles
Electric Vehicle (EV) profiles developed in this report are based on real EV data considering connection time and event. Although hundreds of individual profiles were created for only one type of EV (Nissan Leaf), the model can be updated to incorporate different brands and different battery capacities. The average maximum demand increases more than 200% with EV (to 1.8 kW). Figure 13 presents a diversified load profile (considering 100 EV profiles) as well as the corresponding histogram when different samples (of 100 EV profiles) where taking from the pool of 1000 profiles. Two sensitivities for EV profiles (with a peak more coincident with peak demand and fast charging) were also studied.
0 50 100 150 200 250 3000
0.5
1
1.5
2
2.5
3
24 Hours - 5 min resolution
[kW
]
2.2 2.4 2.6 2.8 3 3.2 3.4 3.6 3.80
50
100
150
200
250
300
[kW]
Num
Cas
es
1.7 1.8 1.9 2 2.1 2.2 2.3 2.4 2.5 2.6 2.70
50
100
150
200
250
[kW]
Num
Cas
es
0 50 100 150 200 250 3000
0.5
1
1.5
2
2.5
24 Hours - 5 min resolution
[kW
]

Low voltage network solutions closedown report/June 2014 Page 32 of 75
Figure 13 – EV - Diversified profile and max demand histogram for 100 profiles
To understand the potential interaction of the profiles presented, Figure 14 depicts the net profile (consumption minus generation) for all the technologies under analysis. It is interesting to note that the EHP results in the highest power requirement from the network, followed by the EV shifted case. In contrast, the EV case without shifting (for slow and fast mode) produces a diversified power requirement lower than 2 kW. In respect of the generation technologies, it is possible to see that the µCHP does not in general produce reverse power flows. On the other hand, the PV penetration can produce about 2.3 kW of reverse power flow per load.
Figure 14 - Comparison of Diversified Net Profiles for different Low Carbon Technologies
5.4.3 What-if scenario methodology for network impact of LCT uptake
Once the network models and load/LCT profiles were produced, it was possible to analyse the technical impacts (eg non-compliance with BSEN50160, energy losses, asset utilisation, etc.) of a given penetration of a given technology during a specific type of day. However, doing this analysis only once could under or overestimate results as it would not cater for the
-4.00
-3.00
-2.00
-1.00
0.00
1.00
2.00
3.00
4.00
1 9 17 25 33 41 49 57 65 73 81 89 97 105
113
121
129
137
145
153
161
169
177
185
193
201
209
217
225
233
241
249
257
265
273
281
kW
24 Hours - 5 minutes resolution
Load + EV Load + EV FastLoad + EV Shifted Load + EHPLoad - uCHP Load - PV
0 50 100 150 200 250 3000
0.2
0.4
0.6
0.8
1
1.2
1.4
24 Hours - 5 min resolution
[kW
]
0.8 0.9 1 1.1 1.2 1.3 1.4 1.5 1.6 1.7 1.80
50
100
150
200
250
300
[kW]
Num
Cas
es

Low voltage network solutions closedown report/June 2014 Page 33 of 75
natural uncertainties related to human behaviour (affecting household demand) as well as location and capacity of the corresponding LCT. Consequently, a more thorough approach called Monte Carlo was adopted to assess the potential impacts of different future penetrations considering multiple simulations for a single case (ie technology, penetration level, day, and LV feeder).
The deliverable report in Appendix I describes the impacts of LCT in the studied LV feeders. This entails analysing the capabilities of these networks to host new LCT studying the penetration levels (% of houses with the technology) that trigger technical problems. The increase of LCT in LV networks could produce voltage issues (drop and/or rise), thermal overload of the lines or transformers, and higher energy losses. Although indicative values for the rise in total harmonic distortion of current were considered in the performance evaluation, the implications of LCT for power quality and THD were outside the scope of this what-if scenario analysis.
To assess the extent of these effects on the performance of LV networks, a Probabilistic Impact Assessment Methodology is implemented in this report. This methodology combines real networks, time-series analysis, a Monte Carlo approach (hundreds of simulations per penetration level) for loads and LCT (behaviour, location and size), and the use of an unbalance power flow engine to assess the impacts. The main steps are summarised in Figure 15.
Figure 15 - Impact Assessment Methodology Flow Chart
Several metrics are used to assess the corresponding impacts. This includes percentage of customers with voltage problems per feeder (based on the BS EN50160), utilisation level of the feeder (adopting hourly maximum currents), daily energy losses, probability distribution of having certain number of customers with problems, etc.
With this methodology, the potential risk can be assessed (in terms of probabilities) of having a given LCT penetration on a distribution network. Even once the network models and simulations have been set up, the Monte Carlo analysis is relatively time consuming. With 100 simulations per penetration level (0%-100%) meaning 1100 power flows, the analysis takes 40 hours per technology in a normal computer. The analysis presented considered 6 types of LCT (PV, HP, micro CHP, slow charge EV overnight, slow charge EV evening and fast charge). Since the networks are analysed independently, this process can be increased by using more than one computer. However the time to perform the analysis suggests the use of Monte Carlo to inform a DNO’s policy and approach to monitoring and intervening to manage LCT impacts on their LCT networks, rather than suggesting planning engineers in DNOs would use Monte Carlo analysis to evaluate those impacts routinely.
For illustration purposes, the impact assessment for the feeder shown in Figure 16 is presented for PV and EHP. In each case 100 simulations were carried out per penetration
• Random allocation for each customer node.
Loads
• Random allocation of sites and sizes.
LCT• Time Series
Simulation.• 3 Phase four
wire power flow
Power Flow

Low voltage network solutions closedown report/June 2014 Page 34 of 75
level (from 0 to 100%). This particular feeder supplies 94 customers through a network of 2.2 kilometres (including laterals and service cables).
Figure 16 - Example Feeder
The percentage of customers with voltage problems is calculated considering the customers’ expected non-compliance with the BSEN50160 standard (adapted for one day). Once, the percentage of customers with voltage problems is calculated for each simulation, the average and standard deviation is determined for each penetration level. The results for the example feeder are presented in Figure 17.
For the PV case, the problems, although limited to ~2% of the customers, start at 40% of penetration level (40% of the houses with a PV panel). At 60% of penetration however, 10% of the customers (in average) are not within the statutory limits. On the other hand, the EHP produces voltage problems at 60% of penetration level and the magnitude of the problems are lower than in the PV case.
Figure 17 - Example of Customer Voltage analysis for PV and EHP on one feeder
The utilisation factor at the head of the feeder is calculated as the hourly maximum current divided by the cable rating of the main segment of the feeder. The results for the example feeder are presented in Figure 18. The initial utilization level of the feeder is around 40%. This value increases linearly with the penetration level for the EHP case. The maximum utilization level (100%) is reached in average at 70% of penetration level for the EHP case in the example feeder. In the PV case this is slightly different; the utilisation level decreases up to a 30%-40% PV penetration level, then starts to increase again.
3.8395 3.84 3.8405 3.841 3.8415 3.842 3.8425
x 105
3.9315
3.932
3.9325
3.933
3.9335
x 105
[m]
[m]
Substation 18
0 10 20 30 40 50 60 70 80 90 100 1100
10
20
30
40
50
60
PV Penetration [%]
Cus
tom
ers
[%]
0 10 20 30 40 50 60 70 80 90 100 1100
5
10
15
20
25
EHP Penetration [%]
Cus
tom
ers
[%]

Low voltage network solutions closedown report/June 2014 Page 35 of 75
Figure 18 - Example of feeder utilisation analysis for PV and EHP on one feeder
6 PROJECT OUTCOMES AND LEARNING
This section presents key points from the learning in this project. In relation to the modelling work conducted by the University of Manchester, the findings are presented in further detail in their deliverable reports in the appendices, as listed in Section 13.
6.1 Monitoring installation and data collection
NB. For ease of reading, both the methods for LV monitoring installation and the development / learning about those methods (a key outcome of this project) were presented in section 5 on ‘Methods’, rather than spread across both that section and this section on ‘Outcomes’.
Monitoring of the low voltage network was successfully deployed on 200 substations (28 pole mounted and 172 ground mounted) during 2012 and early 2013. This covered over 1000 feeders, consistent with the original estimate before the site-selection of around 1000. Half of the substations used GridKey monitoring equipment, the other half Nortech. For a substation with more than five ways and using GridKey equipment, two monitoring boxes were installed, so 146 units were installed to cover those 100 substations.
Despite great challenges in data collection, the monitoring collected nearly 10,000 days of valid detailed data up to January 2014. This represents a truly significant step forward in terms of data collection on LV distribution networks.
The monitoring data enabled:
• Detailed performance analysis of transformer utilisation, substation voltage, voltage unbalance and power factor for the monitored parts of the low voltage network (see section 6.2 and Appendix F),
• Validation of the models constructed by the University, for both this project and the First Tier project ‘Voltage Management at Low Voltage Busbars’ (see section 5.3.1 and Appendix B),
• Creation of ‘allocated’ load profiles which match the monitoring data, for use in further analysis of the monitored networks beyond this project (see section 5.3.2 and Appendix H),
0 10 20 30 40 50 60 70 80 90 100 1100
10
20
30
40
50
60
70
80
PV Penetration [%]
Util
izat
ion
Leve
l [%
]
0 10 20 30 40 50 60 70 80 90 100 1100
50
100
150
EHP Penetration [%]
Util
izat
ion
Leve
l [%
]

Low voltage network solutions closedown report/June 2014 Page 36 of 75
• Validation of Electricity North West’s Load Allocation method for half-hourly load estimates. At distribution transformer level his was shown to be better than using the diversified ELEXON load profiles. By extension this would also be true for Load Allocation’s estimates along HV feeders. However the review also highlighted areas for improvement and concerns with the accuracy of feeder-level load estimates (see section 6.3 and Appendix G).
• In combination with network data, identification of representative LV feeders for further analysis (see section 6.7 and Appendix J).
Monitoring data continues to be collected and made available to the business via Electricity North West’s iHost server.
Fault finding is continuing to address the small number of remaining units which are not reporting data reliably – generally due to SIM card registration problems. Having developed the company’s product and installation requirements, installation of LV monitoring has now transferred to business-as-usual, available to support other innovation projects and performance evaluation of selected networks with LCT clusters (primarily PV). Further work continues on embedding the lessons learnt on data collection in business as usual processes.
GridKey midpoint/ endpoint monitoring was deployed on 25 LV underground feeders (25 midpoints and 25 endpoints) under the scope of this project. These monitors now form part of a wider deployment on 100 feeders (100 midpoints and 100 endpoints) continuing beyond the First Tier project. As described in section 5.2.2.4 midpoint / endpoint data has not been reviewed in this project, but feeds into various follow-on projects as described in section 11.1.
6.2 Performance of monitored LV networks
As outlined in the project registration, DNOs traditionally have minimal visibility of the actual performance of their LV networks. Thus the scale of LV monitoring data collected in this project, particularly with its level of detail per phase and per feeder, is a truly significant advance.
The performance evaluation of the LV networks monitored within the project has been done considering 136 substations with the appropriate quality of available monitoring data from January 2013 to January 2014. Further detail on the performance evaluation is provided in the deliverable report in Appendix E.
The main characteristics of the networks assessed are:
• Most substations (65%) capacities vary between 500 and 800kVA.
• Most substations (75%) have between 100 and 500 customers. 42% of substations had domestic and small non-domestic customers (profile classes (PC) 1-4). 13% have only domestic (PC1).
• 61% of substations have PV systems varying between 0.2% and 49% penetration as a proportion of customers. 7% have more than 20% penetration of PV systems. The average installed capacity of PV is 3kW.
The performance analysis was split into two parts: busbar and feeder performance evaluation. Key parameters for the busbar performance included transformer usage, voltage, voltage unbalance and power factor, whilst for feeder performance included neutral current and current total harmonic distortion (THD). The main findings are summarised below.

Low voltage network solutions closedown report/June 2014 Page 37 of 75
Transformer loading
• Overall load factors (ie over the analysed period) of all the substations do not exceed 83.3%, and thus comply with Electricity North West policy.
• Most substations (83%) have overall load factors between 10% and 50%.
• 15% of the substations experienced reverse power flows at some point.
Busbar voltage performance (based on 10 minute sampling)
• Daily average busbar voltages for all substations vary between 237V (1.03pu) and 253V (1.10pu).
• Most substations (63%) have daily average busbar voltages between 241V (1.05pu) and 248V (1.08pu).
• 7% of the substations have busbar voltages consistently above 253V (1.1pu).
• In most substations (93%) the difference between the daily maximum and minimum busbar voltage was less than 11.5V (0.05pu), although this ranged between 5V (0.021pu) and 18V (0.078pu) considering all substations.
• Ignoring the lowest and highest 2.5% of voltage readings but considering all substations, the difference between daily maximum and minimum busbar voltage was between 3V (0.013pu) and 9V (0.04pu).
This provides valuable information about the average and range of busbar voltages which must be managed in any voltage control scheme.
Power Factor Performance
• More than half of the substations (54%) have a purely inductive power factor behaviour.
• More than a third of the substations (37%) have minimum power factor above 0.90 all the time and an average higher than 0.98.
• 29% of the substations have capacitive behaviour for less than 30 minutes during the day.
It is not considered that low power factor necessarily indicates a problem to be resolved. One potential explanation for low power factor at times of low load in areas of high PV penetration was that PV acting at unity power factor was reducing net active power demand from the network, without affecting the reactive component.
Feeder Neutral Currents
• The average neutral current per feeder (of 430) does not exceed 70A. The maximum, however, can be as high as 255A.
• Two thirds of the feeders have average neutral currents between 10A and 40A, and a maximum current of 174A.
• The ratio of maximum neutral current and rating capacity (cable at the head of the feeder) was found to be between 10% and 50% for most of the feeders (80%).
Low voltage network solutions closedown report/June 2014 Page 38 of 75
74 feeders with relatively high neutral currents (above 100A) are being reviewed further to determine whether action to rebalance load across phases would be worthwhile.
Feeder Current Total Harmonic Distortion (THD)
For each phase of each feeder, the monitors calculate the total power and the fundamental-only power, for both real and reactive components for the sampling interval. The difference between these is the harmonic power. The total harmonic distortion of power is interpreted as the (total-fundamental)/fundamental power. The THD values are expressed in percentage terms.
• The average THD per feeder varied between 2% and 98%. The maximum THD was 278%.
• Most feeders (65%) were found to have between 10% and 20% average THD.
• In general, the proportion of feeders without PV that have a low average THD (less than 10%), was much larger than the proportion with any PV penetration.
• Average THD increases significantly (above 20%) in feeders with PV, particularly for PV penetration levels above 30% of customers. This suggests future growth in PV connections could increase harmonics levels in the future.
Further investigation of specific networks
Based on the voltage evaluation, a small number of substations merit further investigation. In particular, nine substations had voltages consistently above 253V, four had very occasional low voltages below 216V, and potentially seven have occasional voltage unbalance factors exceeding 2%.
Further analysis of voltage excursions, voltage unbalance, and customer perception of such issues is being followed up in a separate new innovation project ‘Customer Voltage & Power Quality Limits’ which aims to review a combination of quantitative network data and qualitative customer data, including voltage complaint reports, to determine whether short duration or lower level excursions outside statutory limits cause any noticeable effects for customers.
The ‘Customer Voltage & Power Quality Limits’ project will also be further investigating harmonics. Within ‘LV Network Solutions’, the GridKey units indicated power THD and the Nortech units provided current THD. Current and power THD are only indicative of the underlying issue of the total harmonic distortion of voltage. The capability of the some of the monitoring installed in the ‘LV Network Solutions’ project will be extended to voltage THD for this further analysis. This extension is proposed by downloading additional firmware to the Nortech units, and it could in future be done with additional post-processing of data for the GridKey units (see Appendix 9).
Highlighting discrepancies between DNO records of PV and installed PV
The University used the monitoring data to validate their network models – highlighting and resolving issues with network topology for example. However in some cases this highlighted areas with additional PV that was not on Electricity North West’s records. Some installers of PV had not notified Electricity North West as required under Engineering Recommendation G83/1.
For example, for one of the network models which failed its validation test, a feeder was identified with limited reverse power flow, despite no record of generation being connected

Low voltage network solutions closedown report/June 2014 Page 39 of 75
on that feeder. After visiting the area, it was clear there were many more PV systems than notifications received from installers.
Electricity North West has raised this issue with Ofgem and provided details of this example in the context of the potential benefit of providing DNOs with access to details of generation registered for feed-in-tariffs. DNOs are currently only able to access the publicly-available data on feed-in tariffs. A comparison with public data on PV by local authority area shows that in some local authorities, there is much more PV notified to Ofgem than to the DNO, thus compromising the ability of DNOs to identify when voltage issues are likely to occur, since the public data has insufficient granularity for identification of potential network impacts.
6.3 Assessing load estimates for the whole network
The deliverable described in Appendix G assessed the accuracy of Electricity North West’s ‘Load Allocation’ tool. In order to do this, monitoring data at the busbar level and at the head of each feeder was compared with the corresponding results produced by the load allocation tool.
The Load Allocation has been developed by Electricity North West since 2011 under its innovation funding incentive (IFI) programme, and is now in transition to business as usual. The Load Allocation combines, scales and filters existing information (of varying quality, listed below) to produce for the first time half-hourly estimates of load on each HV feeder section, distribution transformer, and at the head of each LV feeder. The existing information used by the Load Allocation is
• the half-hourly load measurements at HV feeders as they exit each primary,
• the ratings and maximum demands of distribution transformers
• network connectivity in the network management system
• customer numbers/profile classes and their locations on the network,
• customer loads (half hourly and non half hourly).
The most important conclusions from the comparison of the Load Allocation with LV monitoring data were:
• Electricity North West’s Load Allocation is capable of producing a good approximation (7% error) of daily energy consumption when considering the aggregated customer load at a given LV substation. The monitoring validated the output of the Load Allocation algorithm at distribution transformer level as being better than using ELEXON profiles combined with customer numbers.
• In terms of apparent power (for a given LV substation), the tool results most of the time in much larger values (daily average of 18%) than those monitored. However, when considering the min and max monitoring values every 30 minutes, the tool’s apparent powers were, in average, no further than 2%.
• The main recommendation to improve its accuracy was that a power factor much closer to unity (eg 0.98) instead of 0.95 (inductive) should be adopted.
The results above were presented for the 5 LV networks and 29 feeders with exactly matching assumptions on customer numbers and types, out of 12 networks reviewed overall.
More generally, the review of Load Allocation against a sample of monitoring data highlighted the importance of accuracy in the input information on how customers are allocated to

Low voltage network solutions closedown report/June 2014 Page 40 of 75
specific network assets. Customer allocation was more carefully checked for the monitored networks than for the business-as-usual bulk process which serves Load Allocation and other systems.
Although the customer allocation was generally valid at distribution transformer level, it was often inadequate for accurate load estimates at the LV feeder level, compounded by the lack of diversity at LV feeder level. So similarly as for the challenges with LV network data mentioned before, DNOs face challenges adapting their existing information on what customers are served by what asset - which again has been fit for purpose up to now - into systems for further analysis.
However the issues highlighted by the review of the Load Allocation against the monitoring have in 2014 led to various improvements in the algorithm – including a review of the location of larger (HV) customers, and a change in treatment of certain transformers with spuriously low load and customer estimates. Remaining differences can be explained by factors such as lack of diversity when estimating loads from small numbers of customers, and systematic errors from omitting losses and ‘unmetered’ loads such as street lighting and traffic controls. Initial investigations showed it is difficult to implement ‘unmetered loads in the Load Allocation algorithm, but either implementation of this or a correction at the end of the process may be considered in future.
6.4 Electricity North West’s Future Capacity Headroom Model
For ease of reading, this section describes both methods and outcomes from this section of the work, rather than splitting this across sections 5 and 6, given that the main output was the development of the method.
In parallel to the very detailed monitoring, network modelling and analysis of specific networks by the University of Manchester, under the ‘LV Network Solutions’ project Electricity North West developed the Future Capacity Headroom (FCH) model to use existing network and load data plus scenario information to undertake a broader but less deep analysis of its entire LV and HV networks in a low-carbon future.
Electricity North West created the Future Capacity Headroom (FCH) model of its LV and HV network in early 2012. The foundation for this was the network connectivity and estimates of load from the ‘Load Allocation’ model described in the previous section (although prior to the validation and improvements described).
To create views of future load relative to capacity, the model builds on the estimate of peak load for each asset in the last year (from the Load Allocation). As its baseline, it used the loading for the network served by each primary for the peak day in normal operation, identified from Electricity North West’s Long Term Development Statement for that primary. Assessments of future load were then made for different scenarios of background demand growth and low-carbon-technology uptake at the end of each regulatory period in 2015, 2023 and 2031.
The FCH model structure is shown in Figure 19 overleaf. The design of the model was agreed before construction in a Functional Design Specification (see Appendix 7).
The FCH was used as Electricity North West’s sole secondary networks load forecasting scenario approach in 2012, before being used alongside the Smart Grid Forum’s Transform model in 2013. The Transform model was more detailed in its level of analysis, but its baseline was a tailored mix of generic networks, in contrast to FCH which started from a baseline of Electricity North West’s actual network connectivity and loading. Further comparison with Transform is provided in section 6.10.

Low voltage network solutions closedown report/June 2014 Page 41 of 75
Alongside Transform, the FCH was used successfully by Electricity North West in spring 2012 and 2013 for scenario analysis assessing the potential scale of load-related interventions in the RIIO-ED1 regulatory periods.
The background load growth assumptions were consistent with Electricity North West’s Grid and Primary load forecasting methodology, informed by analysis for the region by CEPA (Cambridge Economic Policy Associates), but applied with a more detailed domestic versus non-domestic split as appropriate for the particular local authority. High level information on the input from CEPA and Electricity North West’s demand forecasting approach has already been published as part of Electricity North West’s Well Justified Business Plan for the RIIO-ED1 regulatory period.
http://www.enwl.co.uk/about-us/well-justified-business-plan-2015-2023/WJBPhome

Low voltage network solutions closedown report/June 2014 Page 42 of 75
Figure 19 - Schematic of the Future Capacity Headroom model
The actual 2012 PV uptake (as notified to Electricity North West) formed part of the baseline in the FCH. Looking forward to 2015, 2023 and 2031, the model used the LCT uptake and profile assumptions from the Smart Grid Forum’s Transform model (see section 6.10). This was used alongside consultancy input from the Tyndall Centre for Climate Change at the University of Manchester on PV and Heat Pump uptake across the Electricity North West region, and modelling advice on how to cluster the technology and spread it between local authority areas. Advice from the Transport Research Laboratory provided similar guidance on relative uptake of electric vehicles by local authority across the region.
Scenarios are presented to the Future Capacity Headroom model in an agreed Excel format, with the summary and detailed outputs as text files. An Excel macro was developed to easily convert the summary text files into an Excel file formatted to be easily understood.
Calculation input buffer
Existing PV locations
Mapping of dist tx to local authorities
Customer growth
Scenario Inputs
Economic & Efficiency Effects
New technology uptake
Output summary results
Output individual results
Summary results
Detailed Results
Latest
2015 2023
Load Allocation Results
2031
FCH

Low voltage network solutions closedown report/June 2014 Page 43 of 75
For each type of secondary network asset (HV feeder sections, distribution transformers of various types and sizes, and LV feeders), the number of overloaded assets of each type was identified in each scenario and year by the FCH model. For each asset type, a maximum thermal loading threshold was identified. Voltage and harmonics thresholds were identified via proxy based on the kVA of LCTs relative to the asset rating, but this element of the model was never based on such detailed analysis.
The FCH remains a tool for Electricity North West to use for the future, and the baseline Load Allocation data has been improved in 2014 as a consequence of comparison with the monitoring data (as described in section 6.3). However that review also did not validate the accuracy of the Load Allocation below distribution transformer level, so the LV feeder element of the Future Capacity Headroom model’s output should not be relied upon until that issue is resolved.
Since summer 2013, further limited development of the Future Capacity Headroom model has been taken forward in a section of a separate innovation project on Demand Forecasting. Appendix 7 only reflects developments during the ‘LV Network Solutions’ project.
Given the uncertainty in exact location of future customer and LCT connections, the results for each individual asset were not expected to be meaningful in isolation, only in aggregate for an asset type. The subsequent outputs from the studies carried out by The University of Manchester (as detailed in the next section) provide greater insight into the value of detailed network, demand and LCT modelling with probabilistic analysis – this later work suggests both limitations to the Future Capacity Headroom Model and areas for improvement. See Table 2 in section 6.10 for a general comparison of the scope of the University’s detailed modelling with the approach in the Future Capacity Headroom model.
6.5 Characterising challenges on LV networks with LCTs
Appendix I describes how probabilistic impact assessment studies were carried out on 128 feeders considering the effects of residential photovoltaic panels (PV), electric heat pumps (EHP), electric vehicles (EV) and micro combined heat and power units (µCHP). Based on the studies, the following (general) conclusions can be made:
Differences in the type and frequency of problems with different LCTs
The percentage of feeders with voltage problems is higher in the PV case (about 62% of the feeders) and the percentage of feeders with thermal problems is higher in the EHP case (around 57% of the feeders). Figure 20 illustrates the percentage of feeders with more than 25 customers (90 feeders) with voltage and thermal problems for all the LCT analysed.

Low voltage network solutions closedown report/June 2014 Page 44 of 75
Figure 20 - Feeders with technical problems per technology (feeders with more than 25 customers)
In the PV case, the first occurrence of problems as penetration increases is driven by voltage issues in all the feeders examined. For the EHP and EV case, the first occurrence of problems is driven by voltage and also by thermal issues. Indeed, the 45% and 35% of the feeders have the first problem due to thermal issues in the EHP and EV case, respectively. This analysis is summarised in Figure 21 for all the LCT.
Figure 21 - Per technology, first technical issue amongst feeders with problems
Occurrence of Problems
Feeders with less than 25 customers do not present any problems among the feeders analysed.
The best individual metrics for the LCT analysed to explain the occurrence of problems in LV feeders are: the Initial Utilization Level and the Total Path Impedance. For illustration purposes, Figures 22 and 23 show the corresponding curves fitted for the PV and EHP cases. Each point in the graph represents the penetration level at which a feeder has its first voltage or thermal problem (defined as when either the average percentage of customers with voltage problems is greater than or equal to 1%, or when the average utilization level at the head of the feeder is higher than 100%).
PV EHP uCHP EV EV Fast EV Shifted0
10
20
30
40
50
60
70
[%]
% of Feeders with Voltage Problems% of Feeders with Thermal Problems
PV EHP uCHP EV EV Fast EV Shifted0
10
20
30
40
50
60
70
80
90
100
[%]
Voltage Problems before than Thermal ProblemsThermal Problems before Voltage Problems

Low voltage network solutions closedown report/June 2014 Page 45 of 75
Figure 22 - Initial utilization level (left), R2:0.65 and Total Path Impedance (right), R2:0.76 – PV Case
Figure 23 - Initial utilization level (left), R2:0.70 and Total Path Impedance (right), R2:0.78 – EHP Case
The combination of the Initial Utilization Level and the Total Path Impedance increases the coefficient of determination (correlation performance) for all the technologies. In fact, the multiplication of these two metrics produces a coefficient of determination equals to 0.78, 0.88 and 0.79 for the PV, EHP and EV cases, respectively.
Value of modelling networks with unbalanced phases
The utilisation of single-phase (balanced) network and load representations underestimates the impacts of LCT in LV networks. This can be clearly seen in the analysis produced for a test feeder where the percentage of customers with voltage problems, the daily energy losses and the utilization level of the head of the feeder are calculated for the balanced and unbalanced cases. The results are illustrated in Figures 24 and 25.
0 20 40 60 80 100 1200
10
20
30
40
50
60
70
80
90
100
110
Inital Utilization Level [%]
Pen
etra
tion
leve
l
datafitted curve
0 5 10 15 20 25 300
10
20
30
40
50
60
70
80
90
100
110
Total Equivalent Impedance [ohm]
Pen
etra
tion
leve
l
datafitted curve
0 20 40 60 80 100 1200
10
20
30
40
50
60
70
80
90
100
110
Inital Utilization Level [%]
Pen
etra
tion
leve
l
datafitted curve
0 5 10 15 20 25 300
10
20
30
40
50
60
70
80
90
100
110
Total Equivalent Impedance [ohm]
Pen
etra
tion
leve
l
datafitted curve
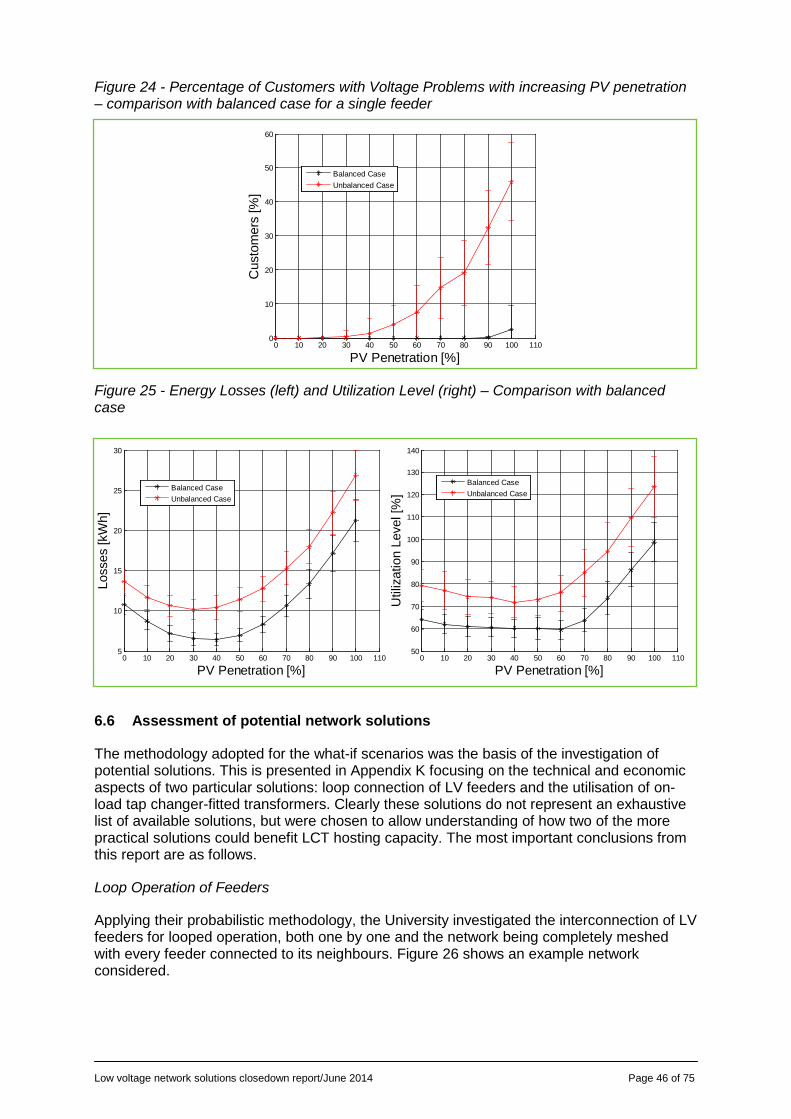
Low voltage network solutions closedown report/June 2014 Page 46 of 75
Figure 24 - Percentage of Customers with Voltage Problems with increasing PV penetration – comparison with balanced case for a single feeder
Figure 25 - Energy Losses (left) and Utilization Level (right) – Comparison with balanced case
6.6 Assessment of potential network solutions
The methodology adopted for the what-if scenarios was the basis of the investigation of potential solutions. This is presented in Appendix K focusing on the technical and economic aspects of two particular solutions: loop connection of LV feeders and the utilisation of on-load tap changer-fitted transformers. Clearly these solutions do not represent an exhaustive list of available solutions, but were chosen to allow understanding of how two of the more practical solutions could benefit LCT hosting capacity. The most important conclusions from this report are as follows.
Loop Operation of Feeders
Applying their probabilistic methodology, the University investigated the interconnection of LV feeders for looped operation, both one by one and the network being completely meshed with every feeder connected to its neighbours. Figure 26 shows an example network considered.
0 10 20 30 40 50 60 70 80 90 100 1100
10
20
30
40
50
60
PV Penetration [%]
Cus
tom
ers
[%]
Balanced CaseUnbalanced Case
0 10 20 30 40 50 60 70 80 90 100 1105
10
15
20
25
30
PV Penetration [%]
Loss
es [k
Wh]
Balanced CaseUnbalanced Case
0 10 20 30 40 50 60 70 80 90 100 11050
60
70
80
90
100
110
120
130
140
PV Penetration [%]
Util
izat
ion
Leve
l [%
]
Balanced CaseUnbalanced Case

Low voltage network solutions closedown report/June 2014 Page 47 of 75
Figure 26 – Example of feasible points for loop connection of sample network
This approach improves the utilisation of the network and its ability to host larger volumes of PV generation. Most of the problems are deferred to higher penetration levels; for the examined networks, the occurrence of the first problems are moved from 40% of PV penetration level in the radial cases to 70% in the meshed operation (all feeders). Also, the results indicate that connecting different feeders lead to different degrees of benefits given their particular characteristics. Other consequences of interconnection such as on fault level or fault likelihood have not been assessed in this study.
Fitting a transformer with an On Load Tap Changer (OLTC)
The use of this device can improve the hosting capacity of the network when penetrations are ‘even’ among the feeders. For the studied network, voltage problems were deferred from 40% of PV penetration level without OLTC to 60% in the case with OLTC and busbar control. This figure increased to 80% in the case with remote control (furthest point in the network). This means it is possible to make staged investments (local control then remote control) in networks with progressive PV penetration. For the EV case, all the voltage problems were solved with the OLTC (local control) in the network analysed.
Comparison with Traditional Reinforcement Costs
Considering the current cost of deploying devices for loop operation and OLTC-fitted transformers, the traditional cable-based reinforcement remains a cost -effective option to tackle medium penetration levels of LCT (up to 50%). Nonetheless, it is likely that the cost of the alternatives examined (nowadays in trial stage) will be reduced in the future and therefore they might become more attractive for wide-scale implementation. It should also be noted that there are other potential benefits associated with the adoption of these solutions which were excluded from this analysis. These include voltage optimisation, which Electricity North West is investigating as part of its Low Carbon Networks Fund Second Tier ‘Smart Street’ project.
6.7 Characterising LV network feeders for further analysis
The University of Manchester developed and presented a procedure to identify statistically representative LV feeders, ultimately providing a unique set of thoroughly validated representative feeders which can be used in future with the what-if scenario analysis approach as test (representative) cases for analysing the impact of Low Carbon Technologies (LCT) and LV network solutions. Further details are provided in Appendix J.

Low voltage network solutions closedown report/June 2014 Page 48 of 75
Their literature review demonstrated that such a clustering analysis using with this mathematical approach had never before been applied to LV feeders.
A set of 383 feeders with network data and the correspondent monitored data was analysed. After a filtering process (i.e., noise and outliers) this initial number of feeders was reduced to 232 obtaining the definitive data base for a clustering process. A macro partition of the 232 feeders is presented dividing them in terms of the presence of Distributed Generation (DG). Two groups, a first one of 156 feeders with-out DG penetration and a second one of 76 feeders with DG penetration, were clustered separately and results analysed. A final set of 11 clusters (families) and their representative feeders was obtained.
The set of representative feeders is summarised in Table 1, showing some of the main properties qualitatively compared, alongside the distribution of representative feeders in the sample of LV network assessed.
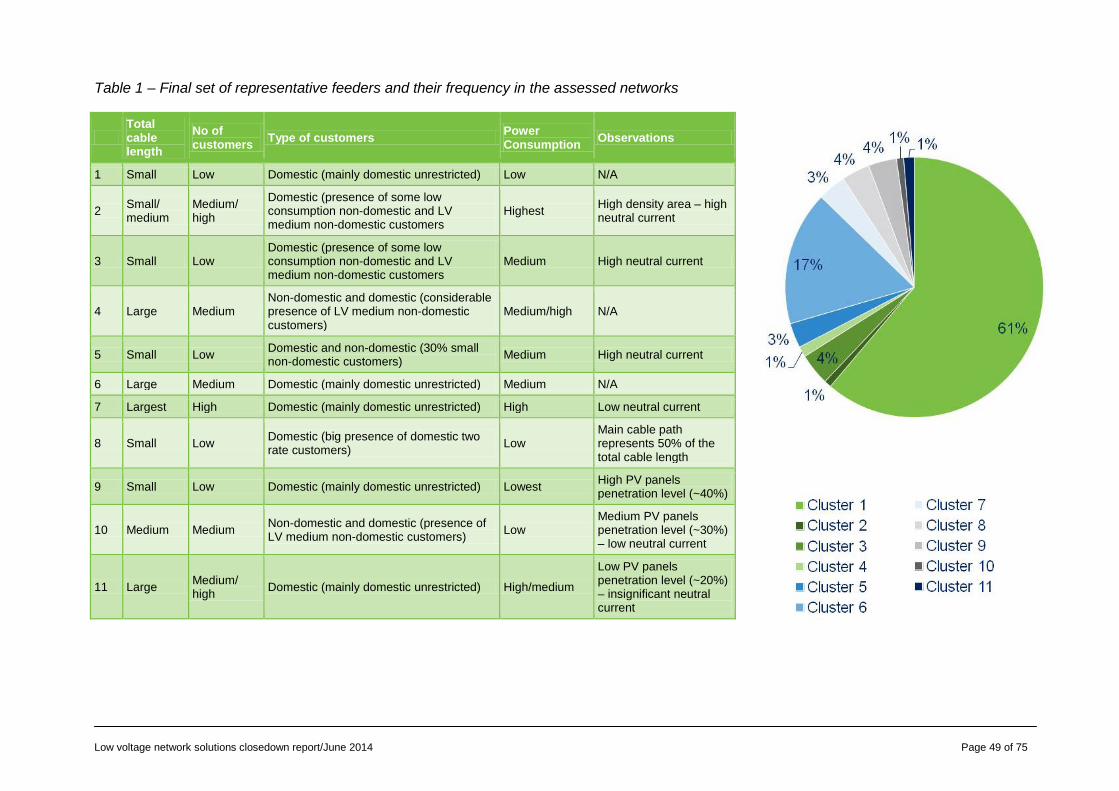
Low voltage network solutions closedown report/June 2014 Page 49 of 75
Table 1 – Final set of representative feeders and their frequency in the assessed networks
Total cable length
No of customers Type of customers Power
Consumption Observations
1 Small Low Domestic (mainly domestic unrestricted) Low N/A
2 Small/ medium
Medium/ high
Domestic (presence of some low consumption non-domestic and LV medium non-domestic customers
Highest High density area – high neutral current
3 Small Low Domestic (presence of some low consumption non-domestic and LV medium non-domestic customers
Medium High neutral current
4 Large Medium Non-domestic and domestic (considerable presence of LV medium non-domestic customers)
Medium/high N/A
5 Small Low Domestic and non-domestic (30% small non-domestic customers) Medium High neutral current
6 Large Medium Domestic (mainly domestic unrestricted) Medium N/A
7 Largest High Domestic (mainly domestic unrestricted) High Low neutral current
8 Small Low Domestic (big presence of domestic two rate customers) Low
Main cable path represents 50% of the total cable length
9 Small Low Domestic (mainly domestic unrestricted) Lowest High PV panels penetration level (~40%)
10 Medium Medium Non-domestic and domestic (presence of LV medium non-domestic customers) Low
Medium PV panels penetration level (~30%) – low neutral current
11 Large Medium/ high Domestic (mainly domestic unrestricted) High/medium
Low PV panels penetration level (~20%) – insignificant neutral current

Low voltage network solutions closedown report/June 2014 Page 50 of 75
Although the above representative feeders were identified from only 232 feeders, the opportunities in terms of understanding Electricity North West’s LV Networks and analysing the impacts of different technologies are really promising. The methodology shows that the whole population of LV feeders can be divided in a small set of representative feeders that can relate their characteristics and behaviours to all the feeders belonging to their same family. This reduces considerably the complexity of assessing the impacts of LCT on all LV networks.
6.8 Recommendations on deployment of LV monitoring
The deliverable report in Appendix L presents recommendations on the deployment of monitoring devices on the LV network, based on previous deliverables. In the context of monitoring to identify network issues caused by LCT, the main recommendations are:
Parameters to monitor
Both line-to-neutral voltages and phase currents (or active and reactive power) at the head of the feeders should be monitored. Voltages are of particular importance for photovoltaic systems given that most LV networks are likely to experience voltage issues rather than congestion. For electric vehicles and electric heat pumps, phase currents also need to be monitored as many feeders are likely to experience congestion before voltage issues.
Sampling intervals
For performance evaluation of the network, the mean value of 10 minute sampling intervals (or close to this, eg 15 minutes) should be adopted to avoid underestimating, in particular, voltage impacts. There is no significant benefit in adopting shorter sampling intervals (eg 1 or 5 minutes). For the monitoring of currents (or active and reactive power), hourly values are adequate.
The utilisation of low resolution data (eg, 15 min, 30 min and 60 min) for loads and generation profiles underestimates the impacts of LCT in LV networks, particularly voltage performance against BSEN50160 as this involves a ten-minute sampling timeframe. To illustrate this, the daily energy losses and the percentage of customers with voltage problems from the impact assessment methodology are presented in Figure 27 at various intervals.
If an operational solution with control is later adopted eg LV OLTC-fitted transformer, use of capacitor banks, dynamic meshing etc, sampling intervals can be adapted accordingly and could sometimes be longer. For example in the case of Electricity North West’s First Tier project on ‘Low Voltage Integrated Automation’ (LoVIA) including voltage control with capacitors, sampling intervals can be longer than 10 minutes (eg 30 minutes). In the case of closed loop control, the constraint on sampling is no longer an issue as the sampled data is not expected to be transmitted back to the central server and the local monitors can sample at much higher rates.

Low voltage network solutions closedown report/June 2014 Page 51 of 75
Figure 27 – Example of daily energy losses and voltage problems at different PV penetration levels, calculated for a test feeder at various time intervals
Locations to monitor
For voltage purposes, the end points of the corresponding feeders should be monitored given that the busbar would only work as a proxy if some knowledge of the feeders exists. Mid points do not necessarily bring more critical information although they increase certainty and observability. However, for congestion purposes, currents at the head of the feeders should be monitored.
When to monitor
Section 6.5 described how the University tested a range of feeder metrics for how well they would indicate the LCT penetration level that could potentially result in voltage or congestion issues. These metrics were based on known characteristics of a feeder. The best performing metric found was a combination of total path impedance and the initial utilisation level of the feeder.
The deliverable report in Appendix L recommends that such correlation metrics (or similar) should be adopted to find the most suitable penetration level of a given LCT for a feeder or LV network for which monitoring is required.
However a calculation of total path impedance would effectively involve the same (significant) effort as building a network model. An alternative easier to implement metric in terms of access to input data (the ‘DNO-friendly’ metric) would be a combination of feeder length and number of customers. Feeder length is interpreted as the combination of main and services. The corresponding results for the occurrence of first problems (voltage or thermal) with PV penetration for this metric are shown in Figure 28.
0 10 20 30 40 50 60 70 80 90 100 1105
10
15
20
25
30
PV Penetration [%]
Loss
es [k
Wh]
1 min5 min10 min15 min30 min60 min
0 10 20 30 40 50 60 70 80 90 100 1100
10
20
30
40
50
60
PV Penetration [%]
Cus
tom
ers
[%]
1 min5 min10 min15 min30 min60 min

Low voltage network solutions closedown report/June 2014 Page 52 of 75
Figure 28 – Customer Number and Feeder Length for the PV Case, R2:0.61.
For a given feeder and LCT type being considered by a DNO, the engineer could estimate the feeder length and customer numbers, multiply these together, and Figure 28 (for PV or the alternative graph for a different technology) would suggest the LCT penetration level at which a network issue would be expected to first occur, and therefore monitoring could be useful. Application of such a metric should identify whether certain feeders are likely to be able to accept significant PV without presenting voltage or thermal issues.
It is also important to highlight that the multi-feeder analysis underlying these correlation graphs was based on detailed network models and Monte Carlo analysis of 128 underground feeders with a range of lengths, loads and customer numbers. So the results are indicative of the voltage and thermal issues which would arise on Electricity North West’s underground feeders, but are not necessarily statistically representative of the underground networks. In addition, it is not possible to state that they are representative of the overhead networks.
Electricity North West’s Strategic Planning section is currently working through the practicalities of implementing and interpreting the correlation metrics.
As an example of that further work, Electricity North West is exploring whether and how planners could easily extract the data required for the ‘DNO friendly metric’ of the hosting capacity of a given feeder for LCTs, and limitations on applicability. It might be possible with further work to translate Electricity North West’s feeders and substations into representative types, and then provide a look-up table to the hosting capacity for those.
One issue to consider is that the correlations shown by the red lines in Figures 22, 23 and 28 are not perfect indicators of network issues - there are points above and below the correlation line. Indeed the ‘DNO friendly metric’ shows a poorer correlation than the combination of utilisation and total path impedance. Thus if a greater level of precaution were desired when implementing monitoring to identify network impacts from LCTs, the line determining when monitoring begins would need to be shifted in the direction shown by the arrow.
Other aspects
The monitoring devices to be deployed, particularly at the substation, should ideally also monitor total harmonic distortions of voltage and neutral currents, given that high penetrations of LCT are likely to exacerbate these issues.
It should be recognised that directly monitoring the network to identify LCT impacts is likely in time to be superseded by the availability of smart meter data from customers. As the smart

Low voltage network solutions closedown report/June 2014 Page 53 of 75
meter roll out progresses, DNOs will have access to data which is likely to address many of the requirements detailed above – directly in terms of identification of voltage and power quality issues at the customer, and indirectly in terms of utilisation and congestion.
Electricity North West’s Smart Metering strategy was informed at a high level by the LV data challenges encountered by the ‘LV Network Solutions’ project. The strategy estimated that the benefits of smart meters to allow visibility of congested networks could be realised – with appropriate systems - once meters reach approximately 70% penetration ie the latter half of 2019. Thus the monitoring recommendations from this project are expected to be valid for at least the next five years - longer if suppliers’ smart meter rollout is delayed - but would not reflect the ongoing requirements for DNOs more generally.
6.9 Comparison with WPD’s ‘LV Network Templates’ project
Despite some similarities between ‘LV Network Solutions’ and WPD’s completed Second Tier Low Carbon Networks Fund project ‘LV Network Templates’ 2011-2013, the scope and objectives although aligned, are not the same.
The WPD project characterised LV networks by measuring different parameters at 824 substations. The ‘LV Network Solutions’ project (coming slightly later) had the advantage of deploying an LV monitoring solution without customer interruptions, but can validate the choice of a 10 minute sampling timeframe for monitoring.
‘LV Network Templates’ was primarily aimed at characterising LV networks by measuring different parameters at the corresponding substations. By comparing similar networks (eg having mostly domestic customers) with and without actual low carbon technologies (specifically PV and EHP), the corresponding effects were inferred. No network models were used and most of the impact analysis was focused on the effects of LCT on the transformer capacity.
In terms of monitoring, both projects are similar in that they considered key parameters such as phase voltages, phase currents, and active/reactive power at the substation. They also considered phase voltages at the end of the feeders. In addition, ten minute intervals were adopted in both cases. On the other hand, the WPD project monitored the generation of individual PV systems and the aggregated effects of EHP – which was not done by the ‘LV Network Solutions’ project.
Significant differences exist in terms of network data and the production of LCT profiles. The ‘LV Network Solutions’ project modelled its LV networks in detail using demand and LCT profiles with 5- or 10-minute intervals. This allowed quantifying the LCT impacts on feeder congestion and voltages along the feeders. The WPD project adopted PV and EHP profiles directly or indirectly based on measurements. The LCT profiles from the ‘LV Network Solutions’ project, although realistic, were produced from data available from trials or whether stations.
As mentioned previously the objectives and methodology were different. Although the WPD project determined the effects from PV and EHP by comparing the corresponding network with similar ones without these technologies, the general conclusions of the impact assessment for each of the templates was done qualitatively. In addition, due to the substation level nature of the WPD project, the impact assessment is essentially related to the usage of the LV transformer. Voltages were not considered given that this would require network models. The detailed models adopted by the ‘LV Network Solutions’ project, on the other hand, allowed production of a quantitative assessment of the impacts per LCT. In addition, the Monte Carlo approach allowed presenting the likelihood of potential impacts rather than ‘definite’ numbers.

Low voltage network solutions closedown report/June 2014 Page 54 of 75
In terms of the findings related to LCT impacts, both projects are aligned in that transformer capacities of (predominantly) domestic LV networks are in general suitable for high penetrations of PV but not for EHP. However, the WPD project suggests that overnight EV charging would not affect (mainly domestic) LV transformers. This is contrary to the findings of the ‘LV Network Solutions’ project. In addition, the latter captured many potential voltage and congestion issues at a feeder level that within the WPD project it was not possible to quantify.
WPD’s project also monitored voltage at more than 3600 remote feeder ends, including at customer premises, and found nearly all readings within statutory limits, stating that this ‘suggests opportunity for voltage reduction’. With its focus on substation monitoring, ‘LV Network Solutions’ was not able to make the same type of voltage assessment, since busbar voltages can only be considered as a proxy of potential issues to nearby or remote customers; but these monitoring findings are also consistent with most voltages being within statutory limits. However the modelling work suggests any voltage reduction has to be considered carefully, given that lowering voltages at the busbar to increase PV penetrations and reduce energy consumption, might affect the ability of LV networks to host wide spread installations of EHP or EV. Further research is needed to find the optimal busbar voltages for different types of LV networks that allow them to cope – to some extent – with both voltage rise from PV but also voltage drops from EHP or EV which may occur at different times.
Using their monitored data, WPD created an LV Network Templates tool to estimate any substation’s load, based on customer mix by profile class and typical ELEXON load profiles. Since Electricity North West already uses this information and other data on network connectivity and HV feeder loading in its ‘Load Allocation’ method to estimate substation loads, validated by the ‘LV Network Solutions’ project against monitoring data, no further assessment has been made of the value or applicability of WPD’s LV Network Templates tool for estimating substation loads on the Electricity North West network.
6.10 Comparison with Smart Grid Forum’s analysis in WS3 Transform
In terms of assessing LCT impacts on the LV networks, a relevant industry comparison familiar to DNOs will be with the Transform model. Transform is a C# model with an Excel front-end. It is an,
‘engineering and economic model used to examine the likely mix of traditional and smart solutions necessary to meet the growth in use of distribution networks that will result from decarbonisation’
(Smart Grid Forum’s Annual Report 2014).
Table 2 provides a high-level comparison of the Transform approach and the detailed modelling analysis in the ‘LV Network Solutions’ project, as described further in the rest of this section. The table also provides a comparison with the Future Capacity Headroom model described in section 6.4.
The Transform model was developed in spring 2012 as the output of Work Stream 3 of the Smart Grid Forum (DECC, Ofgem and DNOs). Reports describing Transform are available on the Ofgem website and have been used as the reference for this comparison, alongside discussions with EA Technology. Transform is maintained by EA Technology under a governance process to provide ongoing changes and updates to assumptions eg about network solutions and LCT profiles.
Transform showed that using ‘smart’ solutions in future scenarios reduces electricity distribution costs, but did not make a deep analysis of network operation. The ‘LV Network Solutions’ project has done a very detailed analysis of underground LV networks with LCTs and for a small selection of solutions, but has not attempted to address the same questions
Low voltage network solutions closedown report/June 2014 Page 55 of 75
as Transform in relation to the desired mix and cost of solutions over time. Transform considers a much wider number of network solutions than were assessed in this project, and also the merit order for when each solution would be appropriate.
Transform is much broader in network scope and scale than the ‘LV Network Solutions’ analysis, developing an appropriate mix of generic LV, HV and EHV networks and their loads, across GB and for each individual DNO. DECC’s four future scenarios of LCT uptake and other effects on electricity demand are then applied. LCT profile assumptions were developed for Transform, and technology clustering reflects that found for PV under the feed-in tariffs. In terms of LCT profiles, the PV, EHP, EV and µCHP profiles produced throughout the ‘LV Network Solutions’ project, although not validated from monitoring in this project, are believed to be more realistic and use more recently available inputs than the profiles used in Transform. These LCT profiles could be used to inform future updates to Transform.
In 2012 from DNO industry expertise and reviewing high-level DNO network data, 19 LV feeder types were identified for Great Britain for Transform, occurring at varying frequencies. These feeder types were combined with load and building data, and used to provide baseline loading levels. Of these 8 were (mostly) underground radial feeder types. This is in comparison to the 11 LV feeder types in ‘LV Network Solutions’ analysis of representative underground (radial) feeders by a mathematical clustering method, and suggests that Transform has broadly the right number of underground LV feeders in its model. Further work would be required to validate this.
From the combination of the feeder and LCT assumptions, problems are identified by Transform when after application of LCT there is a breach of a specified type of ‘headroom’. Headroom is identified in relation to thermal constraints on different assets (eg transformers and cables), voltage headroom and legroom, and fault level. The modelling analysis in ‘LV Network Solutions’ considered all of these issues except fault level. Neither project modelled power quality or harmonics issues. The ‘headroom’ levels for each network type were based on advice from DNOs rather than from detailed network modelling.
The Transform scenario modelling identifies the problems (and then the appropriate network solutions and their costs) for the four scenarios. In comparison the modelling approach taken in ‘LV Network Solutions’ asks fundamentally different questions - at what LCT uptake level on a feeder would a problem occur based on detailed modelling, and applying the detailed analysis method, how would selected example solutions perform?
By applying a single load and LCT profile in each season, Transform assumed a certain level of diversity in profile shape, and will not fully reflect the uncertainty in loads, and in the size and location of LCT connections along an LV feeder. To a certain extent, Transform compensated for this by considering clustering of LCTs (the lack of diversity in location); the University of Manchester modelling addressed these uncertainties via the Monte Carlo analysis for a variety of LCT penetration levels.
Transform’s LCT diversity assumption is likely to lead it to understate the scale of impacts on LV networks from future LCT. The diversity assumption becomes progressively less valid for LV feeders with fewer customer numbers, but becomes increasingly more appropriate at the distribution transformer and up the network levels. The importance of diversity and customer numbers was shown in the ‘LV Network Solutions’ project in two ways – the challenges of validating network topology against monitoring data for feeders with less than 30 customers, and the finding that the CREST load data was valid in comparison to monitoring data with feeders with at least 50 customers.
The Monte Carlo probabilistic method could be used to quantify the effect of Transform’s implied LCT diversity assumptions for LV networks. Further analysis would be required to do this. Since Transform and the LV Networks Solutions work have used different LCT profile shapes, the outputs are not directly comparable at this stage. Given that the what-if analysis

Low voltage network solutions closedown report/June 2014 Page 56 of 75
in this project did not identify thermal or voltage issues on feeders with less than 25 customers (the situation with the greatest lack of diversity), the overall underestimate of the scale of impacts due to the profiles may not be large.
Further analysis is required to quantify the effect of modelling detailed network impacts rather than using DNO-advised headroom levels per network type. This is already being addressed in the Smart Grid Forum’s forthcoming Work Stream 7. Together with the University of Manchester, Electricity North West will offer to engage at an early stage with the consultants to be appointed to deliver this work stream, which progresses from the analysis in Transform. Work Stream 7 will focus on the operation of the 2030 distribution network, specifically ‘how such networks will operate in practice, modelling in detail how system components will interact.... (and) interactions with both the transmission system and smart electrical appliances’ (quoted from the Smart Grid Forum annual report 2014). The learning from ‘LV Network Solutions’ on the value of 10-minute time series analysis, four-wire unbalanced representations and probabilistic assessment is likely to be relevant to this new project.

Low voltage network solutions closedown report/June 2014 Page 57 of 75
Table 2 – High-level comparison of Transform and ‘LV Network Solutions’
Transform WS3 (2012 and ongoing updates)
LV Network Solutions (detailed University modelling 2013/14)
LV Network Solutions (Future Capacity Headroom model 2012/13)
Networks in scope LV, HV, EHV and Transmission (but from LV perspective) LV feeder and distribution transformer LV feeders, distribution tx, and HV feeders up to
primary busbar
Scale 2 models – GB and DNO licence areas. Annually to 2050
25 of Electricity North West’s underground networks
Electricity North West network Latest, 2014/15, 2022/23 and 2030/31
LV feeder types and baseline load
19 LV feeder types identified (of which 8 were radial underground) Mix of feeder types present per DNO advised by DNO
11 (radial) underground LV feeder types, but identified separately from the analysis of LCT impacts. Baseline loads from CREST data
Actual network ratings, customers and connectivity on primary’s peak days in normal operation from Electricity North West’s ‘Load Allocation’. Review of Load Allocation reduces confidence in LV feeder results.
Solutions Latest full set of traditional and smart solutions and the latest view of costs
Considers only OLTC, meshing and incremental reinforcement as examples
Not considered – traditional and smart solutions considered outside model
Network issues considered
Thermal, voltage, fault level Each based on DNO-advised headroom levels for each network type
Thermal, voltage Time-series four-wire modelling in OpenDSS with Monte Carlo against utilisation or BSEN50160 thresholds
Primarily Thermal, based on allowable load v rating threshold % for asset Voltage and Harmonics considered indirectly, based on assumed LCT kW versus asset kVA. Voltage analysis now superseded by detailed modelling.
LCT uptake Based on four regionalised DECC scenarios combining LCT and background demand growth
Considers penetration levels by customer numbers of 0-100% at 10% intervals
LCT chosen to match Transform for whole network (PV, EV, HP only), but spread tailored to domestic/ non-domestic and local authority, plus underlying growth per local authority.
Mix of LCT? Yes No, considered in isolation Yes
LCT profiles Single profile for each LCT type, with implicit diversity assumption
Set of profiles informed by published measured data - range of profiles addressed by Monte Carlo
Chosen to match Transform (PV, EV, HP only)
LCT locations Based on clustering assumption at specific uptake levels
Range of locations addressed by Monte Carlo
Based on clustering assumption at specific uptake levels (not identical to Transform clustering as on real not generic network)
Computation time < 1 hour per scenario for GB model 40 hours per technology < 1 hour per scenario

Low voltage network solutions closedown report/June 2014 Page 58 of 75
6.11 Impact on Technology Readiness Levels
In the project registration, based on the LV monitoring deployment, it was considered that this project would be at TRL 7 ‘full-scale technology demonstration in working environment’.
In hindsight given the difficulties in monitoring deployment and data collection, the LV monitoring deployment was actually at TRL 6 ‘technology model or prototype demonstration in a working environment’, moving towards TRL 7 by the end of the project. For example, there was development work undertaken with GridKey and Nortech and on registration of devices to the iHost server, development by Electricity North West of the installation approaches including specifying appropriate mountings and the Smart joint for midpoint voltage and current measurements, and the required upgrades to the iHost system for monitoring data collection. The University’s recommendations on when and how to monitor in future in areas of higher LCT uptake demonstrate how this work transfers to the working environment.
However the ‘LV Network Solutions’ project has always been about much more than how to monitor at LV.
The project was also about modelling real networks, understanding when to monitor, evaluating the current network performance and looking forward in the context of future LCT adoption. This significant work reached TRL 5 ‘Technology / part of technology validation in working environment’. For example, the University created a Monte Carlo modelling approach to reflect uncertainty in LCT scale and location when using network and profile data to estimate the hosting capacity of LV networks for LCTs and to assess LV network solutions on those networks. This methodology and its outcomes are ground-breaking in terms of academic research of LV networks, and their potential for affecting practice in DNOs. As section 11 will describe in further detail, Electricity North West is now considering which techniques or outcomes from the modelling are appropriate to transfer to the DNO planning or policy environment.
There have also been two developments in the technology readiness levels of Electricity North West’s systems for load estimates.
• Suggesting improvements to the Load Allocation estimates of load on the secondary network. This enabled TRL 8 ‘Technology completed and ready for deployment through test and demonstration’ (implemented via another project at Electricity North West).
• Creation of Electricity North West’s Future Capacity Headroom Model for future estimates of load on the secondary network. This reached TRL 7 ‘full-scale technology demonstration in working environment’. The next stage of development would be to review the model specification and inputs against the university’s analysis in this project.
7 PERFORMANCE COMPARED TO AIMS AND SUCCESS CRITERIA
Section 3 restated the Scope from the original project registration. The first two criteria below address the two aspects of the first sentence of the Scope. Section 4 restated the six Success Criteria from the original project registration. These are the final six criteria discussed below:
Deploy measurement instrumentation (including development of installation procedures and data collection);

Low voltage network solutions closedown report/June 2014 Page 59 of 75
This aspect of the scope was fully met – as described in section 5.2 and 6.1 – and in additional included the development of the GridKey and Nortech monitoring products, associated installation procedures, and setting up the data collection via GPRS to iHost.
Provide Electricity North West with greater understanding of the existing operating characteristics and demands of its LV networks;
This aspect of the scope was fully met – as described by the performance evaluation of the monitored networks in section 6.2, the constructive review of ‘Load Allocation’s half-hourly load estimates across the whole network against the monitored data in section 6.3 and the recommendations on the type of future monitoring in section 6.5.
Identification of a statistically meaningful sample of representative networks;
The Scope in the original registration suggested at the beginning of the project ‘a statistically meaningful sample of representative LV network feeders from the total population of feeders’ would be identified. In consultation with the University of Manchester and subsequently, it was clear that there was insufficient network and customer data at feeder level to do statistical tests to show this relative to the total population of feeders on the network, at any point in the project.
So by agreement with the University, a criteria-based approach was taken to selection of substations for inclusion in the project (and by extension including all feeders on those substations). The initial selection done by PB Power was representative, but not in a way which can be shown to be statistically meaningful.
Furthermore the analysis in the project was itself required to determine what would be the relevant criteria for characterising the representative differences between substations or between feeders. This analysis has been done in the deliverable reports shown in Appendices I and J – respectively showing the key characteristics affecting the level of LCT penetration which a substation or feeder can accept without problems, and a statistical analysis to determine representative feeders from those networks with high-quality monitoring data (rather than all feeders). Electricity North West will be discussing with the University how to use this characterisation of representative networks further.
Establishing a database of network demand and voltage as time series data across the selected networks, including full network connectivity with MPANs;
This objective was fully met. For the monitored networks, Electricity North West’s iHost server provides a database of network demand and voltage. For the period up to the end of January 2014, this data was exported to the University of Manchester where they combined this information with the GIS data on network connectivity including MPAN locations.
As described in section 5.3, OpenDSS models were produced of the studied LV feeders and networks. A database was created for the corresponding time-series models demand and LCT data (mean values of 5 minute sampling intervals). In addition to this, another database was created that contains the monitoring data (eg phase voltages, phase currents, etc) from the studied LV networks (busbars and some mid/end points of feeders). This monitoring data was also used to produce a more realistic set of time-series models of demand which will be used for future analyses (the allocated load profiles).
Construction of an LV/HV capacity model utilising newly obtained data and other existing data;
This objective was fully met as described in section 6.8 on the Future Capacity Headroom model.

Low voltage network solutions closedown report/June 2014 Page 60 of 75
Establishing minimum LV instrumentation requirements needed to support future network operation, the preferred technology types and their installation methods;
This objective was met by the equipment specifications in Appendices 1 and 3-5, and the University’s recommendations as described in section 6.5 and Appendix L.
Developing options for future operating practice and control, to help address future network requirements and assess the effectiveness of alternative technologies;
The focus of this project has been on characterising when network problems might occur with future LCT uptake and on the development of monitoring solutions. These aspects have been described in sections 6.4 and 6.5. However the objective on developing and assessing options for future operating practice and control was directly addressed in section 6.4.1 in relation to on-load tap changers and network meshing versus traditional cable-based reinforcement. Nonetheless, the assessment of these solutions is not meant to imply that these are the only solutions or that the analysis in this project is exhaustive. Indeed technical and commercial options are under continual development, and it is likely that the cost of the alternatives examined (nowadays in trial stage) will be reduced in the future and therefore they might become more attractive for wide-scale implementation.
However this project’s most significant contributions to network solutions are probably in the groundwork it has provided to the development of solutions and learning as detailed in section 11 on planned implementation – both in many related projects and in Electricity North West’s reviews of monitoring and LV planning policy.
Validate results of other LCNF projects such as the WPD Tier 2 Low Voltage Template project
The most significant validation of results carried out by The University of Manchester was done against those from the Second Tier Project ‘Low Voltage Templates’ run by Western Power Distribution (WPD). This validation and comparison was described in section 6.6.
Electricity North West also undertook a comparison of the network assessment with LCT uptake in the Transform model created under Work Stream 3 of the Smart Grid Forum. This validation and comparison was described in section 6.7.
It is important to highlight that no other LCNF projects that were to some extent aligned with the objectives of the ‘LV Network Solutions’ project were found to have enough results and/or reports to produce any meaningful comparison. This also reflects the significant challenge of monitoring and modelling LV networks.
8 REQUIRED MODIFICATIONS
The only significant change in Method was in the selection of networks to be monitored / identification of representative networks. As described in sections 5.1, 6.7 and 7, the approach adopted was an initial criteria-based selection, followed by a statistical analysis towards the end of the project to identify representative feeders from those monitored, once relevant data was available to allow this to be done.
The project met its high-level objective of installing monitoring at 200 substations/ transformers and their associated feeders at the substation. However following the price information obtained in the equipment tenders, the overall scope and scale of other secondary aspects of the monitoring (midpoint/endpoints/power quality) were adjusted as follows.
Low voltage network solutions closedown report/June 2014 Page 61 of 75
• The registration only stated the project would record voltage along the feeders, but prompted by the University’s suggestion of the value of current measurements for their modelling, significant effort was put into developing the Smart Joint technique to allow measurement of both voltage and current along a feeder.
• Due to budget restrictions, only 25 feeders were monitored with midpoints and endpoints in this project, a relatively small sample and late in the project. Having developed the techniques, a separately funded project is adding monitoring along another 75 feeders. Midpoint/endpoint data is also being used in a number of subsequent innovation projects. For all these reasons, midpoint / endpoint data has not been used and reported in this project. .
• The registration said harmonics would be monitored at selected locations, but did not specify the type of monitoring. In 2011/12 the tender responses showed that current or power THD (total harmonic distortion) was available from the monitors, but that full power quality analysis including assessment of voltage THD against BSEN50160 would have been very expensive to include, incurring significant additional cost and compromising timely delivery. So for this project, monitors were chosen which enabled a wider but less detailed analysis. Monitors were chosen that could give indicative values of current or power THD at all locations, as a basis for further work later in the ‘Customer Voltage and Power Quality’ project described in sections 6.2 and 11.1. This has been a wise decision, as the additional cost of subsequently adding voltage THD is lower.
The University of Manchester successfully overcame two significant unforeseen challenges in developing their ground-breaking assessment methodologies – Firstly they developed a method to ‘reconnect’ network segments which were separated by miniscule gaps in the visual layer of Electricity North West’s GIS network data.
Secondly the University continued making progress in their analysis despite the significant delays described earlier in provision of sufficient days of quality monitoring data. In the interim, the University used its resources efficiently to make progress with its development of the what-if scenarios for LCT penetration and analysis of network solutions. In combination with the detailed models of specific Electricity North West LV networks, the University used synthetic load data sourced from CREST at Loughborough University, rather than the load profiles derived from network monitoring. Appendix H compared the CREST, ELEXON and ‘allocated’ profiles based on monitoring load profiles, and found the CREST profiles to be useful for analysis of networks with domestic load.
Despite successfully automating capture of network and monitoring data, given these problems and the time constraints of the project, the University’s analysis generally does not reflect continuous monitoring data or all 200 networks. The number of networks considered is detailed in each deliverable report, reflecting the availability of data at the time of writing and quality criteria on the data.
However despite the limitations, this represents a truly significant step forward in terms of data characterising real LV distribution networks in Great Britain. This is particularly given that this analysis includes information by phase and by feeder, rather than just transformer totals,
• The performance evaluation covered nearly 10,000 days of valid data across 136 substations from January 2013 to January 2014, with neutral currents and THD considered for 430 feeders.
• 25 underground networks (128 feeders) were fully validated against monitoring data and characterised with impedance data, allowing full network models and application of the valuable but time-consuming Monte Carlo what-if LCT scenario analysis. For

Low voltage network solutions closedown report/June 2014 Page 62 of 75
academic publications after this project, the University researchers plan to update the analysis in their what-if scenarios using the more representative ‘allocated’ load profiles from the monitoring data. Electricity North West will continue to engage with this work in case there are any alterations to the conclusions made so far.
• The analysis of representative feeders was extracted from a sample of 232 feeders across 75 underground networks with processed network, customer and monitoring data (very stringent criteria).
• Electricity North West’s learning from installation and data collection and ongoing data capture reflects the full 200 networks.
9 VARIANCE IN COSTS AND BENEFITS
9.1 Cost variance (updated March 2017)
The original project budget was £1,495k. The project was delivered at a final cost of £1,680k. The main cost variance in the project related to significant project technical support which was not forecast (this oversight has been corrected in future projects). These activities covered technical oversight of the monitoring procurement, installation approach, installation delivery and management/ review of the academic work.
There were no other significant cost variances in the total budget or in any individual cost category. A key contributor to the delivery of the materials element project on budget was the use of a tender process for the monitoring equipment, with decisions made following that tender to limit the scope of additional monitoring, as described in the previous section. Additional materials related to monitoring equipment related to sundry minor electrical parts and cabinets required for practical installation. Research support included the University of Manchester’s analysis, consultancy/contractor work on development of the monitoring approach and the inputs/ delivery of the Future Capacity Headroom model.
Table 3 – Project cost summary
Item Category Estimated costs
Final Costs £k (rounded)
1 Project Management 70 73
2 Project Technical Support 0 173
3 Monitoring Equipment 490 514
4 Installation 170 180
5 IT for monitoring 65 69
6 Research support, including academic/ consultancy/ contractor 700 670
Total 1,495 1,680

Low voltage network solutions closedown report/June 2014 Page 63 of 75
9.2 Benefits variance
As described in more detail throughout section 11 on ‘Planned Implementation’, using this project (but with further work), Electricity North West will ultimately develop new designs (incorporating new technologies) and operating practices which will help address future customer needs, without the need for extensive and potentially expensive network reinforcements in future price control periods.
However as stated in the original registration, the focus of this project was on developing monitoring and learning to manage future network requirements, rather than to offset planned spending in the DPCR5 period. As such, the expectation of the revenue allowed for within the DPCR5 settlement that was likely to be saved as a result of the project was zero, and there is no variance to this.
A method to deliver LV monitoring without customer interruptions was successfully delivered – so there were no adverse impacts on the frequency or length of customer interruptions, and no impacts on incentive revenue. The project has not yet led to avoided or deferred interventions on the network – although as described in section 11 it has provided the monitoring and validated the business decision to move to a ‘connect and manage/ monitor’ approach to PV clusters, as opposed to a general assumption that an intervention would be required to manage voltage with every PV cluster.
The customer benefits of this project are summarised in section 11.6.
10 LESSONS LEARNT FOR FUTURE PROJECTS
The lessons learnt in this project can be divided into six areas.
• Learning how to monitor at LV ie appropriate products and procedures
• Performance evaluation of monitored LV networks, and comparison of a monitoring data with other load estimates
• Creation of a future capacity headroom model for the whole secondary network.
• Development of a detailed modelling methodology from network data and profiles, and the challenges in doing this modelling (eg processing of LV data)
• Learning from those detailed models to assess the hosting capacity of LV networks for LCTs, and potential network solutions, with implications for future DNO operating and planning policy.
• Learning what and when to monitor at LV going forward
These areas were summarised in the executive summary, with detailed descriptions of this learning given in sections 5 and 6. Description of planned implementation of the lessons learnt is contained in section 11.
10.1 Review of the Methods used in this project
The project did not discover any significant problems with the trialled Methods for monitoring. Substation network monitoring without customer interruption was successfully installed, and the data collection processes worked well by the end of the project. Although the LV monitoring approach is suitable for deployment at a large scale in the future, this project demonstrates that a widespread deployment of monitoring across all LV networks is unnecessary and that LV monitoring can be targeted where required.

Low voltage network solutions closedown report/June 2014 Page 64 of 75
The project did not discover any significant problems with the trialled Methods for networks analysis either. It would not be expected that the network analysis method would be deployed routinely for LV distribution networks. This is due to the data requirements, time and effort involved in the approach to building the network models required for network analysis and probabilistic assessment of network impacts. However generic rules and learning from the method (particularly if applied to representative networks) could in future be derived from additional analysis using these methods, and applied at large scale in DNO policy for the low voltage networks. Further work will be required to achieve this.
The working relationships with the contracted suppliers to this project worked well (eg University of Manchester, GridKey, Nortech, installation contractors, consultancy support for the Future Capacity Headroom model). In innovation projects a certain amount of flexibility needs to be accepted, and contracts were managed with clear deliverables, an understanding of the overall project objectives, and regular communication.
10.2 Completed dissemination activities
Electricity North West has presented this project at three LCNF annual conferences (2011, 2012 and 2013).
The project has briefly featured in several editions of Electricity North West’s quarterly internal newsletter to all employees ‘Newswire’. In addition to training staff involved in installation of monitoring, briefings were made to management and to operational staff who might encounter the monitoring at substations they visit.
Based on the product development work done by GridKey with Electricity North West for the ‘LV Network Solutions’ project, GridKey entered and won the 2012 UK Energy Innovation award for the ‘Best Smart Grid Technology’. This provided high-profile publicity for the trial and for the benefits of the monitoring approach developed with GridKey in this project.
In 2014, several workshops were held between Electricity North West’s Strategic Planning sections and the University to cover early findings on the what-if LCT scenarios and from the monitoring.
In May and June 2014, Electricity North West discussed with WPD the interim conclusions and comparison between this project and their completed Second Tier LV Network Templates project. The outputs of this project and comparison of the LV modelling with the Transform model were discussed with EA Technology in June 2014.
A list of the University of Manchester’s publications is provided below. The University of Manchester has published five conference papers in peer-reviewed international conferences [1]-[5], had one accepted for presentation [6], and one has been submitted to a conference later this year [7]. In addition, the University is confident that the findings and ongoing work from this project will result in at least two further papers in top-class journals, providing further international dissemination.
List of University of Manchester’s publications based fully or partly on work for the ‘LV network Solutions’ project.
[1] A. Navarro, L.F. Ochoa, P. Mancarella, ‘Learning from residential load data: Improving LV network planning and operation’, IEEE/PES Transmission & Distribution Latin America 2012, 2012-09 3-5, p 8 (http://dx.doi.org/10.1109/TDC-LA.2012.6319101)
[2] A. Navarro, L.F. Ochoa, P. Mancarella, D. Randles, ‘Impacts of photovoltaics on low voltage networks: A case study for the North West of England’, 22nd International Conference on Electricity Distribution CIRED 2013, 2013-06 10-13, p 4 (http://dx.doi.org/10.1049/cp.2013.1229)

Low voltage network solutions closedown report/June 2014 Page 65 of 75
[3] A. Navarro, L.F. Ochoa, D. Randles, ‘Monte Carlo-based assessment of PV Impacts on real UK low voltage networks’, IEEE/PES General Meeting 2013, 2013-07 21-25, p 5 (http://dx.doi.org/10.1109/PESMG.2013.6672620)
[4] A. Ballanti, A. Navarro, F. Pilo, L.F. Ochoa, ‘Assessing the benefits of PV reactive power absorption on a real UK low voltage network’, IEEE/PES Innovative Smart Grid Technologies ISGT Europe 2013, 2013-10 6-9, p 5 (http://dx.doi.org/10.1109/ISGTEurope.2013.6695423)
[5] A. Navarro, L.F. Ochoa, D. Randles, ‘Assessing the benefits of meshed operation of LV feeders with low carbon technologies’, IEEE/PES Innovative Smart Grid Technologies ISGT 2014, 2014-02 19-22, 9 5 (http://dx.doi.org/10.1109/ISGT.2014.6816494)
[6] A. Navarro, L.F. Ochoa, ‘On the cascading effects of residential-scale PV disconnection due to voltage rise’, IEEE/PES General Meeting 2014. Accepted.
[7] A. Navarro, L.F. Ochoa, ‘Increasing the PV Hosting Capacity of LV Networks: OLTC-Fitted Transformers vs. Reinforcements’, IEEE/PES Innovative Smart Grid Technologies ISGT Europe 2014. Submitted.
10.3 Planned dissemination activities
Further information about the ‘LV Network Solutions’ project will be made available at www.enwl.co.uk/thefuture. This will include the close down report and all appendices including the University of Manchester’s deliverable reports. A short industry summary report is also planned, focusing on implementation of key learning from the project and its benefits for customers. By the end of this year (2014), the University of Manchester proposes to organise the data to be shared, so it can be understood and adequately used by those interested in it. The LV networks used in the what-if scenarios of LCT uptake (see section 6.5) will be released as OpenDSS network files, and are also likely to be presented as Excel files so as to make any further 'translation' into other software packages easier. This general data share is also expected to include high granularity (5 min) demand and low carbon technologies profiles. We have yet to define how and what part of the monitoring data will be released on our website – this may be selected days for representative feeders. Requests for further information on the project should be submitted to [email protected] with the title ‘Low Voltage Network Solutions’.
The project will be presented at the October 2014 LCNF conference, with a focus on the what-if scenarios and comparison with the WPD ‘LV Network Templates’ project. The project will also be presented to other DNOs as part of regular liaison, both at the Energy Networks Association’s R&D Managers forum and upon request.
Electricity North West and the University of Manchester are planning to host a project dissemination event, provisionally Autumn 2014, focusing specifically on the key academic learning and modelling work carried out in this project and Electricity North West’s other recently completed First Tier project, ‘Voltage Management at LV Busbars’. The audience is expected to be a combination of invited academics/ consultants and appropriate technical representatives from DNOs as identified via the Energy Networks Association’s R&D Managers forum.
Internally, a series of follow-up workshops is being planned between Electricity North West’s Network Strategy section and the academics at the University of Manchester, to help with internal dissemination of the results and policy implications of the project, feeding into the planned review of LV planning and connections policy.
As mentioned in section 6.10 on Transform, the methodology developed in this project for detailed network analysis at LV is likely to provide useful insights for Smart Grid Forum’s Work Stream 7. Together with the University of Manchester, Electricity North West will offer

Low voltage network solutions closedown report/June 2014 Page 66 of 75
to engage at an early stage with the consultants to be appointed to deliver the Smart Grid Forum’s forthcoming Work Stream 7.
11 PLANNED IMPLEMENTATION
The planned implementation of learning from this project for the Electricity North West network can be divided into the following areas.
• Using LV monitoring and network models to support other trials
• Reviewing policy on what and when to monitor on LV networks
• Improving processes for installing LV monitoring
• Ongoing performance evaluation of the LV networks
• Future implications for LV planning, operations and connections policy
Further detail on these areas is provided below, followed by a summary of the customer benefits from this project.
At the end of this project, ongoing responsibility for all of these areas transfers to the Strategic Planning section in Electricity North West’s Networks Strategy and Technical Services Directorate.
11.1 Using LV monitoring and models to support other trials
This subsection provides examples of how both existing and new LV monitoring, and the models produced in this project, are being used to support other trials at Electricity North West.
The monitoring in ‘LV Network Solutions’ supported Electricity North West’s other recently completed First Tier project, ‘Voltage Management at Low Voltage Busbars’. The first six networks modelled and monitored in this project corresponded to the networks in the Voltage Management project.
Some of the monitoring in this project will be used from 2014 to 2017 for monitoring of LV networks in Manchester proposed for domestic heat pump installations in a partnership with the Japanese New Energy Development Organisation (NEDO). Around 600 heat pumps will be fitted across three Registered Social Landlords, supplied by about thirty distribution substations. This project will require additional monitoring equipment of networks beyond those in the ‘LV Network Solutions’ project. The installation procedure and equipment specification from this project are being used to deliver this.
In a new IFI project ‘Customer Voltage & Power Quality Limits’, Electricity North West is working to use some of the monitoring already installed for ‘LV Network Solutions’ to additionally monitor voltage THD. This is likely to involve download of additional firmware to upgrade the monitors and/or additional processing of data recorded.
Particularly using the mid and endpoint monitoring and the detailed network models from ‘LV Network Solutions’, the First Tier project ‘Low Voltage Integrated Automation (LoVIA)’ aims to combine the learning from this project and the First Tier ‘Voltage Management at Low Voltage Busbars’ project by using the voltages measured at the mid and end points of feeders to drive the tap change control scheme, and for the capacitor evaluations.

Low voltage network solutions closedown report/June 2014 Page 67 of 75
Furthermore, Electricity North West’s Second Tier projects, CLASS and ‘Smart Street’, will use mid/endpoint monitoring as an indication that the service to customers is unaffected by the trials. This project has also influenced the planned LV modelling approach in ‘Smart Street’. Further details on these projects are available on the Electricity North West website www.enwl.co.uk/thefuture.
11.2 Improving processes for installing LV monitoring and data collection
Electricity North West intends to review its Code of Practice 303 on ‘Installation, Maintenance and Removal of Monitoring and Measuring Equipment’, based on developing expertise and processes.
Section 5 highlighted a number of issues identified as important for ensuring a smooth rollout of LV monitoring eg survey and data collection issues. Following an internal lessons learnt workshop focused on data collection issues, Electricity North West is currently working to capture and embed learning in two areas. Firstly around management of innovation projects involving data communications, include recommendations around best practice early engagement with IT, networks security and telecoms issues. The second element is around capturing the fine detail of internal processes around installing LV monitoring with data communications eg responsibilities. Areas for improvement are particularly around SIM-card registration, recording of data at commissioning, and ongoing records. There are also future actions to take around defining the ongoing performance requirements for the iHost system in terms of availability and disaster recovery.
11.3 Reviewing policy on what and when to monitor on LV networks
As a result of this project, Electricity North West now has in place specifications, procedures and trained staff to implement LV monitoring when required, working live and using Rogowski coils to avoid customer interruptions. The question of ‘how’ and ‘what’ to monitor have thus been largely been resolved by the project, but the question of ‘when’ requires further consideration.
The implications of ‘LV Network Solutions’ for when to monitor LV networks can be divided into two areas. The first implication was supporting and validating the business decision made by Electricity North West to move to a ‘connect and manage’ approach (with monitoring) for connection of clusters of small-scale embedded generation such as PV. This decision was made in the early stages of the ‘LV Network Solutions’ project was completed, so the role of this project was to monitor networks and sense check this policy. The second implication was informing the more detailed future policy on how and when to monitor LV networks.
Validating the ‘connect and manage/ monitor’ approach to PV clusters
The results of the University’s multi-feeder what-if scenario analysis emphasised that although there was significant variation in the penetration of LCTs that different feeders could accept before voltage or thermal issues occur, there would be a significant number with no identified thermal or voltage issues, even at high levels of LCT penetration. This is shown for example by the dots at hypothetical 110% penetration in Figures 22, 23 and 28 in section 6. For many feeders, no intervention would ever be expected to be required due to LCT uptake.
Secondly even though the selection of networks for monitoring was biased towards those with PV, the performance evaluation has so far only identified higher values of total harmonic distortion of current associated as being a problem associated with PV. The particular issue of current THD is being investigated further with a more robust assessment of total harmonic distortion of voltage in a follow-on project.

Low voltage network solutions closedown report/June 2014 Page 68 of 75
However so far the combination of these findings from the modelling and monitoring data so far supports Electricity North West’s approach to move to ‘connect and manage’ approach to PV clusters, in which monitoring is the first intervention to identify impacts as/when they arise, rather than proceeding directly to reinforce or use a voltage management technique. This avoids delaying connection and increasing costs to customers by performing network studies and then intervening before allowing connection. This approach also recognises the limited capability of the business-as-usual tools to study LV networks to adequately identify potential impacts; time-series four-wire LV network analysis (with or without the probabilistic Monte Carlo analysis) is not something DNOs are able to deliver routinely at this stage.
However it is acknowledged that the monitoring data analysis of voltage has so far been limited to substation and head of feeders, rather than the more relevant case of feeder ends. This is an area which Electricity North West will review further as data from the midpoints and endpoints becomes available. Thus the ‘connect and manage’ policy remains under review for clusters of small scale embedded generators such as PV.

Low voltage network solutions closedown report/June 2014 Page 69 of 75
Future policy on what and when to monitor at LV
A key outcome of this project is the University of Manchester’s set of recommendations on what and when to monitor the LV networks (see section 6.7 and Appendix L). The recommendations on ‘what’ to monitor can be easily transferred to policy.
However further review is now required on how to implement the suggestion of ‘when’ to monitor – based on the thresholds for LCT penetration levels per feeder when the first voltage or thermal problems occur. The performance evaluation of the LV networks did not suggest a need for widespread monitoring of the networks in general, so the criterion of LCT uptake causing network issues is relevant. So Electricity North West intends to develop a policy to target its LV monitoring towards those networks or feeders where LCT uptake suggests a problem might be more likely to occur. This area was described in more detail in section 6.8.
The development of the policy on when to monitor will be kept under review as liaison continues with the University of Manchester while they continue their academic research using the monitoring data and network models for this project.
This policy will also need to be considered in the context of the timescale of the smart meter rollout providing an alternative source of data on network usage. Future policy on when to monitor will be closely linked to developments in LV planning, operations and connections, as detailed in the next section.
11.4 Ongoing performance evaluation of LV networks.
For the monitored networks, historic and new monitoring data is now available to business users through Electricity North West’s iHost system.
Alongside the review of when to monitor (described in the previous section), Electricity North West now plans to develop an internal policy to determine the appropriate level of review of the monitoring data, considering the resource implications. This may be a mixture of detailed review of networks of interest, combined with automated alerts for networks in general.
Informed by the University’s review of the monitoring data up to January 2014, which did not present any serious concerns about LV network performance, it is not expected that intensive scrutiny of LV network data is required by the business going forward.
As mentioned earlier in the report, specific monitored networks with high/low voltage, high voltage unbalance and high indicative values of current THD are being investigated further in the IFI project ‘Customer Voltage and Power Quality’ limits. The findings from this project will support ongoing development of Electricity North West’s approach to performance evaluation of the networks.
Separately, Electricity North West is looking further at 74 feeders with relatively high neutral currents, to understand the scale of the problem and whether rebalancing of customers between phases would be a worthwhile intervention.
However a set of standard reports is set to be developed from iHost to highlight unusual results for business-as-usual review of LV monitoring performance data. It is also expected that the follow-on ‘Customer Voltage & Power Quality’ project will develop a power quality exception reporting function from iHost, which would eventually be incorporated into business as usual also. Separately from iHost, specific voltage and THD exception reports are being developed from other devices manufactured by Kelvatek (which report via Kelvatek’s servers) and which have been installed on the Electricity North West LV network as part of other innovation projects eg the Bidoyng Smart fuse (First Tier Low Carbon

Low voltage network solutions closedown report/June 2014 Page 70 of 75
Networks Fund) and the Weezap & Lynx controllable switching devices for ‘Smart Street’ (Second Tier Low Carbon Networks Fund).
The monitors for this project were considered static but the substation monitors can be readily and cheaply redeployed to other sites to obtain more understanding of the network. Obviously redeployment is not so feasible for mid/endpoint monitors jointed to cables.
In May 2014, informed by the University’s review against the monitoring data, Electricity North West developed and implemented improvements to its Load Allocation system for estimating load on the secondary network (see section 6.3 and Appendix G). The output of the Load Allocation is used by Electricity North West as a) the baseline of the Future Capacity Headroom model, b) an input to its automated restoration system to reconfigure the network after faults, and c) identification of highly load distribution transformers to prioritise investigation for load-related replacement. Final validation of the changes is currently underway before offering the improved version to systems b) and c).
11.5 Future implications for LV planning, operations and connections
A key output of this project should be the implementation of the results of the academic analysis in Electricity North West’s policies for operating and planning LV networks – for new and existing networks and for connections – given the finding that voltage is generally the first problem occurring with greater LCT penetration.
Now that Electricity North West has completed both this project and the other First Tier project ‘Voltage Management at LV Busbars’, a review of policy on LV planning, operations and connections is planned. This will result in more appropriate guidance which will be used as part of business as usual – including guidance on when to monitor and when to intervene on the network - with a wider portfolio of solutions to cater for different network conditions
Electricity North West expects that general rules and triggers will be derived from the academic analysis – there is currently no expectation of modelling networks to routinely conduct Monte Carlo analyses of potential LCT impacts.
However Electricity North West fully recognises that further development work is required beyond this project to translate the academic work into practical outcomes – both in terms of understanding how to use the concept of hosting capacity in DNOs, and in assessing the wide range of LV network solutions currently in development both in Electricity North West and the wider industry. For example the solutions assessed in Appendix K (loop reinforcement, on-load tap changers and incremental reinforcement) are just a current assessment of the wider set of solutions considered in the Transform model created by EA Technology for DNOs and Ofgem via the Smart Grid Forum in 2012/13. Electricity North West will also review whether additional internal and collaborative projects need to be raised to do this work.
12 FACILITATE REPLICATION
There has been no formal registration of intellectual property as a consequence of this project. This project has been conducted based on the default Intellectual Property Rights (IPR) arrangements for Low Carbon Networks Fund projects, supporting knowledge transfer as a key aim of the Fund. As such, Electricity North West and the University of Manchester own all knowledge created as part of the Project, either individually or jointly as appropriate, but make this freely available for Electricity Distributors to use. This includes the findings of the analysis contained in this report such as recommendations for how to monitor at LV, the Methods developed by the Project as described in the report and in the appendices, the monitoring data, and the developed network models (although the network data itself is Background IPR owned by Electricity North West).

Low voltage network solutions closedown report/June 2014 Page 71 of 75
As described in section 10.3 on planned dissemination, we are keen to encourage sharing of data for academic purposes and to other Electricity Distributors. Thus we plan to make further available on our website further information on our network models, profiles and a selection of the monitoring data, so that the analysis could be replicated by others.
The findings and Methods described in this report and appendices are being made publicly available to all (Electricity Distributors and others) without licence and irrespective of their nominal ownership. Further details on how to replicate the Methods in this project are provided in the rest of this section.
To facilitate replication of the monitoring methods, alongside the information provided in section 5 of this report, Electricity North West has produced and is making publicly available the following documents (see Appendices 1-2 and 4-6):
• A Code of Practice for the installation of the monitoring equipment
• Jointing procedures and associated drawings for specific LV cable types and overhead line
• An information-seeking (tender) specification for the substation monitoring
• A formal specification for the mid/end point monitoring equipment.
• Distribution substation survey form (planning phase)
All other planning and installation work for this project was carried out using the standard Electricity North West policies and procedures.
To facilitate replication of the Future Capacity Headroom model, the functional design specification is provided as Appendix 7. This model is built upon Electricity North West’s existing data and systems for network connectivity, customer allocation to assets and metering data. Thus the design principles rather than the detailed code are expected to be relevant to replication.
To facilitate replication of the academic analysis, the most relevant deliverable reports from the University are provided in Appendices A-F and H-M. These provide guidance on the methodologies used, including the processing of GIS network data, the creation of load and LCT profiles and the methodologies for the what-if scenario analysis.
The network analysis itself was performed using OpenDSS – an open source Distribution System Simulator – freely available to download from the EPRI website.

Low voltage network solutions closedown report/June 2014 Page 72 of 75
13 APPENDICES
This final report is supplemented by two sets of appendices – the Electricity North West appendices 1-9, plus a selection of the University of Manchester’s project deliverable reports, provided as appendices A-M. All appendices will be made available for download at www.enwl.co.uk/thefuture.
Electricity North West Appendices 1-8
1. Code of Practice on ‘Installation, Maintenance and Removal of Monitoring and Measuring Equipment’. (CP303 - March 2013)
2. 1. Module of Code of Practice ‘Lines Manual (Live Lines)’ – Fitting a LV Voltage/Current Monitoring Box (CP423 MOD661),
Plus additional procedures in Code of Practice on LV Jointing (CP411)
2. LV P3-501 – GridKey Cabinet Termination and Commissioning
3. LV P3-502 – GridKey Smart Joint to Waveform Cable (3 core and 4 core).
4. LV P3-503 – GridKey Smart Joint to Consac Cable
5. LV P3-504 – GridKey Smart Joint to 4 Core PILC Cable
6. P1-3/101 1 – Drawing for SCNE Smart Breech Joint for GridKey Current Sensor to 4 Core Waveform
7. P1-3/102 1 – Drawing for GridKey Smart Breech Joint to CONSAC Cable
8. P1-3/103 1 – GridKey Smart Breech Joint to 4 Core PILC
3. University of Manchester’s Monitoring Equipment Specifications (draft) - August 2011
4. Electricity North West’s Tender Specification for the substation monitoring equipment – December 2011
5. Specification for Monitoring Installations for use on the LV Cable Network (ES 357 – March 2013). The cabinet requirements specifically refer to the midpoint/ endpoint, but this is generally applicable for substation monitoring also, and thus supersedes Appendix 4.
6. Distribution Substation Survey Form (for use prior to purchase of monitoring equipment and installation)
7. Future Capacity Headroom model – Functional Design Specification - February 2013
8. GridKey Installation Guide – Revision 2 April 2013
9. GridKey Developments for Electricity North West’s ‘LV Network Solutions’ – June 2014

Low voltage network solutions closedown report/June 2014 Page 73 of 75
University of Manchester Appendices A-M
A Deliverable 1.2 Tool for translating network data from ENWL into OpenDSS
B Deliverable 1.3 and 1.4
Creation of non-validated computer-based models of monitored and generic LV networks ready to be used for planning studies
C Deliverable 1.5 Review of available data and techniques to model new loads and DER (including EV, HP and PV as minimum)
D Deliverable 3.1 Tool for translating data/reports from monitoring devices into OpenDSS
E Deliverable 3.2 Production of validated LV networks
F Deliverable 3.3 Performance evaluation of the monitored LV networks(Final 2014 version)
G Deliverable 3.4 Review/critique of ENWL’s load allocation tool
H Deliverable 3.5 Creation of aggregated profiles with and without new loads and DER based on monitored data
I Deliverable 3.6 What-if scenario impact studies based on validated and generic LV networks (Parts 1 and 2)
J Deliverable 3.7 Representative LV networks based on statistical analysis
K Deliverable 4.1 Assessment of examples of LV network solutions
L Deliverable 4.2 Recommendations on the deployment of monitoring devices in LV networks
M Deliverable 4.3 Comparison with outputs of the WPD Low Voltage Templates Project

Low voltage network solutions closedown report/June 2014 Page 74 of 75
14 LIST OF FIGURES AND TABLES
Figure 1 – Two Gridhounds with a GridKey Monitoring Control Unit (MCU)
Figure 2 – GridKey Substation Monitoring on an open LV fuse board
Figure 3 – Nortech Substation Monitoring on a Pole (left) and Indoors (right)
Figure 4 – Electrotech Mounting Frame for Outdoor Installation, plus Cabinet for GridKey Monitoring Unit
Figure 5 – Housing containing GridKey data concentrator
Figure 6 – Joint for Current Measurement
Figure 7 - Data Collection Approach from Monitors
Figure 8 – Example of a Voltage Graph from Monitored Data from iHost
Figure 9 - Examples of two LV Networks
Figure 10 – Load - Diversified profile and max demand histogram for 100 profiles
Figure 11 – PV- Diversified profile and max demand histogram for 100 profiles
Figure 12 – EHP - Diversified profile and max demand histogram for 100 profiles
Figure 13 – EV - Diversified profile and max demand histogram for 100 profiles
Figure 14 - Comparison of Diversified Net Profiles for different LCTs
Figure 15 - Impact Assessment Methodology Flow Chart
Figure 16 - Example Feeder
Figure 17 - Example of Customer Voltage analysis for PV and EHP on one feeder
Figure 18 - Example of feeder utilisation analysis for PV and EHP on one feeder
Figure 19 - Schematic of the Future Capacity Headroom model
Figure 20 - Feeders with technical problems per technology (feeders with more than 25 customers)
Figure 21 - Per technology, first technical issue amongst feeders with problems
Figure 22 - Initial utilization level (left), R2:0.65 and Total Path Impedance (right), R2:0.76 – PV Case
Figure 23 - Initial utilization level (left), R2:0.70 and Total Path Impedance (right), R2:0.78 – EHP Case
Figure 24 - Percentage of Customers with Voltage Problems with increasing PV penetration – comparison with balanced case for a single feeder
Figure 25 - Energy Losses (left) and Utilization Level (right) – Comparison with balanced case

Low voltage network solutions closedown report/June 2014 Page 75 of 75
Figure 26 – Example of feasible points for loop connection of sample network
Figure 27 – Example of daily energy losses and voltage problems at different PV penetration levels, calculated for a test feeder at various time intervals
Figure 28 – Customer Number and Feeder Length for the PV Case, R2:0.61.
Table 1 – Final set of representative feeders and their frequency in assessed networks
Table 2 – High-level comparison of Transform and ‘LV Network Solutions’
Table 3 – Project cost summary


