Low - Carbon Development Targets, Planning and Policy Evaluation in China: Theory and Practices Prof. WANG Yi Institutes of Science and Development, Chinese Academy of Sciences San Francisco, Sept 14, 2018 Workshop on Announcement of Low Carbon Development Cooperation in Southeast Asia through the Belt and Road Initiative and China’s South-South Climate Cooperation
Transcript
Low-Carbon Development Targets,Planning and Policy Evaluation in China:
Theory and Practices
Prof. WANG YiInstitutes of Science and Development,
Chinese Academy of SciencesSan Francisco, Sept 14, 2018
Workshop on Announcement of Low Carbon Development Cooperation in Southeast Asia through the Belt and Road Initiative and China’s South-South Climate Cooperation
Contents
1. Background
2. Methodology/Toolkit Development
3. Case Study
4. Experience & Next Step
China’s Green & Low-carbon Development Planning: Political and Economic Background
l Building institutions for ecological civilization & green development (2013): The 3rd Plenary Session of 18th CPC Central Committee
l The Belt and Road Initiative (2013): Greening the BRI and support the South-South cooperation, emphasize on energy and coping with climate change
l The economic “New Normal” (2014): on-going industrialization and urbanization
l Political commitment (2017-18): promote a high quality development pattern, guide the international cooperation on climate change, find sustainable solutions worldwide, and push to build a fair, reasonable, cooperative, and win-win global environment/climate governance system
l National Policy:Ø Mandatory Targets – NDC(The Paris Agreement) Driven:
Carbon Intensity reduction in 2030 by 60-65% compared with the level of 2005; non fossil energy share and forest stock increase targets
Ø Pilot program for Low-carbon development in 6 provinces and 81 cities (January, 2017);
Ø 7 ETS pilots and National ETS (December, 2017)Ø New context: Eco-Civilization development
l Policy instrumentsØ Comprehensive policies adopted Ø Planning plays an important role in ChinaØ Market-based instruments crucial in the future
l Comprehensive implementation guarantee
China’s Low-carbon Development Planning: Policy
Setting green targets in 2016-2020l Mandatory targets: 10 types and 16 targets
ØResources and Energy: double control (efficiency + cap control)ü Land: arable land, keep stable at 1.865 Bn. mu; newly-increased
construction land, < 32.56 Mn. muü Water: water use: 670 Bn. M3 (non mandatory), water use per 10000 yuan
of GDP, 23% ↓ü Energy: total energy consumption: 5.0 bn. tce (non mandatory),
energy intensity, 15% ↓ (16% in the 12th FYP) ØEnvironment: the quality centered (driving the economic
restructuring)ü Environmental quality:• Air quality: two targets, incl. PM2.5• Quality of surface water: two targets
ü Pollutant reduction: • COD 10% ↓ (8% in the 12th FYP)• NH3-N 10% ↓ (10% in the 12th FYP)• SO2 15% ↓ (8% in the 12th FYP)• NOx 15% ↓ (10% in the 12th FYP)
• Note: the indicator with orange color refers to non-mandatory targets
Low Carbon targets in 2016-2020
l Climate change targets in 2016-2020: ü Carbon intensity, 18% ↓ (17% in the 12th FYP, non fossil fuel
contribution more than that in 12th FYP)ü Share of non-fossil energy, reach at 15% (12% in 2015)ü Forest area: 23% (21.7% in 2015)ü Timber stock volume: 1.65 Bn m3 (1.51 Bn m3 ↑ in 2010-2015)
l Coal targets in 13th FYP Energy Plan:ü Coal share: 58%ü Coal use for coal-fired power plant: 310 gce/kWh
üHopefully, CO2 intensity will be 50% lower than that of 2005, which exceeds the goal of a 40~45% reduction China committed on Copenhagen Climate Accord
Low Carbon targets in 2030 and beyond
l Targets in 2030 (China’s NDC)ü Carbon emissions peak by around 2030 or earlierü Share of non-fossil energy, 20% ü CO2 intensity, 60-65% ↓ (2005-2030)ü Timber stock volume: 4.5 Bn m3 ↑ (2005-2030)
l In 2030, electricity from non-fossil fuel will account for 50% of total electricity generationü At that time about 50% of primary energy will go for power generating,
so the proportion of non-fossil fuel in primary energy would be about 25%.
l Energy Production and Consumption Revolution Strategies 2016~2030 (EPCRS)ü Propose to control total energy consumption to less than 5 billion tce in
2020, less than 6 billion tce in 2030, and to have it stabilized in 2050.
Targeted Poverty Alleviation in 2015-2020l From 2013-2016: reduce rural poverty people by 55.64 million,
13.91 million annually; but 43.35 million still l Actions adopted:
Ø Goal: poverty eradication in 2020 at current poverty standard (per capita net income ¥2300/a.)
Ø Establish a poverty alleviation system, set up action plan, and issue some key policies, including eco-compensation improvement
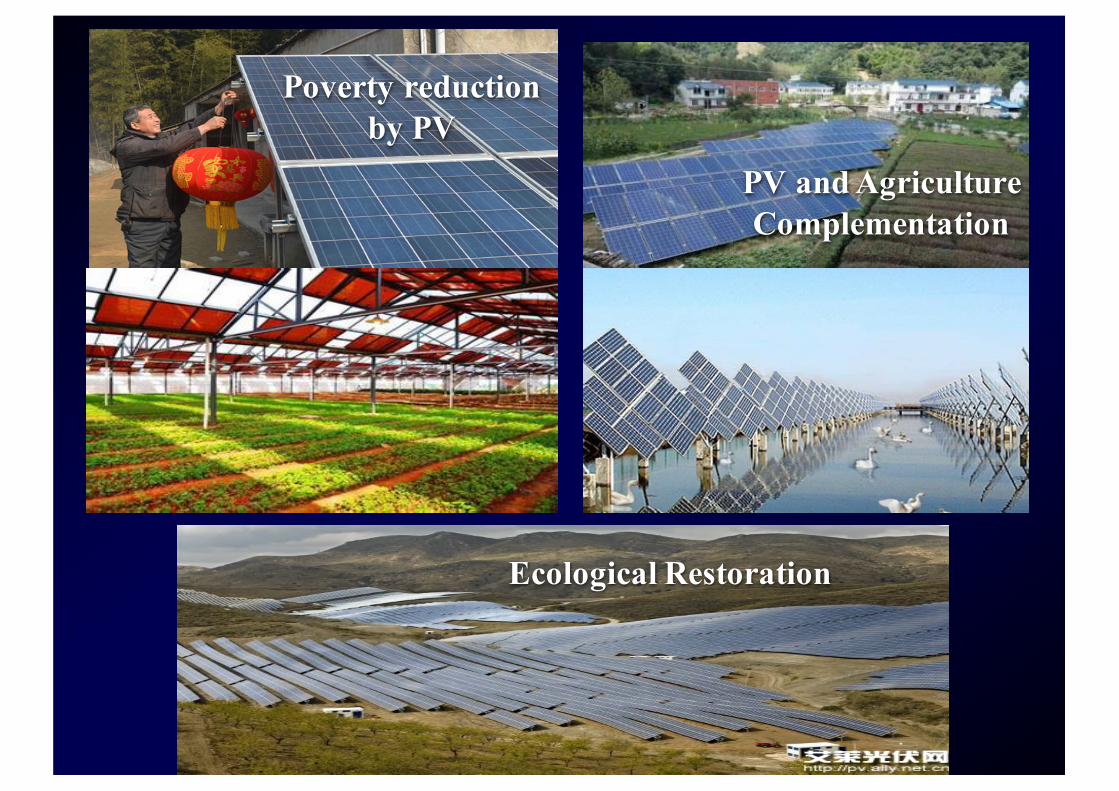
Ø Promote a targeted poverty alleviation from identifying poverty peopleØ Comprehensive solutions adopted, such as, poverty reduction by
ecological conservationü Provide jobs for conservation ü PV supportü Eco-tourism ü E-business pilot, etc.
l Current problems: heavy task, alternative livelihood, funds, differentiated policy, etc.
l It depends on China’s political system resource, maybe it’s difficult to copy
lApproaches:Ø Long-term and short-term Ø Action coordination among different sectors / stakeholdersØ Objectives, roadmaps and policiesØ Managing the transitional and dynamic system
lChallengesØ Not enough legal supportØ Data and statistical system imperfectionØ Lack of evidence-based, quantitative methodology and guideline Ø Planning conflicts
Regional Low-carbon Development Planning Framework: Int’l Experience
• Prerequisite: Reasonable targets + clear political will• Government agencies take the lead• Integrated policies with actions• Stakeholders' participation and coordination mechanisms• Key: Low-carbon technologies and financing
Pilot by Government Agencies
Policy Integration
Stakeholders’ Participation
Low-carbon Technologies
Low-carbon Financing
Other Tools
Policy ToolkitMake Inventory of CO2 Emissions
Review Results of Relevant Emission Reduction Policies Sector by Sector
Integrate Existing Policies and Identify Their Emission Reduction Potentials
Set Overall Emission Reduction Targets and Sector-based Targets, and Set Low-carbon Visions
Make CO2 Emission Reduction Action Plans
Make Climate Change Adaptation Plans
Identify Economic Development Opportunities and Make Strategic Low-carbon Development Plan
Procedures to Develop a Low-carbon Action Plan
Contents
1. Background
2. Methodology/Toolkit Development
3. Case Study
4. Experience & Next Step
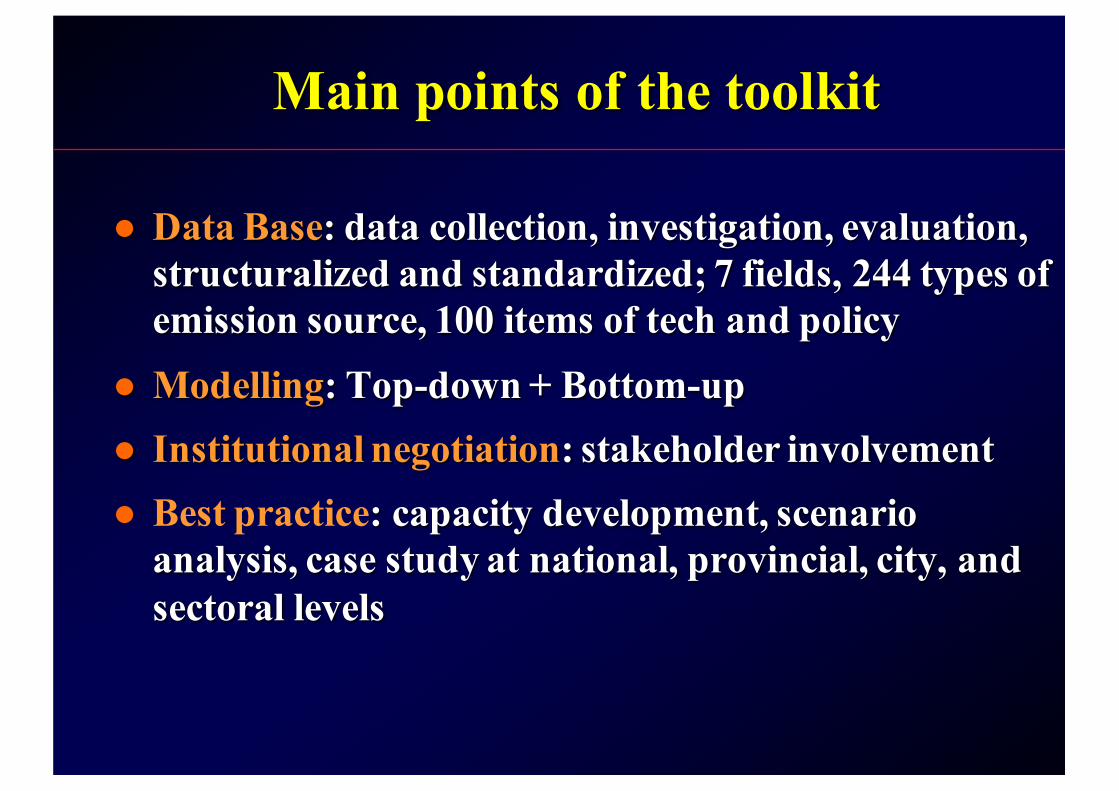
Main points of the toolkit
● Data Base: data collection, investigation, evaluation, structuralized and standardized; 7 fields, 244 types of emission source, 100 items of tech and policy
• Through questionnaire investigation and expert consultation, about 40 policies are screened from about 300 policies of various industries as the key object to analysis.
• Policies can be divided into structural adjustment, technology progress, and fine management .
• Now 92% policies has been completed by quantitative analysis.
GHG inventory and forecast
Evaluation and cost-benefit analysis
Comprehensive policy implications
Field studies and stakeholder
consultations
• Low-carbon planning report to relevant government agencies
• Policy suggestion for low-carbon development
Procedures of Regional Low-carbon Planning
Low-carbon Policies Analysis System (PAC): bottom-up
China’s LC policy analysis system (Policy Package of China. PAC)
Function Process Step Outcome
Guidance Principals
Results of Analysis
Categories of Impact
1. General principals2. Sector-based principals3. Policy Selection: data source, calculation tools & methodology, assumptions and variables4. Integration
1. Emission reduction amount2. Energy (energy efficiency and carbon intensity)3. Resources (water, land, waste)4. Implementation cost5. Cost-benefit of policies……
ØNational Low-carbon Policy and Peak analysisØ International expanding
lThe Belt and Road regions
Regional Low-carbon Planning Toolkit: capacity development
lCapacity Building and PromotionØTraining: there are 5 training courses on the planning
toolkit to be carried out during 2013-2018.
Ø Participants: including local government officials, climate change scholars, business practitioners, etc. More than 200 people have been trained up to now.
ØThe GEI had more training activities.
l Achievements, 5 items of software copyrights.1. Greenhouse gas emission inventories and emission forecasting tools in China's energy sector V1.0 (2016:
1472776)2. Greenhouse gas emission inventories and emission forecasting tools in China's industrial sector V1.0
(2016: 1472783)3. Greenhouse gas emission inventory and emission forecasting tool for China's agriculture and forestry
sector V1.0 (2016: 1472726)4. Greenhouse gas emission inventory and emission forecasting tool for China’s waste management sector
V1.0 (2016: 1472714)5. China's sub sector greenhouse gas emission inventory and emission forecast summary tool V1.0 (2016:
1472721)
Introduction to Regional Low-carbon Planning Toolkit: software copyrights
Contents
1. Background
2. Methodology/Toolkit Development
3. Case Study
4. Experience & Next Step
Empirical study on green and low carbon policy assessment
l Sectors level:Research on green and low carbon transition roadmap for key industries and sectors
l Provinces and Cities level:GHGs reduction evaluation and cost-benefit analysis of policies of low-carbon pilot provinces and cities
l National level:The simulation and policy mix analysis of China's carbon emission peak
l Additional applications: n Financing project planningn Chongqing low carbon transition planning (key sectors and projects
layout)n Shenzhen International Low-carbon City planning assessment (key
projects selection and layout proposal)
l Sectors level:Research on green and low carbon transition roadmap for key industries and sectorsEnergy, Industry, Building, Transportation
CO2 emissions from China's power and thermal supply sector under different scenarios
CO2 emissions from China's industrial sector under different scenarios
CO2 emissions from Chinese building sector under different scenarios
CO2 emissions from China's transportation sector under different scenarios
Empirical Study on green low carbon policy assessment: sectors
l Provinces and Cities level:Take the lead in carrying out GHG reduction evaluation and cost-benefit analysis of policies of low-carbon pilot provinces and cities
First batch: East (Guangdong, Shenzhen), Middle (Hubei), West (Chongqing)
Second batch: Xiangtan, Liuzhou, Chengdu, Guiyang
2000-2035 Guangdong GHG emissions of BAU and policy scenarios
2000-2035 Chongqing GHG emissions of BAU and policy scenarios
The contribution ratio of various sectors in Guangdong in 2030
The contribution ratio of various sectors in Chongqing in 2030
Empirical Study on green low carbon policy assessment: local level
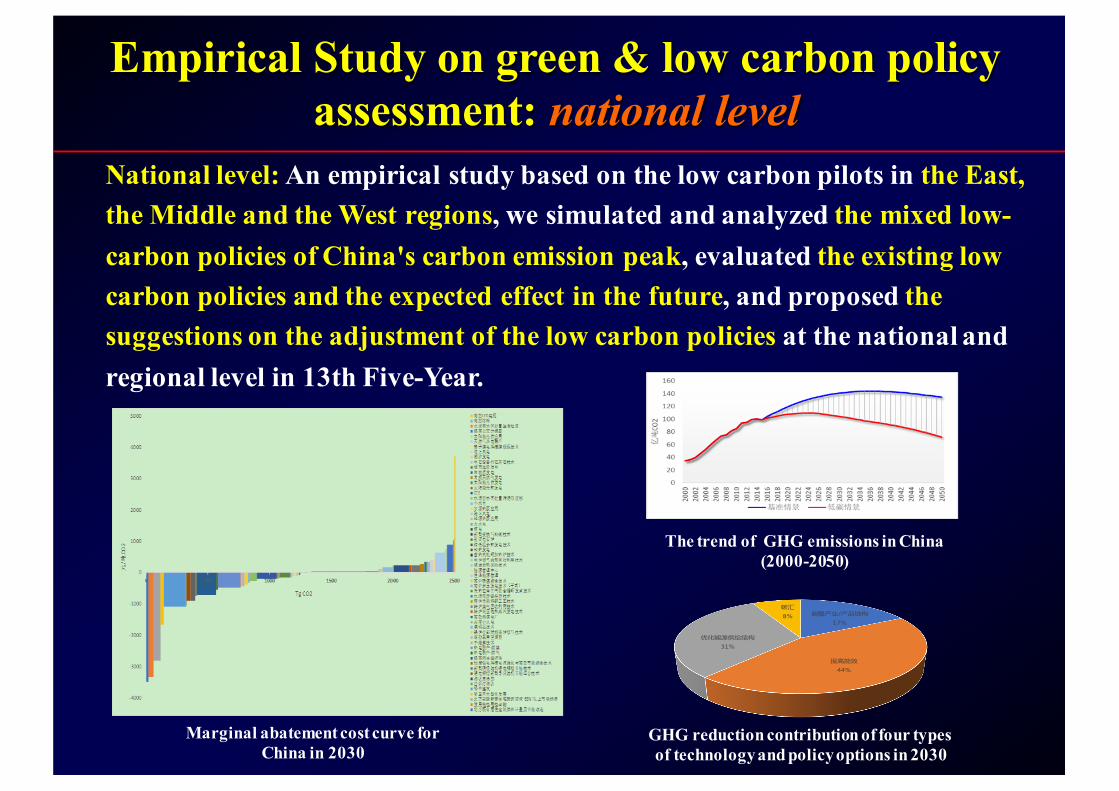
National level: An empirical study based on the low carbon pilots in the East, the Middle and the West regions, we simulated and analyzed the mixed low-carbon policies of China's carbon emission peak, evaluated the existing low carbon policies and the expected effect in the future, and proposed the suggestions on the adjustment of the low carbon policies at the national and regional level in 13th Five-Year.
The trend of GHG emissions in China (2000-2050)
调整产业/产品结构
17%
提高能效
44%
优化能源供给结构
31%
碳汇
8%
GHG reduction contribution of four types of technology and policy options in 2030
Marginal abatement cost curve for China in 2030
Empirical Study on green & low carbon policy assessment: national level
l We made the implementation scheme of thelow-carbon pilot of Chongqing, which has beenapplicated by Chongqing development andReform Commission. (2014)
l On the basis of the analysis results, the "climatechange response" in the "13th Five-Year Plan"was drafted and submitted to the NDRC's climatedivision and planning department, which directlysupported the making of the climate change partin the "13th Five-Year" plan. (2016)
Outcomes and Effects at both national and province/city levels
Contents
1. Background
2. Methodology/Toolkit Development
3. Case Study
4. Experience & Next Step
Experience and Next StepØ Legal role of LC development planningØ The toolkit of planning should reflect the integration of green and
low carbon practice, model system development and policy supporting system for co-benefit
Ø Establishment of the planning guideline, quantitative policy base and framework
Ø Model forums for comparison and cooperationØ Suitable for developing economies (localization), and support the
carbon emission peak prediction, the made of emission reduction roadmap, low carbon technology and policy optimization, and the planning and analysis function of the financing project library, both at the regional level and national level.
Ø The proposed policy recommendations have a solid foundation of model analysis, which can provide operational proposals and financed project planning for the local industry, with great potential for application.