Page 1
International Journal for Quality Research 9(4) 605–620
ISSN 1800-6450
605
Luis Fonseca
1
Vanda Lima
Manuela Silva
Article info:
Received 15.03.2015
Accepted 08.06.2015
UDC – 54.061
UTILIZATION OF QUALITY TOOLS: DOES
SECTOR AND SIZE MATTER?
Abstract: This research focuses on the influence of company
sector and size on the level of utilization of Basic and
Advanced Quality Tools. The paper starts with a literature
review and then presents the methodology used for the survey.
Based on the responses from 202 managers of Portuguese ISO
9001:2008 Quality Management System certified
organizations, statistical tests were performed. Results show,
with 95% confidence level, that industry and services have a
similar proportion of use of Basic and Advanced Quality
Tools. Concerning size, bigger companies show a higher trend
to use Advanced Quality Tools than smaller ones. For Basic
Quality Tools, there was no statistical significant difference at
a 95% confidence level for different company sizes. The three
basic Quality tools with higher utilization were Check sheets,
Flow charts and Histograms (for Services) or Control Charts/
(for Industry), however 22% of the surveyed organizations
reported not using Basic Quality Tools, which highlights a
major improvement opportunity for these companies.
Additional studies addressing motivations, benefits and
barriers for Quality Tools application should be undertaken
for further validation and understanding of these results.
Keywords: Quality Tools, Quality Management System,
Companies Size and Activity Sector
1. Introduction1
The paper starts with the literature review of
the use of Quality Tools and its support for
an effective Quality Management System.
Following this review and the definition of
the research methodology, a survey was
prepared. After choosing the sampling frame
and a pretest, a short questionnaire (with the
purpose of yielding acceptable response
rates) was send to managers of Portuguese
ISO 9001 Quality Management System
1 Corresponding author: Luis Fonseca
email: [email protected]
certified organizations. Information about
the organizations and the use of Basic
Quality Tools and Advanced Quality Tools
was collected and after hypotheses tests,
results were analyzed and discussed.
Concerning article value, it brings new
knowledge on the use of Quality Tolls for
different company sectors and sizes and it
identifies the opportunity for a more
intensive use of Quality Tools.
The article ends with suggestions for future
research to improve and extend the
conclusions of this research.
Page 2
606 L. Fonseca, V. Lima, M. Silva
2. Literature Review
Due to an increasingly complex and
challenging competitive environment, many
organizations have adopted Quality
Management Systems (QMS) like the ISO
9001: International Standard Series or
Business Excellence Models (BEM), such as
the EFQM model (Fonseca, 2015).
ISO 9001:2008 International Standard has
achieved great international visibility with
more than 1 Million Organizations with ISO
9001 certified Management Systems all over
the world accordingly to ISO Survey 2013
(ISO, 2014). These International Standards
were first published by ISO© (ISO, 2014) in
1987 as a key tool to allow for the growing
internationalization of business and the need
for common quality management system
standards. ISO 9001:2008 is based on a
PDCA (Plan-Do-Check-Act) approach and
on the eight quality management principles
that can be used by top management to lead
the organization towards improved
performance (ISO 9000:2005 International
Standard). A release of the 2015 version of
ISO 9001 is under way and the new standard
version should be more business and results
oriented, take into consideration the
organizational context and relevant
stakeholders and apply risk-based thinking,
making it closer and more in line with the
Business Excellence Models (Fonseca,
2015).
Karapetrovic, Casadesus and Heras (2008)
identified 115 empirical studies that employ
surveys with the purpose of studying the
impact of ISO 9000 standards worldwide
and more recently studies by Tari et al.
(2012) also suggest that ISO 9001 has clear
benefits on organizational, operational,
people and customer results ( the effects on
financial performance are not fully
conclusive).
Although ISO 9001 International Standard
cannot be considered as a TQM or a
Business Excellence Model, it is consistent
with BEM and be can a step towards that
direction within an evolution perspective.
There are also a considerable number of
studies on the impact of BEMs (Sila and
Ebrahimpour, 2005 and Heras, 2006) that
point out to increased financial profit
(Boulter et al., 2013; Jacob et al., 2004;
Hansson and Eriksson, 2002) and improved
non-financial outcomes (Curkovic et al.,
2000; Powell, 1995) with the adaptation of
these models.
According to the literature on TQM, there
are two components in a TQM system: the
management system (Quality management)
and the technical system (Quality
engineering), or the „soft‟ and „hard‟ part.
The hard part includes process and
production control techniques like process
management and the seven basic quality
control tools (Evans and Lindsay, 1999;
Wilkinson et al., 1998). While there is a
considerable stream of literature on the
implementation of Quality Management
Systems, studies addressing the use of
Quality Tools are not so frequent, which can
be considered as a research opportunity
(Saraph et al., 1989; Powell 1995; Hendricks
and Singhal, 1997; Bayazit and Karpak
2007; Sila 2007; Stock et al,. 2007; Chen,
2013).
Researchers (McQuater et al., 1995;
Bamford and Greatbanks, 2005) have
supported the utilization of quality tools and
techniques relevance for effective problem
solving and continuous improvement. Tarí
and Sabater (2004) made a study of 106
ISO certified firms in Spain concluding that
techniques and tools can contribute to the
improving of TQM level (providing there is
adequate management commitment),
leading to company superior performance .
Quality tools have a clear function and are
applied by themselves, while quality
techniques are a set of tools and have a
broader application (e.g., statistical process
control that uses histograms, process
diagrams and control charts)
There are many Quality tools, however, the
most well-known and used are the “seven
Page 3
607
Basic Quality Tools” identified by Ishikawa
(1976): histograms, cause and effect
diagrams, check sheets, Pareto charts, flow
charts, control charts and scatter diagrams.
These tools are adequate for data collection
and analysis.
In 1988, a team of Japanese scientist and
engineers led by Shigeru Mizuno developed
the “New seven Quality Management Tools”
or “the Seven Management Tools” to foster
innovation, disseminate information and
successfully plan large projects (ASQ 2015).
These tools are the relation diagram or
interrelationships diagram, the KJ method
and the affinity diagram, the systematic
diagram or tree diagram or story board, the
matrix diagram (including QFD), the matrix
data analysis, the process decision program
chart and the arrow (PERT/CPM) activity
network diagram.
Other Quality Tools that are commonly used
are the 5 why‟s, brainstorming, FMEA –
failure mode and effects analysis, QFD
(Quality Function Development), 6 Sigma,
benchmarking and improvement teams. For
the purpose of this research, “The new seven
Management Tools” and “Other Quality
Tools” were merged into “Advanced Quality
Tools” as complementary to the “Seven
Basic Quality Tools”.
Table 1 summarizes the most common used
Quality Tools.
Table 1. Quality Tools summary
Designation Source Tools
Basic Quality Tools Ishikawa (1976) Histograms
Cause and effect diagrams
Check sheets
Pareto charts
Flow charts
Control charts
Scatter diagrams
Advanced Quality
Tools (Quality
Management Tools or
New Quality Tools +
Other)
Juse (1988); See Dale
& McQuater,(1988)
and Okes, (2002) for
other Quality Tools
Relation diagram or
interrelationships diagram
Affinity diagram(KJ method)
Systematic diagram
Matrix diagram
Matrix data analysis
Process decision program
chart (PDPC)
Arrow diagram
5 why's
Brainstorming
FMEA - failure mode and
effects analysis
QFD (Quality Function
Development)
6 Sigma
Benchmarking
Improvement teams
Source: Adapted by Authors.
Page 4
608 L. Fonseca, V. Lima, M. Silva
According to Bamford and Greatbanks
(2005), we use daily quality tools like
checklists to plan / organize our time
although we often do not realize they are
quality tools.
Table 2 presents a brief description of the
most common Basic and Advanced Quality
Tools (source: adapted from ASQ, 2015,
based on Tague, 2004).
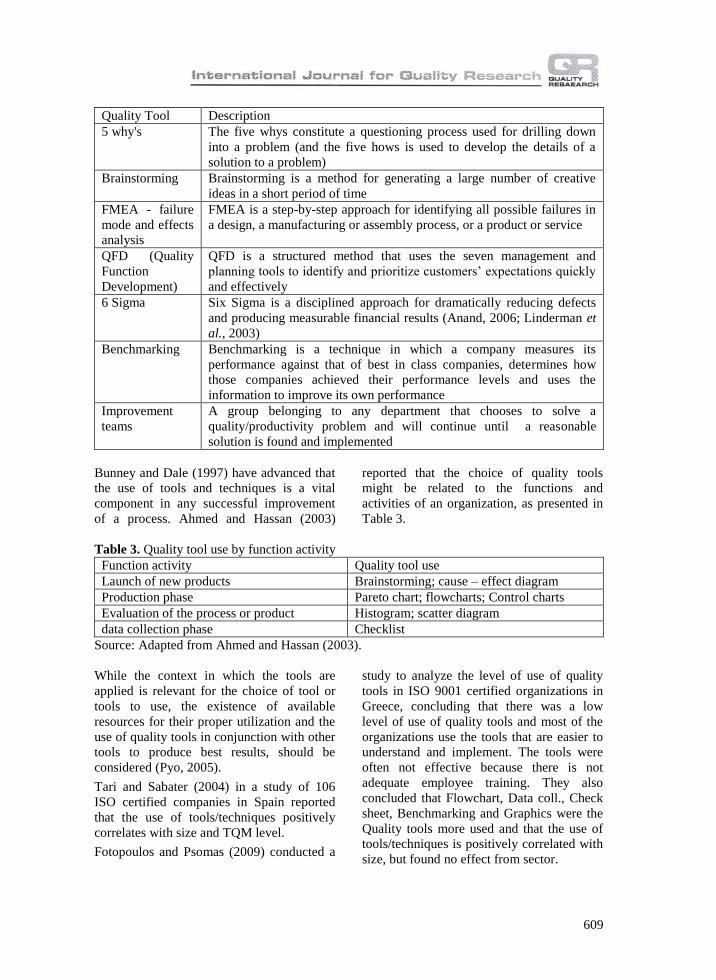
Table 2. Quality Tools Description
Quality Tool Description
Histograms A frequency distribution shows how often each different value in a set
of data occurs. A histogram is the most commonly used graph to show
frequency distributions
Cause and effect
diagrams
Also known as, the fishbone diagram, the cause and effect diagrams
identify many possible causes for an effect or problem. It sorts ideas
into useful categories
Check sheets A check sheet is a structured, prepared form for collecting and analyzing
data
Pareto charts A Pareto chart is a bar graph that visually highlights which situations are
more significant
Flow charts A flowchart is a picture of the separate steps of a process in sequential
order
Control charts The control chart is a graph used to study how a process changes over
time and to identify if a process is statistical control (subject to normal
causes or variation) or not (subject to special causes of variation)
Scatter diagrams The scatter diagram graphs pairs of numerical data, with one variable on
each axis, to look for a relationship between them
Relation diagram
or
interrelationships
diagram
The relations diagram shows cause–and–effect relationships. Just as
importantly, the process of creating a relations diagram helps a group
analyze the natural links between different aspects of a complex
situation
Affinity
diagram(KJ
method)
The affinity diagram organizes a large number of ideas into their natural
relationships. This method taps a team‟s creativity and intuition. It was
created in the 1960s by Japanese anthropologist Jiro Kawakita
Systematic
diagram, or tree
diagram
Breaks down broad categories into finer and finer levels of detail, that
help thinking step by step from generalities to specifics.
Matrix diagram The matrix diagram shows the relationship between two, three or four
groups of information. It also can give information about the
relationship, such as its strength, the roles played by various individuals
or measurements
Matrix data
analysis
Six differently shaped matrices are possible: L, T, Y, X, C and roof–
shaped, depending on how many groups must be compared
Process decision
program chart
(PDPC)
The process decision program chart (PDPC) systematically identifies
what might go wrong in a plan under development. Countermeasures are
developed to prevent or offset those problems
Arrow diagram The arrow diagram shows the required order of tasks in a project or
process, the best schedule for the entire project, and potential scheduling
and resource problems and their solutions (also known as PERT if
probabilistic or CPM if deterministic)
Page 5
609
Quality Tool Description
5 why's The five whys constitute a questioning process used for drilling down
into a problem (and the five hows is used to develop the details of a
solution to a problem)
Brainstorming Brainstorming is a method for generating a large number of creative
ideas in a short period of time
FMEA - failure
mode and effects
analysis
FMEA is a step-by-step approach for identifying all possible failures in
a design, a manufacturing or assembly process, or a product or service
QFD (Quality
Function
Development)
QFD is a structured method that uses the seven management and
planning tools to identify and prioritize customers‟ expectations quickly
and effectively
6 Sigma Six Sigma is a disciplined approach for dramatically reducing defects
and producing measurable financial results (Anand, 2006; Linderman et
al., 2003)
Benchmarking Benchmarking is a technique in which a company measures its
performance against that of best in class companies, determines how
those companies achieved their performance levels and uses the
information to improve its own performance
Improvement
teams
A group belonging to any department that chooses to solve a
quality/productivity problem and will continue until a reasonable
solution is found and implemented
Bunney and Dale (1997) have advanced that
the use of tools and techniques is a vital
component in any successful improvement
of a process. Ahmed and Hassan (2003)
reported that the choice of quality tools
might be related to the functions and
activities of an organization, as presented in
Table 3.
Table 3. Quality tool use by function activity
Function activity Quality tool use
Launch of new products Brainstorming; cause – effect diagram
Production phase Pareto chart; flowcharts; Control charts
Evaluation of the process or product Histogram; scatter diagram
data collection phase Checklist
Source: Adapted from Ahmed and Hassan (2003).
While the context in which the tools are
applied is relevant for the choice of tool or
tools to use, the existence of available
resources for their proper utilization and the
use of quality tools in conjunction with other
tools to produce best results, should be
considered (Pyo, 2005).
Tari and Sabater (2004) in a study of 106
ISO certified companies in Spain reported
that the use of tools/techniques positively
correlates with size and TQM level.
Fotopoulos and Psomas (2009) conducted a
study to analyze the level of use of quality
tools in ISO 9001 certified organizations in
Greece, concluding that there was a low
level of use of quality tools and most of the
organizations use the tools that are easier to
understand and implement. The tools were
often not effective because there is not
adequate employee training. They also
concluded that Flowchart, Data coll., Check
sheet, Benchmarking and Graphics were the
Quality tools more used and that the use of
tools/techniques is positively correlated with
size, but found no effect from sector.
Page 6
610 L. Fonseca, V. Lima, M. Silva
A more recent study of 146 Greek ISO
9001:2008 QMS certified companies
concluded that that the use of standards and
tools/techniques is low when compared with
companies from other countries (Ismyrlis
and Moschidis, 2015).
Specifically concerning the application of
Quality Tools in Portugal, Sousa et al.
(2005) have concluded by studying a sample
of 103 Portuguese Small and Medium
Enterprises ISO 9001 certified companies
that graphs were almost universally used
(98.1%), followed by process flowchart
(86.4%) and check sheets (85.4%).
3. Research Methodology
This research followed the methodologies
prescribed by Marconi and Lakatos (2003)
and comprehended the following six steps
(Figure 1).
Source: Authors adaptation.
Figure 1. Research Phases
The first stage was to carry out a
comprehensive literature review concerning
Quality Tools and the factors affecting their
application, within Quality Management and
Business Excellence Models frameworks.
The sampling frame consisted of quality,
environmental and/or safety managers of
organizations with ISO 9001:2008 certified
Quality Management Systems. Of the 2,906
managers contacted by email (2012), 202
full complete responses were received (7%
response rate). A self-administered online
questionnaire was used (Lime Survey web-
based open software). Subsequent analysis
was done with Microsoft Excel 2007 and
Statistical Package for the Social Sciences
(SPSS) Version 22. Statistical analysis and
hypotheses testing were the methods used to
draw conclusions in this research.
The questionnaire developed in this study
consisted of two main sections. The first
section had the purpose of gathering general
information about the organization (name of
the organization name and function of the
person answering the survey, sector of
activity and number of employees of the
organization, confirming ISO 9001
certification). The second section based on
literature review asked whether Basic
Quality Tools and Advanced Quality Tools
were used by the organization and what were
the three Basic and Advanced Quality Tools
more commonly used by the organization.
4. Research Results
4.1 Descriptive Statistics
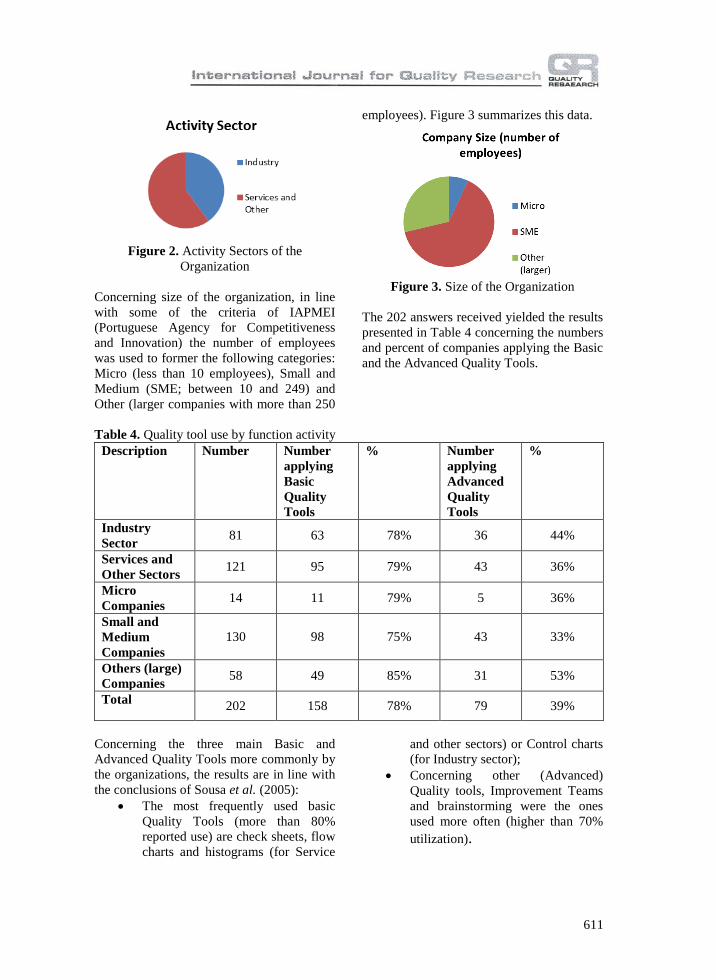
From the 202 responses received, 81 (40%)
were from industry and 121 (60%) from
Services (and other) as presented in Figure 2.
Page 7
611
Figure 2. Activity Sectors of the
Organization
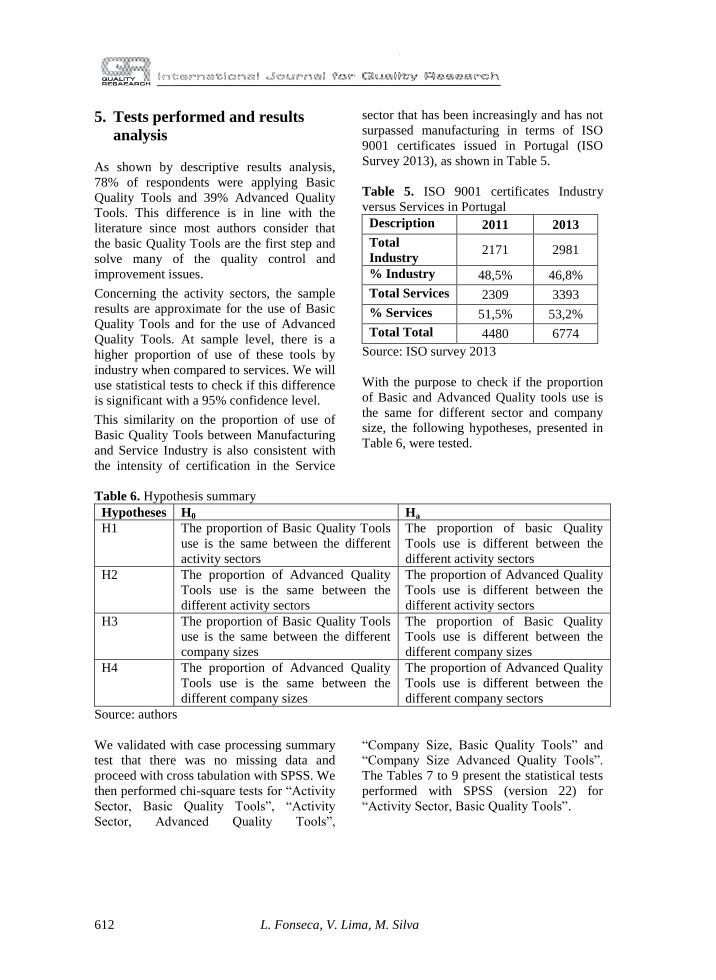
Concerning size of the organization, in line
with some of the criteria of IAPMEI
(Portuguese Agency for Competitiveness
and Innovation) the number of employees
was used to former the following categories:
Micro (less than 10 employees), Small and
Medium (SME; between 10 and 249) and
Other (larger companies with more than 250
employees). Figure 3 summarizes this data.
Figure 3. Size of the Organization
The 202 answers received yielded the results
presented in Table 4 concerning the numbers
and percent of companies applying the Basic
and the Advanced Quality Tools.
Table 4. Quality tool use by function activity
Description Number Number
applying
Basic
Quality
Tools
% Number
applying
Advanced
Quality
Tools
%
Industry
Sector 81 63 78% 36 44%
Services and
Other Sectors 121 95 79% 43 36%
Micro
Companies 14 11 79% 5 36%
Small and
Medium
Companies
130 98 75% 43 33%
Others (large)
Companies 58 49 85% 31 53%
Total 202 158 78% 79 39%
Concerning the three main Basic and
Advanced Quality Tools more commonly by
the organizations, the results are in line with
the conclusions of Sousa et al. (2005):
The most frequently used basic
Quality Tools (more than 80%
reported use) are check sheets, flow
charts and histograms (for Service
and other sectors) or Control charts
(for Industry sector);
Concerning other (Advanced)
Quality tools, Improvement Teams
and brainstorming were the ones
used more often (higher than 70%
utilization).
Page 8
612 L. Fonseca, V. Lima, M. Silva
5. Tests performed and results
analysis
As shown by descriptive results analysis,
78% of respondents were applying Basic
Quality Tools and 39% Advanced Quality
Tools. This difference is in line with the
literature since most authors consider that
the basic Quality Tools are the first step and
solve many of the quality control and
improvement issues.
Concerning the activity sectors, the sample
results are approximate for the use of Basic
Quality Tools and for the use of Advanced
Quality Tools. At sample level, there is a
higher proportion of use of these tools by
industry when compared to services. We will
use statistical tests to check if this difference
is significant with a 95% confidence level.
This similarity on the proportion of use of
Basic Quality Tools between Manufacturing
and Service Industry is also consistent with
the intensity of certification in the Service
sector that has been increasingly and has not
surpassed manufacturing in terms of ISO
9001 certificates issued in Portugal (ISO
Survey 2013), as shown in Table 5.
Table 5. ISO 9001 certificates Industry
versus Services in Portugal
Description 2011 2013
Total
Industry 2171 2981
% Industry 48,5% 46,8%
Total Services 2309 3393
% Services 51,5% 53,2%
Total Total 4480 6774
Source: ISO survey 2013
With the purpose to check if the proportion
of Basic and Advanced Quality tools use is
the same for different sector and company
size, the following hypotheses, presented in
Table 6, were tested.
Table 6. Hypothesis summary
Hypotheses H0 Ha
H1 The proportion of Basic Quality Tools
use is the same between the different
activity sectors
The proportion of basic Quality
Tools use is different between the
different activity sectors
H2 The proportion of Advanced Quality
Tools use is the same between the
different activity sectors
The proportion of Advanced Quality
Tools use is different between the
different activity sectors
H3 The proportion of Basic Quality Tools
use is the same between the different
company sizes
The proportion of Basic Quality
Tools use is different between the
different company sizes
H4 The proportion of Advanced Quality
Tools use is the same between the
different company sizes
The proportion of Advanced Quality
Tools use is different between the
different company sectors
Source: authors
We validated with case processing summary
test that there was no missing data and
proceed with cross tabulation with SPSS. We
then performed chi-square tests for “Activity
Sector, Basic Quality Tools”, “Activity
Sector, Advanced Quality Tools”,
“Company Size, Basic Quality Tools” and
“Company Size Advanced Quality Tools”.
The Tables 7 to 9 present the statistical tests
performed with SPSS (version 22) for
“Activity Sector, Basic Quality Tools”.
Page 9
613
Table 7. Case Processing Summary “Activity Sector * Basic Quality Tools”
Cases
Valid Missing Total
N Percent N Percent N Percent
Activity sector * Basic
Quality Tools 202 100.0% 0 0.0% 202 100.0%
Table 8. Activity Sector * Basic Quality Tools Crosstabulation
Basic Quality Tools Total
N Y
Activity sector
IND Count 18 63 81
% within Activity sector 22.2% 77.8% 100.0%
SERV Count 26 95 121
% within Activity sector 21.5% 78.5% 100.0%
Total Count 44 158 202
% within Activity sector 21.8% 78.2% 100.0%
Tale 9. Chi-Square Tests – Activity Sector * Basic Quality Tools
Value df
Asymp. Sig.
(2-sided)
Exact Sig. (2-
sided)
Exact Sig. (1-
sided)
Pearson Chi-Square .015a 1 .901
Continuity Correctionb .000 1 1.000
Likelihood Ratio .015 1 .901
Fisher's Exact Test 1.000 .517
Linear-by-Linear
Association .015 1 .902
N of Valid Cases 202
a. 0 cells (0.0%) have expected count less than 5. The minimum expected count is 17.64.
b. Computed only for a 2x2 table
Similar statistical tests were made for
“Activity Sector, Advance Quality Tools”
yielding the following results shown in
Tables 10 to 12.
Table 10. Case Processing Summary Activity Sector * Advanced Quality Tools
Cases
Valid Missing Total
N Percent N Percent N Percent
Activity sector *
Advanced Quality Tools 202 100.0% 0 0.0% 202 100.0%
Page 10
614 L. Fonseca, V. Lima, M. Silva
Table 11. Activity Sector * Advanced Quality Tools Crosstabulation
Advanced Quality Tools Total
N Y
Activity sector
IND Count 45 36 81
% within Activity sector 55.6% 44.4% 100.0%
SERV Count 78 43 121
% within Activity sector 64.5% 35.5% 100.0%
Total Count 123 79 202
% within Activity sector 60.9% 39.1% 100.0%
Table 12. Activity Sector * Advanced Quality Tools Chi-Square Tests
Value df
Asymp. Sig.
(2-sided)
Exact Sig. (2-
sided)
Exact Sig. (1-
sided)
Pearson Chi-Square 1.617a 1 .204
Continuity Correctionb 1.264 1 .261
Likelihood Ratio 1.611 1 .204
Fisher's Exact Test .240 .131
Linear-by-Linear
Association 1.609 1 .205
N of Valid Cases 202
a. 0 cells (0.0%) have expected count less than 5. The minimum expected count is 31.68.
b. Computed only for a 2x2 table
The next statistical tests concerned
“Company Size, Basic Quality Tools” with
the following results presented in Tables 13,
14 and 15 below.
Table 13. Case Processing Summary Company Size * Basic Quality Tools
Cases
Valid Missing Total
N Percent N Percent N Percent
Company size * Basic
Quality Tools 202 100.0% 0 0.0% 202 100.0%
Table 14. Company Size * Basic Quality Tools Crosstabulation
Basic Quality Tools Total
N Y
Company size
MICRO Count 3 11 14
% within Company size 21.4% 78.6% 100.0%
SME Count 32 98 130
% within Company size 24.6% 75.4% 100.0%
OTHER Count 9 49 58
% within Company size 15.5% 84.5% 100.0%
Total Count 44 158 202
% within Company size 21.8% 78.2% 100.0%
Page 11
615
Table 15. Chi-Square Tests Company Size * Basic Quality Tools
Value Df Asymp. Sig. (2-sided)
Pearson Chi-Square 1.950a 2 .377
Likelihood Ratio 2.042 2 .360
Linear-by-Linear Association 1.202 1 .273
N of Valid Cases 202
a. 1 cells (16.7%) have expected count less than 5. The minimum expected count is 3.05.
The final statistical tests for “Company Size,
Advanced Quality Tools” are shown in the
following Tables 16 to 18.
Table 16. Case Processing Summary Company Size * Advanced Quality Tools
Cases
Valid Missing Total
N Percent N Percent N Percent
Company size * Advanced
Quality Tools 202 100.0% 0 0.0% 202 100.0%
Table 17. Company size * Advanced Quality Tools Crosstabulation
Advanced Quality Tools Total
N Y
Company size
MICRO Count 9 5 14
% within Company size 64.3% 35.7% 100.0%
SME Count 87 43 130
% within Company size 66.9% 33.1% 100.0%
OTHER Count 27 31 58
% within Company size 46.6% 53.4% 100.0%
Total Count 123 79 202
% within Company size 60.9% 39.1% 100.0%
Table 18. Chi-Square Tests Company Size * Advanced Quality Tools
Value df Asymp. Sig. (2-sided)
Pearson Chi-Square 7.062a 2 .029
Likelihood Ratio 6.964 2 .031
Linear-by-Linear Association 5.175 1 .023
N of Valid Cases 202
a. 0 cells (0.0%) have expected count less than 5. The minimum expected count is
5.48.
Table 19 below summarizes the main conclusion reached with the chi-square tests.
Page 12
616 L. Fonseca, V. Lima, M. Silva
Table 19. Chi-square test results
Hypothesis Chi-square test
Conclusion Value
Sig. (2-sided)
H1 0,015 0,901 The proportion of Basic Quality Tools use is the same
between the different activity sectors
H2 1,617 0,204 The proportion of Advanced Quality Tools use is the
same between the different activity sectors
H3 1,950 0,377 The proportion of Basic Quality Tools use is the same
between the different company sizes
H4 7,062 0,029 The proportion of Advanced Quality Tools use is
different between the different company sizes
Source: authors
With a 95% confidence level, we reject the
hypotheses that the proportion of Basic
Quality Tools and Advanced Quality Tools
use is different between the different activity
sectors and between the different company
sizes. We also reject the hypothesis that the
proportion of Advanced Quality Tools is
different between the different company
activity sectors.
However, also with a 95% confidence level,
we accept the hypothesis that the proportion
of Advanced Quality Tools use is different
between the different company sizes. The
use of Advance Quality Tools seems related
with company sizes, with bigger companies
showing a higher usage of these tools.
6. Discussion of Results
The results, based on the managers‟ inputs,
show evidence that Portuguese ISO
9001:2008 Quality Management Systems
certified organizations are using Basic and
Advanced Quality Tools. This is consistent
with the literature and with the Quality
Management Principles of the ISO 9000
International Standards series. However, a
somewhat troubling question might be: “and
what about the 22% of companies that report
not using even the Basic Quality Tools”?
How can these companies assure customer
satisfaction by delivering conformity
products and applying continuous
improvement? This is an issue worth paying
attention for certified companies,
certification bodies and accreditation bodies.
In addition, many companies still do not use
Advanced Quality Tools. In a world of
intensive and global competition, this is an
improvement opportunity for these
companies to study and use these tools to
foster their enduring success.
By the use of the chi square test, we
achieved the conclusion that, with a 95%
confidence level, there are no statistically
significant differences between the
proportions of use of Basic and Advanced
Quality Tools between industry and services.
We only have evidences that the use of
Advanced Quality Tools is different between
companies size, bigger companies show a
higher trend to use Advanced Quality Tools
than smaller ones. According to industry
specialists interviewed during this research,
since bigger companies have more
specialized resources and work with some
high demanding industries (e.g., automotive,
where ISO/TS 16949 standards for
certification of Automotive Industry Supply
Chain require the use of Advanced Quality
Planning and Advanced Quality Tools) they
could have a higher percent of stronger
utilization of Advanced Quality Tools.
These results are consistent with the
researches from Tari and Sabater (2004) in
Spain, from Sousa et al. (2005) in Portugal
and Fotopoulos and Psomas (2009) in
Greece that found that the use of quality
Page 13
617
tools/techniques positively correlates with
size. These last authors also found no effect
from sector, which is also the case of this
research, since we have not found
statistically significant differences in the use
of both Basic and Advanced Quality Tools
between the proportion of organizations that
use these tools on the industry and service
(and other) sectors.
The results of this investigation also bring
further knowledge on the application of
Quality Tools in other companies either than
Small and Medium enterprises (SMEs).
They also show that service sector has
approached manufacturing sector in terms of
Quality Tools use.
The three basic Quality tools with higher
utilization were Check Sheets, Diagram
Graphs and Histograms (for Services) or
Control Charts/Statistical Process Control
(for Industry). Other Quality tools widely
used were Improvement Teams and
Brainstorming. This is globally in line with
the studies of Sousa et al. (2004) and
Fotopoulos and Psomas (2009).
7. Research Limitations and
suggestions for future work
The authors would like to point out the
several limitations of this study:
It was done in a moment in time so
quasi-longitudinal and longitudinal
studies could be useful;
There might be a bias by managers
of the surveyed organizations as
already found in other studies, so
triangulation of data (e.g., with
qualitative research) can be useful;
For future research, the authors suggest
focusing additionally on the motivations,
benefits and obstacles for using Quality
Tools, on surveying also non-certified
organizations and possible studying other
countries.
References:
Ahmed, S., & Hassan, M. (2003). Survey and case investigations on application of quality
management tools and techniques in SMIs. International Journal of Quality &Management,
20(7), 795-826.
Anand, G. (2006). Continuous Improvement and Operations Strategy: Focus on Six Sigma
Programs. The Ohio State University.
ASQ (2015). Quality Tools, Retrieved March, 20, 2015, from http://asq.org/learn-about-
quality/quality-tools.html.
Bamford, D., & Greatbanks, R. (2005). The use of quality management tools and techniques: a
study of application in everyday situations. International Journal of Quality& Reliability
Management, 22(4), 376-392.
Bayazit, O., & Karpak, B. (2007). An analytical network process-based framework for
successful total quality management (TQM): an assessment of Turkish manufacturing
industry readiness. International Journal of Production Economics, 105(1), 79-96.
Boulter, L., Bendell, T., & Dahlgaard, J.J., (2013). Total quality beyond North America: A
comparative analysis of the performance of European Excellence Award winners.
International Journal of Operations and Production Management, 33(2), 197-215.
Bunney, H., & Dale, B. (1997). The implementation of quality management tools and
techniques: a study. The TQM Magazine, 9(3), 183-189.
Page 14
618 L. Fonseca, V. Lima, M. Silva
Chen, S-H., (2013). Integrated analysis of the performance of TQM tools and techniques: a
case study in the Taiwanese motor industry. International Journal of Production Research,
51(4), 1072-1083.
Curkovic, S., Melnyk, S.A., Calantone, R., & Handfield, R.B. (2000). Validating the Malcolm
Baldrige National Quality Framework through structural equation modeling. International
Journal of Production Research, 38(4), 765-791.
Dale, B.G., & McQuater, R. (1998). Managing Business Improvement & Quality:
Implementing Key Tools and Techniques. Blackwell Business, Oxford.
EFQM, (2015). EFQM Model, Retrieved march 29, 2015, from: http://www.efqm.org/efqm-
model/.
Evans, J.R., Lindsay, W.M. (1999). The Management and Control of Quality. South-Western
College Publishing, Cincinnati, OH.
Fonseca, L. (2015). From Quality Gurus and TQM to ISO 9001:2015: a review of several
quality paths. International Journal for Quality Research, 9(1), 167-180.
Fotopoulos, C, & Psomas, E. (2009). The use of quality management tools and techniques in
ISO 9001:2000 certified companies: the Greek case. International Journal of Productivity
and Performance Management, 58(6), 564-580.
Hansson, J., & Eriksson, H. (2002). The impact of TQM on financial performance. Measuring
Business Excellence, 6(4), 44-54.
Hendricks, K., & Singhal, V. (1997). Does implementing an effective TQM program actually
improve operating performance? Empirical evidence from firms that have won quality
awards. Management Science, 43(9), 1258-1274.
Heras, I., (2006). How quality management models influence company results. Total Quality
Management & Business Excellence, 17(6), 775-794.
IAPMEI. (without date). EIC PME. Retrieved February 15, 2014, from:
http://www.eicpme.iapmei.pt/eicpme_faq_02.php?tema=7#104.
Ishikawa,K. (1976). Guide to Quality Control. Asian Productivity Organization.
Ismyrlis, V., & Moschidis, O. (2015). The use of quality management systems, tools, and
techniques in ISO 9001:2008 certified companies with multidimensional statistics: the Greek
case. Total Quality Management & Business Excellence, 26(5-6), 497-514.
ISO, (2014). ISO Survey 2013. Retrieved October, 01, 2014, from: http://www.iso.org.
ISO, ISOTC 176, Retrieved October, 01, 2014, from:
http://www.iso.org/iso/iso_technical_committee?commid=53882.
Jacob, R., Madu, C., N., & Tang, C. (2004). An empirical assessment of the financial
performance of Malcolm Baldrige Award winners. International Journal of Quality &
Reliability Management, 21(8), 897-914.
Linderman, K., Schroeder, R., Zaheer, S., & Choo, A. (2003). Six Sigma: A goal theoretic
perspective. Journal of Operations Management, 21, 193-203.
Marconi, M., & Lakatos, E.M. (2003). Fundamentos de Metodologia Científica - 5ª Ed. São
Paulo: Atlas.
McQuater, R., Scurr, C., Dale, B., & Hillman, P. (1995). Using quality tools and techniques
successfully, The TQM Magazine, 7(6), 37-42.
Okes, D. (2002). Organise your quality tool belt. Quality Progress, (July), 25-29.
Page 15
619
Powell, T.C. (1995). TQM as competitive advantage: A review and empirical study. Strategic
Management Journal, 16(1), 15-37.
Pyo, S. (2005). Choosing Quality Tools, Journal of Quality Assurance in Hospitality &
Tourism, 6 (1-2), 1-8.
Saraph, J.V., Benson, P.G., & Schroeder, R.G., (1989). An instrument for measuring the
critical factors of quality management. Decision Sciences, 20(4), 810-829.
Sila, I., & Ebrahimpour, M. (2005). Critical linkages among TQM factors and business results.
International Journal of Operations & Production Management, 25(11), 1123-1155.
Sila, L. (2007). Examining the effects of contextual factors on TQM and performance through
the lens of organizational theories: an empirical study. Journal of Operations Management,
25(1), 83-109.
Sousa, S.D., Aspinwall, E., Sampaio, P., & Guimarães, A.R. (2005). Performance measures
and quality tools in Portuguese small and medium enterprises: survey results. Total Quality
Management & Business Excellence, 16(2), 277-307.
Stock, G.N., McFadden, K.L., & Gowen III, C.R., (2007). Organizational culture, critical
success factors, and the reduction of hospital errors. International Journal of Production
Economics, 106(2), 368-392.
Tague, N.R. (2004). The Quality Toolbox, Second Edition . ASQ Quality Press.
Tarí, J.J., & Sabater, V. (2004). Quality tools and techniques: Are they necessary for quality
management? International Journal of Production Economics, 92, 267-280.
Tarí, J.J., Molina-Azorín, J.F., & Heras, I. (2012). Benefits of the ISO 9001 and ISO 14001
standards: A literature review. Journal of Industrial Engineering and Management, 5(2),
297-322.
Wilkinson, A., Redman, T., Snape, E., & Marchington, M. (1998). Managing With Total
Quality Management: Theory and Practice. MacMillan, London.
Luis Fonseca ISEP - IPP,
School of Engineering –
Polytechnic of Porto
Portugal
[email protected]
Vanda Lima ESTGF-IPP,
School of Technology and
Management of Felgueiras
Polytechnic Institute of Porto
and CIICESI
Portugal
[email protected]
Manuela Silva ISEP - IPP,
School of Engineering –
Polytechnic of Porto
Portugal
[email protected]
Page 16
620 L. Fonseca, V. Lima, M. Silva


![In Vitro Propagation of Endangered Orchid, Vanda pumila …Six species of Vanda, including Vanda pumila have been recorded in Nepal [5] and its synonym is Trudelia pumila. V. pumila,](https://static.documents.pub/doc/80x56/60be9c2415870d4b68400036/in-vitro-propagation-of-endangered-orchid-vanda-pumila-six-species-of-vanda-including.jpg)


