216
Unaudited semi-annual report as at 30th September 2010 FUND PARTNERS Société d'Investissement à Capital Variable with multiple sub-funds Luxembourg R.C.S. Luxembourg B 86 828

Unaudited semi-annual report as at 30th September 2010
FUND PARTNERS Société d'Investissement à Capital Variable with multiple sub-funds Luxembourg
R.C.S. Luxembourg B 86 828

No subscription can be received on the basis of this financial report. Subscriptions are only valid if made on the basis of the current issue prospectus, accompanied by the simplified prospectus and by the subscription form supplemented by the latest annual report and the most recent semi-annual report, if published thereafter.
FUND PARTNERS
Contents
1
Organisation .....................................................................................................................................................6
General information .........................................................................................................................................9
Financial climate.............................................................................................................................................19
Statement of net assets .................................................................................................................................28
Statistical information....................................................................................................................................62
FUND PARTNERS CSOB World Click Plus 7...............................................................................................99 Statement of investments and other net assets ...........................................................................................99
FUND PARTNERS CSOB World Click Plus 14...........................................................................................100 Statement of investments and other net assets .........................................................................................100
FUND PARTNERS CSOB Click Program 1.................................................................................................101 Statement of investments and other net assets .........................................................................................101
FUND PARTNERS CSOB Click Program 4.................................................................................................102 Statement of investments and other net assets .........................................................................................102
FUND PARTNERS CSOB Click Program 5.................................................................................................103 Statement of investments and other net assets .........................................................................................103
FUND PARTNERS CSOB Click Program 6.................................................................................................104 Statement of investments and other net assets .........................................................................................104
FUND PARTNERS CSOB World Click Plus 18...........................................................................................105 Statement of investments and other net assets .........................................................................................105
FUND PARTNERS CSOB World Click EUR Plus 4 ....................................................................................106 Statement of investments and other net assets .........................................................................................106
FUND PARTNERS CSOB Europe Click Plus 3...........................................................................................107 Statement of investments and other net assets .........................................................................................107
FUND PARTNERS CSOB World Click Plus 19...........................................................................................108 Statement of investments and other net assets .........................................................................................108
FUND PARTNERS CSOB World Click Plus 20...........................................................................................109 Statement of investments and other net assets .........................................................................................109
FUND PARTNERS CSOB World Click Plus 21...........................................................................................110 Statement of investments and other net assets .........................................................................................110
FUND PARTNERS CSOB World Click Plus 22...........................................................................................111 Statement of investments and other net assets .........................................................................................111
FUND PARTNERS CSOB World Click Plus 23...........................................................................................112 Statement of investments and other net assets .........................................................................................112
FUND PARTNERS CSOB World Click Plus 24...........................................................................................113 Statement of investments and other net assets .........................................................................................113
FUND PARTNERS CSOB World Click USD Plus 6 ....................................................................................114 Statement of investments and other net assets .........................................................................................114
FUND PARTNERS CSOB World Growth Plus 1.........................................................................................115 Statement of investments and other net assets .........................................................................................115
FUND PARTNERS CSOB Europe Real Estate Growth Plus 1 ..................................................................116 Statement of investments and other net assets .........................................................................................116
FUND PARTNERS CSOB World Growth Plus 9.........................................................................................117 Statement of investments and other net assets .........................................................................................117

FUND PARTNERS
Contents (continued)
2
FUND PARTNERS CSOB Europe Growth Plus 2 ......................................................................................118 Statement of investments and other net assets .........................................................................................118
FUND PARTNERS CSOB Global Growth Plus 1........................................................................................119 Statement of investments and other net assets .........................................................................................119
FUND PARTNERS CSOB Global Growth Plus 2........................................................................................120 Statement of investments and other net assets .........................................................................................120
FUND PARTNERS CSOB Global Growth Plus 3........................................................................................121 Statement of investments and other net assets .........................................................................................121
FUND PARTNERS CSOB US Growth Plus USD 1 .....................................................................................122 Statement of investments and other net assets .........................................................................................122
FUND PARTNERS CSOB World Growth Plus EUR 1 ................................................................................123 Statement of investments and other net assets .........................................................................................123
FUND PARTNERS CSOB Central Europe Winners 2 ................................................................................124 Statement of investments and other net assets .........................................................................................124
FUND PARTNERS CSOB China Winners 1 ................................................................................................125 Statement of investments and other net assets .........................................................................................125
FUND PARTNERS CSOB Asian Growth 2..................................................................................................126 Statement of investments and other net assets .........................................................................................126
FUND PARTNERS Warta Financials 1 ........................................................................................................127 Statement of investments and other net assets .........................................................................................127
FUND PARTNERS Warta Pharma 1 ............................................................................................................128 Statement of investments and other net assets .........................................................................................128
FUND PARTNERS CSOB Global Growth Plus 4........................................................................................129 Statement of investments and other net assets .........................................................................................129
FUND PARTNERS CSOB Global Growth Plus 5........................................................................................130 Statement of investments and other net assets .........................................................................................130
FUND PARTNERS CSOB Sustainables 1 ...................................................................................................131 Statement of investments and other net assets .........................................................................................131
FUND PARTNERS CSOB Asian Growth 3..................................................................................................132 Statement of investments and other net assets .........................................................................................132
FUND PARTNERS CSOB Asian Growth 4..................................................................................................133 Statement of investments and other net assets .........................................................................................133
FUND PARTNERS CSOB Asian Winners 1 ................................................................................................134 Statement of investments and other net assets .........................................................................................134
FUND PARTNERS CSOB Asian Winners 2 ................................................................................................135 Statement of investments and other net assets .........................................................................................135
FUND PARTNERS Kredyt Bank Conservative 4........................................................................................136 Statement of investments and other net assets .........................................................................................136
FUND PARTNERS Kredyt Bank Conservative 5........................................................................................137 Statement of investments and other net assets .........................................................................................137
FUND PARTNERS Kredyt Bank Conservative 6........................................................................................138 Statement of investments and other net assets .........................................................................................138
FUND PARTNERS Kredyt Bank Financials 1.............................................................................................139 Statement of investments and other net assets .........................................................................................139

FUND PARTNERS
Contents (continued)
3
FUND PARTNERS Kredyt Bank Central European Winners 1 .................................................................140 Statement of investments and other net assets .........................................................................................140
FUND PARTNERS Kredyt Bank Conservative 7........................................................................................141 Statement of investments and other net assets .........................................................................................141
FUND PARTNERS Kredyt Bank BRIC 1......................................................................................................142 Statement of investments and other net assets .........................................................................................142
FUND PARTNERS Centea Distri Opportunity 1.........................................................................................143 Statement of investments and other net assets .........................................................................................143
FUND PARTNERS Centea Distri Opportunity 2.........................................................................................144 Statement of investments and other net assets .........................................................................................144
FUND PARTNERS CSOB Rastovy Plus SKK 3..........................................................................................145 Statement of investments and other net assets .........................................................................................145
FUND PARTNERS CSOB Reality SKK 1.....................................................................................................146 Statement of investments and other net assets .........................................................................................146
FUND PARTNERS CSOB World Tree 3 ......................................................................................................147 Statement of investments and other net assets .........................................................................................147
FUND PARTNERS CSOB World Tree SKK 1..............................................................................................148 Statement of investments and other net assets .........................................................................................148
FUND PARTNERS CSOB World Tree CZK 1 ..............................................................................................149 Statement of investments and other net assets .........................................................................................149
FUND PARTNERS World Tree USD 1 .........................................................................................................150 Statement of investments and other net assets .........................................................................................150
FUND PARTNERS CSOB World Tree 4 ......................................................................................................151 Statement of investments and other net assets .........................................................................................151
FUND PARTNERS CSOB World Tree 5 ......................................................................................................152 Statement of investments and other net assets .........................................................................................152
FUND PARTNERS CSOB World Tree 6 ......................................................................................................153 Statement of investments and other net assets .........................................................................................153
FUND PARTNERS CSOB World Tree 7 ......................................................................................................154 Statement of investments and other net assets .........................................................................................154
FUND PARTNERS CSOB World Tree 8 ......................................................................................................155 Statement of investments and other net assets .........................................................................................155
FUND PARTNERS CSOB World Tree EUR 1..............................................................................................156 Statement of investments and other net assets .........................................................................................156
FUND PARTNERS CSOB World Tree 9 ......................................................................................................157 Statement of investments and other net assets .........................................................................................157
FUND PARTNERS CSOB World Tree 10 ....................................................................................................158 Statement of investments and other net assets .........................................................................................158
FUND PARTNERS CSOB Strom SKK 2 ......................................................................................................159 Statement of investments and other net assets .........................................................................................159
FUND PARTNERS CSOB Strom SKK 5 ......................................................................................................160 Statement of investments and other net assets .........................................................................................160
FUND PARTNERS CSOB World Tree 11 ....................................................................................................161 Statement of investments and other net assets .........................................................................................161
FUND PARTNERS
Contents (continued)
4
FUND PARTNERS CSOB World Tree 12 ....................................................................................................162 Statement of investments and other net assets .........................................................................................162
FUND PARTNERS CSOB Staircase Click 1................................................................................................163 Statement of investments and other net assets .........................................................................................163
FUND PARTNERS NLB SKLADI - GARANTIRANI SKLAD EVROPA 1 ....................................................164 Statement of investments and other net assets .........................................................................................164
FUND PARTNERS CSOB Asian Growth 1..................................................................................................165 Statement of investments and other net assets .........................................................................................165
FUND PARTNERS CSOB Central Europe Winners 1 ................................................................................166 Statement of investments and other net assets .........................................................................................166
FUND PARTNERS CSOB Stock Selection Short Term 4 ..........................................................................167 Statement of investments and other net assets .........................................................................................167
FUND PARTNERS Kredyt Bank Asia 1.......................................................................................................168 Statement of investments and other net assets .........................................................................................168
FUND PARTNERS Kredyt Bank Sustainables 1 ........................................................................................169 Statement of investments and other net assets .........................................................................................169
FUND PARTNERS NLB Skladi - Garantirani sklad Azija 1 .......................................................................170 Statement of investments and other net assets .........................................................................................170
FUND PARTNERS Warta High Dividend Europe 1....................................................................................171 Statement of investments and other net assets .........................................................................................171
FUND PARTNERS CSOB World Growth Plus 11.......................................................................................172 Statement of investments and other net assets .........................................................................................172
FUND PARTNERS CSOB World Growth Plus 12.......................................................................................173 Statement of investments and other net assets .........................................................................................173
FUND PARTNERS Kredyt Bank Optimised Europe Participation 1 ........................................................174 Statement of investments and other net assets .........................................................................................174
FUND PARTNERS Kredyt Bank Global Real Estate 1...............................................................................175 Statement of investments and other net assets .........................................................................................175
FUND PARTNERS CSOB World Growth Plus 13.......................................................................................176 Statement of investments and other net assets .........................................................................................176
FUND PARTNERS CSOB World Growth Plus 14.......................................................................................177 Statement of investments and other net assets .........................................................................................177
FUND PARTNERS CSOB World Growth Plus 15.......................................................................................178 Statement of investments and other net assets .........................................................................................178
FUND PARTNERS CSOB World Growth Plus 16.......................................................................................179 Statement of investments and other net assets .........................................................................................179
FUND PARTNERS CSOB Short Term Growth 5 ........................................................................................180 Statement of investments and other net assets .........................................................................................180
FUND PARTNERS CSOB Short Term Growth 6 ........................................................................................181 Statement of investments and other net assets .........................................................................................181
FUND PARTNERS CSOB Financials Short Term Growth 1......................................................................182 Statement of investments and other net assets .........................................................................................182
FUND PARTNERS CSOB Europe Real Estate Growth Plus 2 ..................................................................183 Statement of investments and other net assets .........................................................................................183

FUND PARTNERS
Contents (continued)
5
FUND PARTNERS CSOB Pharma & Biotech 1 ..........................................................................................184 Statement of investments and other net assets .........................................................................................184
FUND PARTNERS Warta Asia 2 ..................................................................................................................185 Statement of investments and other net assets .........................................................................................185
FUND PARTNERS Kredyt Bank Europe Real Estate 2 .............................................................................186 Statement of investments and other net assets .........................................................................................186
FUND PARTNERS Kredyt Bank Global Real Estate 2...............................................................................187 Statement of investments and other net assets .........................................................................................187
FUND PARTNERS Warta Infrastructure 1 ..................................................................................................188 Statement of investments and other net assets .........................................................................................188
FUND PARTNERS CSOB Performance Lock 1..........................................................................................189 Statement of investments and other net assets .........................................................................................189
FUND PARTNERS CSOB Bull & Bear 1......................................................................................................190 Statement of investments and other net assets .........................................................................................190
FUND PARTNERS Kredyt Bank Variable Participation 1 .........................................................................191 Statement of investments and other net assets .........................................................................................191
Notes to the financial statements ...............................................................................................................192

FUND PARTNERS
6
Organisation
Registered office 11, rue Aldringen L-1118 LUXEMBOURG Board of Directors Chairman Antoon TERMOTE President of the Executive Committee KBC ASSET MANAGEMENT S.A. 2, avenue du Port B-1080 BRUSSELS Directors Karel DE CUYPER Head of KBC ASSET MANAGEMENT S.A. 5, place de la Gare L-1616 LUXEMBOURG Wouter VANDEN EYNDE Managing Director
KBC ASSET MANAGEMENT S.A. 2, avenue du Port B-1080 BRUSSELS (since 1st September 2010) Michaël WENSELAERS Senior Portfolio Manager KBC ASSET MANAGEMENT S.A. 5, place de la Gare
L-1616 LUXEMBOURG (since 1st September 2010) Wim ALLEGAERT Global Head International Development
KBC ASSET MANAGEMENT S.A. 2, avenue du Port B-1080 BRUSSELS (until 1st April 2010) Ignace VAN OORTEGEM Director Securities Processing KBC ASSET MANAGEMENT S.A. 2, avenue du Port B-1080 BRUSSELS (until 1st September 2010) Management Company and central administration KBC ASSET MANAGEMENT S.A. 5, place de la Gare L-1616 LUXEMBOURG

FUND PARTNERS
Organisation (continued)
7
Board of Directors of the Management Company Chairman Danny DE RAYMAEKER Managing Director KBC GROUP S.A. 2, avenue du Port B-1080 BRUSSELS Directors Ivo BAUWENS General Manager ASSURISK S.A. 5, place de la Gare L-1616 LUXEMBOURG (since 30th July 2010) Marc STEVENS General Manager VITIS LIFE S.A. 7, boulevard Royal L-2018 LUXEMBOURG Antoon TERMOTE President of the Executive Committee KBC ASSET MANAGEMENT S.A. 2, avenue du Port B-1080 BRUSSELS Wouter VANDEN EYNDE Managing Director KBC ASSET MANAGEMENT S.A. 2, avenue du Port B-1080 BRUSSELS Ignace VAN OORTEGEM Director Securities Processing KBC ASSET MANAGEMENT S.A. 2, avenue du Port B-1080 BRUSSELS Conducting officers of the Management Company Karel DE CUYER Antoon TERMOTE Ignace VAN OORTEGEM Delegated central administration KREDIETRUST LUXEMBOURG S.A. 11, rue Aldringen L-2960 LUXEMBOURG Custodian and principal paying agent KBL EUROPEAN PRIVATE BANKERS S.A. 43, boulevard Royal L-2955 LUXEMBOURG

FUND PARTNERS
Organisation (continued)
8
Réviseur d'entreprises agréé DELOITTE S.A. 560, rue de Neudorf L-2220 LUXEMBOURG Financial services providers in Luxembourg KBL EUROPEAN PRIVATE BANKERS S.A. 43, boulevard Royal L-2955 LUXEMBOURG
in Belgium
CENTEA S.A. 180, Mechelsesteenweg B-2018 ANTWERP in Czech Republic
ČESKOSLOVENSKÁ OBCHODNÍ BANKA, A.S. Radlická 333/150 CZ-15057 PRAGUE 5
in Slovakia
CESKOSLOVENSKA OBCHODNA BANKA, A.S. Michalska 18 SK-815 63 BRATISLAVA in Hungary
K&H BANK ZRT. Vigado tér 1 H-1051 BUDAPEST in Slovenia NLB SKLADI, UPRAVLJANJE PREMOŽENJA, D.O.O. - NLB FUNDS, ASSET MANAGEMENT, D.O.O. Trg republike 3 SI-1000 LJUBLJANA NOVA LJUBLJANSKA BANKA D.D., LJUBLJANA Trg republike 2 SI-1520 LJUBLJANA
FUND PARTNERS
9
General information
FUND PARTNERS (the "SICAV") is an open-ended investment company under Luxembourg law subject to Part I of the amended Law of 20th December 2002 on undertakings for collective investment. The SICAV’s shares are divided up into different categories, each corresponding to a separate pool of assets (the sub-funds). The SICAV may issue shares in capital-protected sub-funds, as well as in sub-funds that adhere to an investment policy that does not afford capital protection. The objective of the investment policy of the capital-protected sub-funds is to allow shareholders to benefit from the positive evolution of the Index or Basket at Maturity or during a pre-determined period, on the understanding that the shareholders should be able to recover the capital initially invested in the SICAV (net of costs, charges, fees, taxes and any other levies) at the end of this period and that any participation in the increase in the value of the Index or the Basket should accrue to them in accordance with the investment policy of each sub-fund described in the Appendix of the Prospectus. The investment policy of sub-funds without capital protection is to invest the assets of the sub-fund belonging to the SICAV in securities, especially those denominated in the reference currency of the sub-fund in question. At the date of the report, the SICAV offers the following sub-funds (only capital protected sub-funds):
Sub-funds with a "Best of Capitalisation" structure
- FUND PARTNERS CSOB World Click Plus 7 in CZK - FUND PARTNERS CSOB World Click Plus 14 in CZK - FUND PARTNERS CSOB Click Program 1 in CZK
- FUND PARTNERS CSOB Click Program 4 in CZK - FUND PARTNERS CSOB Click Program 5 in CZK - FUND PARTNERS CSOB Click Program 6 in CZK
- FUND PARTNERS CSOB World Click Plus 18 in CZK - FUND PARTNERS CSOB World Click EUR Plus 4 in EUR - FUND PARTNERS CSOB Europe Click Plus 3 in EUR
- FUND PARTNERS CSOB World Click Plus 19 in CZK - FUND PARTNERS CSOB World Click Plus 20 in CZK - FUND PARTNERS CSOB World Click Plus 21 in CZK
- FUND PARTNERS CSOB World Click Plus 22 in CZK - FUND PARTNERS CSOB World Click Plus 23 in CZK - FUND PARTNERS CSOB World Click Plus 24 in CZK
- FUND PARTNERS CSOB World Click USD Plus 6 in USD Sub-funds with a "Best of Maximum Capitalisation" structure - FUND PARTNERS CSOB World Growth Plus 1 in CZK
- FUND PARTNERS CSOB Europe Real Estate Growth Plus 1 in CZK - FUND PARTNERS CSOB World Growth Plus 9 in CZK - FUND PARTNERS CSOB Europe Growth Plus 2 in CZK
- FUND PARTNERS CSOB Global Growth Plus 1 in CZK - FUND PARTNERS CSOB Global Growth Plus 2 in CZK - FUND PARTNERS CSOB Global Growth Plus 3 in CZK
- FUND PARTNERS CSOB US Growth Plus USD 1 in USD - FUND PARTNERS CSOB World Growth Plus EUR 1 in EUR - FUND PARTNERS CSOB Central Europe Winners 2 in CZK
- FUND PARTNERS CSOB China Winners 1 in CZK - FUND PARTNERS CSOB Asian Growth 2 in CZK - FUND PARTNERS Warta Financials 1 in PLN
- FUND PARTNERS Warta Pharma 1 in PLN - FUND PARTNERS CSOB Global Growth Plus 4 in CZK - FUND PARTNERS CSOB Global Growth Plus 5 in CZK - FUND PARTNERS CSOB Sustainables 1 in CZK

FUND PARTNERS
General information (continued)
10
- FUND PARTNERS CSOB Asian Growth 3 in CZK
- FUND PARTNERS CSOB Asian Growth 4 in CZK - FUND PARTNERS CSOB Asian Winners 1 in CZK - FUND PARTNERS CSOB Asian Winners 2 in CZK
- FUND PARTNERS Kredyt Bank Conservative 4 in PLN - FUND PARTNERS Kredyt Bank Conservative 5 in PLN - FUND PARTNERS Kredyt Bank Conservative 6 in PLN
- FUND PARTNERS Kredyt Bank Financials 1 in PLN - FUND PARTNERS Kredyt Bank Central European Winners 1 in PLN - FUND PARTNERS Kredyt Bank Conservative 7 in PLN
- FUND PARTNERS Kredyt Bank BRIC 1 in PLN Sub-funds with a "Cliquet Large Digital Distribution" structure - FUND PARTNERS Centea Distri Opportunity 1 in EUR - FUND PARTNERS Centea Distri Opportunity 2 in EUR Sub-funds with a "Minimum Capitalisation" structure - FUND PARTNERS CSOB Europe Growth 2 in EUR - FUND PARTNERS CSOB Rastovy Plus SKK 3 in EUR Sub-funds with a "Plain Vanilla" structure - FUND PARTNERS CSOB World Growth 2 in CZK - FUND PARTNERS CSOB Reality SKK 1 in EUR Sub-funds with a "Cliquet Tree Capitalisation" structure - FUND PARTNERS CSOB World Tree 3 in CZK - FUND PARTNERS CSOB World Tree SKK 1 in EUR
- FUND PARTNERS CSOB World Tree CZK 1 in CZK - FUND PARTNERS World Tree USD 1 in USD - FUND PARTNERS CSOB World Tree 4 in CZK
- FUND PARTNERS CSOB World Tree 5 in CZK - FUND PARTNERS CSOB World Tree 6 in CZK - FUND PARTNERS CSOB World Tree 7 in CZK
- FUND PARTNERS CSOB World Tree 8 in CZK - FUND PARTNERS CSOB World Tree EUR 1 in EUR - FUND PARTNERS CSOB World Tree 9 in CZK
- FUND PARTNERS CSOB World Tree 10 in CZK - FUND PARTNERS CSOB Strom SKK 2 in EUR - FUND PARTNERS CSOB Strom SKK 5 in EUR
- FUND PARTNERS CSOB World Tree 11 in CZK - FUND PARTNERS CSOB World Tree 12 in CZK Sub-fund with a "Step Down" structure
- FUND PARTNERS CSOB Staircase Click 1 in CZK Sub-funds with a "Best of Unlimited Capitalisation" structure - FUND PARTNERS NLB SKLADI - GARANTIRANI SKLAD EVROPA 1 in EUR
- FUND PARTNERS CSOB Asian Growth 1 in CZK - FUND PARTNERS CSOB Central Europe Winners 1 in CZK - FUND PARTNERS CSOB Stock Selection Short Term 4 in CZK
- FUND PARTNERS Kredyt Bank Asia 1 in PLN - FUND PARTNERS Kredyt Bank Sustainables 1 in PLN - FUND PARTNERS NLB Skladi - Garantirani sklad Azija 1 in USD
- FUND PARTNERS Warta High Dividend Europe 1 in PLN - FUND PARTNERS CSOB World Growth Plus 11 in CZK - FUND PARTNERS CSOB World Growth Plus 12 in CZK
- FUND PARTNERS Kredyt Bank Optimised Europe Participation 1 in PLN - FUND PARTNERS Kredyt Bank Global Real Estate 1 in PLN - FUND PARTNERS CSOB World Growth Plus 13 in CZK
- FUND PARTNERS CSOB World Growth Plus 14 in CZK - FUND PARTNERS CSOB World Growth Plus 15 in CZK - FUND PARTNERS CSOB World Growth Plus 16 in CZK
- FUND PARTNERS CSOB Short Term Growth 5 in CZK - FUND PARTNERS CSOB Short Term Growth 6 in CZK

FUND PARTNERS
General information (continued)
11
- FUND PARTNERS CSOB Financials Short Term Growth 1 in CZK
- FUND PARTNERS CSOB Europe Real Estate Growth Plus 2 in CZK - FUND PARTNERS CSOB Pharma & Biotech 1 in CZK - FUND PARTNERS Warta Asia 2 in PLN
- FUND PARTNERS Kredyt Bank Europe Real Estate 2 in PLN - FUND PARTNERS Kredyt Bank Global Real Estate 2 in PLN - FUND PARTNERS Warta Infrastructure 1 in PLN Sub-funds with a "Performance Lock" structure - FUND PARTNERS CSOB Performance Lock 1 in CZK Sub-funds with a "Best of Bull & Bear" structure
- FUND PARTNERS CSOB Bull & Bear 1 in CZK Sub-funds with a "Best of Variable Participation" structure - FUND PARTNERS Kredyt Bank Variable Participation 1 in PLN
At the date of the report, the following sub-funds have been liquidated:
- FUND PARTNERS CSOB Click Program 2 in CZK (matured on 30th September 2010)
- FUND PARTNERS CSOB World Click Plus 15 in CZK (matured on 30th June 2010) - FUND PARTNERS CSOB World Click Plus 17 in CZK (matured on 31st August 2010)
- FUND PARTNERS CSOB World Click USD Plus 5 in USD (matured on 30th July 2010)
- FUND PARTNERS CSOB Equity Click Plus 2 n EUR (matured on 30th July 2010)
- FUND PARTNERS CSOB Europe Click Plus 2 in EUR (matured on 30th June 2010) - FUND PARTNERS CSOB Europe 1 in EUR (matured on 31st May 2010)
- FUND PARTNERS CSOB World Growth Plus 5 in CZK (matured on 30th June 2010)
- FUND PARTNERS CSOB Europe Growth Plus 1 in CZK (matured on 30th July 2010)
- FUND PARTNERS CSOB Europe Growth 2 in EUR (matured on 30th June 2010) - FUND PARTNERS CSOB World Growth 2 in CZK (matured on 31st May 2010)
- FUND PARTNERS CSOB Equity Plus 3 in EUR (matured on 30th September 2010)
- FUND PARTNERS K&H Hazai Fix 1 Alap in HUF (matured on 31st August 2010)
- FUND PARTNERS CSOB Stock Selection Short Term 2 in CZK (matured on 30th July 2010) - FUND PARTNERS CSOB Stock Selection Short Term 3 in CZK (matured on 30th September 2010)
- FUND PARTNERS CSOB World Growth Plus 10 in CZK (matured on 30th June 2010)
- FUND PARTNERS CSOB Fix Upside 2 in CZK (matured on 30th April 2010)
- FUND PARTNERS CSOB Fix Upside 3 in CZK (matured on 31st August 2010)
The latest annual and semi-annual reports, the issue Prospectus and the Articles of Incorporation are available for inspection from the SICAV’s registered office as well as at the paying banks in the countries where the distribution of the shares is authorised. CAPITAL PROTECTED SUB-FUNDS "Best of Capitalisation" structure Assets in sub-funds with a "Best of Capitalisation" structure are invested with a view to achieving the investment objectives, namely preserving the Initial Subscription Value at Maturity, plus the greater of: either a minimum amount expressed as a percentage of the Initial Subscription Value ("Best Of") (the Initial Subscription Value being defined as the subscription price on subscription during the initial subscription period); or the participation in the change in the value of the Index or Basket. This participation in the change in the value of the Index or Basket implies that if the End Value of the Index or Basket is higher at the end of a Reference Period than the Starting Value of the Index or Basket at the start of that Reference Period, this increase will accrue to the investor. By the same token, if the End Value of the Index or Basket is lower at the end of a Reference Period than the

FUND PARTNERS
General information (continued)
12
Starting Value of the Index or Basket at the start of that Reference Period, this decrease will likewise accrue to the investor. Moreover, any periodic increases will be capped at a maximum percentage and any periodic decreases will likewise be limited to a maximum percentage, or floor. If, during a Reference Period, an increase is realised that exceeds the cap, it will nevertheless be limited to that percentage. If, during a Reference Period, the decrease exceeds the percentage defined as the floor, it will nevertheless be limited to that percentage. At Maturity, the increases and decreases for each Reference Period (limited to the relevant caps and floors) will be added up. If the result of this addition is higher than the minimum amount expressed as a percentage of the Initial Subscription Value, the result will accrue to the sub-fund. If the result of the addition is lower than the minimum amount expressed as a percentage of the Initial Subscription Value, the minimum amount will accrue to the sub-fund. Any increases or decreases in value will be reflected in the net asset value calculated on each Valuation Day. At Maturity, the net asset value upon liquidation will be paid out to the shareholder. If the objectives set out above are met (which is not formally guaranteed), the net asset value upon liquidation will equal the Initial Subscription Value plus either the result of changes in the value of the Index or the minimum amount expressed as a percentage of this Initial Subscription Value. "Best of Maximum Capitalisation" structure Assets in sub-funds with a "Best of Maximum Capitalisation" structure are invested with a view to achieving the investment objectives, namely preserving the Initial Subscription Value at Maturity, plus the greater of:
- either a minimum amount expressed as a percentage of the Initial Subscription Value ("Best Of") (the Initial Subscription Value being defined as the subscription price on subscription during the initial subscription period);
- or the change in the value of the Index or the Basket multiplied by a fixed Participation Rate, the product being limited to a maximum percentage ("Cap").
This participation in the change in the value of the Index or Basket (increase/decrease in the Index or Basket multiplied by the Participation Rate, the product being Capped) implies that if the End Value of the Index or Basket is higher at the end of the Reference Period than the Starting Value of the Index or Basket at the start of the Reference Period, the increase, multiplied by the Participation Rate, will be paid out at Maturity. If the participation in the change in the value of the Index or Basket exceeds the Cap, it will be limited to the Cap and that percentage will be paid out at Maturity. If the participation in the change in the value of the Index or Basket is lower than the "Best Of", the latter percentage will be paid out at Maturity. At Maturity, the net asset value upon liquidation will be paid out to the shareholder. If the objectives set out above are met (which is not formally guaranteed), the net asset value upon liquidation will equal the Initial Subscription Value plus either the result of changes in the value of the Index or Basket multiplied by the Participation Rate (the product being Capped) or the minimum amount expressed as a percentage of this Initial Subscription Value.

FUND PARTNERS
General information (continued)
13
"Cliquet Large Digital Distribution" structure Assets in sub-funds with a "Cliquet Large Digital Distribution" structure are invested with a view to achieving the investment objectives, namely preserving the Initial Subscription Value at Maturity and achieving a capital gain for the entire Reference Period that is dependent on changes in the value of a Basket, according to a "Cliquet Large Digital Distribution" structure. This means that: at the outset, the Basket will contain shares in a certain number of companies. Whenever Scenario 2 (see below) occurs, the number of shares will be reduced. The shares remaining in the Basket after Scenario 2 has possibly taken place during a previous Reference Period will make up the Observation Basket for the Reference Period. The gain for each Reference Period will depend on one of the following two scenarios taking place:
- Scenario 1: the Price of each share in the Observation Basket never drops below a certain Barrier during the Reference Period. In this case, the sub-fund will receive a maximum dividend via the swap that will be paid to the Investor at the end of the Reference Period.
- Scenario 2: the Price of at least one share in the Observation Basket drops below a certain Barrier at least once during the Reference Period. In this case, the sub-fund will receive a minimum dividend via the swap that will be paid to the Investor at the end of the Reference Period. Each time Scenario 2 occurs during a Reference Period, the worst performing share (End Price minus the Starting Price divided by the Starting Price) will be removed from the Observation Basket at the end of the Reference Period.
"Minimum Capitalisation" structure Assets in sub-funds with a "Minimum Capitalisation" structure are invested with a view to achieving the investment objectives, namely preserving the Initial Subscription Value at Maturity, plus:
- a minimum return expressed as a percentage of the Initial Subscription Value ("Minimum Return") (the Initial Subscription Value being defined as follows: the subscription price on subscription during the initial subscription period);
- as well as the increase in the value of the Index or Basket above the Minimum Return, multiplied by a Participation Rate.
Participating in the increase in the value of the Index or Basket implies that if the End Value of the Index or Basket is higher than the Minimum Return, this increase over and above the Minimum Return, multiplied by the Participation Rate, will be paid out at Maturity. A Participation Rate of a pre-defined percentage implies that a pre-defined percentage of the increase in the value of the Index or Basket over and above the Minimum Return will be paid out at Maturity. At Maturity, the net asset value upon liquidation will be paid out to the shareholder. If the objectives set out above are met (which is not necessarily formally guaranteed for all the sub-funds), the net asset value upon liquidation at Maturity will at least equal the Initial Subscription Value plus a minimum return corresponding to a percentage of the Initial Subscription Value (the Minimum Return) and the increase in the value of the Index or Basket over and above the Minimum Return, multiplied by the Participation Rate.
FUND PARTNERS
General information (continued)
14
"Plain Vanilla" structure Assets in sub-funds with a "Plain Vanilla" structure are invested with a view to achieving the investment objectives, namely preserving the Initial Subscription Value at Maturity, plus participating in the increase in value of the Index or Basket. Participating in the increase in the value of the Index or Basket implies that if the End Value of the Index or Basket is higher than the Starting Value, the increase multiplied by the Participation Rate will be paid out at Maturity. A Participation Rate of a pre-defined percentage implies that a pre-defined percentage of the increase in the value of the Index or Basket will be paid out at Maturity. At Maturity, the net asset value upon liquidation will be paid out to the shareholder. If the objectives set out above are met (which is not necessarily formally guaranteed for all the sub-funds), the net asset value upon liquidation at Maturity will at least equal the Initial Subscription Value plus the increase in the value of the Index or Basket, multiplied by the Participation Rate. "Cliquet Tree Capitalisation" structure Assets in sub-funds with a "Cliquet Tree Capitalisation" structure are invested with a view to achieving the investment objectives, namely preserving the Initial Subscription Value at Maturity and realizing a capital gain at Maturity, dependent on changes in the value of a Basket based on a "Cliquet Tree Capitalisation" structure. The "Cliquet Tree Capitalisation" structure is subdivided into Reference Periods. Each Reference Period comprises one or more dates on which the Closing Price of a selection of shares in the Basket ("Observation Basket") is taken into consideration to determine the capital gain to be paid at Maturity ("Observation Dates"). At the end of the first Reference Period, the Observation Basket is the same as the Basket. The Observation Basket is modified according to the scenarios described below. For each Reference Period, a capital gain will accrue according to the following principles:
- at the end of the first Reference Period, a fixed capital gain ("Capital gain for the first Reference Period") will accrue;
- at the end of each of the following Reference Periods, a capital gain will accrue, but the size of the gain will depend on which of the following two scenarios takes place:
- Scenario 1: the Closing Price of none of the shares in the Observation Basket on any of the Observation Dates is below a predetermined percentage of its Starting Price for the first Reference Period (Barrier). In this case, a capital gain will accrue to the sub-fund and be paid to the investor at Maturity that is equal to the capital gain realised during the previous Reference Period, multiplied by a specific factor ("Multiplier"). - Scenario 2: the Closing Price of at least one share in the Observation Basket is below the Barrier on at least one Observation Date. In this case, a capital gain will accrue to the sub-fund and be paid to the investor at Maturity that is equal to the capital gain realised during the previous Reference Period, divided by a specific factor ("Divisor"). Each time Scenario 2 occurs, the worst performing share (End Price for the Reference Period in question minus the Starting Price for the First Reference Period divided by the Starting Price for the First Reference Period) will be removed from the Basket at the end of the Reference Period. As a result, from the end of the second Reference Period, the Observation Basket could contain fewer shares than the Basket. Investors should be aware of the fact that the Basket will become less well diversified if scenario 2 occurs several times.

FUND PARTNERS
General information (continued)
15
At Maturity, the capital gains that have accrued for each Reference Period will be added up. The capital gains accrued will be reflected in the net asset value calculated on each Valuation Day. At Maturity, the net asset value upon liquidation will be paid out to the shareholder. If the objectives set out above are met (which is not formally guaranteed), the net asset value upon liquidation will be equal to the Initial Subscription Value plus the sum of the capital gains accrued for each Reference Period. "Step Down" structure Assets in sub-funds with a "Step Down" structure are invested with a view to achieving the investment objectives, namely preserving the Initial Subscription Value at Maturity, plus:
- either a minimum return expressed as a percentage of the Initial Subscription Value ("Minimum Return") (the Initial Subscription Value being defined as the subscription price on subscription during the initial subscription period);
- an amount in bonuses, expressed as a percentage of the Initial Subscription Value ("Total Bonuses") (the Initial Subscription Value being defined as above).
The Total Bonuses equal the aggregated percentages determined for each Reference Period according to the "Step Down" structure. The percentage for each Reference Period (the "Bonus") will depend on how many individual components of the Basket (shares or Indices) have a lower End Price/Value than Starting Price/Value for the first Reference Period. These percentages will be specified in the investment policy for each sub-fund. At Maturity, the Total Bonuses will be calculated. If the result of the addition is lower than the minimum return expressed as a percentage of the Initial Subscription Value, the minimum return will accrue to the sub-fund. At Maturity, the net asset value upon liquidation will be paid out to the shareholder. If the objectives set out above are met (which is not necessarily formally guaranteed for all the sub-funds), the net asset value upon liquidation at Maturity will at least equal the Initial Subscription Value plus the Minimum Return or the Total Bonuses. "Best of Unlimited Capitalisation" structure Assets in sub-funds with a "Best of Unlimited Capitalisation" structure are invested with a view to achieving the investment objectives, namely preserving the Initial Subscription Value at Maturity, plus the greater of:
- either a minimum return expressed as a percentage of the Initial Subscription Value ("Best Of") (the Initial Subscription Value being defined as the subscription price on subscription during the initial subscription period);
- or the change in the value of the Index or Basket, multiplied by a Participation Rate.
This participation in the change in the value of the Index or Basket (increase/decrease in the Index or Basket multiplied by the Participation Rate) implies that if the End Value of the Index or Basket is higher at the end of the Reference Period than the Starting Value of the Index or Basket at the start of the Reference Period, the increase, multiplied by the Participation Rate, will be paid out at Maturity. If the participation in the change in the value of the Index or Basket is lower than the "Best Of", the "Best Of" will be paid out at Maturity.
FUND PARTNERS
General information (continued)
16
At Maturity, the net asset value upon liquidation will be paid out to the shareholder. If the objectives set out above are met (which is not formally guaranteed), the net asset value on distribution will equal the Initial Subscription Value plus either the result of changes in the value of the Index or Basket multiplied by the Participation Rate, or the minimum return expressed as a percentage of this Initial Subscription Value. "Performance Lock" structure Assets in sub-funds with a "Performance Lock" structure are invested with a view to achieving the investment objectives, namely preserving the Initial Subscription Value at Maturity, plus the greater of either:
- a minimum return expressed as a percentage of the Initial Subscription Value ("Best Of") (the Initial Subscription Value being defined as the subscription price on subscription during the initial subscription period); or,
- the possible increase in the value of the Basket determined by means of the "Performance Lock" structure.
The "Performance Lock" structure implies that - at Maturity - the possible increase of the Basket is paid out whereby the level of increase of the Basket is determined by comparing the Performance Lock End Value (as defined below) of the Basket with the Starting Value of the Basket. The Performance Lock End Value of the Basket is calculated on a weighted average (weight at start) basis whereby the End Values of the shares or indices of the Basket are determined as follows:
- If on any of a predetermined number of dates (the "Observation Dates") including the final
Observation Date, the Closing Value of a share or index of the Basket relative to at least one Observation Date is equal to or higher than a pre-defined percentage (the "Performance Lock Ladder") of its Starting Value, then this Closing Value is replaced by Y% (the "Performance Lock Share Value") of its Starting Value for the purpose of calculation of the Performance Lock End Value of the Basket;
- Otherwise, the Closing Value of the share or index relative to the final Observation Date is taken into account for the purpose of calculation of the Performance Lock End Value of the Basket.
Note that, according to the investment policy for certain sub-funds, the "Best Of" may equal 0. As for the sub-funds without any formal guarantee If the objectives set out above are met (which will thus not be formally guaranteed for these sub-funds), the net asset value upon liquidation will equal the Initial Subscription Value plus either the result of increase in the value of the Basket determined by means of the "Performance Lock" structure or the minimum return expressed as a percentage of this Initial Subscription Value. Due to the objective of preserving the Initial Subscription Value at Maturity, the minimum capital gain at Maturity is at least 0%.
As for the sub-funds affording a formal guarantee regarding the preservation of the Initial Subscription Value If the objectives set out above are met (which will only be formally guaranteed for these sub-funds as far as the preservation of the Initial Subscription Value is concerned), the net asset value upon liquidation will equal the Initial Subscription Value plus either the result of increase in the value of the Basket determined by means of the "Performance Lock" structure or the minimum return expressed as a percentage of this Initial Subscription Value.

FUND PARTNERS
General information (continued)
17
"Best of Bull & Bear" structure Assets in sub-funds with a "Best of Bull & Bear" structure are invested with a view to achieving the investment objectives, namely preserving the Initial Subscription Value at Maturity, plus the greater of either:
- a minimum return expressed as a percentage of the Initial Subscription Value ("Best Of") (the Initial Subscription Value being defined as the subscription price on subscription during the initial subscription period);
- the increase of the Index or Basket, multiplied by a participation rate ("Participation Rate Increase");
- the absolute value of the decrease of the Index or Basket, multiplied by a participation rate ("Participation Rate Decrease").
The participation in the increase in the value of the Index or Basket (increase in the Index or Basket multiplied by the Participation Rate Increase) implies that if the End Value of the Index or Basket is higher at the end of the Reference Period than the Starting Value of the Index or Basket at the start of the Reference Period, the increase, multiplied by the Participation Rate Increase, will be paid out at Maturity. However, if the participation in the increase in the value of the Index or Basket is lower than the "Best Of", the "Best Of" will be paid out at Maturity. The participation in the decrease in the value of the Index or Basket (decrease of the Index or Basket multiplied by the Participation Rate Decrease) implies that if the End Value of the Index or Basket is lower at the end of the Reference Period than the Starting Value of the Index or Basket at the start of the Reference Period, the absolute value of the decrease, multiplied by the Participation Rate Decrease, will be paid out at Maturity. However, if the participation in the decrease in the value of the Index or Basket is lower than the "Best Of", the "Best Of" will be paid out at Maturity. Note that, according to the investment policy for certain sub-funds, the "Best Of" may equal 0. As for the sub-funds without any formal guarantee If the objectives set out above are met (which is not formally guaranteed), the net asset value upon liquidation will equal the Initial Subscription Value plus either the minimum return expressed as a percentage of this Initial Subscription Value or the increase in the value of the Index or Basket multiplied by the Participation Rate Increase or the absolute value of the decrease in the value of the Index or Basket multiplied by the Participation Rate Decrease. Due to the objective of preserving the Initial Subscription Value at Maturity, the Best Of at Maturity is at least 0%. As for the sub-funds affording a formal guarantee regarding the preservation of the Initial Subscription Value If the objectives set out above are met (which will only be formally guaranteed for these sub-funds as far as the preservation of the Initial Subscription Value is concerned), the net asset value upon liquidation will equal the Initial Subscription Value plus either the minimum return expressed as a percentage of this Initial Subscription Value or the increase in the value of the Index or Basket multiplied by the Participation Rate Increase or the absolute value of the decrease in the value of the Index or Basket multiplied by the Participation Rate Decrease.

FUND PARTNERS
General information (continued)
18
"Best of Variable Participation" structure Assets in sub-funds with a "Best of Variable Participation" structure are invested with a view to achieving the investment objectives, namely preserving the Initial Subscription Value at Maturity, plus the greater of:
- a minimum return expressed as a percentage of the Initial Subscription Value ("Best Of") (the Initial Subscription Value being defined as the subscription price on subscription during the initial subscription period);
- or the result of the participation in the increase of the Index or Basket . The result of the participation in the increase of the Index or Basket equals the sum of two returns, "Return 1" and "Return 2".
- Return 1 equals the increase (if any) in the value of the Index or Basket (calculated as: End Value minus Starting Value, the result of which is divided by Starting Value) upto a predetermined level (the "Barrier"), multiplied by a predetermined percentage (the "Participation Rate below Barrier").
- Return 2 equals the increase (if any) in the value of the Index or Basket above the Barrier (calculated as: End Value minus (Starting Value + Barrier), whereby the overall result of this calculation is divided by Starting Value), multiplied by a predetermined percentage (the "Participation Rate above Barrier").
Note that, according to the investment policy for certain sub-funds, the "Best Of" may equal 0. As for the sub-funds without any formal guarantee If the objectives set out above are met (which is not formally guaranteed), the net asset value upon liquidation will equal the Initial Subscription Value plus either the minimum return expressed as a percentage of this Initial Subscription Value or the sum of Return 1 and Return 2. Due to the objective of preserving the Initial Subscription Value at Maturity, the Best Of at Maturity is at least 0%. As for the sub-funds affording a formal guarantee regarding the preservation of the Initial Subscription Value If the objectives set out above are met (which will only be formally guaranteed for these sub-funds as far as the preservation of the Initial Subscription Value is concerned), the net asset value upon liquidation will equal the Initial Subscription Value plus either the minimum return expressed as a percentage of this Initial Subscription Value or the sum of Return 1 and Return 2. Due to the objective of preserving the Initial Subscription Value at Maturity, the Best Of at Maturity is at least 0%.

FUND PARTNERS
19
Financial climate
General investment climate 01.10.2009 - 30.09.2010 The world emerged from the severe recession in summer 2009. Rarely has an economic slump been so deep, affecting every country, all the major sectors and all operators at the same time. Producer, consumer and investor confidence fell to an almost unparalleled low. One dismal record after the other was set. The big guns were brought out to tackle the crisis, and a raft of convincing macroeconomic indicators in the period under review confirmed that these efforts have had an impact. Economic recovery is under way. The market grew concerned in 2010 as to whether the recovery could assume a sustainable character. Employment growth in the US remained below par. Runaway public finances, potential means for dealing with them and the impact of those measures on economic growth were also grounds for unease. In April, the shift in mood put an end to the spectacular improvement in the financial market climate seen since March 2009. Economy recovering, but sustainability not yet guaranteed The 2007–09 credit crisis continues to reverberate. Its roots lay fundamentally in the unbridled expansion of mortgage loans and consumer credit (primarily in the US) from the 1990s to 2007 and growing imbalances in the wealth position of US households. The recycling of Russian and Chinese dollar assets in the US Treasuries market kept rates artificially low and exacerbated that process. Financial innovation (especially securitising loans, so that they were removed from financial institutions’ balance sheets) resulted in lending policy becoming more lax. Falling house and share prices had a negative impact on households' net assets. The credit bubble burst. The technique of securitising loans, which had become commonplace, shifted the credit risk to many end investors, and also leveraged lending. These factors resulted in the crisis spreading like wild fire. The bankruptcy of the investment bank Lehman Brothers marked more than the low point of the credit crisis. The world held its breath. Producer and consumer confidence fell to an unparalleled low. Cash instruments became the most sought-after asset. Industry and international trade were hit particularly hard and the world slipped into the most severe recession since the 1930s. The first (tentative) signs of economic recovery emerged in spring 2009. Large-scale budgetary stimuli and aggressive monetary policies bore fruit. As the year progressed, the recovery assumed a broader base. All the same, it remained heavily dependent on government stimuli. Car and house sales eased again in the US as scrappage premiums ran out and tax breaks on the purchase of a first home came to an end. Export-oriented countries with a broad industrial base – such as Germany and most Asian countries – already started to record positive growth figures. There is little evidence of a sustainable growth spiral involving the interaction of income growth, expanding demand, increased employment and an expansion of capacity. More jobs have been created than shed in 2010, but the rate of employment growth (9.6% in August) remained weak and unemployment continued to hover around the record levels reached in late 2009. Encouraging developments include an increase in average hours worked, a significant rise in temporary employment and persistently high business confidence in industry. V-shaped recovery in corporate earnings Companies in particular have benefited from increasing globalisation in recent years. Productivity gains were more than adequate, and earnings growth phenomenal. This trend of widening profit margins and earnings increases was initially sustained during the economic slowdown, at least among non-financial companies. This changed dramatically in the fourth quarter of 2008, when the slowdown turned into a deep slump. That resulted in an initial, steep fall (-45.6%) in earnings for the S&P 500 companies (excluding the financial sector). This trend continued in the first nine months of 2009.
FUND PARTNERS
Financial climate (continued)
20
The recovery as from Q4 2009 was just as impressive as the decline in earnings during the recession. So although the economic recovery in the West may be modest, the same was certainly not true of corporate earnings. The vigorous recovery (following the shift from losses to profits in the final quarter of 2009, earnings per share rose +99% in the first and +48% in the second quarter of 2010 for all S&P 500 companies together) was not attributable to extraordinary or one-off events but occurred in pretty much all sectors. This was due more to a sharp reduction in (wage) costs than to increased turnover. Inflation is biggest absentee Compared to the turbulent period between 2005 and 2009, the most recent reporting period was a fairly peaceful one for the oil market. At the end of 2008, the recession had pushed down the price of oil (Brent) to 35 USD/barrel (its lowest level since July 2004). On the back of the economic recovery, the oil price recovered to 77 USD/barrel by the end of 2009. The oil price has continued to fluctuate between 70 and 85 USD in 2010. Metal prices reacted even more strongly to the economic recovery. They started to rise in April 2009, a trend that has continued virtually uninterrupted in 2010. At the end of September the price of aluminium was up by 36% compared with eighteen months ago, the price of copper by 81%, and nickel as much as 106%. General inflation was heavily influenced by fluctuations in the oil price. It was negative in 2009, but has turned positive again since the beginning of 2010. A more significant feature, however, was that core inflation (i.e. inflation with volatile oil and food prices stripped out to provide a clearer picture of the underlying forces) continued to fall, reaching around 1% in both the US and EMU. This confirms the late-cyclical nature of inflation. The overcapacity built up during the recession is not absorbed in the first stage of recovery, which undermines pricing power. That is more evident now than in previous cycles, because there is more surplus capacity this time and greater pressure from low-wage countries. Uncertainty about the dollar, but also about the euro At the end of 2009, the US dollar was still trading at 1.432 per euro. The euro lost ground rapidly in 2010. It was tarnished by the Greek debt crisis, the realisation that the EMU did not have an effective system of checks and balances to prevent budgetary problems affecting another member state, the lack of power to avert a crisis and the haggling among European leaders. On 7 June the euro reached its lowest rate (1.19 USD per EUR) in the period under review. In recent months the dollar has lost ground against almost all major currencies, including the euro. This was partly due to atrocious balance-of-payment statistics. The Fed's announcement that it will, if necessary, buy up more debt paper (so injecting more cash onto the market) was read as a very negative signal about the economy. The dollar was trading at 1.363 per euro on 30 September. Estonia will join the EMU on 1 January 2011. Within ERM-II, Denmark, Lithuania and Latvia are still preparing for accession. One of the conditions for this is successful participation in the exchange rate system for at least two years (which entails maintaining the exchange rate within a range of 15% either side of the central rate). Several Scandinavian currencies suffered in the period 2008–09 from the crisis in Iceland and the financial tribulations of the Baltic States. The Icelandic krona collapsed because of the credit crisis. The high presence of Swedish banks in the Baltic region prompted doubts about the solvency of the Swedish financial system. This forced the Swedish central bank to cut its key rate more drastically than the ECB, in spite of higher inflation and stronger domestic demand. The Riksbank cut rates to 0.25%. The Swedish/German bond rate spread initially became more negative, but subsequently narrowed and returned to positive territory again in the course of 2009. The Swedish krona suffered as a result of the vacillating sentiment, often hitting record lows, and managed to appreciate quite strongly in 2010.

FUND PARTNERS
Financial climate (continued)
21
The Norwegian economy has likewise been unable to escape the turmoil, although bumper oil earnings do provide something of a buffer. At any rate, the Norwegian economy is bearing up better than the rest of Europe. Although the Norwegian krone also came under pressure when the financial crisis was at its worst, this has clearly changed in the last few months. The Norwegian economy will probably recover more vigorously than the euro area, and the Norwegian central bank has already anticipated this by raising its key interest rate to 2.00%. This action has given the krone a considerable shot in the arm in recent months. The Norwegian currency ended the report period at 7.96 NOK per EUR, 4% higher than at the end of 2009. In the recent crisis, the UK economy showed itself to be a mirror image of its US counterpart. In the UK, too, the previous expansionary phase was based on exaggerated credit growth, a property bubble and over-consumption. The British economy therefore experienced a severe slump. Public finances ran totally out of control. The new coalition government therefore presented an emergency budget on 22 June 2010 on top of the budget introduced by the previous government as recently as March. Both programmes are equally swingeing, and aim to cut the budget deficit from 10.1% in 2010 to 1% in 2016. To achieve this, the British will have to make efforts over the entire period amounting to 11% of GDP, mainly in the first two years; tax increases account for 33% of the measures and spending cuts for 67%. The measures will be painful; they are seen as one of the most severe austerity programmes in the West in the last 20 years, comparable with the measures adopted in Greece, but a bit less draconian than those in the Scandinavian countries in the 1990s. In any event, the AAA rating for UK government bonds has been assured. The measures came as no surprise to the financial markets. The financial and economic crisis had a serious, negative impact on Central Europe. Slovakia joined the EMU just in time to avoid the worst of the damage. The recession in Western Europe had direct consequences for the export-oriented Czech and Hungarian economies. Poland, which is a less open economy, suffered considerably less. Hungary had already slipped into recession. The restructuring of the runaway public finances has adversely affected Hungarian growth since as far back as 2006. The increased foreign debt (a systematic appreciation of the forint made taking out loans in Swiss francs, at a lower rate of interest, very popular) triggered a currency crisis. As recession raged, the central bank was obliged to hike its key rate by 300 basis points in November 2008, and the IMF imposed additional savings in exchange for an aid package. The crisis in the Baltic States increased tension in Central Europe. That coincided with rumours of a forced withdrawal of some Western banks with large holdings in Central Europe. Problems with the capital base on their home markets and growing concerns about the quality of their Central European loan portfolios fuelled speculation about a chaotic exodus, raising doubts about the region's financial stability. It never came to that in the end. The fog gradually began to lift in the spring of 2009, and the recovery has continued in 2010. Hungary, for instance, recorded export-driven growth of 3.6% year-on-year in the first quarter. The economic recovery in Poland and the Czech Republic is still chiefly underpinned by the turnaround in the inventory cycle. Polish consumer spending recovered somewhat. The labour-market climate improved, rekindling consumer confidence to some extent. At the end of the period under review, the Czech koruna was up 6.9% against the euro compared to the end of 2009, and the Polish zloty 2.6%.

FUND PARTNERS
Financial climate (continued)
22
Hungary continued to struggle with its public finances, attracting an excessively high level of attention in the wake of the debt crisis in Greece. The International Monetary Fund decided to suspend negotiations on the extension of its financial support package to give Hungary more time to draw up a budget plan. In May’s parliamentary elections, voters punished the incumbent government for its austerity policy and the new government has no budgetary scope to meet its campaign promises. The current year has therefore been written off in budgetary terms and we will have to wait until after the municipal elections at the beginning of October for the earlier austerity programme to be resumed. The budget for 2011 will be an important test case. There is, however, no alternative since the high level of foreign debt held by Hungarian households means that any loss of confidence on the part of the international community and the weakening of the forint to which that would give rise would be more painful than any public-spending cuts. All this uncertainty depressed the forint, which was down 2.0% at the end of September compared with its level at the end of 2009. The Hungarian central bank was therefore obliged to hold its key rate – which still stood at 5.25% at the end of the report period – at a higher level than it considered desirable. Japan: the lingering scent of deflation Japan recorded average growth of 2.4% year-on-year in the first half of 2010 (+4.4% in the first quarter and +0.4% in the second), which was comparable with the US (+2.6%) and EMU (+2.4%). Exports were the primary driver for growth. In recent months, Japanese exporters have benefited from the rapid recovery among neighbouring Asian countries, mainly China, and also from increasing demand from the US and Europe. All components of gross domestic product contributed to growth for the first time in four years. Business investment and consumer spending continued to increase and stocks also made a positive contribution. However, the upturn in domestic demand still depends on budgetary measures. It would therefore be premature to talk of a lasting recovery. In spite of the recovery in recent quarters, the output gap is still wide and the capacity utilisation rate still well below its pre-crisis level. This combination means that Japan continues to struggle with deflation. As a result, the Japanese central bank kept to its accommodating monetary policy in recent months, and that won’t change any time soon. Deflation is likely to persist for some time yet, although less negative inflation figures could be seen in the months ahead. Provided, that is, that the recovery persists and the output gap continues to narrow. The Japanese yen appreciated sharply. It was trading at 83 JPY per USD on 30 September 2010 – its highest level in some 15 years and 12% higher than at the end of 2009. It appreciated by an even stronger 17% against the euro. The Australian dollar (+7.8% against the US dollar in the period 31 December 2009 to 30 September 2010) and the New Zealand dollar (+1.2%) were able to extend their strong performance of recent years into 2010. Carry-traders – investors whose strategy is to finance a portfolio of high-yield currencies by borrowing in low-yield currencies so as to benefit from the widest possible credit spread – were conspicuous by their absence. The increase in commodity prices provided some solace. Nevertheless, as a supplier of commodities to China, the Australian economy benefited hugely from rising metal prices. The central bank raised its key rate on 6 October 2009, making it the first to initiate the cycle of tightening. Four subsequent hikes brought the key rate to 4.50%. Impressive recovery in Asia; Brazil the driving force in Latin America The recent recession and the initial phase of the recovery have taught us much about the role of the emerging markets in the global economy. They are still highly dependent on exports. Although intra-regional trade in Asia is growing very rapidly, the region’s ultimate engine of economic growth is still located in the West, primarily in the shape of US consumers. That became painfully clear in the fourth quarter of 2008 and first quarter of 2009, when the recession that began in the US immediately spread to Asia. Countries such as South Korea, Taiwan and Singapore saw their growth contract by more than 20%. China, on the other hand, continued to post positive growth. The extent of the government measures (a raft of stimuli equivalent to 18% of Chinese GDP, the abandonment of the policy of a
FUND PARTNERS
Financial climate (continued)
23
gradual appreciation of the currency, flexible credit policy, etc.) does, however, indicate that the crisis was more severe than the official GDP reports would have us believe. The economic recovery since the second quarter of 2009 was just as dramatic as the slump. Asia is indeed better equipped to cope with financial crises than it was in the past. Public finances are healthy, the balance of payments is neutral (China actually has an astronomical surplus) and the internal savings buffer is high. Banks’ balance sheets have been less contaminated by toxic assets than in the West. Asia’s economic development no longer depends on fickle foreign capital. This financial independence marks out the Asian emerging countries from other emerging regions. Brazil was the first Latin American country to return to positive growth figures as early as the second quarter of 2009. Compared with Mexico, the second largest economy in Latin America after Brazil, the country managed to limit the damage caused by the global recession, largely thanks to strong domestic demand. The robust economic expansion and high inflows of foreign capital caused the real to appreciate considerably; the government attempted to slow this by means of a tax on capital inflows. On the other hand, the second quarter was the fourth consecutive quarter of negative growth for Mexico, and GDP fell by almost 10% in all, more than double the fall seen in Brazil. Mexico is far more dependent than Brazil on exports, primarily to the US, which accounts for more than 80% of the country’s exports. The extra yield on Latin American and Asian government bonds has continued to shrink in recent years, hitting record lows in the middle of 2007. Improved credit quality (countries such as Brazil and Russia, the main debtors at the time, took advantage of the bullish commodity markets to reduce their foreign debt) was one of the causes of the fall in rate spreads with US government paper. That picture changed completely in 2008. The worldwide credit and liquidity crisis and the flight of capital from Russia pushed the rate spread with US Treasury paper in October 2008 back to 2004 levels. Despite the sharp slowdown of growth and the significant currency correction in a number of emerging markets, deep crises in funding failed to materialise thanks to improved financial-economic fundamentals. After peaking in October 2008, the rate spread with US Treasury paper gradually narrowed again, but is still much wider than in the summer of last year. Equities: markets vacillate between hope and fear Equity markets have traditionally bottomed out when the market is still awash with terrible economic news and the prophets of doom are at their loudest. The same was true in this cycle. The S&P 500 bottomed out on 9 March 2009, which means the stock market turned up about four months before the low point of the recession. It then rallied in anticipation of the recovery in corporate earnings. This ‘normal’ cyclical pattern pushed the S&P 500 75% higher at the end of April 2010 than its low point on 9 March 2009. Since then, the equity markets have struggled to find fresh impetus. Sound economic and earnings figures have come as no surprise for a long time now. The debt crisis in Greece threw the spotlight on the general problem of ailing public finances, not only in some peripheral euro-area countries, but also in core countries such as the US and UK. The market became concerned about the negative effects on growth should draconian savings measures be adopted globally at the same time. There were also fears of a double-dip recession due to the absence of an upturn on the US housing market, fears that the economy was not strong enough to generate sufficient employment and persistent worries about the shortage of credit. The S&P 500 ended the report period up 2.3% on 2009 year-end. The depreciation of the euro meant, however, that European investors still achieved a gain of 7.5%. The Asian emerging markets continued to benefit from the economic recovery in the region, which was not wholly dependent on developments in the West, but also displayed a dynamism of its own. The MSCI Emerging Asia return index in EUR improved by 17.2% between the end of 2009 and 30 September. If anywhere is experiencing a boom, it is here, because inflation is heading up and the central banks are tightening up monetary policy. Valuations remain favourable, especially given the high growth prospects, sound macroeconomic balance and a banking sector that was barely – if at all – affected by the credit crisis.
FUND PARTNERS
Financial climate (continued)
24
For Latin America (+12.8%), the link to the commodity markets was always to the fore. Mexico suffered as a result of the weak economic recovery in the US. Brazil was at a loss due to the influx of foreign capital, and was unable to sufficiently halt the appreciation of the currency. The positive investment results achieved by the Japanese stock market (+8.9%) were entirely attributable to the sharp appreciation of the yen. In local currency terms Japan put in another disappointing performance (-9.2%). Domestic investors are sceptical about the country’s economic and political stability. Foreign investors, who previously capitalised on growth in Asia via the Tokyo stock exchange, now have better (and direct) alternatives. Central Europe put in a disappointing showing (+7.6%), particularly compared with the very sound performance in 2009. The region continued to struggle with the fallout from the international credit crisis. Either the threat came from the Baltic region or Greece, or else it was the politicians who stirred things up (Hungary). Western Europe (+5.0%) – especially the euro area – put up the worst showing among the mature markets. That is hardly surprising, as it is here that the risk of a double-dip recession is greatest and the most stringent budget measures are expected. What’s more, the threat of Greece or another EMU country going bankrupt would inevitably impact on the European banking sector. The Belgian stock market performed better than others in the EMU (+3.1%, compared to -7.3% for the Euro Stoxx 50), due in part to its defensive character. Bekaert was the best performer, benefiting from its strong presence in China. Colruyt, Delhaize and AB Inbev also performed well. Colruyt was favoured by investors because of its defensive profile. AB Inbev continued its successful integration following the acquisition of Anheuser. The company continues to generate sufficient fresh cash flows to fund its growth. Style factors made the difference, especially between April and September, when the market was caught in a sideways movement. During the period under review, small caps outperformed blue chips by an average of 5%. The growth factor beat the value factor by around 4%. The best performing sectors included Industrials, Consumer Discretionary and Consumer Staples. Energy and Technology once again lagged behind. Manufacturers of capital goods made severe cost cuts during the recession, putting them in an excellent position in the initial phase of the economic recovery. A small recovery in sales brought a sharp rise in profit margins. Many factors were also in place to ensure a sound performance by Energy. The increase in the oil price in 2009 had not yet entirely filtered through to the valuation of the major oil companies. Gas prices also rose considerably in winter 2009–10. Refining margins have surged in 2010. However, the Gulf of Mexico disaster did not only affect BP, it also had a negative influence on service companies in the oil sector. Real Estate (+6.3%) continued the positive trend of 2009. The impressive performance in virtually all regions during the previous stock-market rally sometimes meant that property shares were trading at substantial premiums to their net asset value. This overvaluation made the sector very vulnerable. The financial crisis, which originated from the residential property sector, had a major impact on this sector, which is traditionally heavily funded by debt. The fact that much of this debt was packaged into structured investment products, repackaged and sold on in the market adversely affected the creditworthiness of many operators in this sector. That limited their room for manoeuvre considerably. The steep fall in prices has seen the premium at which many property shares were quoted in relation to their net asset value turn into a – in many cases attractive – discount. That appears to have laid an adequate foundation for the sector when the stock markets started to rally in March 2009.
FUND PARTNERS
Financial climate (continued)
25
Outlook Today’s world is one of two-speed economies. The established industrial economies (US, Europe, Japan) find themselves in a low-growth environment, with no inflation, persistently low interest rates and runaway public finances. The economic recovery in these regions has continued in the last few months and the leading indicators suggest that quite good growth figures may still be achieved in the short term. However, these economies are likely to return to weaker growth figures in 2011, as the engine of consumer spending, which still accounts for 70% of GDP, continues to sputter. Nevertheless, employment in the US has been increasing again since December 2009. The assumption is that the US economy will be in a position to create between 100 000 and 150 000 new jobs a month in the months ahead. That’s a fair amount – a little more robust than the 50 000–100 000 seen in recent months – but not yet enough to genuinely reduce the jobless rate. High unemployment (9.5% in the US) continues to depress wage increases. That in turn means limited real income growth. What is more, households will have to use some of their additional income to reduce their debts; as a result, already limited income growth will lead to even slower growth in consumer spending, and hence slower economic growth in general. Wage rises will remain subdued in Europe, too, so there is little prospect of strong growth in income or consumption. The unions are accepting very modest wage increases in Germany. In the chemical industry, for instance, they have accepted a one-off bonus of 1.3% of annual salaries in 2010. This bonus will be on the negotiating table again in 2011. Other European countries will need to follow Germany’s example if they wish to maintain their competitive position (or at least not allow Germany’s edge to increase). Economic boom in the New World The situation is very different in the emerging markets: Asia, and to a lesser extent Latin America, is experiencing a boom. Inflation is beginning to creep up, however, and there is upward pressure on interest rates. The Asian economies are running at full throttle. Exports have increased significantly in the last six months or so. Unlike previously, exports are not only going to the West, but intra-regional trade is also flourishing. The economic recovery is also underpinned by strong growth in domestic demand (especially consumer spending). China is once more posting growth in excess of 10%. The region will undoubtedly continue to outgrow the Old World, boosting global GDP growth in the process. What is more, the emerging economies have taken on a much more significant position in the global economy in recent years. For instance, consumers in these regions already account for more than 25% of global consumption. Thanks to the growth in the emerging markets, the global economy could record growth of around 5% in 2010 and 2011, which is higher than the average over the last 40 years. That is one of the arguments underpinning our positive attitude towards corporate earnings. In the wake of the dramatic economic recovery, inflation is starting to increase in many emerging economies, not solely as a result of higher food prices. There is little cause for concern for the time being, because the region’s central banks are quick to respond. In many countries (not least China), interest rates are increased and/or other measures adopted to keep credit growth in check. And there is little sign of any real overheating: property and share prices are not overvalued, public finances are in equilibrium and there is a large balance-of-trade surplus in many cases. Large, and growing, savings surpluses in the New World (especially China) are financing the substantial savings deficits in the Old World. That’s one of the reasons why US and European bond yields have been able to remain so low.

FUND PARTNERS
Financial climate (continued)
26
Strong earnings growth even with modest economic expansion After nine quarters of declining earnings, company profits staged a spectacular recovery in the fourth quarter of 2009. That eye-catching rise in corporate earnings then continued in the first two quarters of 2010. Average profit growth of 48% is forecast for S&P 500 companies in the US in 2010. Excluding the financial sectors, the increase is expected to be 32.5%. Against the backdrop of decent growth at global level, this forecast ought to be readily achieved. Many companies have international operations and are experiencing the positive impact of high growth in the emerging countries. Profit margins are also developing very favourably. US companies in particular have adjusted very quickly to the new situation, pepping up their productivity considerably: as a result, a small upturn in sales could generate handsome profit increases. The fact that the recent results have been even better than the analysts' optimistic forecasts should not, therefore, come as a surprise. The record earnings of 2007 could be matched or surpassed in many sectors as early as the second half of this year. Luxembourg, 4th October 2010 The Board of Directors

FUND PARTNERS
Financial climate (continued)
27
Note: The information in this report represents historical data and is not an indication of future results.

FUND PARTNERS
Statement of net assets as at 30th September 2010
The accompanying notes are an integral part of these financial statements.
28
Consolidated CSOB World Click
Plus 7 CSOB World Click
Plus 14 (in EUR) (in CZK) (in CZK)
Assets Securities portfolio at market value 812,960,095.75 97,748,143.08 133,013,533.18 Cash at banks 134,319,713.14 9,661,750.19 11,917,476.06 Formation expenses, net 8,542.15 - - Receivable on treasury transactions 1,034,133.99 - - Income receivable on portfolio 4,075,551.12 598,026.04 813,777.26 Interest receivable on swap contracts 111,601.93 - 219,542.26 Interest receivable on bank accounts 258,586.62 33,105.71 43,359.11 Unrealised gain on swap contracts 27,179,988.17 30,836,313.06 39,225,173.54 Other receivables 138.05 - -
Total assets 979,948,350.92 138,877,338.08 185,232,861.41
Liabilities Payable on redemptions of shares 44,237,528.69 - - Interest payable on swap contracts 2,136,688.60 39,853.86 - Unrealised loss on swap contracts 21,803,450.24 - - Interest on bank liabilities and expenses payable 6,459,841.64 880,692.64 1,342,683.97 Other liabilities 37,713.57 - -
Total liabilities 74,675,222.74 920,546.50 1,342,683.97
Net assets at the end of the period 905,273,128.18 137,956,791.58 183,890,177.44
Number of capitalisation shares outstanding 10,667.0000 14,484.0000
Net asset value per capitalisation share 12,933.05 12,696.09
Number of distribution shares outstanding - - Net asset value per distribution share - -

FUND PARTNERS
Statement of net assets (continued) as at 30th September 2010
The accompanying notes are an integral part of these financial statements.
29
CSOB Click
Program 1 CSOB Click
Program 4 CSOB Click
Program 5 (in CZK) (in CZK) (in CZK)
Assets Securities portfolio at market value 87,173,687.75 150,306,231.95 138,683,309.56 Cash at banks 8,059,550.78 17,508,245.96 16,414,310.81 Formation expenses, net - 1,610.98 1,478.04 Receivable on treasury transactions - - - Income receivable on portfolio 287,283.75 495,339.41 457,034.88 Interest receivable on swap contracts - - - Interest receivable on bank accounts 13,664.02 25,130.97 23,191.90 Unrealised gain on swap contracts 12,417,248.47 9,363,184.09 12,128,154.64 Other receivables - - -
Total assets 107,951,434.77 177,699,743.36 167,707,479.83
Liabilities Payable on redemptions of shares - - - Interest payable on swap contracts 20,578.47 99,147.55 44,317.77 Unrealised loss on swap contracts - - - Interest on bank liabilities and expenses payable 731,744.47 800,914.58 865,300.16 Other liabilities - - -
Total liabilities 752,322.94 900,062.13 909,617.93
Net assets at the end of the period 107,199,111.83 176,799,681.23 166,797,861.90
Number of capitalisation shares outstanding 9,480.0000 16,776,906.0000 15,519,300.0000
Net asset value per capitalisation share 11,307.92 10.54 10.75
Number of distribution shares outstanding - - - Net asset value per distribution share - - -
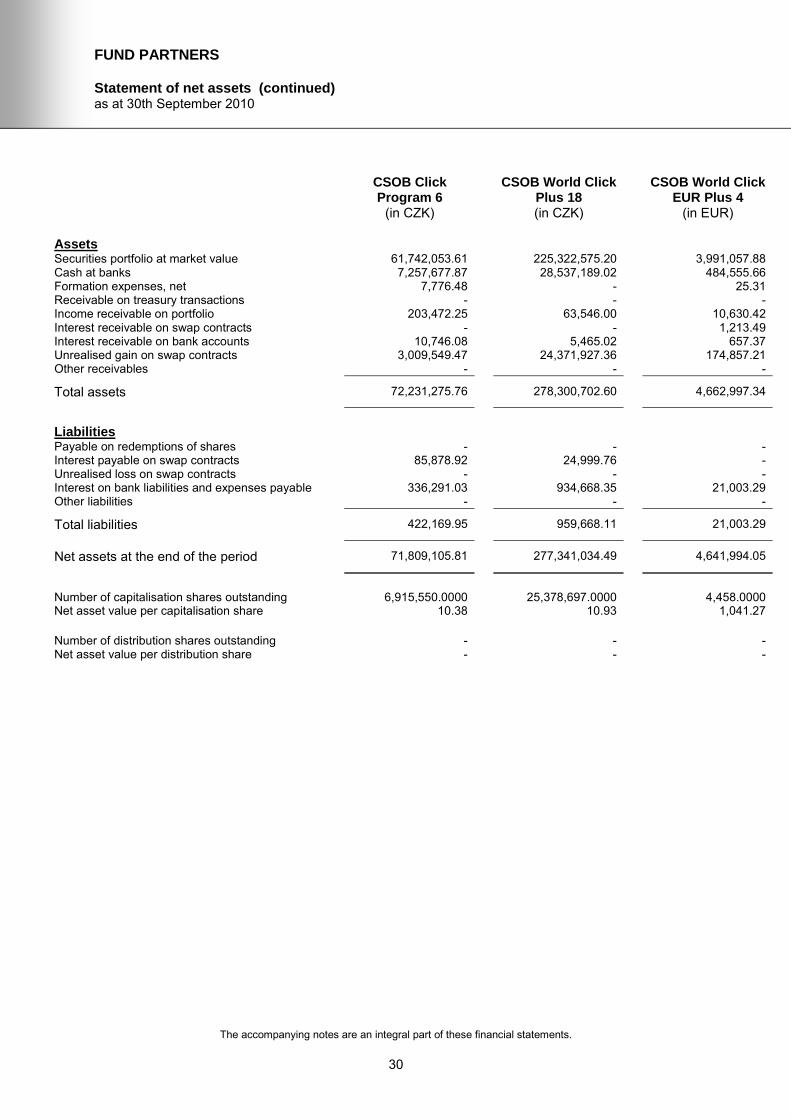
FUND PARTNERS
Statement of net assets (continued) as at 30th September 2010
The accompanying notes are an integral part of these financial statements.
30
CSOB Click
Program 6 CSOB World Click
Plus 18 CSOB World Click
EUR Plus 4 (in CZK) (in CZK) (in EUR)
Assets Securities portfolio at market value 61,742,053.61 225,322,575.20 3,991,057.88 Cash at banks 7,257,677.87 28,537,189.02 484,555.66 Formation expenses, net 7,776.48 - 25.31 Receivable on treasury transactions - - - Income receivable on portfolio 203,472.25 63,546.00 10,630.42 Interest receivable on swap contracts - - 1,213.49 Interest receivable on bank accounts 10,746.08 5,465.02 657.37 Unrealised gain on swap contracts 3,009,549.47 24,371,927.36 174,857.21 Other receivables - - -
Total assets 72,231,275.76 278,300,702.60 4,662,997.34
Liabilities Payable on redemptions of shares - - - Interest payable on swap contracts 85,878.92 24,999.76 - Unrealised loss on swap contracts - - - Interest on bank liabilities and expenses payable 336,291.03 934,668.35 21,003.29 Other liabilities - - -
Total liabilities 422,169.95 959,668.11 21,003.29
Net assets at the end of the period 71,809,105.81 277,341,034.49 4,641,994.05
Number of capitalisation shares outstanding 6,915,550.0000 25,378,697.0000 4,458.0000
Net asset value per capitalisation share 10.38 10.93 1,041.27
Number of distribution shares outstanding - - - Net asset value per distribution share - - -

FUND PARTNERS
Statement of net assets (continued) as at 30th September 2010
The accompanying notes are an integral part of these financial statements.
31
CSOB Europe
Click Plus 3 CSOB World Click
Plus 19 CSOB World Click
Plus 20 (in EUR) (in CZK) (in CZK)
Assets Securities portfolio at market value 3,383,748.26 104,991,754.54 59,606,466.00 Cash at banks 337,013.29 13,491,843.21 5,448,720.24 Formation expenses, net 39.55 - - Receivable on treasury transactions - - - Income receivable on portfolio 7,866.22 29,610.00 196,433.36 Interest receivable on swap contracts 1,967.39 - - Interest receivable on bank accounts 464.97 2,720.32 10,690.04 Unrealised gain on swap contracts 554,222.48 9,351,897.07 5,112,948.10 Other receivables - - -
Total assets 4,285,322.16 127,867,825.14 70,375,257.74
Liabilities Payable on redemptions of shares - - - Interest payable on swap contracts - 12,447.38 64,661.69 Unrealised loss on swap contracts - - - Interest on bank liabilities and expenses payable 26,907.55 362,110.16 481,328.38 Other liabilities - - -
Total liabilities 26,907.55 374,557.54 545,990.07
Net assets at the end of the period 4,258,414.61 127,493,267.60 69,829,267.67
Number of capitalisation shares outstanding 11,192.0000 11,806,723.0000 6,462,491.0000
Net asset value per capitalisation share 380.49 10.80 10.81
Number of distribution shares outstanding - - - Net asset value per distribution share - - -
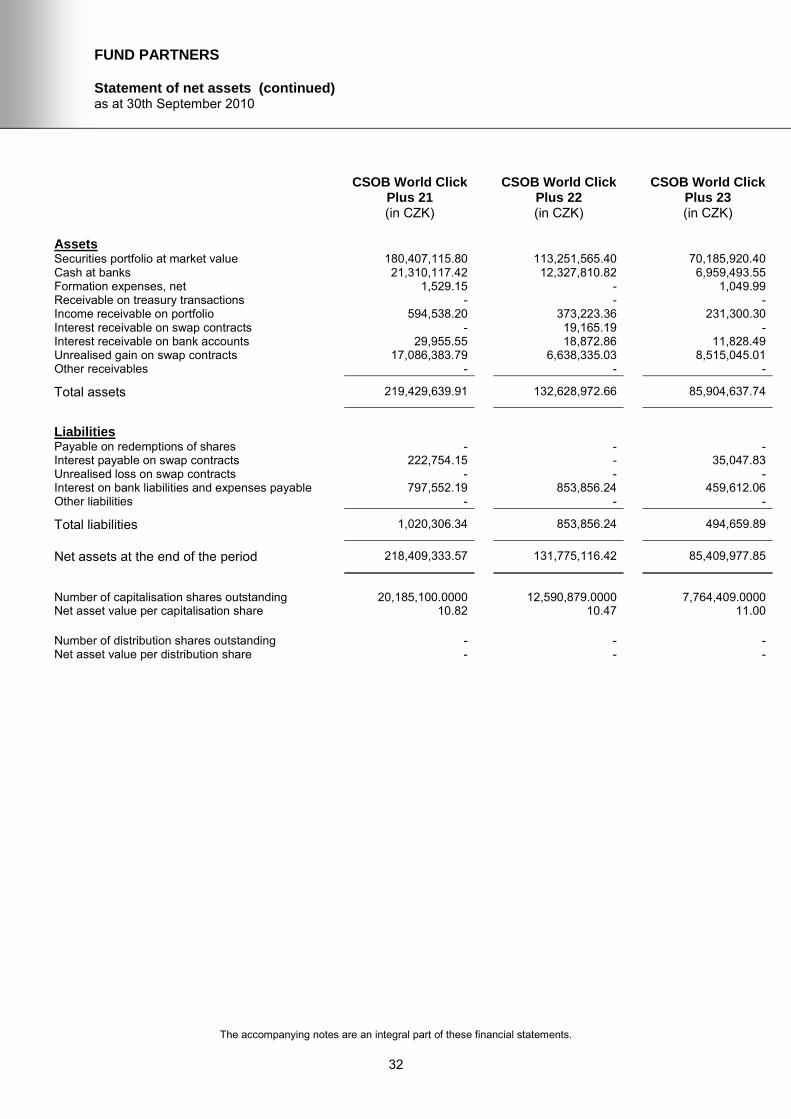
FUND PARTNERS
Statement of net assets (continued) as at 30th September 2010
The accompanying notes are an integral part of these financial statements.
32
CSOB World Click
Plus 21 CSOB World Click
Plus 22 CSOB World Click
Plus 23 (in CZK) (in CZK) (in CZK)
Assets Securities portfolio at market value 180,407,115.80 113,251,565.40 70,185,920.40 Cash at banks 21,310,117.42 12,327,810.82 6,959,493.55 Formation expenses, net 1,529.15 - 1,049.99 Receivable on treasury transactions - - - Income receivable on portfolio 594,538.20 373,223.36 231,300.30 Interest receivable on swap contracts - 19,165.19 - Interest receivable on bank accounts 29,955.55 18,872.86 11,828.49 Unrealised gain on swap contracts 17,086,383.79 6,638,335.03 8,515,045.01 Other receivables - - -
Total assets 219,429,639.91 132,628,972.66 85,904,637.74
Liabilities Payable on redemptions of shares - - - Interest payable on swap contracts 222,754.15 - 35,047.83 Unrealised loss on swap contracts - - - Interest on bank liabilities and expenses payable 797,552.19 853,856.24 459,612.06 Other liabilities - - -
Total liabilities 1,020,306.34 853,856.24 494,659.89
Net assets at the end of the period 218,409,333.57 131,775,116.42 85,409,977.85
Number of capitalisation shares outstanding 20,185,100.0000 12,590,879.0000 7,764,409.0000
Net asset value per capitalisation share 10.82 10.47 11.00
Number of distribution shares outstanding - - - Net asset value per distribution share - - -

FUND PARTNERS
Statement of net assets (continued) as at 30th September 2010
The accompanying notes are an integral part of these financial statements.
33
CSOB World Click
Plus 24 CSOB World Click
USD Plus 6 CSOB World
Growth Plus 1 (in CZK) (in USD) (in CZK)
Assets Securities portfolio at market value 249,301,394.26 2,908,237.93 266,374,273.03 Cash at banks 28,386,219.95 342,741.03 25,717,139.89 Formation expenses, net 3,095.16 27.31 - Receivable on treasury transactions - - - Income receivable on portfolio 821,582.44 4,536.30 1,629,681.66 Interest receivable on swap contracts - 5,476.72 22,240.31 Interest receivable on bank accounts 40,817.44 510.79 84,548.02 Unrealised gain on swap contracts 17,310,132.27 531,606.73 40,719,053.58 Other receivables - - -
Total assets 295,863,241.52 3,793,136.81 334,546,936.49
Liabilities Payable on redemptions of shares - - - Interest payable on swap contracts 208,614.09 - 18,069.89 Unrealised loss on swap contracts - - - Interest on bank liabilities and expenses payable 1,298,913.77 21,130.17 1,926,103.71 Other liabilities - - -
Total liabilities 1,507,527.86 21,130.17 1,944,173.60
Net assets at the end of the period 294,355,713.66 3,772,006.64 332,602,762.89
Number of capitalisation shares outstanding 27,882,756.0000 3,244.0000 29,163.0000
Net asset value per capitalisation share 10.56 1,162.76 11,404.96
Number of distribution shares outstanding - - - Net asset value per distribution share - - -

FUND PARTNERS
Statement of net assets (continued) as at 30th September 2010
The accompanying notes are an integral part of these financial statements.
34
CSOB Europe
Real Estate Growth Plus 1
CSOB World Growth Plus 9
CSOB Europe Growth Plus 2
(in CZK) (in CZK) (in CZK)
Assets Securities portfolio at market value 141,117,522.99 237,827,702.36 130,189,670.96 Cash at banks 14,802,127.67 26,473,026.62 13,743,140.49 Formation expenses, net - 997.90 1,489.10 Receivable on treasury transactions - - - Income receivable on portfolio 465,055.91 783,769.01 429,043.11 Interest receivable on swap contracts - - - Interest receivable on bank accounts 22,694.91 35,839.33 21,205.31 Unrealised gain on swap contracts - 10,464,527.04 2,251,150.83 Other receivables - - -
Total assets 156,407,401.48 275,585,862.26 146,635,699.80
Liabilities Payable on redemptions of shares - - - Interest payable on swap contracts 142,065.30 95,202.39 79,247.17 Unrealised loss on swap contracts 1,515,265.12 - - Interest on bank liabilities and expenses payable 732,746.70 1,341,595.64 698,847.88 Other liabilities - - -
Total liabilities 2,390,077.12 1,436,798.03 778,095.05
Net assets at the end of the period 154,017,324.36 274,149,064.23 145,857,604.75
Number of capitalisation shares outstanding 15,666,731.0000 26,352,467.0000 14,435,452.0000
Net asset value per capitalisation share 9.83 10.40 10.10
Number of distribution shares outstanding - - - Net asset value per distribution share - - -

FUND PARTNERS
Statement of net assets (continued) as at 30th September 2010
The accompanying notes are an integral part of these financial statements.
35
CSOB Global
Growth Plus 1 CSOB Global
Growth Plus 2 CSOB Global
Growth Plus 3 (in CZK) (in CZK) (in CZK)
Assets Securities portfolio at market value 111,959,668.53 155,124,507.01 132,623,469.36 Cash at banks 12,275,801.46 17,013,944.79 15,086,677.64 Formation expenses, net - - 1,654.71 Receivable on treasury transactions - - - Income receivable on portfolio 368,967.26 511,217.73 437,064.20 Interest receivable on swap contracts - - - Interest receivable on bank accounts 18,785.24 24,362.99 21,056.64 Unrealised gain on swap contracts 2,919,606.05 9,968,803.19 6,451,005.14 Other receivables - - -
Total assets 127,542,828.54 182,642,835.71 154,620,927.69
Liabilities Payable on redemptions of shares - - - Interest payable on swap contracts 58,046.54 117,683.68 111,237.78 Unrealised loss on swap contracts - - - Interest on bank liabilities and expenses payable 785,213.20 821,363.74 700,242.34 Other liabilities - - -
Total liabilities 843,259.74 939,047.42 811,480.12
Net assets at the end of the period 126,699,568.80 181,703,788.29 153,809,447.57
Number of capitalisation shares outstanding 12,425,939.0000 17,214,694.0000 14,817,027.0000
Net asset value per capitalisation share 10.20 10.56 10.38
Number of distribution shares outstanding - - - Net asset value per distribution share - - -

FUND PARTNERS
Statement of net assets (continued) as at 30th September 2010
The accompanying notes are an integral part of these financial statements.
36
CSOB US Growth
Plus USD 1 CSOB World Growth
Plus EUR 1 CSOB Central
Europe Winners 2 (in USD) (in EUR) (in CZK)
Assets Securities portfolio at market value 5,116,725.44 8,347,878.15 146,233,203.97 Cash at banks 569,902.00 814,197.41 15,891,242.83 Formation expenses, net 101.97 56.87 1,064.49 Receivable on treasury transactions - - - Income receivable on portfolio 7,981.20 33,140.18 481,916.43 Interest receivable on swap contracts 7,931.62 24,766.65 - Interest receivable on bank accounts 808.56 1,975.25 23,105.99 Unrealised gain on swap contracts 9,333.94 11,751.49 5,191,712.55 Other receivables - - -
Total assets 5,712,784.73 9,233,766.00 167,822,246.26
Liabilities Payable on redemptions of shares - - - Interest payable on swap contracts - - 109,627.46 Unrealised loss on swap contracts - - - Interest on bank liabilities and expenses payable 40,522.23 60,361.73 818,745.08 Other liabilities - - -
Total liabilities 40,522.23 60,361.73 928,372.54
Net assets at the end of the period 5,672,262.50 9,173,404.27 166,893,873.72
Number of capitalisation shares outstanding 564,713.0000 914,928.0000 16,205,628.0000
Net asset value per capitalisation share 10.04 10.03 10.30
Number of distribution shares outstanding - - - Net asset value per distribution share - - -

FUND PARTNERS
Statement of net assets (continued) as at 30th September 2010
The accompanying notes are an integral part of these financial statements.
37
CSOB China
Winners 1 CSOB Asian
Growth 2 Warta Financials 1
(in CZK) (in CZK) (in PLN)
Assets Securities portfolio at market value 352,767,694.10 235,940,013.78 46,871,069.24 Cash at banks 35,134,768.96 23,850,581.30 4,284,573.27 Formation expenses, net - 2,775.48 - Receivable on treasury transactions - - - Income receivable on portfolio 1,162,557.94 777,548.62 417,788.79 Interest receivable on swap contracts - 8,955.23 - Interest receivable on bank accounts 53,836.07 37,050.12 20,624.46 Unrealised gain on swap contracts 13,786,711.55 11,873,616.50 - Other receivables - - -
Total assets 402,905,568.62 272,490,541.03 51,594,055.76
Liabilities Payable on redemptions of shares - - - Interest payable on swap contracts 256,647.99 - 228,041.14 Unrealised loss on swap contracts - - 1,791,093.65 Interest on bank liabilities and expenses payable 1,926,409.16 1,691,853.28 355,567.37 Other liabilities - - -
Total liabilities 2,183,057.15 1,691,853.28 2,374,702.16
Net assets at the end of the period 400,722,511.47 270,798,687.75 49,219,353.60
Number of capitalisation shares outstanding 38,773,394.0000 26,075,426.0000 506,733.4141
Net asset value per capitalisation share 10.33 10.39 97.13
Number of distribution shares outstanding - - - Net asset value per distribution share - - -

FUND PARTNERS
Statement of net assets (continued) as at 30th September 2010
The accompanying notes are an integral part of these financial statements.
38
Warta Pharma 1 CSOB Global
Growth Plus 4 CSOB Global
Growth Plus 5 (in PLN) (in CZK) (in CZK)
Assets Securities portfolio at market value 29,201,296.40 159,793,751.63 108,582,260.78 Cash at banks 2,890,803.16 18,289,182.67 12,373,618.19 Formation expenses, net - 3,674.09 3,710.71 Receivable on treasury transactions - - - Income receivable on portfolio 260,288.00 526,605.07 357,836.02 Interest receivable on swap contracts - - - Interest receivable on bank accounts 13,342.76 26,659.53 17,492.62 Unrealised gain on swap contracts 139,902.94 9,732,501.40 858,443.29 Other receivables - - -
Total assets 32,505,633.26 188,372,374.39 122,193,361.61
Liabilities Payable on redemptions of shares - - - Interest payable on swap contracts 153,220.90 91,790.09 87,465.83 Unrealised loss on swap contracts - - - Interest on bank liabilities and expenses payable 306,746.08 1,014,988.24 649,418.33 Other liabilities - - -
Total liabilities 459,966.98 1,106,778.33 736,884.16
Net assets at the end of the period 32,045,666.28 187,265,596.06 121,456,477.45
Number of capitalisation shares outstanding 324,081.6458 17,811,229.0000 12,202,427.0000
Net asset value per capitalisation share 98.88 10.51 9.95
Number of distribution shares outstanding - - - Net asset value per distribution share - - -

FUND PARTNERS
Statement of net assets (continued) as at 30th September 2010
The accompanying notes are an integral part of these financial statements.
39
CSOB
Sustainables 1 CSOB Asian
Growth 3 CSOB Asian
Growth 4 (in CZK) (in CZK) (in CZK)
Assets Securities portfolio at market value 104,942,122.81 175,092,487.60 228,797,321.64 Cash at banks 13,457,769.10 19,678,301.55 28,925,007.19 Formation expenses, net 6,605.36 3,320.25 2,525.32 Receivable on treasury transactions - - - Income receivable on portfolio 29,596.00 577,022.91 64,526.00 Interest receivable on swap contracts - - - Interest receivable on bank accounts 2,780.44 27,976.84 5,971.68 Unrealised gain on swap contracts 1,620,161.14 8,084,399.65 3,476.43 Other receivables - - -
Total assets 120,059,034.85 203,463,508.80 257,798,828.26
Liabilities Payable on redemptions of shares - - - Interest payable on swap contracts 2,759.80 150,642.84 3,598.17 Unrealised loss on swap contracts - - - Interest on bank liabilities and expenses payable 769,895.12 1,348,885.50 1,839,348.63 Other liabilities - - -
Total liabilities 772,654.92 1,499,528.34 1,842,946.80
Net assets at the end of the period 119,286,379.93 201,963,980.46 255,955,881.46
Number of capitalisation shares outstanding 11,840,369.0000 19,411,647.0000 25,662,165.0000
Net asset value per capitalisation share 10.07 10.40 9.97
Number of distribution shares outstanding - - - Net asset value per distribution share - - -

FUND PARTNERS
Statement of net assets (continued) as at 30th September 2010
The accompanying notes are an integral part of these financial statements.
40
CSOB Asian
Winners 1 CSOB Asian
Winners 2 Kredyt Bank
Conservative 4 (in CZK) (in CZK) (in PLN)
Assets Securities portfolio at market value 62,747,243.11 121,721,079.28 30,566,979.15 Cash at banks 8,296,490.85 15,477,031.38 2,129,264.11 Formation expenses, net 6,250.28 9,421.61 - Receivable on treasury transactions - - - Income receivable on portfolio 17,696.00 34,328.00 272,461.32 Interest receivable on swap contracts - - - Interest receivable on bank accounts 1,931.78 4,247.19 13,298.72 Unrealised gain on swap contracts 1,532,411.34 - - Other receivables - - -
Total assets 72,602,023.36 137,246,107.46 32,982,003.30
Liabilities Payable on redemptions of shares - - - Interest payable on swap contracts 1,791.13 1,741.02 131,362.28 Unrealised loss on swap contracts - 901,733.44 974,397.52 Interest on bank liabilities and expenses payable 481,205.84 1,249,257.80 244,208.19 Other liabilities - - -
Total liabilities 482,996.97 2,152,732.26 1,349,967.99
Net assets at the end of the period 72,119,026.39 135,093,375.20 31,632,035.31
Number of capitalisation shares outstanding 7,099,352.0000 13,628,591.0000 323,303.0000
Net asset value per capitalisation share 10.16 9.91 97.84
Number of distribution shares outstanding - - - Net asset value per distribution share - - -

FUND PARTNERS
Statement of net assets (continued) as at 30th September 2010
The accompanying notes are an integral part of these financial statements.
41
Kredyt Bank
Conservative 5 Kredyt Bank
Conservative 6 Kredyt Bank
Financials 1 (in PLN) (in PLN) (in PLN)
Assets Securities portfolio at market value 73,202,598.70 58,829,711.08 57,871,188.69 Cash at banks 7,416,761.35 6,197,318.77 4,517,416.77 Formation expenses, net 645.20 - 723.42 Receivable on treasury transactions - - - Income receivable on portfolio 652,490.64 524,382.91 515,839.45 Interest receivable on swap contracts - - - Interest receivable on bank accounts 34,008.35 27,352.40 25,196.37 Unrealised gain on swap contracts - 1,659,842.60 - Other receivables - - -
Total assets 81,306,504.24 67,238,607.76 62,930,364.70
Liabilities Payable on redemptions of shares - - - Interest payable on swap contracts 394,601.49 393,062.01 284,546.25 Unrealised loss on swap contracts 3,381,973.28 - 2,088,544.70 Interest on bank liabilities and expenses payable 538,486.57 414,806.80 437,411.94 Other liabilities - - -
Total liabilities 4,315,061.34 807,868.81 2,810,502.89
Net assets at the end of the period 76,991,442.90 66,430,738.95 60,119,861.81
Number of capitalisation shares outstanding 802,165.0000 647,810.0000 615,678.0000
Net asset value per capitalisation share 95.98 102.55 97.65
Number of distribution shares outstanding - - - Net asset value per distribution share - - -

FUND PARTNERS
Statement of net assets (continued) as at 30th September 2010
The accompanying notes are an integral part of these financial statements.
42
Kredyt Bank
Central European Winners 1
Kredyt Bank Conservative 7
Kredyt Bank BRIC 1
(in PLN) (in PLN) (in PLN)
Assets Securities portfolio at market value 60,949,528.58 35,855,932.10 88,370,256.60 Cash at banks 8,032,401.64 3,876,948.11 11,015,024.66 Formation expenses, net 1,312.82 645.20 2,276.60 Receivable on treasury transactions - - - Income receivable on portfolio 46,300.23 319,605.35 67,130.48 Interest receivable on swap contracts - - - Interest receivable on bank accounts 5,775.14 16,772.61 8,036.50 Unrealised gain on swap contracts - - 527,422.35 Other receivables - - -
Total assets 69,035,318.41 40,069,903.37 99,990,147.19
Liabilities Payable on redemptions of shares - - - Interest payable on swap contracts 27,828.88 189,525.82 42,954.00 Unrealised loss on swap contracts 4,989,028.85 2,897,455.63 - Interest on bank liabilities and expenses payable 678,297.30 267,117.10 808,524.14 Other liabilities - - -
Total liabilities 5,695,155.03 3,354,098.55 851,478.14
Net assets at the end of the period 63,340,163.38 36,715,804.82 99,138,669.05
Number of capitalisation shares outstanding 688,691.0000 399,759.0000 990,843.0000
Net asset value per capitalisation share 91.97 91.84 100.05
Number of distribution shares outstanding - - - Net asset value per distribution share - - -

FUND PARTNERS
Statement of net assets (continued) as at 30th September 2010
The accompanying notes are an integral part of these financial statements.
43
Centea Distri
Opportunity 1 Centea Distri
Opportunity 2 CSOB Rastovy
Plus SKK 3 (in EUR) (in EUR) (in EUR)
Assets Securities portfolio at market value 5,762,223.32 1,416,832.72 5,754,713.72 Cash at banks 465,170.76 196,308.91 475,801.58 Formation expenses, net - - 132.54 Receivable on treasury transactions - - - Income receivable on portfolio 22,881.89 296.64 13,376.49 Interest receivable on swap contracts 10,899.35 82.87 10,431.34 Interest receivable on bank accounts 1,376.54 30.15 821.57 Unrealised gain on swap contracts 308,118.45 232,293.03 24,841.39 Other receivables - - -
Total assets 6,570,670.31 1,845,844.32 6,280,118.63
Liabilities Payable on redemptions of shares - - - Interest payable on swap contracts - - - Unrealised loss on swap contracts - - - Interest on bank liabilities and expenses payable 35,740.06 13,424.78 45,843.07 Other liabilities - 34,315.31 -
Total liabilities 35,740.06 47,740.09 45,843.07
Net assets at the end of the period 6,534,930.25 1,798,104.23 6,234,275.56
Number of capitalisation shares outstanding - - 18,587,097.0000
Net asset value per capitalisation share - - 0.335409
Number of distribution shares outstanding 6,271.0000 1,567.0000 - Net asset value per distribution share 1,042.09 1,147.48 -

FUND PARTNERS
Statement of net assets (continued) as at 30th September 2010
The accompanying notes are an integral part of these financial statements.
44
CSOB Reality
SKK 1 CSOB World Tree 3 CSOB World Tree
SKK 1 (in EUR) (in CZK) (in EUR)
Assets Securities portfolio at market value 7,136,017.80 18,875,380.96 9,395,923.57 Cash at banks 880,055.07 1,785,133.87 1,022,253.10 Formation expenses, net 39.04 - 45.29 Receivable on treasury transactions - - - Income receivable on portfolio 1,496.77 62,203.84 21,852.91 Interest receivable on swap contracts 800.26 16,441.29 2,550.25 Interest receivable on bank accounts 97.67 4,531.21 1,231.87 Unrealised gain on swap contracts 24,062.63 2,571,151.96 982,191.91 Other receivables - - -
Total assets 8,042,569.24 23,314,843.13 11,426,048.90
Liabilities Payable on redemptions of shares - - - Interest payable on swap contracts - - - Unrealised loss on swap contracts - - - Interest on bank liabilities and expenses payable 84,518.22 187,583.82 53,095.59 Other liabilities - - -
Total liabilities 84,518.22 187,583.82 53,095.59
Net assets at the end of the period 7,958,051.02 23,127,259.31 11,372,953.31
Number of capitalisation shares outstanding 24,004,978.0000 2,024,838.0000 31,339.0000
Net asset value per capitalisation share 0.331517 11.42 362.90
Number of distribution shares outstanding - - - Net asset value per distribution share - - -

FUND PARTNERS
Statement of net assets (continued) as at 30th September 2010
The accompanying notes are an integral part of these financial statements.
45
CSOB World Tree
CZK 1 World Tree USD 1 CSOB World Tree 4
(in CZK) (in USD) (in CZK)
Assets Securities portfolio at market value 189,944,057.29 8,172,048.83 127,180,955.09 Cash at banks 20,547,669.74 929,022.03 16,262,161.09 Formation expenses, net - 27.55 - Receivable on treasury transactions - - - Income receivable on portfolio 625,967.55 12,746.93 35,868.00 Interest receivable on swap contracts - 20,467.04 - Interest receivable on bank accounts 31,238.07 1,144.66 3,363.69 Unrealised gain on swap contracts 20,710,785.82 1,220,736.36 11,867,106.99 Other receivables - - -
Total assets 231,859,718.47 10,356,193.40 155,349,454.86
Liabilities Payable on redemptions of shares - - - Interest payable on swap contracts 177,042.26 - 6,374.99 Unrealised loss on swap contracts - - - Interest on bank liabilities and expenses payable 896,281.17 75,647.27 871,500.37 Other liabilities - - -
Total liabilities 1,073,323.43 75,647.27 877,875.36
Net assets at the end of the period 230,786,395.04 10,280,546.13 154,471,579.50
Number of capitalisation shares outstanding 21,067,379.0000 9,046.0000 14,281.0000
Net asset value per capitalisation share 10.95 1,136.47 10,816.58
Number of distribution shares outstanding - - - Net asset value per distribution share - - -

FUND PARTNERS
Statement of net assets (continued) as at 30th September 2010
The accompanying notes are an integral part of these financial statements.
46
CSOB World Tree 5 CSOB World Tree 6 CSOB World Tree 7 (in CZK) (in CZK) (in CZK)
Assets Securities portfolio at market value 79,377,159.27 46,691,731.64 181,301,243.30 Cash at banks 10,263,599.80 5,677,881.35 20,503,657.34 Formation expenses, net - - 397.83 Receivable on treasury transactions - - - Income receivable on portfolio 22,386.00 153,872.80 597,484.70 Interest receivable on swap contracts - - - Interest receivable on bank accounts 2,124.29 8,158.12 29,832.66 Unrealised gain on swap contracts 7,266,764.01 2,768,415.33 12,788,997.82 Other receivables - - -
Total assets 96,932,033.37 55,300,059.24 215,221,613.65
Liabilities Payable on redemptions of shares - - - Interest payable on swap contracts 3,685.50 61,446.79 184,162.78 Unrealised loss on swap contracts - - - Interest on bank liabilities and expenses payable 533,477.59 405,028.35 1,255,822.05 Other liabilities - - -
Total liabilities 537,163.09 466,475.14 1,439,984.83
Net assets at the end of the period 96,394,870.28 54,833,584.10 213,781,628.82
Number of capitalisation shares outstanding 8,929,283.0000 5,208,540.0000 20,190,657.0000
Net asset value per capitalisation share 10.80 10.53 10.59
Number of distribution shares outstanding - - - Net asset value per distribution share - - -

FUND PARTNERS
Statement of net assets (continued) as at 30th September 2010
The accompanying notes are an integral part of these financial statements.
47
CSOB World Tree 8 CSOB World Tree
EUR 1 CSOB World Tree 9
(in CZK) (in EUR) (in CZK)
Assets Securities portfolio at market value 123,235,583.19 2,908,242.48 88,763,195.48 Cash at banks 13,130,197.63 361,188.90 9,996,886.49 Formation expenses, net 903.29 - 840.88 Receivable on treasury transactions - - - Income receivable on portfolio 406,125.91 610.32 292,522.02 Interest receivable on swap contracts - 142.32 - Interest receivable on bank accounts 19,771.54 71.43 15,130.28 Unrealised gain on swap contracts 11,183,375.64 329,403.70 8,523,242.07 Other receivables - - -
Total assets 147,975,957.20 3,599,659.15 107,591,817.22
Liabilities Payable on redemptions of shares - - - Interest payable on swap contracts 103,552.98 - 58,502.24 Unrealised loss on swap contracts - - - Interest on bank liabilities and expenses payable 1,093,027.69 26,746.36 509,657.97 Other liabilities - - -
Total liabilities 1,196,580.67 26,746.36 568,160.21
Net assets at the end of the period 146,779,376.53 3,572,912.79 107,023,657.01
Number of capitalisation shares outstanding 13,581,547.0000 3,237.0000 9,891,651.0000
Net asset value per capitalisation share 10.81 1,103.77 10.82
Number of distribution shares outstanding - - - Net asset value per distribution share - - -

FUND PARTNERS
Statement of net assets (continued) as at 30th September 2010
The accompanying notes are an integral part of these financial statements.
48
CSOB World Tree 10 CSOB Strom SKK 2 CSOB Strom SKK 5 (in CZK) (in EUR) (in EUR)
Assets Securities portfolio at market value 123,980,060.23 3,286,184.78 2,398,750.84 Cash at banks 12,883,371.07 403,270.09 277,371.77 Formation expenses, net - 114.18 - Receivable on treasury transactions - - - Income receivable on portfolio 408,581.37 691.17 5,574.49 Interest receivable on swap contracts - 603.54 5,307.93 Interest receivable on bank accounts 19,906.50 63.09 345.89 Unrealised gain on swap contracts 14,436,426.61 275,963.54 270,960.09 Other receivables - - -
Total assets 151,728,345.78 3,966,890.39 2,958,311.01
Liabilities Payable on redemptions of shares - - - Interest payable on swap contracts 46,514.28 - - Unrealised loss on swap contracts - - - Interest on bank liabilities and expenses payable 950,340.19 31,819.83 23,339.71 Other liabilities - - -
Total liabilities 996,854.47 31,819.83 23,339.71
Net assets at the end of the period 150,731,491.31 3,935,070.56 2,934,971.30
Number of capitalisation shares outstanding 13,684,623.0000 11,018,918.0000 7,953,371.0000
Net asset value per capitalisation share 11.01 0.357120 0.369022
Number of distribution shares outstanding - - - Net asset value per distribution share - - -

FUND PARTNERS
Statement of net assets (continued) as at 30th September 2010
The accompanying notes are an integral part of these financial statements.
49
CSOB World Tree 11 CSOB World Tree 12 CSOB Staircase
Click 1 (in CZK) (in CZK) (in CZK)
Assets Securities portfolio at market value 62,586,789.36 63,231,832.80 90,203,782.94 Cash at banks 7,249,026.93 6,268,269.64 8,551,236.21 Formation expenses, net 3,726.68 3,004.25 3,286.59 Receivable on treasury transactions - - - Income receivable on portfolio 206,255.00 208,382.97 297,269.06 Interest receivable on swap contracts - - - Interest receivable on bank accounts 11,151.69 10,967.25 14,806.02 Unrealised gain on swap contracts 6,541,360.91 6,169,730.15 - Other receivables - - -
Total assets 76,598,310.57 75,892,187.06 99,070,380.82
Liabilities Payable on redemptions of shares - - - Interest payable on swap contracts 18,124.75 59,249.86 5,147.44 Unrealised loss on swap contracts - - 592,177.52 Interest on bank liabilities and expenses payable 427,033.23 389,239.74 635,250.79 Other liabilities - - -
Total liabilities 445,157.98 448,489.60 1,232,575.75
Net assets at the end of the period 76,153,152.59 75,443,697.46 97,837,805.07
Number of capitalisation shares outstanding 6,984,710.0000 6,959,879.0000 9,909,953.0000
Net asset value per capitalisation share 10.90 10.84 9.87
Number of distribution shares outstanding - - - Net asset value per distribution share - - -

FUND PARTNERS
Statement of net assets (continued) as at 30th September 2010
The accompanying notes are an integral part of these financial statements.
50
NLB SKLADI -
GARANTIRANI SKLAD EVROPA 1
CSOB Asian Growth 1
CSOB Central Europe Winners 1
(in EUR) (in CZK) (in CZK)
Assets Securities portfolio at market value 5,099,873.87 446,348,549.72 87,422,096.79 Cash at banks 602,913.30 46,450,670.09 9,777,882.95 Formation expenses, net 34.20 6,424.50 1,619.33 Receivable on treasury transactions - - - Income receivable on portfolio 13,493.91 1,470,958.28 288,102.21 Interest receivable on swap contracts 10,890.47 - - Interest receivable on bank accounts 845.79 70,710.14 14,808.83 Unrealised gain on swap contracts 113,207.53 46,469,697.51 3,732,328.33 Other receivables - - -
Total assets 5,841,259.07 540,817,010.24 101,236,838.44
Liabilities Payable on redemptions of shares - - - Interest payable on swap contracts - 664,112.89 44,420.74 Unrealised loss on swap contracts - - - Interest on bank liabilities and expenses payable 46,545.83 1,913,282.57 617,947.28 Other liabilities - - -
Total liabilities 46,545.83 2,577,395.46 662,368.02
Net assets at the end of the period 5,794,713.24 538,239,614.78 100,574,470.42
Number of capitalisation shares outstanding 57,023.0000 49,053,460.0000 9,777,657.0000
Net asset value per capitalisation share 101.62 10.97 10.29
Number of distribution shares outstanding - - - Net asset value per distribution share - - -

FUND PARTNERS
Statement of net assets (continued) as at 30th September 2010
The accompanying notes are an integral part of these financial statements.
51
CSOB Stock
Selection Short Term 4
Kredyt Bank Asia 1 Kredyt Bank Sustainables 1
(in CZK) (in PLN) (in PLN)
Assets Securities portfolio at market value 97,406,114.60 35,339,549.68 52,254,401.06 Cash at banks 11,035,148.50 3,371,557.09 5,369,403.75 Formation expenses, net 213.05 1,129.97 - Receivable on treasury transactions - - - Income receivable on portfolio 321,004.86 315,001.59 465,773.86 Interest receivable on swap contracts - - - Interest receivable on bank accounts 15,351.22 15,606.52 23,125.47 Unrealised gain on swap contracts 4,386,082.31 - - Other receivables - - -
Total assets 113,163,914.54 39,042,844.85 58,112,704.14
Liabilities Payable on redemptions of shares - - - Interest payable on swap contracts 63,457.31 178,838.87 302,745.76 Unrealised loss on swap contracts - 1,596,774.38 2,291,727.90 Interest on bank liabilities and expenses payable 538,871.29 338,560.71 390,175.00 Other liabilities - - -
Total liabilities 602,328.60 2,114,173.96 2,984,648.66
Net assets at the end of the period 112,561,585.94 36,928,670.89 55,128,055.48
Number of capitalisation shares outstanding 10,855,832.0000 389,328.0000 577,660.0000
Net asset value per capitalisation share 10.37 94.85 95.43
Number of distribution shares outstanding - - - Net asset value per distribution share - - -

FUND PARTNERS
Statement of net assets (continued) as at 30th September 2010
The accompanying notes are an integral part of these financial statements.
52
NLB Skladi -
Garantirani sklad Azija 1
Warta High Dividend Europe 1
CSOB World Growth Plus 11
(in USD) (in PLN) (in CZK)
Assets Securities portfolio at market value 1,828,838.20 44,700,856.73 71,477,712.39 Cash at banks 216,697.19 4,827,356.05 8,415,924.42 Formation expenses, net - 862.01 745.78 Receivable on treasury transactions - - - Income receivable on portfolio 2,852.60 398,444.29 235,556.31 Interest receivable on swap contracts 6,728.12 - - Interest receivable on bank accounts 276.10 20,451.98 11,719.70 Unrealised gain on swap contracts 649,869.88 - 3,230,905.62 Other receivables - - -
Total assets 2,705,262.09 49,947,971.06 83,372,564.22
Liabilities Payable on redemptions of shares - - - Interest payable on swap contracts - 315,068.97 33,474.24 Unrealised loss on swap contracts - 813,378.99 - Interest on bank liabilities and expenses payable 23,819.81 355,529.14 420,880.03 Other liabilities - - -
Total liabilities 23,819.81 1,483,977.10 454,354.27
Net assets at the end of the period 2,681,442.28 48,463,993.96 82,918,209.95
Number of capitalisation shares outstanding 20,390.0000 490,234.1851 8,010,629.0000
Net asset value per capitalisation share 131.51 98.86 10.35
Number of distribution shares outstanding - - - Net asset value per distribution share - - -

FUND PARTNERS
Statement of net assets (continued) as at 30th September 2010
The accompanying notes are an integral part of these financial statements.
53
CSOB World
Growth Plus 12 Kredyt Bank
Optimised Europe Participation 1
Kredyt Bank Global Real
Estate 1 (in CZK) (in PLN) (in PLN)
Assets Securities portfolio at market value 72,620,133.97 101,722,803.09 239,420,741.80 Cash at banks 8,191,031.45 10,358,873.10 21,357,922.36 Formation expenses, net 1,010.92 - - Receivable on treasury transactions - - - Income receivable on portfolio 239,321.23 906,714.14 2,134,096.01 Interest receivable on swap contracts - - - Interest receivable on bank accounts 12,627.45 45,646.36 102,962.66 Unrealised gain on swap contracts 3,152,442.97 - - Other receivables - - -
Total assets 84,216,567.99 113,034,036.69 263,015,722.83
Liabilities Payable on redemptions of shares - - - Interest payable on swap contracts 55,777.61 679,185.87 1,238,907.87 Unrealised loss on swap contracts - 2,683,102.49 13,415,307.52 Interest on bank liabilities and expenses payable 371,580.40 608,535.39 2,303,391.76 Other liabilities - - -
Total liabilities 427,358.01 3,970,823.75 16,957,607.15
Net assets at the end of the period 83,789,209.98 109,063,212.94 246,058,115.68
Number of capitalisation shares outstanding 8,098,531.0000 1,125,604.0000 2,612,112.0000
Net asset value per capitalisation share 10.35 96.89 94.20
Number of distribution shares outstanding - - - Net asset value per distribution share - - -

FUND PARTNERS
Statement of net assets (continued) as at 30th September 2010
The accompanying notes are an integral part of these financial statements.
54
CSOB World
Growth Plus 13 CSOB World
Growth Plus 14 CSOB World
Growth Plus 15 (in CZK) (in CZK) (in CZK)
Assets Securities portfolio at market value 128,649,704.99 95,659,163.38 124,401,497.97 Cash at banks 14,049,932.95 12,422,074.07 15,981,840.65 Formation expenses, net 2,259.94 2,015.20 3,984.45 Receivable on treasury transactions - - - Income receivable on portfolio 423,968.61 26,978.00 35,084.00 Interest receivable on swap contracts - - 538.62 Interest receivable on bank accounts 21,233.99 2,567.95 3,301.95 Unrealised gain on swap contracts 2,764,060.88 2,019,455.96 2,796,951.04 Other receivables - - -
Total assets 145,911,161.36 110,132,254.56 143,223,198.68
Liabilities Payable on redemptions of shares - - - Interest payable on swap contracts 46,583.92 3,893.45 - Unrealised loss on swap contracts - - - Interest on bank liabilities and expenses payable 756,439.13 606,588.70 924,590.33 Other liabilities - - -
Total liabilities 803,023.05 610,482.15 924,590.33
Net assets at the end of the period 145,108,138.31 109,521,772.41 142,298,608.35
Number of capitalisation shares outstanding 14,307,934.0000 10,801,068.0000 13,961,559.0000
Net asset value per capitalisation share 10.14 10.14 10.19
Number of distribution shares outstanding - - - Net asset value per distribution share - - -

FUND PARTNERS
Statement of net assets (continued) as at 30th September 2010
The accompanying notes are an integral part of these financial statements.
55
CSOB World
Growth Plus 16 CSOB Short Term
Growth 5 CSOB Short Term
Growth 6 (in CZK) (in CZK) (in CZK)
Assets Securities portfolio at market value 134,925,325.75 246,321,070.98 400,754,641.68 Cash at banks 17,184,949.67 2,768,204.33 50,416,642.14 Formation expenses, net 3,136.93 137.11 3,984.45 Receivable on treasury transactions - 24,881,660.42 - Income receivable on portfolio 38,052.00 811,760.74 113,022.00 Interest receivable on swap contracts 2,401.90 - 10,311.23 Interest receivable on bank accounts 4,701.14 809.73 10,373.60 Unrealised gain on swap contracts 5,325,888.28 5,500,758.91 562,150.80 Other receivables - - 3,392.27
Total assets 157,484,455.67 280,284,402.22 451,874,518.17
Liabilities Payable on redemptions of shares - - - Interest payable on swap contracts - 189,920.58 - Unrealised loss on swap contracts - - - Interest on bank liabilities and expenses payable 1,058,147.21 1,303,105.27 3,319,986.01 Other liabilities - - 83,504.04
Total liabilities 1,058,147.21 1,493,025.85 3,403,490.05
Net assets at the end of the period 156,426,308.46 278,791,376.37 448,471,028.12
Number of capitalisation shares outstanding 15,132,524.0000 27,472,884.0000 44,797,508.0000
Net asset value per capitalisation share 10.34 10.15 10.01
Number of distribution shares outstanding - - - Net asset value per distribution share - - -

FUND PARTNERS
Statement of net assets (continued) as at 30th September 2010
The accompanying notes are an integral part of these financial statements.
56
CSOB Financials
Short Term Growth 1
CSOB Europe Real Estate
Growth Plus 2
CSOB Pharma & Biotech 1
(in CZK) (in CZK) (in CZK)
Assets Securities portfolio at market value 491,102,149.41 202,437,535.37 237,136,908.13 Cash at banks 61,521,151.87 25,131,342.55 29,743,522.90 Formation expenses, net 2,001.44 6,863.61 3,005.96 Receivable on treasury transactions - - - Income receivable on portfolio 138,502.00 57,092.00 66,878.00 Interest receivable on swap contracts - - - Interest receivable on bank accounts 12,665.72 6,903.87 6,134.43 Unrealised gain on swap contracts 9,522.17 - - Other receivables - - -
Total assets 552,785,992.61 227,639,737.40 266,956,449.42
Liabilities Payable on redemptions of shares - - - Interest payable on swap contracts 8,553.20 8,607.62 9,788.63 Unrealised loss on swap contracts - 3,525,088.28 2,388,917.77 Interest on bank liabilities and expenses payable 3,453,936.61 1,440,481.80 1,648,011.56 Other liabilities - - -
Total liabilities 3,462,489.81 4,974,177.70 4,046,717.96
Net assets at the end of the period 549,323,502.80 222,665,559.70 262,909,731.46
Number of capitalisation shares outstanding 54,979,429.0000 22,725,837.0000 26,650,516.0000
Net asset value per capitalisation share 9.99 9.80 9.87
Number of distribution shares outstanding - - - Net asset value per distribution share - - -
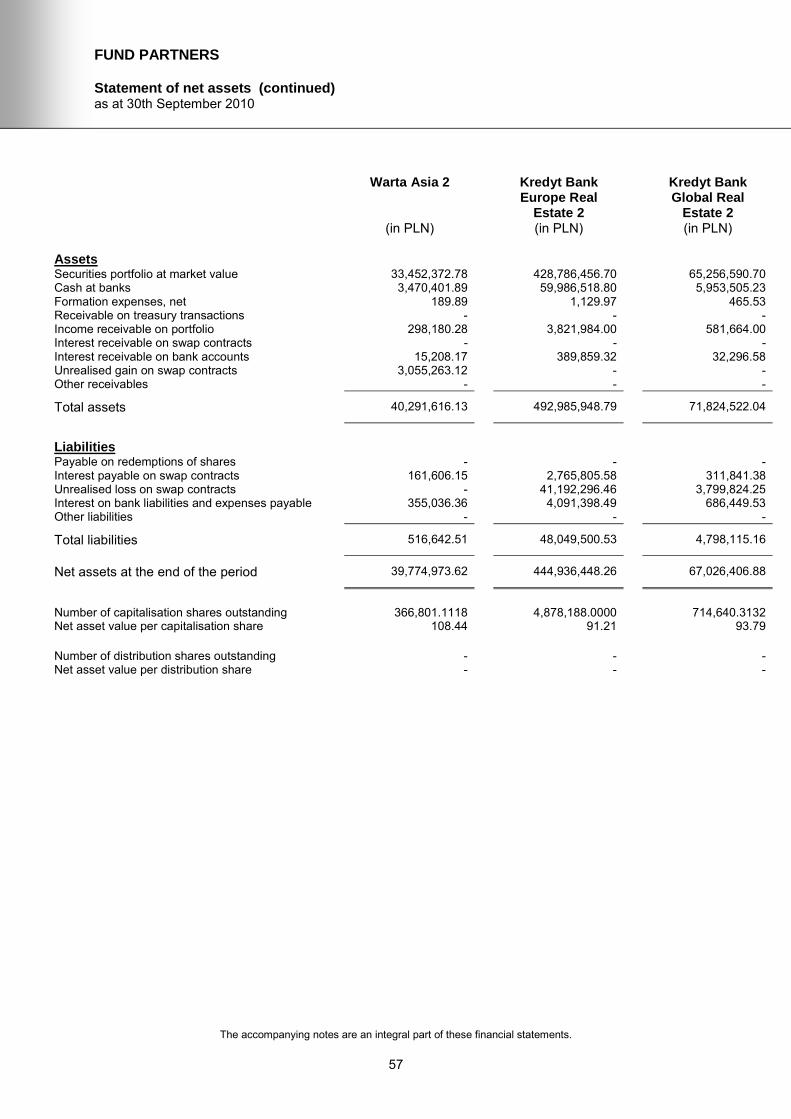
FUND PARTNERS
Statement of net assets (continued) as at 30th September 2010
The accompanying notes are an integral part of these financial statements.
57
Warta Asia 2 Kredyt Bank
Europe Real Estate 2
Kredyt Bank Global Real
Estate 2 (in PLN) (in PLN) (in PLN)
Assets Securities portfolio at market value 33,452,372.78 428,786,456.70 65,256,590.70 Cash at banks 3,470,401.89 59,986,518.80 5,953,505.23 Formation expenses, net 189.89 1,129.97 465.53 Receivable on treasury transactions - - - Income receivable on portfolio 298,180.28 3,821,984.00 581,664.00 Interest receivable on swap contracts - - - Interest receivable on bank accounts 15,208.17 389,859.32 32,296.58 Unrealised gain on swap contracts 3,055,263.12 - - Other receivables - - -
Total assets 40,291,616.13 492,985,948.79 71,824,522.04
Liabilities Payable on redemptions of shares - - - Interest payable on swap contracts 161,606.15 2,765,805.58 311,841.38 Unrealised loss on swap contracts - 41,192,296.46 3,799,824.25 Interest on bank liabilities and expenses payable 355,036.36 4,091,398.49 686,449.53 Other liabilities - - -
Total liabilities 516,642.51 48,049,500.53 4,798,115.16
Net assets at the end of the period 39,774,973.62 444,936,448.26 67,026,406.88
Number of capitalisation shares outstanding 366,801.1118 4,878,188.0000 714,640.3132
Net asset value per capitalisation share 108.44 91.21 93.79
Number of distribution shares outstanding - - - Net asset value per distribution share - - -

FUND PARTNERS
Statement of net assets (continued) as at 30th September 2010
The accompanying notes are an integral part of these financial statements.
58
Warta
Infrastructure 1 CSOB
Performance Lock 1
CSOB Bull & Bear 1
(in PLN) (in CZK) (in CZK)
Assets Securities portfolio at market value 19,555,068.50 63,728,935.82 135,107,269.60 Cash at banks 2,367,331.35 6,502,897.99 4,237,574.22 Formation expenses, net 2,234.37 3,004.25 - Receivable on treasury transactions - - - Income receivable on portfolio 14,855.04 210,019.92 445,248.84 Interest receivable on swap contracts - - - Interest receivable on bank accounts 1,751.75 10,863.24 4,088.68 Unrealised gain on swap contracts - - 4,463,677.99 Other receivables - - -
Total assets 21,941,241.01 70,455,721.22 144,257,859.33
Liabilities Payable on redemptions of shares - - - Interest payable on swap contracts 5,671.29 17,593.78 139,968.54 Unrealised loss on swap contracts 744,336.47 752,575.62 - Interest on bank liabilities and expenses payable 234,973.23 467,049.58 651,095.12 Other liabilities - - -
Total liabilities 984,980.99 1,237,218.98 791,063.66
Net assets at the end of the period 20,956,260.02 69,218,502.24 143,466,795.67
Number of capitalisation shares outstanding 215,863.1827 7,080,595.0000 13,917,818.0000
Net asset value per capitalisation share 97.08 9.78 10.31
Number of distribution shares outstanding - - - Net asset value per distribution share - - -
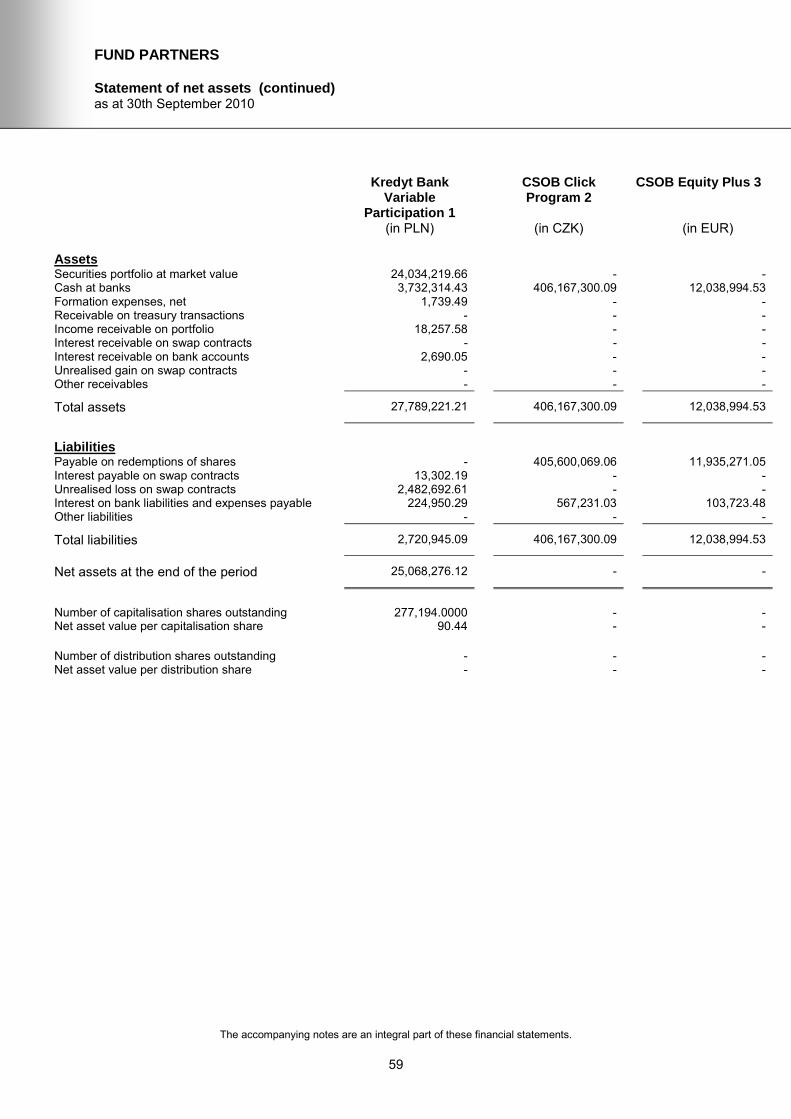
FUND PARTNERS
Statement of net assets (continued) as at 30th September 2010
The accompanying notes are an integral part of these financial statements.
59
Kredyt Bank
Variable Participation 1
CSOB Click Program 2
CSOB Equity Plus 3
(in PLN) (in CZK) (in EUR)
Assets Securities portfolio at market value 24,034,219.66 - - Cash at banks 3,732,314.43 406,167,300.09 12,038,994.53 Formation expenses, net 1,739.49 - - Receivable on treasury transactions - - - Income receivable on portfolio 18,257.58 - - Interest receivable on swap contracts - - - Interest receivable on bank accounts 2,690.05 - - Unrealised gain on swap contracts - - - Other receivables - - -
Total assets 27,789,221.21 406,167,300.09 12,038,994.53
Liabilities Payable on redemptions of shares - 405,600,069.06 11,935,271.05 Interest payable on swap contracts 13,302.19 - - Unrealised loss on swap contracts 2,482,692.61 - - Interest on bank liabilities and expenses payable 224,950.29 567,231.03 103,723.48 Other liabilities - - -
Total liabilities 2,720,945.09 406,167,300.09 12,038,994.53
Net assets at the end of the period 25,068,276.12 - -
Number of capitalisation shares outstanding 277,194.0000 - -
Net asset value per capitalisation share 90.44 - -
Number of distribution shares outstanding - - - Net asset value per distribution share - - -
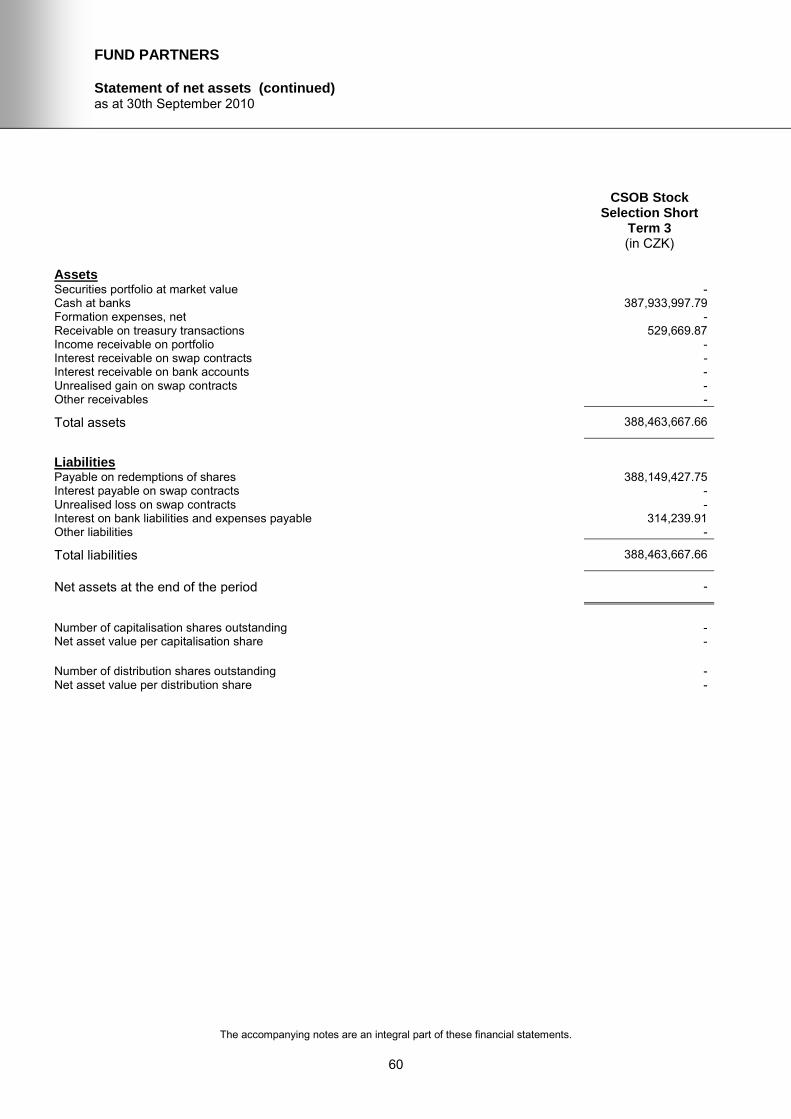
FUND PARTNERS
Statement of net assets (continued) as at 30th September 2010
The accompanying notes are an integral part of these financial statements.
60
CSOB Stock Selection Short
Term 3
(in CZK)
Assets Securities portfolio at market value - Cash at banks 387,933,997.79 Formation expenses, net - Receivable on treasury transactions 529,669.87 Income receivable on portfolio - Interest receivable on swap contracts - Interest receivable on bank accounts - Unrealised gain on swap contracts - Other receivables -
Total assets 388,463,667.66
Liabilities Payable on redemptions of shares 388,149,427.75 Interest payable on swap contracts - Unrealised loss on swap contracts - Interest on bank liabilities and expenses payable 314,239.91 Other liabilities -
Total liabilities 388,463,667.66
Net assets at the end of the period -
Number of capitalisation shares outstanding -
Net asset value per capitalisation share -
Number of distribution shares outstanding - Net asset value per distribution share -

FUND PARTNERS
Statement of net assets (continued) as at 30th September 2010
The accompanying notes are an integral part of these financial statements.
61

FUND PARTNERS
Statistical information as at 30th September 2010
The accompanying notes are an integral part of these financial statements.
62
CSOB World
Click Plus 7 CSOB World
Click Plus 14 CSOB Click
Program 1 (in CZK) (in CZK) (in CZK)
Total net assets - as at 30.09.2010 137,956,791.58 183,890,177.44 107,199,111.83 - as at 31.03.2010 137,737,300.27 187,429,378.80 109,974,954.05 - as at 31.03.2009 131,002,703.56 175,097,536.14 105,177,410.57
Number of capitalisation shares - outstanding at the beginning of the period 10,777.0000 14,715.0000 9,730.0000 - issued - - - - redeemed -110.0000 -231.0000 -250.0000 - outstanding at the end of the period 10,667.0000 14,484.0000 9,480.0000
Net asset value per capitalisation share - as at 30.09.2010 12,933.05 12,696.09 11,307.92 - as at 31.03.2010 12,780.67 12,737.30 11,302.67 - as at 31.03.2009 11,499.54 11,401.06 10,280.27
Number of distribution shares - outstanding at the beginning of the period - - - - issued - - - - redeemed - - - - outstanding at the end of the period - - -
Net asset value per distribution share - as at 30.09.2010 - - - - as at 31.03.2010 - - - - as at 31.03.2009 - - -

FUND PARTNERS
Statistical information (continued) as at 30th September 2010
The accompanying notes are an integral part of these financial statements.
63
CSOB Click
Program 4 CSOB Click
Program 5 CSOB Click
Program 6 (in CZK) (in CZK) (in CZK)
Total net assets - as at 30.09.2010 176,799,681.23 166,797,861.90 71,809,105.81 - as at 31.03.2010 181,202,348.90 167,099,961.04 73,356,266.27 - as at 31.03.2009 167,858,530.54 166,957,496.69 68,157,751.01
Number of capitalisation shares - outstanding at the beginning of the period 16,909,808.0000 15,519,300.0000 7,063,611.0000 - issued - - - - redeemed -132,902.0000 - -148,061.0000 - outstanding at the end of the period 16,776,906.0000 15,519,300.0000 6,915,550.0000
Net asset value per capitalisation share - as at 30.09.2010 10.54 10.75 10.38 - as at 31.03.2010 10.72 10.77 10.39 - as at 31.03.2009 9.67 9.62 9.26
Number of distribution shares - outstanding at the beginning of the period - - - - issued - - - - redeemed - - - - outstanding at the end of the period - - -
Net asset value per distribution share - as at 30.09.2010 - - - - as at 31.03.2010 - - - - as at 31.03.2009 - - -

FUND PARTNERS
Statistical information (continued) as at 30th September 2010
The accompanying notes are an integral part of these financial statements.
64
CSOB World
Click Plus 18 CSOB World Click
EUR Plus 4 CSOB Europe
Click Plus 3 (in CZK) (in EUR) (in EUR)
Total net assets - as at 30.09.2010 277,341,034.49 4,641,994.05 4,258,414.61 - as at 31.03.2010 286,842,844.30 4,680,973.60 4,417,797.19 - as at 31.03.2009 265,557,081.02 4,333,153.35 4,351,908.29
Number of capitalisation shares - outstanding at the beginning of the period 25,695,145.0000 4,474.0000 11,422.0000 - issued - - - - redeemed -316,448.0000 -16.0000 -230.0000 - outstanding at the end of the period 25,378,697.0000 4,458.0000 11,192.0000
Net asset value per capitalisation share - as at 30.09.2010 10.93 1,041.27 380.49 - as at 31.03.2010 11.16 1,046.26 386.78 - as at 31.03.2009 9.92 964.21 338.70
Number of distribution shares - outstanding at the beginning of the period - - - - issued - - - - redeemed - - - - outstanding at the end of the period - - -
Net asset value per distribution share - as at 30.09.2010 - - - - as at 31.03.2010 - - - - as at 31.03.2009 - - -

FUND PARTNERS
Statistical information (continued) as at 30th September 2010
The accompanying notes are an integral part of these financial statements.
65
CSOB World
Click Plus 19 CSOB World
Click Plus 20 CSOB World
Click Plus 21 (in CZK) (in CZK) (in CZK)
Total net assets - as at 30.09.2010 127,493,267.60 69,829,267.67 218,409,333.57 - as at 31.03.2010 129,711,836.27 74,353,583.17 222,233,484.91 - as at 31.03.2009 121,901,444.25 69,873,365.14 200,639,798.35
Number of capitalisation shares - outstanding at the beginning of the period 12,072,426.0000 6,757,624.0000 20,485,100.0000 - issued - - - - redeemed -265,703.0000 -295,133.0000 -300,000.0000 - outstanding at the end of the period 11,806,723.0000 6,462,491.0000 20,185,100.0000
Net asset value per capitalisation share - as at 30.09.2010 10.80 10.81 10.82 - as at 31.03.2010 10.74 11.00 10.85 - as at 31.03.2009 9.78 9.80 9.75
Number of distribution shares - outstanding at the beginning of the period - - - - issued - - - - redeemed - - - - outstanding at the end of the period - - -
Net asset value per distribution share - as at 30.09.2010 - - - - as at 31.03.2010 - - - - as at 31.03.2009 - - -

FUND PARTNERS
Statistical information (continued) as at 30th September 2010
The accompanying notes are an integral part of these financial statements.
66
CSOB World
Click Plus 22 CSOB World
Click Plus 23 CSOB World
Click Plus 24 (in CZK) (in CZK) (in CZK)
Total net assets - as at 30.09.2010 131,775,116.42 85,409,977.85 294,355,713.66 - as at 31.03.2010 140,077,362.96 88,242,352.32 295,754,587.18 - as at 31.03.2009 128,107,814.21 80,657,744.31 272,186,511.13
Number of capitalisation shares - outstanding at the beginning of the period 12,892,510.0000 7,970,267.0000 28,112,378.0000 - issued - - - - redeemed -301,631.0000 -205,858.0000 -229,622.0000 - outstanding at the end of the period 12,590,879.0000 7,764,409.0000 27,882,756.0000
Net asset value per capitalisation share - as at 30.09.2010 10.47 11.00 10.56 - as at 31.03.2010 10.87 11.07 10.52 - as at 31.03.2009 9.64 9.79 9.51
Number of distribution shares - outstanding at the beginning of the period - - - - issued - - - - redeemed - - - - outstanding at the end of the period - - -
Net asset value per distribution share - as at 30.09.2010 - - - - as at 31.03.2010 - - - - as at 31.03.2009 - - -

FUND PARTNERS
Statistical information (continued) as at 30th September 2010
The accompanying notes are an integral part of these financial statements.
67
CSOB World Click
USD Plus 6 CSOB World
Growth Plus 1 CSOB Europe
Real Estate Growth Plus 1
(in USD) (in CZK) (in CZK)
Total net assets - as at 30.09.2010 3,772,006.64 332,602,762.89 154,017,324.36 - as at 31.03.2010 3,884,905.29 336,378,904.27 166,642,021.40 - as at 31.03.2009 3,720,291.73 325,780,198.34 153,934,946.89
Number of capitalisation shares - outstanding at the beginning of the period 3,326.0000 29,521.0000 17,037,820.0000 - issued - - - - redeemed -82.0000 -358.0000 -1,371,089.0000 - outstanding at the end of the period 3,244.0000 29,163.0000 15,666,731.0000
Net asset value per capitalisation share - as at 30.09.2010 1,162.76 11,404.96 9.83 - as at 31.03.2010 1,168.04 11,394.56 9.78 - as at 31.03.2009 1,091.96 10,571.44 8.77
Number of distribution shares - outstanding at the beginning of the period - - - - issued - - - - redeemed - - - - outstanding at the end of the period - - -
Net asset value per distribution share - as at 30.09.2010 - - - - as at 31.03.2010 - - - - as at 31.03.2009 - - -
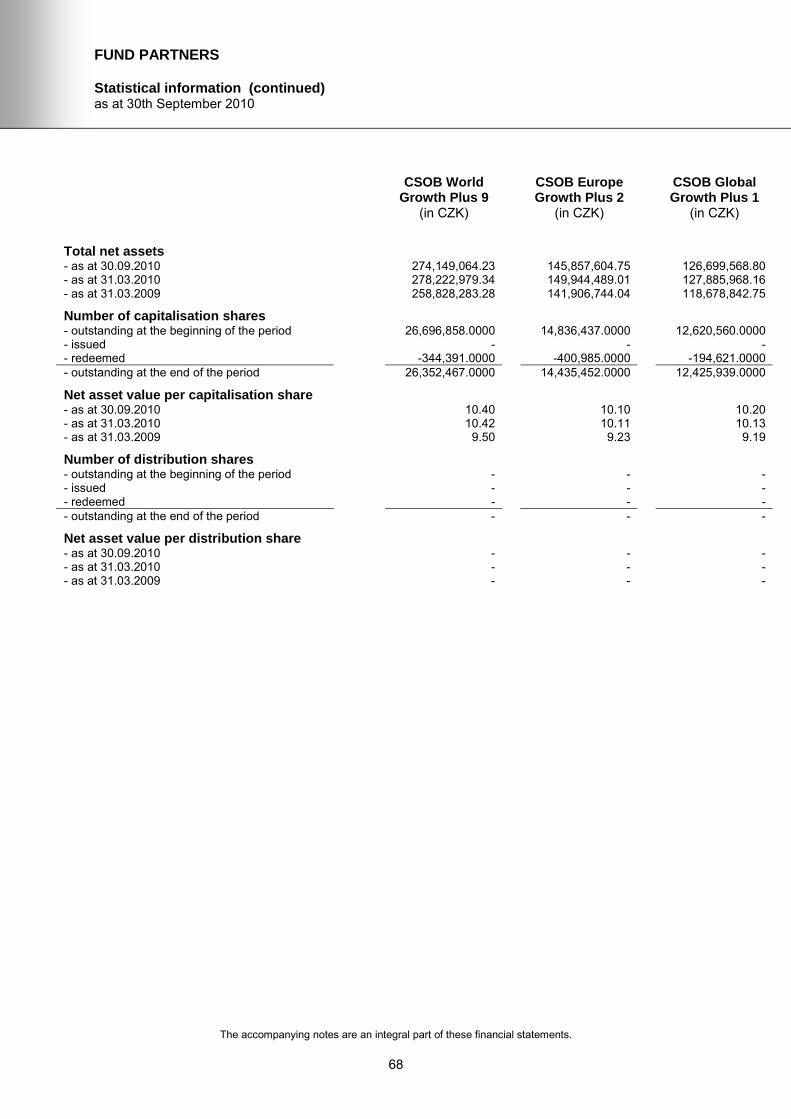
FUND PARTNERS
Statistical information (continued) as at 30th September 2010
The accompanying notes are an integral part of these financial statements.
68
CSOB World
Growth Plus 9 CSOB Europe
Growth Plus 2 CSOB Global
Growth Plus 1 (in CZK) (in CZK) (in CZK)
Total net assets - as at 30.09.2010 274,149,064.23 145,857,604.75 126,699,568.80 - as at 31.03.2010 278,222,979.34 149,944,489.01 127,885,968.16 - as at 31.03.2009 258,828,283.28 141,906,744.04 118,678,842.75
Number of capitalisation shares - outstanding at the beginning of the period 26,696,858.0000 14,836,437.0000 12,620,560.0000 - issued - - - - redeemed -344,391.0000 -400,985.0000 -194,621.0000 - outstanding at the end of the period 26,352,467.0000 14,435,452.0000 12,425,939.0000
Net asset value per capitalisation share - as at 30.09.2010 10.40 10.10 10.20 - as at 31.03.2010 10.42 10.11 10.13 - as at 31.03.2009 9.50 9.23 9.19
Number of distribution shares - outstanding at the beginning of the period - - - - issued - - - - redeemed - - - - outstanding at the end of the period - - -
Net asset value per distribution share - as at 30.09.2010 - - - - as at 31.03.2010 - - - - as at 31.03.2009 - - -

FUND PARTNERS
Statistical information (continued) as at 30th September 2010
The accompanying notes are an integral part of these financial statements.
69
CSOB Global
Growth Plus 2 CSOB Global
Growth Plus 3 CSOB US
Growth Plus USD 1
(in CZK) (in CZK) (in USD)
Total net assets - as at 30.09.2010 181,703,788.29 153,809,447.57 5,672,262.50 - as at 31.03.2010 182,643,817.11 155,412,463.47 5,900,574.22 - as at 31.03.2009 172,127,009.80 144,397,466.04 5,607,713.87
Number of capitalisation shares - outstanding at the beginning of the period 17,340,256.0000 14,943,497.0000 582,309.0000 - issued - - 400.0000 - redeemed -125,562.0000 -126,470.0000 -17,996.0000 - outstanding at the end of the period 17,214,694.0000 14,817,027.0000 564,713.0000
Net asset value per capitalisation share - as at 30.09.2010 10.56 10.38 10.04 - as at 31.03.2010 10.53 10.40 10.13 - as at 31.03.2009 9.71 9.44 9.39
Number of distribution shares - outstanding at the beginning of the period - - - - issued - - - - redeemed - - - - outstanding at the end of the period - - -
Net asset value per distribution share - as at 30.09.2010 - - - - as at 31.03.2010 - - - - as at 31.03.2009 - - -
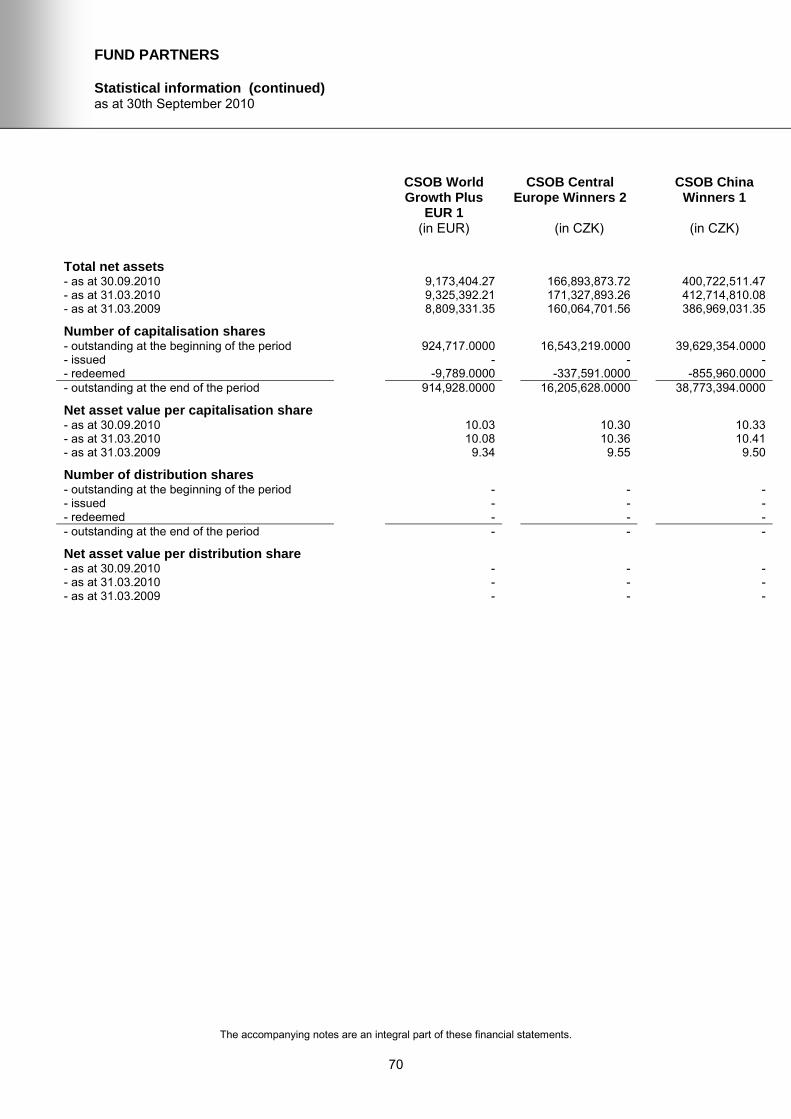
FUND PARTNERS
Statistical information (continued) as at 30th September 2010
The accompanying notes are an integral part of these financial statements.
70
CSOB World
Growth Plus EUR 1
CSOB Central Europe Winners 2
CSOB China Winners 1
(in EUR) (in CZK) (in CZK)
Total net assets - as at 30.09.2010 9,173,404.27 166,893,873.72 400,722,511.47 - as at 31.03.2010 9,325,392.21 171,327,893.26 412,714,810.08 - as at 31.03.2009 8,809,331.35 160,064,701.56 386,969,031.35
Number of capitalisation shares - outstanding at the beginning of the period 924,717.0000 16,543,219.0000 39,629,354.0000 - issued - - - - redeemed -9,789.0000 -337,591.0000 -855,960.0000 - outstanding at the end of the period 914,928.0000 16,205,628.0000 38,773,394.0000
Net asset value per capitalisation share - as at 30.09.2010 10.03 10.30 10.33 - as at 31.03.2010 10.08 10.36 10.41 - as at 31.03.2009 9.34 9.55 9.50
Number of distribution shares - outstanding at the beginning of the period - - - - issued - - - - redeemed - - - - outstanding at the end of the period - - -
Net asset value per distribution share - as at 30.09.2010 - - - - as at 31.03.2010 - - - - as at 31.03.2009 - - -

FUND PARTNERS
Statistical information (continued) as at 30th September 2010
The accompanying notes are an integral part of these financial statements.
71
CSOB Asian
Growth 2 Warta
Financials 1 Warta Pharma 1
(in CZK) (in PLN) (in PLN)
Total net assets - as at 30.09.2010 270,798,687.75 49,219,353.60 32,045,666.28 - as at 31.03.2010 282,442,790.02 50,653,283.95 35,027,645.32 - as at 31.03.2009 261,552,421.54 48,037,581.46 34,170,944.13
Number of capitalisation shares - outstanding at the beginning of the period 26,775,059.0000 528,868.4955 343,666.4381 - issued - - - - redeemed -699,633.0000 -22,135.0814 -19,584.7923 - outstanding at the end of the period 26,075,426.0000 506,733.4141 324,081.6458
Net asset value per capitalisation share - as at 30.09.2010 10.39 97.13 98.88 - as at 31.03.2010 10.55 95.78 101.92 - as at 31.03.2009 9.14 85.91 92.91
Number of distribution shares - outstanding at the beginning of the period - - - - issued - - - - redeemed - - - - outstanding at the end of the period - - -
Net asset value per distribution share - as at 30.09.2010 - - - - as at 31.03.2010 - - - - as at 31.03.2009 - - -

FUND PARTNERS
Statistical information (continued) as at 30th September 2010
The accompanying notes are an integral part of these financial statements.
72
CSOB Global
Growth Plus 4 CSOB Global
Growth Plus 5 CSOB
Sustainables 1 (in CZK) (in CZK) (in CZK)
Total net assets - as at 30.09.2010 187,265,596.06 121,456,477.45 119,286,379.93 - as at 31.03.2010 188,081,502.61 122,853,219.34 119,595,465.11 - as at 31.03.2009 175,582,672.92 113,307,688.62 112,384,456.94
Number of capitalisation shares - outstanding at the beginning of the period 17,927,546.0000 12,436,114.0000 11,959,489.0000 - issued - - - - redeemed -116,317.0000 -233,687.0000 -119,120.0000 - outstanding at the end of the period 17,811,229.0000 12,202,427.0000 11,840,369.0000
Net asset value per capitalisation share - as at 30.09.2010 10.51 9.95 10.07 - as at 31.03.2010 10.49 9.88 10.00 - as at 31.03.2009 9.50 8.93 9.05
Number of distribution shares - outstanding at the beginning of the period - - - - issued - - - - redeemed - - - - outstanding at the end of the period - - -
Net asset value per distribution share - as at 30.09.2010 - - - - as at 31.03.2010 - - - - as at 31.03.2009 - - -

FUND PARTNERS
Statistical information (continued) as at 30th September 2010
The accompanying notes are an integral part of these financial statements.
73
CSOB Asian
Growth 3 CSOB Asian
Growth 4 CSOB Asian
Winners 1 (in CZK) (in CZK) (in CZK)
Total net assets - as at 30.09.2010 201,963,980.46 255,955,881.46 72,119,026.39 - as at 31.03.2010 204,936,660.49 276,281,876.97 74,536,372.50 - as at 31.03.2009 191,659,616.72 263,353,388.03 72,647,637.83
Number of capitalisation shares - outstanding at the beginning of the period 19,680,237.0000 27,816,014.0000 7,389,261.0000 - issued - - - - redeemed -268,590.0000 -2,153,849.0000 -289,909.0000 - outstanding at the end of the period 19,411,647.0000 25,662,165.0000 7,099,352.0000
Net asset value per capitalisation share - as at 30.09.2010 10.40 9.97 10.16 - as at 31.03.2010 10.41 9.93 10.09 - as at 31.03.2009 9.22 9.01 9.10
Number of distribution shares - outstanding at the beginning of the period - - - - issued - - - - redeemed - - - - outstanding at the end of the period - - -
Net asset value per distribution share - as at 30.09.2010 - - - - as at 31.03.2010 - - - - as at 31.03.2009 - - -

FUND PARTNERS
Statistical information (continued) as at 30th September 2010
The accompanying notes are an integral part of these financial statements.
74
CSOB Asian
Winners 2 Kredyt Bank
Conservative 4 Kredyt Bank
Conservative 5 (in CZK) (in PLN) (in PLN)
Total net assets - as at 30.09.2010 135,093,375.20 31,632,035.31 76,991,442.90 - as at 31.03.2010 140,698,927.53 33,210,266.48 78,591,472.37 - as at 31.03.2009 128,267,233.72 31,310,299.45 73,876,090.76
Number of capitalisation shares - outstanding at the beginning of the period 14,253,470.0000 343,776.0000 831,950.0000 - issued - - - - redeemed -624,879.0000 -20,473.0000 -29,785.0000 - outstanding at the end of the period 13,628,591.0000 323,303.0000 802,165.0000
Net asset value per capitalisation share - as at 30.09.2010 9.91 97.84 95.98 - as at 31.03.2010 9.87 96.60 94.47 - as at 31.03.2009 8.93 86.79 84.59
Number of distribution shares - outstanding at the beginning of the period - - - - issued - - - - redeemed - - - - outstanding at the end of the period - - -
Net asset value per distribution share - as at 30.09.2010 - - - - as at 31.03.2010 - - - - as at 31.03.2009 - - -

FUND PARTNERS
Statistical information (continued) as at 30th September 2010
The accompanying notes are an integral part of these financial statements.
75
Kredyt Bank
Conservative 6 Kredyt Bank
Financials 1 Kredyt Bank
Central European Winners 1
(in PLN) (in PLN) (in PLN)
Total net assets - as at 30.09.2010 66,430,738.95 60,119,861.81 63,340,163.38 - as at 31.03.2010 69,552,546.45 62,569,715.86 64,588,306.60 - as at 31.03.2009 61,167,238.90 58,937,067.56 61,992,364.43
Number of capitalisation shares - outstanding at the beginning of the period 675,024.0000 649,626.0000 717,522.0000 - issued - - - - redeemed -27,214.0000 -33,948.0000 -28,831.0000 - outstanding at the end of the period 647,810.0000 615,678.0000 688,691.0000
Net asset value per capitalisation share - as at 30.09.2010 102.55 97.65 91.97 - as at 31.03.2010 103.04 96.32 90.02 - as at 31.03.2009 87.06 86.67 82.27
Number of distribution shares - outstanding at the beginning of the period - - - - issued - - - - redeemed - - - - outstanding at the end of the period - - -
Net asset value per distribution share - as at 30.09.2010 - - - - as at 31.03.2010 - - - - as at 31.03.2009 - - -
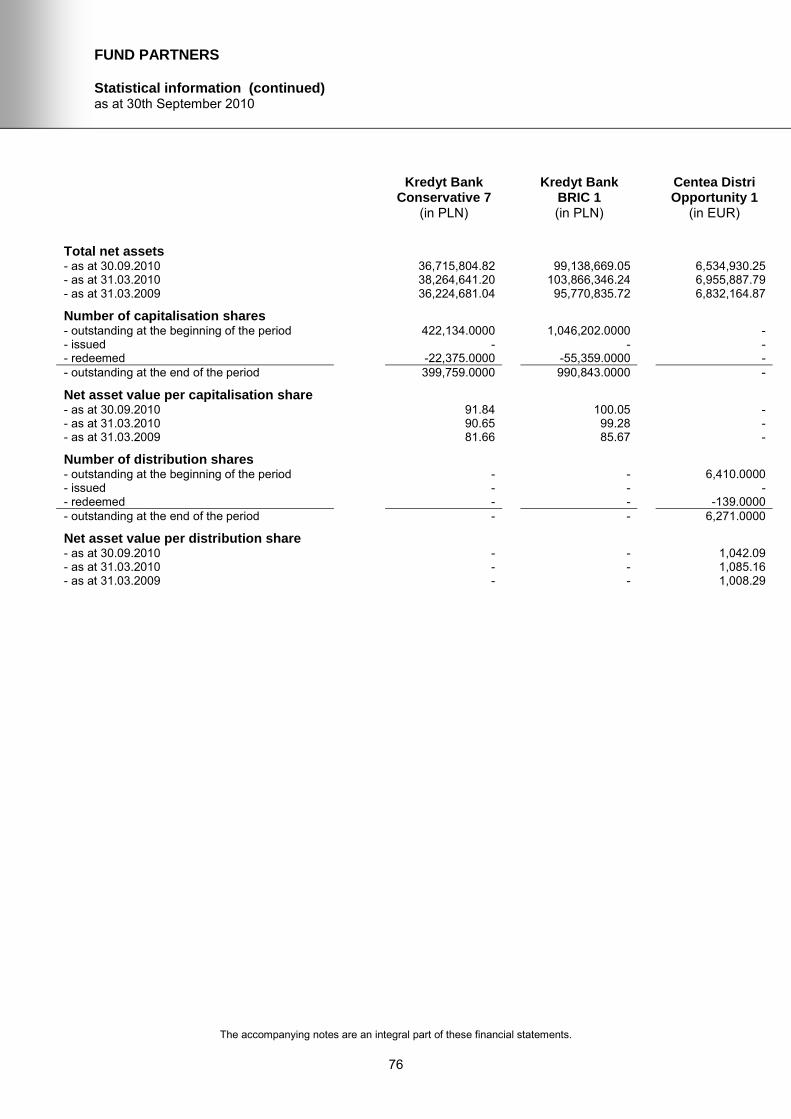
FUND PARTNERS
Statistical information (continued) as at 30th September 2010
The accompanying notes are an integral part of these financial statements.
76
Kredyt Bank
Conservative 7 Kredyt Bank
BRIC 1 Centea Distri
Opportunity 1 (in PLN) (in PLN) (in EUR)
Total net assets - as at 30.09.2010 36,715,804.82 99,138,669.05 6,534,930.25 - as at 31.03.2010 38,264,641.20 103,866,346.24 6,955,887.79 - as at 31.03.2009 36,224,681.04 95,770,835.72 6,832,164.87
Number of capitalisation shares - outstanding at the beginning of the period 422,134.0000 1,046,202.0000 - - issued - - - - redeemed -22,375.0000 -55,359.0000 - - outstanding at the end of the period 399,759.0000 990,843.0000 -
Net asset value per capitalisation share - as at 30.09.2010 91.84 100.05 - - as at 31.03.2010 90.65 99.28 - - as at 31.03.2009 81.66 85.67 -
Number of distribution shares - outstanding at the beginning of the period - - 6,410.0000 - issued - - - - redeemed - - -139.0000 - outstanding at the end of the period - - 6,271.0000
Net asset value per distribution share - as at 30.09.2010 - - 1,042.09 - as at 31.03.2010 - - 1,085.16 - as at 31.03.2009 - - 1,008.29

FUND PARTNERS
Statistical information (continued) as at 30th September 2010
The accompanying notes are an integral part of these financial statements.
77
Centea Distri
Opportunity 2 CSOB Rastovy
Plus SKK 3 CSOB Reality
SKK 1 (in EUR) (in EUR) (in EUR)
Total net assets - as at 30.09.2010 1,798,104.23 6,234,275.56 7,958,051.02 - as at 31.03.2010 1,882,890.00 6,875,114.85 8,573,806.87 - as at 31.03.2009 1,750,359.91 6,643,859.48 8,962,875.78
Number of capitalisation shares - outstanding at the beginning of the period - 20,436,407.0000 25,740,009.0000 - issued - - 600.0000 - redeemed - -1,849,310.0000 -1,735,631.0000 - outstanding at the end of the period - 18,587,097.0000 24,004,978.0000
Net asset value per capitalisation share - as at 30.09.2010 - 0.335409 0.331517 - as at 31.03.2010 - 0.336415 0.333093 - as at 31.03.2009 - 0.310000 0.310000
Number of distribution shares - outstanding at the beginning of the period 1,666.0000 - - - issued - - - - redeemed -99.0000 - - - outstanding at the end of the period 1,567.0000 - -
Net asset value per distribution share - as at 30.09.2010 1,147.48 - - - as at 31.03.2010 1,130.19 - - - as at 31.03.2009 989.46 - -

FUND PARTNERS
Statistical information (continued) as at 30th September 2010
The accompanying notes are an integral part of these financial statements.
78
CSOB World
Tree 3 CSOB World
Tree SKK 1 CSOB World
Tree CZK 1 (in CZK) (in EUR) (in CZK)
Total net assets - as at 30.09.2010 23,127,259.31 11,372,953.31 230,786,395.04 - as at 31.03.2010 23,407,924.93 11,620,458.44 233,589,159.74 - as at 31.03.2009 23,339,385.99 11,351,231.41 220,483,313.86
Number of capitalisation shares - outstanding at the beginning of the period 2,051,329.0000 31,950.0000 21,445,796.0000 - issued - - - - redeemed -26,491.0000 -611.0000 -378,417.0000 - outstanding at the end of the period 2,024,838.0000 31,339.0000 21,067,379.0000
Net asset value per capitalisation share - as at 30.09.2010 11.42 362.90 10.95 - as at 31.03.2010 11.41 363.71 10.89 - as at 31.03.2009 10.52 338.10 9.96
Number of distribution shares - outstanding at the beginning of the period - - - - issued - - - - redeemed - - - - outstanding at the end of the period - - -
Net asset value per distribution share - as at 30.09.2010 - - - - as at 31.03.2010 - - - - as at 31.03.2009 - - -

FUND PARTNERS
Statistical information (continued) as at 30th September 2010
The accompanying notes are an integral part of these financial statements.
79
World Tree USD 1 CSOB World
Tree 4 CSOB World
Tree 5 (in USD) (in CZK) (in CZK)
Total net assets - as at 30.09.2010 10,280,546.13 154,471,579.50 96,394,870.28 - as at 31.03.2010 10,497,817.61 157,354,220.97 98,374,081.58 - as at 31.03.2009 10,113,520.56 146,673,467.28 91,012,155.83
Number of capitalisation shares - outstanding at the beginning of the period 9,171.0000 14,637.0000 9,234,287.0000 - issued - - - - redeemed -125.0000 -356.0000 -305,004.0000 - outstanding at the end of the period 9,046.0000 14,281.0000 8,929,283.0000
Net asset value per capitalisation share - as at 30.09.2010 1,136.47 10,816.58 10.80 - as at 31.03.2010 1,144.68 10,750.44 10.65 - as at 31.03.2009 1,072.82 9,743.16 9.64
Number of distribution shares - outstanding at the beginning of the period - - - - issued - - - - redeemed - - - - outstanding at the end of the period - - -
Net asset value per distribution share - as at 30.09.2010 - - - - as at 31.03.2010 - - - - as at 31.03.2009 - - -

FUND PARTNERS
Statistical information (continued) as at 30th September 2010
The accompanying notes are an integral part of these financial statements.
80
CSOB World
Tree 6 CSOB World
Tree 7 CSOB World
Tree 8 (in CZK) (in CZK) (in CZK)
Total net assets - as at 30.09.2010 54,833,584.10 213,781,628.82 146,779,376.53 - as at 31.03.2010 54,403,603.31 218,558,474.21 149,842,811.64 - as at 31.03.2009 49,170,913.43 201,302,252.74 140,615,195.47
Number of capitalisation shares - outstanding at the beginning of the period 5,276,728.0000 20,908,721.0000 13,924,144.0000 - issued - - - - redeemed -68,188.0000 -718,064.0000 -342,597.0000 - outstanding at the end of the period 5,208,540.0000 20,190,657.0000 13,581,547.0000
Net asset value per capitalisation share - as at 30.09.2010 10.53 10.59 10.81 - as at 31.03.2010 10.31 10.45 10.76 - as at 31.03.2009 9.22 9.44 9.58
Number of distribution shares - outstanding at the beginning of the period - - - - issued - - - - redeemed - - - - outstanding at the end of the period - - -
Net asset value per distribution share - as at 30.09.2010 - - - - as at 31.03.2010 - - - - as at 31.03.2009 - - -

FUND PARTNERS
Statistical information (continued) as at 30th September 2010
The accompanying notes are an integral part of these financial statements.
81
CSOB World
Tree EUR 1 CSOB World
Tree 9 CSOB World
Tree 10 (in EUR) (in CZK) (in CZK)
Total net assets - as at 30.09.2010 3,572,912.79 107,023,657.01 150,731,491.31 - as at 31.03.2010 3,691,315.82 108,589,719.11 153,421,501.16 - as at 31.03.2009 3,458,964.15 99,440,266.74 144,192,147.86
Number of capitalisation shares - outstanding at the beginning of the period 3,335.0000 10,025,344.0000 13,993,670.0000 - issued - - - - redeemed -98.0000 -133,693.0000 -309,047.0000 - outstanding at the end of the period 3,237.0000 9,891,651.0000 13,684,623.0000
Net asset value per capitalisation share - as at 30.09.2010 1,103.77 10.82 11.01 - as at 31.03.2010 1,106.84 10.83 10.96 - as at 31.03.2009 1,017.64 9.81 9.94
Number of distribution shares - outstanding at the beginning of the period - - - - issued - - - - redeemed - - - - outstanding at the end of the period - - -
Net asset value per distribution share - as at 30.09.2010 - - - - as at 31.03.2010 - - - - as at 31.03.2009 - - -

FUND PARTNERS
Statistical information (continued) as at 30th September 2010
The accompanying notes are an integral part of these financial statements.
82
CSOB Strom
SKK 2 CSOB Strom
SKK 5 CSOB World
Tree 11 (in EUR) (in EUR) (in CZK)
Total net assets - as at 30.09.2010 3,935,070.56 2,934,971.30 76,153,152.59 - as at 31.03.2010 4,031,227.10 2,974,818.38 77,772,945.83 - as at 31.03.2009 3,880,881.10 2,823,792.24 72,161,683.62
Number of capitalisation shares - outstanding at the beginning of the period 11,242,583.0000 8,022,854.0000 7,100,380.0000 - issued - - - - redeemed -223,665.0000 -69,483.0000 -115,670.0000 - outstanding at the end of the period 11,018,918.0000 7,953,371.0000 6,984,710.0000
Net asset value per capitalisation share - as at 30.09.2010 0.357120 0.369022 10.90 - as at 31.03.2010 0.358568 0.370793 10.95 - as at 31.03.2009 0.330000 0.350000 9.90
Number of distribution shares - outstanding at the beginning of the period - - - - issued - - - - redeemed - - - - outstanding at the end of the period - - -
Net asset value per distribution share - as at 30.09.2010 - - - - as at 31.03.2010 - - - - as at 31.03.2009 - - -

FUND PARTNERS
Statistical information (continued) as at 30th September 2010
The accompanying notes are an integral part of these financial statements.
83
CSOB World
Tree 12 CSOB Staircase
Click 1 NLB SKLADI - GARANTIRANI
SKLAD EVROPA 1 (in CZK) (in CZK) (in EUR)
Total net assets - as at 30.09.2010 75,443,697.46 97,837,805.07 5,794,713.24 - as at 31.03.2010 78,335,740.33 102,970,024.10 5,816,473.23 - as at 31.03.2009 73,637,626.31 94,778,145.63 5,386,036.14
Number of capitalisation shares - outstanding at the beginning of the period 7,209,580.0000 10,394,199.0000 57,507.0000 - issued - - - - redeemed -249,701.0000 -484,246.0000 -484.0000 - outstanding at the end of the period 6,959,879.0000 9,909,953.0000 57,023.0000
Net asset value per capitalisation share - as at 30.09.2010 10.84 9.87 101.62 - as at 31.03.2010 10.87 9.91 101.14 - as at 31.03.2009 9.77 8.90 92.68
Number of distribution shares - outstanding at the beginning of the period - - - - issued - - - - redeemed - - - - outstanding at the end of the period - - -
Net asset value per distribution share - as at 30.09.2010 - - - - as at 31.03.2010 - - - - as at 31.03.2009 - - -

FUND PARTNERS
Statistical information (continued) as at 30th September 2010
The accompanying notes are an integral part of these financial statements.
84
CSOB Asian
Growth 1 CSOB Central
Europe Winners 1 CSOB Stock
Selection Short Term 4
(in CZK) (in CZK) (in CZK)
Total net assets - as at 30.09.2010 538,239,614.78 100,574,470.42 112,561,585.94 - as at 31.03.2010 562,695,368.68 102,295,373.69 115,642,119.62 - as at 31.03.2009 495,480,349.21 101,122,046.66 109,690,347.48
Number of capitalisation shares - outstanding at the beginning of the period 51,102,892.0000 9,924,135.0000 11,155,035.0000 - issued 51,000.0000 - - - redeemed -2,100,432.0000 -146,478.0000 -299,203.0000 - outstanding at the end of the period 49,053,460.0000 9,777,657.0000 10,855,832.0000
Net asset value per capitalisation share - as at 30.09.2010 10.97 10.29 10.37 - as at 31.03.2010 11.01 10.31 10.37 - as at 31.03.2009 9.23 9.89 9.52
Number of distribution shares - outstanding at the beginning of the period - - - - issued - - - - redeemed - - - - outstanding at the end of the period - - -
Net asset value per distribution share - as at 30.09.2010 - - - - as at 31.03.2010 - - - - as at 31.03.2009 - - -

FUND PARTNERS
Statistical information (continued) as at 30th September 2010
The accompanying notes are an integral part of these financial statements.
85
Kredyt Bank
Asia 1 Kredyt Bank
Sustainables 1 NLB Skladi -
Garantirani sklad Azija 1
(in PLN) (in PLN) (in USD)
Total net assets - as at 30.09.2010 36,928,670.89 55,128,055.48 2,681,442.28 - as at 31.03.2010 37,671,187.80 57,186,907.17 2,752,534.61 - as at 31.03.2009 35,117,281.03 54,361,207.01 2,371,454.63
Number of capitalisation shares - outstanding at the beginning of the period 398,209.0000 598,060.0000 21,503.0000 - issued - - - - redeemed -8,881.0000 -20,400.0000 -1,113.0000 - outstanding at the end of the period 389,328.0000 577,660.0000 20,390.0000
Net asset value per capitalisation share - as at 30.09.2010 94.85 95.43 131.51 - as at 31.03.2010 94.60 95.62 128.01 - as at 31.03.2009 83.61 85.14 106.70
Number of distribution shares - outstanding at the beginning of the period - - - - issued - - - - redeemed - - - - outstanding at the end of the period - - -
Net asset value per distribution share - as at 30.09.2010 - - - - as at 31.03.2010 - - - - as at 31.03.2009 - - -

FUND PARTNERS
Statistical information (continued) as at 30th September 2010
The accompanying notes are an integral part of these financial statements.
86
Warta High
Dividend Europe 1
CSOB World Growth Plus 11
CSOB World Growth Plus 12
(in PLN) (in CZK) (in CZK)
Total net assets - as at 30.09.2010 48,463,993.96 82,918,209.95 83,789,209.98 - as at 31.03.2010 49,305,128.42 84,692,293.37 85,323,577.90 - as at 31.03.2009 47,804,580.58 80,180,936.08 81,127,395.08
Number of capitalisation shares - outstanding at the beginning of the period 499,898.3355 8,156,938.0000 8,251,954.0000 - issued - - - - redeemed -9,664.1504 -146,309.0000 -153,423.0000 - outstanding at the end of the period 490,234.1851 8,010,629.0000 8,098,531.0000
Net asset value per capitalisation share - as at 30.09.2010 98.86 10.35 10.35 - as at 31.03.2010 98.63 10.38 10.34 - as at 31.03.2009 91.42 9.52 9.47
Number of distribution shares - outstanding at the beginning of the period - - - - issued - - - - redeemed - - - - outstanding at the end of the period - - -
Net asset value per distribution share - as at 30.09.2010 - - - - as at 31.03.2010 - - - - as at 31.03.2009 - - -

FUND PARTNERS
Statistical information (continued) as at 30th September 2010
The accompanying notes are an integral part of these financial statements.
87
Kredyt Bank
Optimised Europe Participation 1
Kredyt Bank Global Real
Estate 1
CSOB World Growth Plus 13
(in PLN) (in PLN) (in CZK)
Total net assets - as at 30.09.2010 109,063,212.94 246,058,115.68 145,108,138.31 - as at 31.03.2010 110,265,119.48 252,083,762.95 148,033,283.61 - as at 31.03.2009 106,455,449.03 241,604,004.06 139,855,315.56
Number of capitalisation shares - outstanding at the beginning of the period 1,152,635.0000 2,712,422.0000 14,583,497.0000 - issued - - - - redeemed -27,031.0000 -100,310.0000 -275,563.0000 - outstanding at the end of the period 1,125,604.0000 2,612,112.0000 14,307,934.0000
Net asset value per capitalisation share - as at 30.09.2010 96.89 94.20 10.14 - as at 31.03.2010 95.66 92.94 10.15 - as at 31.03.2009 88.57 84.35 9.24
Number of distribution shares - outstanding at the beginning of the period - - - - issued - - - - redeemed - - - - outstanding at the end of the period - - -
Net asset value per distribution share - as at 30.09.2010 - - - - as at 31.03.2010 - - - - as at 31.03.2009 - - -

FUND PARTNERS
Statistical information (continued) as at 30th September 2010
The accompanying notes are an integral part of these financial statements.
88
CSOB World
Growth Plus 14 CSOB World
Growth Plus 15 CSOB World
Growth Plus 16 (in CZK) (in CZK) (in CZK)
Total net assets - as at 30.09.2010 109,521,772.41 142,298,608.35 156,426,308.46 - as at 31.03.2010 114,541,574.03 149,329,048.50 162,626,137.22 - as at 31.03.2009 108,683,415.54 144,040,220.97 156,159,899.10
Number of capitalisation shares - outstanding at the beginning of the period 11,345,046.0000 14,778,116.0000 15,710,358.0000 - issued - - - - redeemed -543,978.0000 -816,557.0000 -577,834.0000 - outstanding at the end of the period 10,801,068.0000 13,961,559.0000 15,132,524.0000
Net asset value per capitalisation share - as at 30.09.2010 10.14 10.19 10.34 - as at 31.03.2010 10.10 10.10 10.35 - as at 31.03.2009 9.25 9.31 9.40
Number of distribution shares - outstanding at the beginning of the period - - - - issued - - - - redeemed - - - - outstanding at the end of the period - - -
Net asset value per distribution share - as at 30.09.2010 - - - - as at 31.03.2010 - - - - as at 31.03.2009 - - -

FUND PARTNERS
Statistical information (continued) as at 30th September 2010
The accompanying notes are an integral part of these financial statements.
89
CSOB Short
Term Growth 5 CSOB Short
Term Growth 6 CSOB Financials
Short Term Growth 1
(in CZK) (in CZK) (in CZK)
Total net assets - as at 30.09.2010 278,791,376.37 448,471,028.12 549,323,502.80 - as at 31.03.2010 283,309,268.37 465,635,726.32 589,367,744.45 - as at 31.03.2009 263,406,929.09 467,941,380.27 607,190,487.80
Number of capitalisation shares - outstanding at the beginning of the period 27,903,210.0000 46,692,883.0000 59,240,881.0000 - issued - 3,050.0000 10,100.0000 - redeemed -430,326.0000 -1,898,425.0000 -4,271,552.0000 - outstanding at the end of the period 27,472,884.0000 44,797,508.0000 54,979,429.0000
Net asset value per capitalisation share - as at 30.09.2010 10.15 10.01 9.99 - as at 31.03.2010 10.15 9.97 9.95 - as at 31.03.2009 9.30 9.15 9.11
Number of distribution shares - outstanding at the beginning of the period - - - - issued - - - - redeemed - - - - outstanding at the end of the period - - -
Net asset value per distribution share - as at 30.09.2010 - - - - as at 31.03.2010 - - - - as at 31.03.2009 - - -

FUND PARTNERS
Statistical information (continued) as at 30th September 2010
The accompanying notes are an integral part of these financial statements.
90
CSOB Europe
Real Estate Growth Plus 2
CSOB Pharma & Biotech 1
Warta Asia 2
(in CZK) (in CZK) (in PLN)
Total net assets - as at 30.09.2010 222,665,559.70 262,909,731.46 39,774,973.62 - as at 31.03.2010 226,876,224.60 272,329,994.54 42,667,119.78 - as at 31.03.2009 219,748,005.18 253,815,465.90 40,072,174.03
Number of capitalisation shares - outstanding at the beginning of the period 23,548,863.0000 27,347,169.0000 388,769.2438 - issued - 1,005.0000 - - redeemed -823,026.0000 -697,658.0000 -21,968.1320 - outstanding at the end of the period 22,725,837.0000 26,650,516.0000 366,801.1118
Net asset value per capitalisation share - as at 30.09.2010 9.80 9.87 108.44 - as at 31.03.2010 9.63 9.96 109.75 - as at 31.03.2009 8.69 8.97 90.34
Number of distribution shares - outstanding at the beginning of the period - - - - issued - - - - redeemed - - - - outstanding at the end of the period - - -
Net asset value per distribution share - as at 30.09.2010 - - - - as at 31.03.2010 - - - - as at 31.03.2009 - - -

FUND PARTNERS
Statistical information (continued) as at 30th September 2010
The accompanying notes are an integral part of these financial statements.
91
Kredyt Bank
Europe Real Estate 2
Kredyt Bank Global Real
Estate 2
Warta Infrastructure 1
(in PLN) (in PLN) (in PLN)
Total net assets - as at 30.09.2010 444,936,448.26 67,026,406.88 20,956,260.02 - as at 31.03.2010 468,846,922.73 69,173,787.54 22,230,988.90 - as at 31.03.2009 446,967,860.09 66,591,099.37 21,139,688.06
Number of capitalisation shares - outstanding at the beginning of the period 5,221,580.0000 746,699.0136 231,575.7345 - issued - - - - redeemed -343,392.0000 -32,058.7004 -15,712.5518 - outstanding at the end of the period 4,878,188.0000 714,640.3132 215,863.1827
Net asset value per capitalisation share - as at 30.09.2010 91.21 93.79 97.08 - as at 31.03.2010 89.79 92.64 96.00 - as at 31.03.2009 80.84 84.68 87.02
Number of distribution shares - outstanding at the beginning of the period - - - - issued - - - - redeemed - - - - outstanding at the end of the period - - -
Net asset value per distribution share - as at 30.09.2010 - - - - as at 31.03.2010 - - - - as at 31.03.2009 - - -

FUND PARTNERS
Statistical information (continued) as at 30th September 2010
The accompanying notes are an integral part of these financial statements.
92
CSOB
Performance Lock 1
CSOB Bull & Bear 1
Kredyt Bank Variable
Participation 1 (in CZK) (in CZK) (in PLN)
Total net assets - as at 30.09.2010 69,218,502.24 143,466,795.67 25,068,276.12 - as at 31.03.2010 71,215,391.28 158,729,163.55 25,793,495.81 - as at 31.03.2009 65,169,277.47 172,706,596.55 24,840,540.49
Number of capitalisation shares - outstanding at the beginning of the period 7,280,263.0000 15,117,818.0000 288,190.0000 - issued 511.0000 - - - redeemed -200,179.0000 -1,200,000.0000 -10,996.0000 - outstanding at the end of the period 7,080,595.0000 13,917,818.0000 277,194.0000
Net asset value per capitalisation share - as at 30.09.2010 9.78 10.31 90.44 - as at 31.03.2010 9.78 10.50 89.50 - as at 31.03.2009 8.80 10.38 81.18
Number of distribution shares - outstanding at the beginning of the period - - - - issued - - - - redeemed - - - - outstanding at the end of the period - - -
Net asset value per distribution share - as at 30.09.2010 - - - - as at 31.03.2010 - - - - as at 31.03.2009 - - -
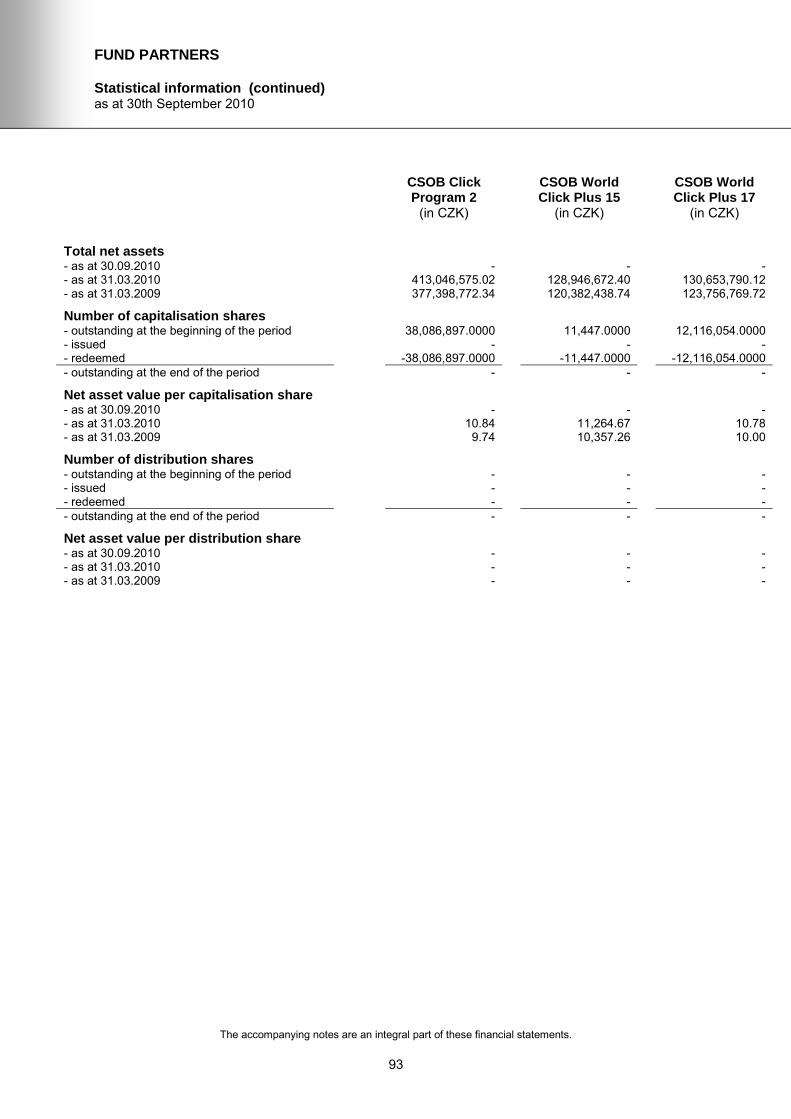
FUND PARTNERS
Statistical information (continued) as at 30th September 2010
The accompanying notes are an integral part of these financial statements.
93
CSOB Click
Program 2 CSOB World
Click Plus 15 CSOB World
Click Plus 17 (in CZK) (in CZK) (in CZK)
Total net assets - as at 30.09.2010 - - - - as at 31.03.2010 413,046,575.02 128,946,672.40 130,653,790.12 - as at 31.03.2009 377,398,772.34 120,382,438.74 123,756,769.72
Number of capitalisation shares - outstanding at the beginning of the period 38,086,897.0000 11,447.0000 12,116,054.0000 - issued - - - - redeemed -38,086,897.0000 -11,447.0000 -12,116,054.0000 - outstanding at the end of the period - - -
Net asset value per capitalisation share - as at 30.09.2010 - - - - as at 31.03.2010 10.84 11,264.67 10.78 - as at 31.03.2009 9.74 10,357.26 10.00
Number of distribution shares - outstanding at the beginning of the period - - - - issued - - - - redeemed - - - - outstanding at the end of the period - - -
Net asset value per distribution share - as at 30.09.2010 - - - - as at 31.03.2010 - - - - as at 31.03.2009 - - -

FUND PARTNERS
Statistical information (continued) as at 30th September 2010
The accompanying notes are an integral part of these financial statements.
94
CSOB World Click
USD Plus 5 CSOB Equity Click Plus 2
CSOB Europe Click Plus 2
(in USD) (in EUR) (in EUR)
Total net assets - as at 30.09.2010 - - - - as at 31.03.2010 5,149,052.24 13,182,188.90 4,156,124.49 - as at 31.03.2009 4,251,094.35 13,222,643.57 3,892,660.92
Number of capitalisation shares - outstanding at the beginning of the period 4,654.0000 37,686.0000 11,768.0000 - issued - - - - redeemed -4,654.0000 -37,686.0000 -11,768.0000 - outstanding at the end of the period - - -
Net asset value per capitalisation share - as at 30.09.2010 - - - - as at 31.03.2010 1,106.37 349.79 353.17 - as at 31.03.2009 1,033.83 324.06 322.51
Number of distribution shares - outstanding at the beginning of the period - - - - issued - - - - redeemed - - - - outstanding at the end of the period - - -
Net asset value per distribution share - as at 30.09.2010 - - - - as at 31.03.2010 - - - - as at 31.03.2009 - - -

FUND PARTNERS
Statistical information (continued) as at 30th September 2010
The accompanying notes are an integral part of these financial statements.
95
CSOB Europe 1 CSOB World
Growth Plus 5 CSOB Europe
Growth Plus 1 (in EUR) (in CZK) (in CZK)
Total net assets - as at 30.09.2010 - - - - as at 31.03.2010 4,918,150.46 204,224,399.92 571,924,691.20 - as at 31.03.2009 4,683,440.27 189,453,943.50 279,008,133.21
Number of capitalisation shares - outstanding at the beginning of the period 14,509.0000 20,419,721.0000 57,242,664.0000 - issued - - - - redeemed -14,509.0000 -20,419,721.0000 -57,242,664.0000 - outstanding at the end of the period - - -
Net asset value per capitalisation share - as at 30.09.2010 - - - - as at 31.03.2010 338.97 10.00 9.99 - as at 31.03.2009 318.04 9.17 9.11
Number of distribution shares - outstanding at the beginning of the period - - - - issued - - - - redeemed - - - - outstanding at the end of the period - - -
Net asset value per distribution share - as at 30.09.2010 - - - - as at 31.03.2010 - - - - as at 31.03.2009 - - -

FUND PARTNERS
Statistical information (continued) as at 30th September 2010
The accompanying notes are an integral part of these financial statements.
96
CSOB Europe
Growth 2 CSOB World
Growth 2 CSOB Equity
Plus 3 (in EUR) (in CZK) (in EUR)
Total net assets - as at 30.09.2010 - - - - as at 31.03.2010 8,398,607.12 32,288,423.32 12,288,840.92 - as at 31.03.2009 8,054,498.68 26,451,861.46 11,821,200.23
Number of capitalisation shares - outstanding at the beginning of the period 24,260,335.0000 2,691.0000 36,846,019.0000 - issued - - 900.0000 - redeemed -24,260,335.0000 -2,691.0000 -36,846,919.0000 - outstanding at the end of the period - - -
Net asset value per capitalisation share - as at 30.09.2010 - - - - as at 31.03.2010 0.346187 11,998.67 0.333519 - as at 31.03.2009 0.320000 9,528.77 0.310000
Number of distribution shares - outstanding at the beginning of the period - - - - issued - - - - redeemed - - - - outstanding at the end of the period - - -
Net asset value per distribution share - as at 30.09.2010 - - - - as at 31.03.2010 - - - - as at 31.03.2009 - - -

FUND PARTNERS
Statistical information (continued) as at 30th September 2010
The accompanying notes are an integral part of these financial statements.
97
K&H Hazai Fix 1
Alap CSOB Stock
Selection Short Term 2
CSOB Stock Selection Short
Term 3 (in HUF) (in CZK) (in CZK)
Total net assets - as at 30.09.2010 - - - - as at 31.03.2010 249,410,497.03 578,881,763.43 389,957,669.27 - as at 31.03.2009 198,768,918.60 507,547,645.89 322,289,555.37
Number of capitalisation shares - outstanding at the beginning of the period 24,529.0000 55,885,797.0000 37,640,178.0000 - issued - - - - redeemed -24,529.0000 -55,885,797.0000 -37,640,178.0000 - outstanding at the end of the period - - -
Net asset value per capitalisation share - as at 30.09.2010 - - - - as at 31.03.2010 10,167.98 10.36 10.36 - as at 31.03.2009 8,077.08 9.56 9.45
Number of distribution shares - outstanding at the beginning of the period - - - - issued - - - - redeemed - - - - outstanding at the end of the period - - -
Net asset value per distribution share - as at 30.09.2010 - - - - as at 31.03.2010 - - - - as at 31.03.2009 - - -

FUND PARTNERS
Statistical information (continued) as at 30th September 2010
The accompanying notes are an integral part of these financial statements.
98
CSOB World
Growth Plus 10 CSOB Fix
Upside 2 CSOB Fix
Upside 3 (in CZK) (in CZK) (in CZK)
Total net assets - as at 30.09.2010 - - - - as at 31.03.2010 660,572,585.96 240,094,090.78 331,970,365.81 - as at 31.03.2009 528,259,906.10 197,423,406.13 281,822,831.49
Number of capitalisation shares - outstanding at the beginning of the period 66,054,571.0000 24,032,950.0000 33,383,740.0000 - issued - - - - redeemed -66,054,571.0000 -24,032,950.0000 -33,383,740.0000 - outstanding at the end of the period - - -
Net asset value per capitalisation share - as at 30.09.2010 - - - - as at 31.03.2010 10.00 9.99 9.94 - as at 31.03.2009 9.20 9.24 9.18
Number of distribution shares - outstanding at the beginning of the period - - - - issued - - - - redeemed - - - - outstanding at the end of the period - - -
Net asset value per distribution share - as at 30.09.2010 - - - - as at 31.03.2010 - - - - as at 31.03.2009 - - -

FUND PARTNERS CSOB World Click Plus 7
Statement of investments and other net assets (in CZK) as at 30th September 2010
The accompanying notes are an integral part of these financial statements.
99
Currency Number / nominal value
Description Cost Market value % of total net assets
Investments in securities
Transferable securities admitted to an official stock exchange listing
Bonds
CZK 9,850,000 Amethyst Structured Fin Plc FRN Ser 2007-14 Tr 1 07/10.05.15 9,841,625.63 9,858,630.57 7.15 CZK 9,850,000 Beechwood Structured Fin Plc FRN Ser 2007-1 Tr 1 07/10.05.15 9,841,625.63 9,771,950.57 7.08 CZK 9,850,000 Brookfields Capital Plc FRN Ser 2007-14 Tr 1 07/10.05.15 9,841,625.63 9,801,500.57 7.10 CZK 9,850,000 Eperon Finance Plc FRN Ser 2007-14 Tr 1 07/10.05.15 9,841,625.63 9,804,455.57 7.11 CZK 4,900,000 Espaccio Securities Plc FRN Ser 2007-14 Tr 1 07/10.05.15 4,895,834.07 4,869,993.38 3.53 CZK 4,900,000 Greenstreet Struc Fin Prod Plc FRN Ser 2007-14 07/10.05.15 4,895,834.07 4,868,033.38 3.53 CZK 4,900,000 Nimrod Capital Plc FRN Ser 2007-14 Tr 1 07/10.05.15 4,895,834.07 4,864,113.38 3.52 CZK 4,950,000 Opal Financial Products Plc FRN Ser 2007-14 Tr 1 07/10.05.15 4,945,791.56 4,899,392.19 3.55 CZK 4,950,000 Profile Finance Plc FRN Ser 2007-14 Tr 1 07/10.05.15 4,945,791.56 4,883,057.19 3.54 CZK 4,950,000 Recolte Securities Plc FRN Ser 2007-14 Tr 1 07/10.05.15 4,945,791.56 4,892,462.19 3.55 CZK 4,900,000 Silverstate Fin Inv Plc FRN Ser 2007-14 Tr 1 07/10.05.15 4,895,834.07 4,874,403.38 3.53 CZK 4,900,000 Vespucci Strut Fin Prod Plc FRN Ser 2007-14 Tr 1 07/10.05.15 4,895,834.07 4,856,273.38 3.52 CZK 4,900,000 Vigado Capital Plc FRN Ser 2007-14 Tr 1 07/10.05.15 4,895,834.07 4,867,053.38 3.53 CZK 4,900,000 Voyce Investments Plc FRN Ser 2007-14 Tr 1 07/10.05.15 4,895,834.07 4,881,263.38 3.54 CZK 4,950,000 Waterford Cap Investments FRN Ser 2007-14 Tr 1 07/10.05.15 4,945,791.56 4,888,997.19 3.54 CZK 4,900,000 Waves Fin Inv Plc FRN Ser 2007-14 Tr 1 07/10.05.15 4,895,834.07 4,866,563.38 3.53
Total investments in securities 98,316,341.32 97,748,143.08 70.85
Cash at banks 9,661,750.19 7.00
Other net assets/(liabilities) 30,546,898.31 22.15
Total 137,956,791.58 100.00

FUND PARTNERS CSOB World Click Plus 14
Statement of investments and other net assets (in CZK) as at 30th September 2010
The accompanying notes are an integral part of these financial statements.
100
Currency Number / nominal value
Description Cost Market value % of total net assets
Investments in securities
Transferable securities admitted to an official stock exchange listing
Bonds
CZK 13,400,000 Amethyst Structured Fin Plc FRN Ser 2007-14 Tr 1 07/10.05.15 13,386,606.17 13,411,741.08 7.29 CZK 13,400,000 Beechwood Structured Fin Plc FRN Ser 2007-1 Tr 1 07/10.05.15 13,386,606.17 13,293,821.08 7.23 CZK 13,400,000 Brookfields Capital Plc FRN Ser 2007-14 Tr 1 07/10.05.15 13,386,606.17 13,334,021.08 7.25 CZK 13,400,000 Eperon Finance Plc FRN Ser 2007-14 Tr 1 07/10.05.15 13,386,606.17 13,338,041.08 7.25 CZK 6,700,000 Espaccio Securities Plc FRN Ser 2007-14 Tr 1 07/10.05.15 6,693,303.09 6,658,970.54 3.62 CZK 6,700,000 Greenstreet Struc Fin Prod Plc FRN Ser 2007-14 07/10.05.15 6,693,303.09 6,656,290.54 3.62 CZK 6,700,000 Nimrod Capital Plc FRN Ser 2007-14 Tr 1 07/10.05.15 6,693,303.09 6,650,930.54 3.62 CZK 6,700,000 Opal Financial Products Plc FRN Ser 2007-14 Tr 1 07/10.05.15 6,693,303.09 6,631,500.54 3.61 CZK 6,700,000 Profile Finance Plc FRN Ser 2007-14 Tr 1 07/10.05.15 6,693,303.09 6,609,390.54 3.59 CZK 6,700,000 Recolte Securities Plc FRN Ser 2007-14 Tr 1 07/10.05.15 6,693,303.09 6,622,120.54 3.60 CZK 6,650,000 Silverstate Fin Inv Plc FRN Ser 2007-14 Tr 1 07/10.05.15 6,643,353.07 6,615,261.73 3.60 CZK 6,700,000 Vespucci Strut Fin Prod Plc FRN Ser 2007-14 Tr 1 07/10.05.15 6,693,303.09 6,640,210.54 3.61 CZK 6,700,000 Vigado Capital Plc FRN Ser 2007-14 Tr 1 07/10.05.15 6,693,303.09 6,654,950.54 3.62 CZK 6,650,000 Voyce Investments Plc FRN Ser 2007-14 Tr 1 07/10.05.15 6,643,353.07 6,624,571.73 3.60 CZK 6,700,000 Waterford Cap Investments FRN Ser 2007-14 Tr 1 07/10.05.15 6,693,303.09 6,617,430.54 3.60 CZK 6,700,000 Waves Fin Inv Plc FRN Ser 2007-14 Tr 1 07/10.05.15 6,693,303.09 6,654,280.54 3.62
Total investments in securities 133,766,161.72 133,013,533.18 72.33
Cash at banks 11,917,476.06 6.48
Other net assets/(liabilities) 38,959,168.20 21.19
Total 183,890,177.44 100.00
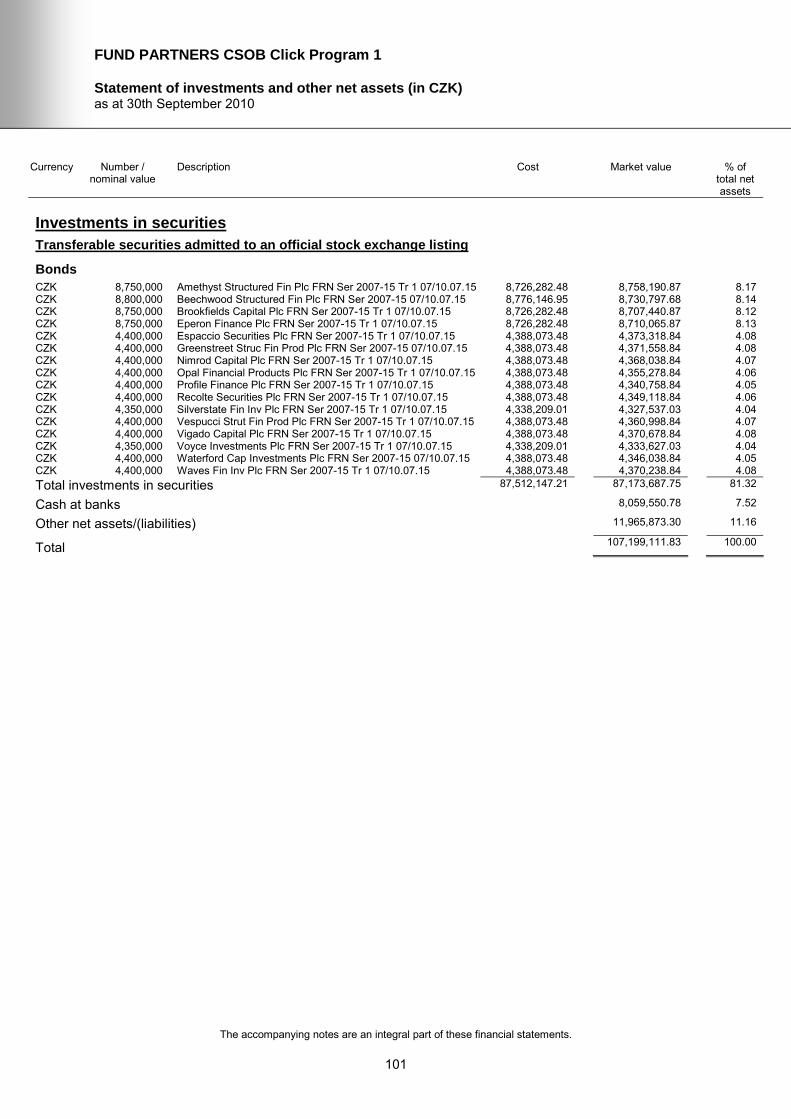
FUND PARTNERS CSOB Click Program 1
Statement of investments and other net assets (in CZK) as at 30th September 2010
The accompanying notes are an integral part of these financial statements.
101
Currency Number / nominal value
Description Cost Market value % of total net assets
Investments in securities
Transferable securities admitted to an official stock exchange listing
Bonds
CZK 8,750,000 Amethyst Structured Fin Plc FRN Ser 2007-15 Tr 1 07/10.07.15 8,726,282.48 8,758,190.87 8.17 CZK 8,800,000 Beechwood Structured Fin Plc FRN Ser 2007-15 07/10.07.15 8,776,146.95 8,730,797.68 8.14 CZK 8,750,000 Brookfields Capital Plc FRN Ser 2007-15 Tr 1 07/10.07.15 8,726,282.48 8,707,440.87 8.12 CZK 8,750,000 Eperon Finance Plc FRN Ser 2007-15 Tr 1 07/10.07.15 8,726,282.48 8,710,065.87 8.13 CZK 4,400,000 Espaccio Securities Plc FRN Ser 2007-15 Tr 1 07/10.07.15 4,388,073.48 4,373,318.84 4.08 CZK 4,400,000 Greenstreet Struc Fin Prod Plc FRN Ser 2007-15 07/10.07.15 4,388,073.48 4,371,558.84 4.08 CZK 4,400,000 Nimrod Capital Plc FRN Ser 2007-15 Tr 1 07/10.07.15 4,388,073.48 4,368,038.84 4.07 CZK 4,400,000 Opal Financial Products Plc FRN Ser 2007-15 Tr 1 07/10.07.15 4,388,073.48 4,355,278.84 4.06 CZK 4,400,000 Profile Finance Plc FRN Ser 2007-15 Tr 1 07/10.07.15 4,388,073.48 4,340,758.84 4.05 CZK 4,400,000 Recolte Securities Plc FRN Ser 2007-15 Tr 1 07/10.07.15 4,388,073.48 4,349,118.84 4.06 CZK 4,350,000 Silverstate Fin Inv Plc FRN Ser 2007-15 Tr 1 07/10.07.15 4,338,209.01 4,327,537.03 4.04 CZK 4,400,000 Vespucci Strut Fin Prod Plc FRN Ser 2007-15 Tr 1 07/10.07.15 4,388,073.48 4,360,998.84 4.07 CZK 4,400,000 Vigado Capital Plc FRN Ser 2007-15 Tr 1 07/10.07.15 4,388,073.48 4,370,678.84 4.08 CZK 4,350,000 Voyce Investments Plc FRN Ser 2007-15 Tr 1 07/10.07.15 4,338,209.01 4,333,627.03 4.04 CZK 4,400,000 Waterford Cap Investments Plc FRN Ser 2007-15 07/10.07.15 4,388,073.48 4,346,038.84 4.05 CZK 4,400,000 Waves Fin Inv Plc FRN Ser 2007-15 Tr 1 07/10.07.15 4,388,073.48 4,370,238.84 4.08
Total investments in securities 87,512,147.21 87,173,687.75 81.32
Cash at banks 8,059,550.78 7.52
Other net assets/(liabilities) 11,965,873.30 11.16
Total 107,199,111.83 100.00

FUND PARTNERS CSOB Click Program 4
Statement of investments and other net assets (in CZK) as at 30th September 2010
The accompanying notes are an integral part of these financial statements.
102
Currency Number / nominal value
Description Cost Market value % of total net assets
Investments in securities
Transferable securities admitted to an official stock exchange listing
Bonds
CZK 15,050,000 Amethyst Structured Fin Plc FRN Ser 2007-15 Tr 1 07/10.07.15 15,003,465.15 15,064,088.30 8.52 CZK 15,150,000 Beechwood Structured Fin Plc FRN Ser 2007-15 07/10.07.15 15,103,155.95 15,030,861.91 8.50 CZK 15,100,000 Brookfields Capital Plc FRN Ser 2007-15 Tr 1 07/10.07.15 15,053,310.55 15,026,555.11 8.50 CZK 15,150,000 Eperon Finance Plc FRN Ser 2007-15 Tr 1 07/10.07.15 15,103,155.95 15,080,856.91 8.53 CZK 7,550,000 Espaccio Securities Plc FRN Ser 2007-15 Tr 1 07/10.07.15 7,526,655.27 7,504,217.56 4.24 CZK 7,550,000 Greenstreet Struc Fin Prod Plc FRN Ser 2007-15 07/10.07.15 7,526,655.27 7,501,197.56 4.24 CZK 7,550,000 Nimrod Capital Plc FRN Ser 2007-15 Tr 1 07/10.07.15 7,526,655.27 7,495,157.56 4.24 CZK 7,600,000 Opal Financial Products Plc FRN Ser 2007-15 Tr 1 07/10.07.15 7,576,500.67 7,522,754.36 4.26 CZK 7,600,000 Profile Finance Plc FRN Ser 2007-15 Tr 1 07/10.07.15 7,576,500.67 7,497,674.36 4.24 CZK 7,600,000 Recolte Securities Plc FRN Ser 2007-15 Tr 1 07/10.07.15 7,576,500.67 7,512,114.36 4.25 CZK 7,550,000 Silverstate Fin Inv Plc FRN Ser 2007-15 Tr 1 07/10.07.15 7,526,655.27 7,511,012.56 4.25 CZK 7,550,000 Vespucci Strut Fin Prod Plc FRN Ser 2007-15 Tr 1 07/10.07.15 7,526,655.27 7,483,077.56 4.23 CZK 7,600,000 Vigado Capital Plc FRN Ser 2007-15 Tr 1 07/10.07.15 7,576,500.67 7,549,354.36 4.27 CZK 7,550,000 Voyce Investments Plc FRN Ser 2007-15 Tr 1 07/10.07.15 7,526,655.27 7,521,582.56 4.25 CZK 7,600,000 Waterford Cap Investments Plc FRN Ser 2007-15 07/10.07.15 7,576,500.67 7,506,794.36 4.25 CZK 7,550,000 Waves Fin Inv Plc FRN Ser 2007-15 Tr 1 07/10.07.15 7,526,655.27 7,498,932.56 4.24
Total investments in securities 150,832,177.84 150,306,231.95 85.01
Cash at banks 17,508,245.96 9.90
Other net assets/(liabilities) 8,985,203.32 5.09
Total 176,799,681.23 100.00

FUND PARTNERS CSOB Click Program 5
Statement of investments and other net assets (in CZK) as at 30th September 2010
The accompanying notes are an integral part of these financial statements.
103
Currency Number / nominal value
Description Cost Market value % of total net assets
Investments in securities
Transferable securities admitted to an official stock exchange listing
Bonds
CZK 13,900,000 Amethyst Structured Fin Plc FRN Ser 2007-15 Tr 1 07/10.07.15 13,869,195.07 13,913,011.79 8.34 CZK 13,950,000 Beechwood Structured Fin Plc FRN Ser 2007-15 07/10.07.15 13,919,084.26 13,840,298.60 8.30 CZK 13,950,000 Brookfields Capital Plc FRN Ser 2007-15 Tr 1 07/10.07.15 13,919,084.26 13,882,148.60 8.32 CZK 13,950,000 Eperon Finance Plc FRN Ser 2007-15 Tr 1 07/10.07.15 13,919,084.26 13,886,333.60 8.33 CZK 7,000,000 Espaccio Securities Plc FRN Ser 2007-15 Tr 1 07/10.07.15 6,984,486.72 6,957,552.70 4.17 CZK 7,000,000 Greenstreet Struc Fin Prod Plc FRN Ser 2007-15 07/10.07.15 6,984,486.72 6,954,752.70 4.17 CZK 7,000,000 Nimrod Capital Plc FRN Ser 2007-15 Tr 1 07/10.07.15 6,984,486.72 6,949,152.70 4.17 CZK 7,000,000 Opal Financial Products Plc FRN Ser 2007-15 Tr 1 07/10.07.15 6,984,486.72 6,928,852.70 4.15 CZK 7,000,000 Profile Finance Plc FRN Ser 2007-15 Tr 1 07/10.07.15 6,984,486.72 6,905,752.70 4.14 CZK 7,000,000 Recolte Securities Plc FRN Ser 2007-15 Tr 1 07/10.07.15 6,984,486.72 6,919,052.70 4.15 CZK 6,950,000 Silverstate Fin Inv Plc FRN Ser 2007-15 Tr 1 07/10.07.15 6,934,597.52 6,914,110.89 4.14 CZK 7,000,000 Vespucci Strut Fin Prod Plc FRN Ser 2007-15 Tr 1 07/10.07.15 6,984,486.72 6,937,952.70 4.16 CZK 7,000,000 Vigado Capital Plc FRN Ser 2007-15 Tr 1 07/10.07.15 6,984,486.72 6,953,352.70 4.17 CZK 6,950,000 Voyce Investments Plc FRN Ser 2007-15 Tr 1 07/10.07.15 6,934,597.52 6,923,840.89 4.15 CZK 7,000,000 Waterford Cap Investments Plc FRN Ser 2007-15 07/10.07.15 6,984,486.72 6,914,152.70 4.14 CZK 6,950,000 Waves Fin Inv Plc FRN Ser 2007-15 Tr 1 07/10.07.15 6,934,597.52 6,902,990.89 4.14
Total investments in securities 139,290,620.89 138,683,309.56 83.14
Cash at banks 16,414,310.81 9.84
Other net assets/(liabilities) 11,700,241.53 7.02
Total 166,797,861.90 100.00

FUND PARTNERS CSOB Click Program 6
Statement of investments and other net assets (in CZK) as at 30th September 2010
The accompanying notes are an integral part of these financial statements.
104
Currency Number / nominal value
Description Cost Market value % of total net assets
Investments in securities
Transferable securities admitted to an official stock exchange listing
Bonds
CZK 6,200,000 Amethyst Structured Fin Plc FRN Ser 2007-15 Tr 1 07/10.07.15 6,192,295.91 6,205,803.82 8.64 CZK 6,250,000 Beechwood Structured Fin Plc FRN Ser 2007-15 07/10.07.15 6,242,233.78 6,200,850.62 8.64 CZK 6,200,000 Brookfields Capital Plc FRN Ser 2007-15 Tr 1 07/10.07.15 6,192,295.91 6,169,843.82 8.59 CZK 6,250,000 Eperon Finance Plc FRN Ser 2007-15 Tr 1 07/10.07.15 6,242,233.78 6,221,475.62 8.66 CZK 3,100,000 Espaccio Securities Plc FRN Ser 2007-15 Tr 1 07/10.07.15 3,096,147.95 3,081,201.91 4.29 CZK 3,100,000 Greenstreet Struc Fin Prod Plc FRN Ser 2007-15 07/10.07.15 3,096,147.95 3,079,961.91 4.29 CZK 3,100,000 Nimrod Capital Plc FRN Ser 2007-15 Tr 1 07/10.07.15 3,096,147.95 3,077,481.91 4.29 CZK 3,100,000 Opal Financial Products Plc FRN Ser 2007-15 Tr 1 07/10.07.15 3,096,147.95 3,068,491.91 4.27 CZK 3,150,000 Profile Finance Plc FRN Ser 2007-15 Tr 1 07/10.07.15 3,146,085.82 3,107,588.72 4.33 CZK 3,100,000 Recolte Securities Plc FRN Ser 2007-15 Tr 1 07/10.07.15 3,096,147.95 3,064,151.91 4.27 CZK 3,100,000 Silverstate Fin Inv Plc FRN Ser 2007-15 Tr 1 07/10.07.15 3,096,147.95 3,083,991.91 4.29 CZK 3,100,000 Vespucci Strut Fin Prod Plc FRN Ser 2007-15 Tr 1 07/10.07.15 3,096,147.95 3,072,521.91 4.28 CZK 3,100,000 Vigado Capital Plc FRN Ser 2007-15 Tr 1 07/10.07.15 3,096,147.95 3,079,341.91 4.29 CZK 3,100,000 Voyce Investments Plc FRN Ser 2007-15 Tr 1 07/10.07.15 3,096,147.95 3,088,331.91 4.30 CZK 3,100,000 Waterford Cap Investments Plc FRN Ser 2007-15 07/10.07.15 3,096,147.95 3,061,981.91 4.26 CZK 3,100,000 Waves Fin Inv Plc FRN Ser 2007-15 Tr 1 07/10.07.15 3,096,147.95 3,079,031.91 4.29
Total investments in securities 62,072,772.65 61,742,053.61 85.98
Cash at banks 7,257,677.87 10.11
Other net assets/(liabilities) 2,809,374.33 3.91
Total 71,809,105.81 100.00

FUND PARTNERS CSOB World Click Plus 18
Statement of investments and other net assets (in CZK) as at 30th September 2010
The accompanying notes are an integral part of these financial statements.
105
Currency Number / nominal value
Description Cost Market value % of total net assets
Investments in securities
Transferable securities admitted to an official stock exchange listing
Bonds
CZK 22,550,000 Amethyst Structured Fin Plc FRN Ser 2007-8 Tr 1 07/23.03.15 22,546,392.00 22,557,547.49 8.13 CZK 22,700,000 Beechwood Structured Fin Plc FRN Ser 2007-8 Tr 1 07/23.03.15 22,696,368.00 22,507,837.69 8.12 CZK 22,700,000 Brookfields Capital Plc FRN Ser 2007-8 Tr 1 07/23.03.15 22,696,368.00 22,575,937.69 8.14 CZK 22,700,000 Eperon Finance Plc FRN Ser 2007-8 Tr 1 07/23.03.15 22,696,368.00 22,582,747.69 8.14 CZK 11,350,000 Espaccio Securities Plc FRN Ser 2007-8 Tr 1 07/23.03.15 11,348,184.00 11,274,348.85 4.07 CZK 11,350,000 Greenstreet Struc Fin Prod Plc FRN Ser 2007-8 07/23.03.15 11,348,184.00 11,269,808.85 4.06 CZK 11,350,000 Nimrod Capital Plc FRN Ser 2007-8 Tr 1 07/23.03.15 11,348,184.00 11,260,728.85 4.06 CZK 11,400,000 Opal Financial Products Plc FRN Ser 2007-8 Tr 1 07/23.03.15 11,398,176.00 11,277,275.58 4.07 CZK 11,400,000 Profile Finance Plc FRN Ser 2007-8 Tr 1 07/23.03.15 11,398,176.00 11,239,655.58 4.05 CZK 11,400,000 Recolte Securities Plc FRN Ser 2007-8 Tr 1 07/23.03.15 11,398,176.00 11,261,315.58 4.06 CZK 11,300,000 Silverstate Fin Inv Plc FRN Ser 2007-8 07/23.03.15 11,298,192.00 11,234,852.11 4.05 CZK 11,350,000 Vespucci Strut Fin Prod Plc FRN Ser 2007-8 Tr 1 07/23.03.15 11,348,184.00 11,242,568.85 4.05 CZK 11,350,000 Vigado Capital Plc FRN Ser 2007-8 Tr 1 07/23.03.15 11,348,184.00 11,267,538.85 4.06 CZK 11,300,000 Voyce Investments Plc FRN Ser 2007-8 Tr 1 07/23.03.15 11,298,192.00 11,250,672.11 4.06 CZK 11,400,000 Waterford Cap Investments Plc FRN Ser 07-8 Tr 1 07/23.03.15 11,398,176.00 11,253,335.58 4.06 CZK 11,350,000 Waves Fin Inv Plc FRN Ser 2007-8 Tr 1 07/23.03.15 11,348,184.00 11,266,403.85 4.06
Total investments in securities 226,913,688.00 225,322,575.20 81.24
Cash at banks 28,537,189.02 10.29
Other net assets/(liabilities) 23,481,270.27 8.47
Total 277,341,034.49 100.00

FUND PARTNERS CSOB World Click EUR Plus 4
Statement of investments and other net assets (in EUR) as at 30th September 2010
The accompanying notes are an integral part of these financial statements.
106
Currency Number / nominal value
Description Cost Market value % of total net assets
Investments in securities
Transferable securities admitted to an official stock exchange listing
Bonds
EUR 159,000 Amethyst Structured Fin Plc EMTN FRN Ser 2006-5 06/23.12.14 158,825.75 159,098.53 3.43 EUR 160,000 Beechwood Structured Fin Plc FRN Sen 2006-5 Tr 1 06/23.12.14 159,824.66 158,691.15 3.42 EUR 160,000 Brookfields Capital Plc FRN EMTN Sen 2006-5 Tr 2 07/23.12.14 159,824.66 159,171.15 3.43 EUR 160,000 Eperon Finance Plc FRN EMTN Sen 2006-5 Tr 2 07/23.12.14 159,824.66 159,219.15 3.43 EUR 160,000 Espaccio Securities Plc FRN EMTN Sen 2006-5 Tr 2 07/23.12.14 159,787.03 158,979.15 3.43 EUR 160,000 Greenstreet Struc Fin Prod Plc FRN Sen 2006-5 07/23.12.14 159,780.03 158,915.15 3.42 EUR 300,000 Infinity Finance Plc FRN Ser 0604 04/23.06.13 292,554.77 293,855.91 6.33 EUR 160,000 Nimrod Capital Plc FRN EMTN Sen 2006-5 Tr 2 07/23.12.14 159,780.86 158,787.15 3.42 EUR 161,000 Opal Financial Products Plc FRN EMTN Sen 2006-5 07/23.12.14 160,741.36 159,312.67 3.43 EUR 161,000 Profile Finance Plc FRN EMTN Sen 2006-5 Tr 2 07/23.12.14 160,734.96 158,781.37 3.42 EUR 161,000 Recolte Securities Plc FRN EMTN Sen 2006-5 Tr 2 07/23.12.14 160,746.96 159,087.27 3.43 EUR 300,000 Sierra Finance Plc FRN EMTN Ser 0604 04/23.06.13 287,554.77 289,235.91 6.23 EUR 160,000 Silverstate Fin Inv Plc FRN EMTN Sen 2006-5 Tr 2 07/23.12.14 159,800.86 159,123.15 3.43 EUR 300,000 Venice Finance Plc FRN EMTN Ser 0604 04/23.06.13 288,224.77 289,565.91 6.24 EUR 160,000 Vespucci Strut Fin Prod Plc FRN Sen 2006-5 Tr 2 07/23.12.14 159,780.86 158,531.15 3.42 EUR 160,000 Vigado Capital Plc FRN EMTN Sen 2006-5 Tr 2 07/23.12.14 159,779.33 158,883.15 3.42 EUR 159,000 Voyce Investments Plc FRN EMTN Sen 2006-5 Tr 2 07/23.12.14 158,811.93 158,351.23 3.41 EUR 161,000 Waterford Cap Investments Plc FRN Sen 2006-5 07/23.12.14 160,740.56 158,974.57 3.42 EUR 160,000 Waves Fin Inv Plc FRN EMTN Sen 2006-5 07/23.12.14 159,791.26 158,867.15 3.42 EUR 300,000 Zulma Finance Plc FRN Ser 0604 04/23.06.13 294,114.77 295,505.91 6.37
Total bonds 3,721,024.81 3,710,936.78 79.95
Other transferable securities
Bonds
EUR 279,000 D-Star Finance Plc FRN E Ser 2008-4 JunDec 09/21.03.14 279,339.01 280,121.10 6.03
Total bonds 279,339.01 280,121.10 6.03
Total investments in securities 4,000,363.82 3,991,057.88 85.98
Cash at banks 484,555.66 10.44
Other net assets/(liabilities) 166,380.51 3.58
Total 4,641,994.05 100.00

FUND PARTNERS CSOB Europe Click Plus 3
Statement of investments and other net assets (in EUR) as at 30th September 2010
The accompanying notes are an integral part of these financial statements.
107
Currency Number / nominal value
Description Cost Market value % of total net assets
Investments in securities
Transferable securities admitted to an official stock exchange listing
Bonds
EUR 121,000 Amethyst Structured Fin Plc FRN Ser 2007-6 Tr 2 07/10.01.15 115,330.76 121,078.27 2.84 EUR 122,000 Beechwood Structured Fin Plc FRN Sen 2007-6 Tr 2 07/10.01.15 116,283.91 121,005.32 2.84 EUR 121,000 Brookfields Capital Plc FRN EMTN Ser 2007-6 Tr 2 07/10.01.15 115,330.76 120,376.47 2.83 EUR 122,000 Eperon Finance Plc FRN EMTN Ser 2007-6 Tr 2 07/10.01.15 116,283.91 121,407.92 2.85 EUR 122,000 Espaccio Securities Plc FRN EMTN Ser 2007-6 Tr 2 07/10.01.15 116,315.49 121,224.92 2.85 EUR 122,000 Greenstreet Struc Fin Prod Plc FRN EMTN Sen 07/10.01.15 116,315.87 121,176.12 2.85 EUR 300,000 Infinity Finance Plc FRN EMTN Ser 0704 05/10.01.14 292,454.86 293,864.07 6.90 EUR 122,000 Nimrod Capital Plc FRN EMTN Ser 2007-6 Tr 2 07/10.01.15 116,283.90 121,078.52 2.84 EUR 122,000 Opal Financial Prod Plc FRN EMTN Ser 2007-6 Tr 2 07/10.01.15 116,314.92 120,724.72 2.83 EUR 123,000 Profile Finance Plc FRN EMTN Ser 2007-6 Tr 2 07/10.01.15 117,263.56 121,308.36 2.85 EUR 122,000 Recolte Securities Plc FRN EMTN Ser 2007-6 Tr 2 07/10.01.15 116,315.11 120,553.92 2.83 EUR 300,000 Sierra Finance Plc FRN Ser 0704 05/10.01.14 287,444.86 289,244.07 6.79 EUR 121,000 Silverstate Fin Inv Plc FRN EMTN Ser 2007-6 Tr 2 07/10.01.15 115,330.75 120,340.17 2.83 EUR 300,000 Venice Finance Plc FRN Ser 0704 05/10.01.14 288,094.86 289,574.07 6.80 EUR 122,000 Vespucci Strut Fin Prod Plc FRN Ser 2007-6 Tr 2 07/10.01.15 116,283.90 120,883.32 2.84 EUR 122,000 Vigado Capital Plc FRN EMTN Ser 2007-6 Tr 2 07/10.01.15 116,314.26 121,151.72 2.85 EUR 122,000 Voyce Investments Plc FRN EMTN Ser 2007-6 Tr 2 07/10.01.15 116,283.90 121,505.52 2.85 EUR 122,000 Waterford Cap Investments Plc FRN Ser 2007-6 07/10.01.15 116,313.79 120,468.52 2.83 EUR 122,000 Waves Fin Inv Plc FRN Ser 2007-6 Tr 2 07/10.01.15 116,283.90 121,139.52 2.84 EUR 300,000 Zulma Finance Plc FRN Ser 0704 05/10.01.14 293,994.86 295,514.07 6.94
Total bonds 3,020,838.13 3,103,619.59 72.88
Other transferable securities
Bonds
EUR 279,000 D-Star Finance Plc FRN B Ser 2008-4 JanJul 09/10.03.14 279,404.36 280,128.67 6.58
Total bonds 279,404.36 280,128.67 6.58
Total investments in securities 3,300,242.49 3,383,748.26 79.46
Cash at banks 337,013.29 7.91
Other net assets/(liabilities) 537,653.06 12.63
Total 4,258,414.61 100.00

FUND PARTNERS CSOB World Click Plus 19
Statement of investments and other net assets (in CZK) as at 30th September 2010
The accompanying notes are an integral part of these financial statements.
108
Currency Number / nominal value
Description Cost Market value % of total net assets
Investments in securities
Transferable securities admitted to an official stock exchange listing
Bonds
CZK 10,500,000 Amethyst Structured Fin Plc FRN Ser 2007-8 Tr 1 07/23.03.15 10,498,320.00 10,503,514.35 8.24 CZK 10,600,000 Beechwood Structured Fin Plc FRN Ser 2007-8 Tr 1 07/23.03.15 10,598,304.00 10,510,267.82 8.24 CZK 10,550,000 Brookfields Capital Plc FRN Ser 2007-8 Tr 1 07/23.03.15 10,548,312.00 10,492,341.09 8.23 CZK 10,600,000 Eperon Finance Plc FRN Ser 2007-8 Tr 1 07/23.03.15 10,598,304.00 10,545,247.82 8.27 CZK 5,300,000 Espaccio Securities Plc FRN Ser 2007-8 Tr 1 07/23.03.15 5,299,152.00 5,264,673.91 4.13 CZK 5,300,000 Greenstreet Struc Fin Prod Plc FRN Ser 2007-8 07/23.03.15 5,299,152.00 5,262,553.91 4.13 CZK 5,300,000 Nimrod Capital Plc FRN Ser 2007-8 Tr 1 07/23.03.15 5,299,152.00 5,258,313.91 4.12 CZK 5,300,000 Opal Financial Products Plc FRN Ser 2007-8 Tr 1 07/23.03.15 5,299,152.00 5,242,943.91 4.11 CZK 5,300,000 Profile Finance Plc FRN Ser 2007-8 Tr 1 07/23.03.15 5,299,152.00 5,225,453.91 4.10 CZK 5,300,000 Recolte Securities Plc FRN Ser 2007-8 Tr 1 07/23.03.15 5,299,152.00 5,235,523.91 4.11 CZK 5,250,000 Silverstate Fin Inv Plc FRN Ser 2007-8 07/23.03.15 5,249,160.00 5,219,732.18 4.09 CZK 5,300,000 Vespucci Strut Fin Prod Plc FRN Ser 2007-8 Tr 1 07/23.03.15 5,299,152.00 5,249,833.91 4.12 CZK 5,300,000 Vigado Capital Plc FRN Ser 2007-8 Tr 1 07/23.03.15 5,299,152.00 5,261,493.91 4.13 CZK 5,250,000 Voyce Investments Plc FRN Ser 2007-8 Tr 1 07/23.03.15 5,249,160.00 5,227,082.18 4.10 CZK 5,300,000 Waterford Cap Investments Plc FRN Ser 07-8 Tr 1 07/23.03.15 5,299,152.00 5,231,813.91 4.10 CZK 5,300,000 Waves Fin Inv Plc FRN Ser 2007-8 Tr 1 07/23.03.15 5,299,152.00 5,260,963.91 4.13
Total investments in securities 105,733,080.00 104,991,754.54 82.35
Cash at banks 13,491,843.21 10.58
Other net assets/(liabilities) 9,009,669.85 7.07
Total 127,493,267.60 100.00

FUND PARTNERS CSOB World Click Plus 20
Statement of investments and other net assets (in CZK) as at 30th September 2010
The accompanying notes are an integral part of these financial statements.
109
Currency Number / nominal value
Description Cost Market value % of total net assets
Investments in securities
Transferable securities admitted to an official stock exchange listing
Bonds
CZK 6,000,000 Amethyst Structured Fin Plc FRN Ser 2007-15 Tr 1 07/10.07.15 5,988,275.00 6,005,616.60 8.60 CZK 6,000,000 Beechwood Structured Fin Plc FRN Ser 2007-15 07/10.07.15 5,988,275.00 5,952,816.60 8.52 CZK 6,000,000 Brookfields Capital Plc FRN Ser 2007-15 Tr 1 07/10.07.15 5,988,275.00 5,970,816.60 8.55 CZK 6,000,000 Eperon Finance Plc FRN Ser 2007-15 Tr 1 07/10.07.15 5,988,275.00 5,972,616.60 8.55 CZK 3,000,000 Espaccio Securities Plc FRN Ser 2007-15 Tr 1 07/10.07.15 2,994,137.49 2,981,808.30 4.27 CZK 3,000,000 Greenstreet Struc Fin Prod Plc FRN Ser 2007-15 07/10.07.15 2,994,137.49 2,980,608.30 4.27 CZK 3,000,000 Nimrod Capital Plc FRN Ser 2007-15 Tr 1 07/10.07.15 2,994,137.49 2,978,208.30 4.27 CZK 3,000,000 Opal Financial Products Plc FRN Ser 2007-15 Tr 1 07/10.07.15 2,994,137.49 2,969,508.30 4.25 CZK 3,000,000 Profile Finance Plc FRN Ser 2007-15 Tr 1 07/10.07.15 2,994,137.49 2,959,608.30 4.24 CZK 3,000,000 Recolte Securities Plc FRN Ser 2007-15 Tr 1 07/10.07.15 2,994,137.49 2,965,308.30 4.25 CZK 3,000,000 Silverstate Fin Inv Plc FRN Ser 2007-15 Tr 1 07/10.07.15 2,994,137.49 2,984,508.30 4.27 CZK 3,000,000 Vespucci Strut Fin Prod Plc FRN Ser 2007-15 Tr 1 07/10.07.15 2,994,137.49 2,973,408.30 4.26 CZK 3,000,000 Vigado Capital Plc FRN Ser 2007-15 Tr 1 07/10.07.15 2,994,137.49 2,980,008.30 4.27 CZK 3,000,000 Voyce Investments Plc FRN Ser 2007-15 Tr 1 07/10.07.15 2,994,137.49 2,988,708.30 4.28 CZK 3,000,000 Waterford Cap Investments Plc FRN Ser 2007-15 07/10.07.15 2,994,137.49 2,963,208.30 4.24 CZK 3,000,000 Waves Fin Inv Plc FRN Ser 2007-15 Tr 1 07/10.07.15 2,994,137.49 2,979,708.30 4.27
Total investments in securities 59,882,749.88 59,606,466.00 85.36
Cash at banks 5,448,720.24 7.80
Other net assets/(liabilities) 4,774,081.43 6.84
Total 69,829,267.67 100.00

FUND PARTNERS CSOB World Click Plus 21
Statement of investments and other net assets (in CZK) as at 30th September 2010
The accompanying notes are an integral part of these financial statements.
110
Currency Number / nominal value
Description Cost Market value % of total net assets
Investments in securities
Transferable securities admitted to an official stock exchange listing
Bonds
CZK 18,050,000 Amethyst Structured Fin Plc FRN Ser 2007-15 Tr 1 07/10.07.15 17,993,875.70 18,066,896.61 8.27 CZK 18,150,000 Beechwood Structured Fin Plc FRN Ser 2007-15 07/10.07.15 18,093,564.77 18,007,270.22 8.24 CZK 18,150,000 Brookfields Capital Plc FRN Ser 2007-15 Tr 1 07/10.07.15 18,093,564.77 18,061,720.22 8.27 CZK 18,150,000 Eperon Finance Plc FRN Ser 2007-15 Tr 1 07/10.07.15 18,093,564.77 18,067,165.22 8.27 CZK 9,100,000 Espaccio Securities Plc FRN Ser 2007-15 Tr 1 07/10.07.15 9,071,704.64 9,044,818.51 4.14 CZK 9,100,000 Greenstreet Struc Fin Prod Plc FRN Ser 2007-15 07/10.07.15 9,071,704.64 9,041,178.51 4.14 CZK 9,100,000 Nimrod Capital Plc FRN Ser 2007-15 Tr 1 07/10.07.15 9,071,704.64 9,033,898.51 4.14 CZK 9,100,000 Opal Financial Products Plc FRN Ser 2007-15 Tr 1 07/10.07.15 9,071,704.64 9,007,508.51 4.12 CZK 9,150,000 Profile Finance Plc FRN Ser 2007-15 Tr 1 07/10.07.15 9,121,549.17 9,026,805.32 4.13 CZK 9,100,000 Recolte Securities Plc FRN Ser 2007-15 Tr 1 07/10.07.15 9,071,704.64 8,994,768.51 4.12 CZK 9,050,000 Silverstate Fin Inv Plc FRN Ser 2007-15 Tr 1 07/10.07.15 9,021,860.11 9,003,266.71 4.12 CZK 9,100,000 Vespucci Strut Fin Prod Plc FRN Ser 2007-15 Tr 1 07/10.07.15 9,071,704.64 9,019,338.51 4.13 CZK 9,100,000 Vigado Capital Plc FRN Ser 2007-15 Tr 1 07/10.07.15 9,071,704.64 9,039,358.51 4.14 CZK 9,050,000 Voyce Investments Plc FRN Ser 2007-15 Tr 1 07/10.07.15 9,021,860.11 9,015,936.71 4.13 CZK 9,100,000 Waterford Cap Investments Plc FRN Ser 2007-15 07/10.07.15 9,071,704.64 8,988,398.51 4.12 CZK 9,050,000 Waves Fin Inv Plc FRN Ser 2007-15 Tr 1 07/10.07.15 9,021,860.11 8,988,786.71 4.12
Total investments in securities 181,035,336.63 180,407,115.80 82.60
Cash at banks 21,310,117.42 9.76
Other net assets/(liabilities) 16,692,100.35 7.64
Total 218,409,333.57 100.00

FUND PARTNERS CSOB World Click Plus 22
Statement of investments and other net assets (in CZK) as at 30th September 2010
The accompanying notes are an integral part of these financial statements.
111
Currency Number / nominal value
Description Cost Market value % of total net assets
Investments in securities
Transferable securities admitted to an official stock exchange listing
Bonds
CZK 11,350,000 Amethyst Structured Fin Plc FRN Ser 2007-15 Tr 1 07/10.07.15 11,330,415.73 11,360,624.73 8.62 CZK 11,400,000 Beechwood Structured Fin Plc FRN Ser 2007-15 07/10.07.15 11,380,329.45 11,310,351.54 8.58 CZK 11,400,000 Brookfields Capital Plc FRN Ser 2007-15 Tr 1 07/10.07.15 11,380,329.45 11,344,551.54 8.61 CZK 11,400,000 Eperon Finance Plc FRN Ser 2007-15 Tr 1 07/10.07.15 11,380,329.45 11,347,971.54 8.61 CZK 5,700,000 Espaccio Securities Plc FRN Ser 2007-15 Tr 1 07/10.07.15 5,690,164.71 5,665,435.77 4.30 CZK 5,700,000 Greenstreet Struc Fin Prod Plc FRN Ser 2007-15 07/10.07.15 5,690,164.71 5,663,155.77 4.30 CZK 5,700,000 Nimrod Capital Plc FRN Ser 2007-15 Tr 1 07/10.07.15 5,690,164.71 5,658,595.77 4.29 CZK 5,700,000 Opal Financial Products Plc FRN Ser 2007-15 Tr 1 07/10.07.15 5,690,164.71 5,642,065.77 4.28 CZK 5,750,000 Profile Finance Plc FRN Ser 2007-15 Tr 1 07/10.07.15 5,740,078.43 5,672,582.58 4.30 CZK 5,700,000 Recolte Securities Plc FRN Ser 2007-15 Tr 1 07/10.07.15 5,690,164.71 5,634,085.77 4.28 CZK 5,700,000 Silverstate Fin Inv Plc FRN Ser 2007-15 Tr 1 07/10.07.15 5,690,164.71 5,670,565.77 4.30 CZK 5,700,000 Vespucci Strut Fin Prod Plc FRN Ser 2007-15 Tr 1 07/10.07.15 5,690,164.71 5,649,475.77 4.29 CZK 5,700,000 Vigado Capital Plc FRN Ser 2007-15 Tr 1 07/10.07.15 5,690,164.71 5,662,015.77 4.30 CZK 5,700,000 Voyce Investments Plc FRN Ser 2007-15 Tr 1 07/10.07.15 5,690,164.71 5,678,545.77 4.31 CZK 5,700,000 Waterford Cap Investments Plc FRN Ser 2007-15 07/10.07.15 5,690,164.71 5,630,095.77 4.27 CZK 5,700,000 Waves Fin Inv Plc FRN Ser 2007-15 Tr 1 07/10.07.15 5,690,164.71 5,661,445.77 4.30
Total investments in securities 113,803,294.32 113,251,565.40 85.94
Cash at banks 12,327,810.82 9.36
Other net assets/(liabilities) 6,195,740.20 4.70
Total 131,775,116.42 100.00

FUND PARTNERS CSOB World Click Plus 23
Statement of investments and other net assets (in CZK) as at 30th September 2010
The accompanying notes are an integral part of these financial statements.
112
Currency Number / nominal value
Description Cost Market value % of total net assets
Investments in securities
Transferable securities admitted to an official stock exchange listing
Bonds
CZK 7,050,000 Amethyst Structured Fin Plc FRN Ser 2007-15 Tr 1 07/10.07.15 7,038,434.94 7,056,599.50 8.26 CZK 7,050,000 Beechwood Structured Fin Plc FRN Ser 2007-15 07/10.07.15 7,038,434.94 6,994,559.50 8.19 CZK 7,050,000 Brookfields Capital Plc FRN Ser 2007-15 Tr 1 07/10.07.15 7,038,434.94 7,015,709.50 8.21 CZK 7,050,000 Eperon Finance Plc FRN Ser 2007-15 Tr 1 07/10.07.15 7,038,434.94 7,017,824.50 8.22 CZK 3,550,000 Espaccio Securities Plc FRN Ser 2007-15 Tr 1 07/10.07.15 3,544,176.46 3,528,473.15 4.13 CZK 3,550,000 Greenstreet Struc Fin Prod Plc FRN Ser 2007-15 07/10.07.15 3,544,176.46 3,527,053.15 4.13 CZK 3,550,000 Nimrod Capital Plc FRN Ser 2007-15 Tr 1 07/10.07.15 3,544,176.46 3,524,213.15 4.13 CZK 3,550,000 Opal Financial Products Plc FRN Ser 2007-15 Tr 1 07/10.07.15 3,544,176.46 3,513,918.15 4.11 CZK 3,550,000 Profile Finance Plc FRN Ser 2007-15 Tr 1 07/10.07.15 3,544,176.46 3,502,203.15 4.10 CZK 3,550,000 Recolte Securities Plc FRN Ser 2007-15 Tr 1 07/10.07.15 3,544,176.46 3,508,948.15 4.11 CZK 3,500,000 Silverstate Fin Inv Plc FRN Ser 2007-15 Tr 1 07/10.07.15 3,494,258.49 3,481,926.35 4.08 CZK 3,550,000 Vespucci Strut Fin Prod Plc FRN Ser 2007-15 Tr 1 07/10.07.15 3,544,176.46 3,518,533.15 4.12 CZK 3,550,000 Vigado Capital Plc FRN Ser 2007-15 Tr 1 07/10.07.15 3,544,176.46 3,526,343.15 4.13 CZK 3,500,000 Voyce Investments Plc FRN Ser 2007-15 Tr 1 07/10.07.15 3,494,258.49 3,486,826.35 4.08 CZK 3,550,000 Waterford Cap Investments Plc FRN Ser 2007-15 07/10.07.15 3,544,176.46 3,506,463.15 4.11 CZK 3,500,000 Waves Fin Inv Plc FRN Ser 2007-15 Tr 1 07/10.07.15 3,494,258.49 3,476,326.35 4.07
Total investments in securities 70,534,103.37 70,185,920.40 82.18
Cash at banks 6,959,493.55 8.15
Other net assets/(liabilities) 8,264,563.90 9.67
Total 85,409,977.85 100.00

FUND PARTNERS CSOB World Click Plus 24
Statement of investments and other net assets (in CZK) as at 30th September 2010
The accompanying notes are an integral part of these financial statements.
113
Currency Number / nominal value
Description Cost Market value % of total net assets
Investments in securities
Transferable securities admitted to an official stock exchange listing
Bonds
CZK 24,950,000 Amethyst Structured Fin Plc FRN Ser 2007-15 Tr 1 07/10.07.15 24,872,641.27 24,973,355.69 8.48 CZK 25,100,000 Beechwood Structured Fin Plc FRN Ser 2007-15 07/10.07.15 25,022,176.19 24,902,616.11 8.46 CZK 25,050,000 Brookfields Capital Plc FRN Ser 2007-15 Tr 1 07/10.07.15 24,972,331.22 24,928,159.30 8.47 CZK 25,100,000 Eperon Finance Plc FRN Ser 2007-15 Tr 1 07/10.07.15 25,022,176.19 24,985,446.11 8.49 CZK 12,550,000 Espaccio Securities Plc FRN Ser 2007-15 Tr 1 07/10.07.15 12,511,088.09 12,473,898.05 4.24 CZK 12,550,000 Greenstreet Struc Fin Prod Plc FRN Ser 2007-15 07/10.07.15 12,511,088.09 12,468,878.05 4.24 CZK 12,550,000 Nimrod Capital Plc FRN Ser 2007-15 Tr 1 07/10.07.15 12,511,088.09 12,458,838.05 4.23 CZK 12,550,000 Opal Financial Products Plc FRN Ser 2007-15 Tr 1 07/10.07.15 12,511,088.09 12,422,443.05 4.22 CZK 12,650,000 Profile Finance Plc FRN Ser 2007-15 Tr 1 07/10.07.15 12,610,778.03 12,479,681.67 4.24 CZK 12,600,000 Recolte Securities Plc FRN Ser 2007-15 Tr 1 07/10.07.15 12,560,933.06 12,454,294.86 4.23 CZK 12,500,000 Silverstate Fin Inv Plc FRN Ser 2007-15 Tr 1 07/10.07.15 12,461,243.11 12,435,451.25 4.22 CZK 12,550,000 Vespucci Strut Fin Prod Plc FRN Ser 2007-15 Tr 1 07/10.07.15 12,511,088.09 12,438,758.05 4.23 CZK 12,600,000 Vigado Capital Plc FRN Ser 2007-15 Tr 1 07/10.07.15 12,560,933.06 12,516,034.86 4.25 CZK 12,500,000 Voyce Investments Plc FRN Ser 2007-15 Tr 1 07/10.07.15 12,461,243.11 12,452,951.25 4.23 CZK 12,600,000 Waterford Cap Investments Plc FRN Ser 2007-15 07/10.07.15 12,560,933.06 12,445,474.86 4.23 CZK 12,550,000 Waves Fin Inv Plc FRN Ser 2007-15 Tr 1 07/10.07.15 12,511,088.09 12,465,113.05 4.23
Total investments in securities 250,171,916.84 249,301,394.26 84.69
Cash at banks 28,386,219.95 9.64
Other net assets/(liabilities) 16,668,099.45 5.67
Total 294,355,713.66 100.00

FUND PARTNERS CSOB World Click USD Plus 6
Statement of investments and other net assets (in USD) as at 30th September 2010
The accompanying notes are an integral part of these financial statements.
114
Currency Number / nominal value
Description Cost Market value % of total net assets
Investments in securities
Transferable securities admitted to an official stock exchange listing
Bonds
USD 292,000 Amethyst Structured Fin Plc FRN Ser 2007-7 Tr 2 07/10.01.15 291,580.34 292,417.21 7.75 USD 294,000 Beechwood Structured Fin Plc FRN Ser 07-7 Tr 2 07/10.01.15 293,577.47 291,832.87 7.74 USD 292,000 Brookfields Capital Plc FRN EMTN Ser 2007-7 Tr 2 07/10.01.15 291,580.34 290,723.61 7.71 USD 294,000 Eperon Finance Plc FRN EMTN Ser 2007-7 Tr 2 07/10.01.15 293,577.47 292,803.07 7.76 USD 146,000 Espaccio Securities Plc FRN EMTN Ser 07-7 Tr 2 07/10.01.15 145,790.18 145,186.61 3.85 USD 146,000 Greenstreet Struc Fin Prod Plc FRN EMTN Sen Tr 2 07/10.01.15 145,790.18 145,128.21 3.85 USD 146,000 Nimrod Capital Plc FRN EMTN Ser 2007-7 Tr 2 07/10.01.15 145,790.18 145,011.41 3.84 USD 146,000 Opal Financial Products Plc FRN Ser 2007-7 Tr 2 07/10.01.15 145,790.18 144,588.01 3.83 USD 148,000 Profile Finance Plc FRN EMTN Ser 2007-7 Tr 2 07/10.01.15 147,787.30 146,080.26 3.87 USD 146,000 Recolte Securities Plc FRN Ser 2007-7 Tr 2 07/10.01.15 145,790.18 144,383.61 3.83 USD 146,000 Silverstate Fin Inv Plc FRN Ser 2007-7 Tr 2 07/10.01.15 145,790.18 145,318.01 3.85 USD 146,000 Vespucci Strut Fin Prod Plc FRN Ser 2007-7 Tr 2 07/10.01.15 145,790.18 144,777.81 3.84 USD 146,000 Vigado Capital Plc FRN Ser 2007-7 Tr 2 07/10.01.15 145,790.18 145,099.01 3.85 USD 146,000 Voyce Investments Plc FRN EMTN Ser 2007-7 Tr 2 07/10.01.15 145,790.18 145,522.41 3.86 USD 146,000 Waterford Cap Investments Plc FRN Ser 2007-7 07/10.01.15 145,790.18 144,281.41 3.82 USD 146,000 Waves Fin Inv Plc FRN Ser 2007-7 Tr 2 07/10.01.15 145,790.18 145,084.41 3.85
Total investments in securities 2,921,794.90 2,908,237.93 77.10
Cash at banks 342,741.03 9.09
Other net assets/(liabilities) 521,027.68 13.81
Total 3,772,006.64 100.00

FUND PARTNERS CSOB World Growth Plus 1
Statement of investments and other net assets (in CZK) as at 30th September 2010
The accompanying notes are an integral part of these financial statements.
115
Currency Number / nominal value
Description Cost Market value % of total net assets
Investments in securities
Transferable securities admitted to an official stock exchange listing
Bonds
CZK 26,850,000 Amethyst Structured Fin Plc FRN Ser 2007-14 Tr 1 07/10.05.15 26,828,665.86 26,873,525.97 8.08 CZK 26,800,000 Beechwood Structured Fin Plc FRN Ser 2007-1 Tr 1 07/10.05.15 26,778,705.59 26,587,642.16 7.99 CZK 26,800,000 Brookfields Capital Plc FRN Ser 2007-14 Tr 1 07/10.05.15 26,778,705.59 26,668,042.16 8.02 CZK 26,800,000 Eperon Finance Plc FRN Ser 2007-14 Tr 1 07/10.05.15 26,778,705.59 26,676,082.16 8.02 CZK 13,400,000 Espaccio Securities Plc FRN Ser 2007-14 Tr 1 07/10.05.15 13,389,352.79 13,317,941.08 4.01 CZK 13,400,000 Greenstreet Struc Fin Prod Plc FRN Ser 2007-14 07/10.05.15 13,389,352.79 13,312,581.08 4.00 CZK 13,400,000 Nimrod Capital Plc FRN Ser 2007-14 Tr 1 07/10.05.15 13,389,352.79 13,301,861.08 4.00 CZK 13,450,000 Opal Financial Products Plc FRN Ser 2007-14 Tr 1 07/10.05.15 13,439,313.06 13,312,489.89 4.00 CZK 13,450,000 Profile Finance Plc FRN Ser 2007-14 Tr 1 07/10.05.15 13,439,313.06 13,268,104.89 3.99 CZK 13,450,000 Recolte Securities Plc FRN Ser 2007-14 Tr 1 07/10.05.15 13,439,313.06 13,293,659.89 4.00 CZK 13,350,000 Silverstate Fin Inv Plc FRN Ser 2007-14 Tr 1 07/10.05.15 13,339,392.52 13,280,262.27 3.99 CZK 13,400,000 Vespucci Strut Fin Prod Plc FRN Ser 2007-14 Tr 1 07/10.05.15 13,389,352.79 13,280,421.08 3.99 CZK 13,400,000 Vigado Capital Plc FRN Ser 2007-14 Tr 1 07/10.05.15 13,389,352.79 13,309,901.08 4.00 CZK 13,350,000 Voyce Investments Plc FRN Ser 2007-14 Tr 1 07/10.05.15 13,339,392.52 13,298,952.27 4.00 CZK 13,450,000 Waterford Cap Investments FRN Ser 2007-14 Tr 1 07/10.05.15 13,439,313.06 13,284,244.89 4.00 CZK 13,400,000 Waves Fin Inv Plc FRN Ser 2007-14 Tr 1 07/10.05.15 13,389,352.79 13,308,561.08 4.00
Total investments in securities 267,936,936.65 266,374,273.03 80.09
Cash at banks 25,717,139.89 7.73
Other net assets/(liabilities) 40,511,349.97 12.18
Total 332,602,762.89 100.00

FUND PARTNERS CSOB Europe Real Estate Growth Plus 1
Statement of investments and other net assets (in CZK) as at 30th September 2010
The accompanying notes are an integral part of these financial statements.
116
Currency Number / nominal value
Description Cost Market value % of total net assets
Investments in securities
Transferable securities admitted to an official stock exchange listing
Bonds
CZK 14,150,000 Amethyst Structured Fin Plc FRN Ser 2007-15 Tr 1 07/10.07.15 14,095,037.55 14,163,245.81 9.19 CZK 14,250,000 Beechwood Structured Fin Plc FRN Ser 2007-15 07/10.07.15 14,194,649.12 14,137,939.42 9.18 CZK 14,200,000 Brookfields Capital Plc FRN Ser 2007-15 Tr 1 07/10.07.15 14,144,843.34 14,130,932.62 9.17 CZK 14,200,000 Eperon Finance Plc FRN Ser 2007-15 Tr 1 07/10.07.15 14,144,843.34 14,135,192.62 9.18 CZK 7,100,000 Espaccio Securities Plc FRN Ser 2007-15 Tr 1 07/10.07.15 7,072,421.66 7,056,946.31 4.58 CZK 7,100,000 Greenstreet Struc Fin Prod Plc FRN Ser 2007-15 07/10.07.15 7,072,421.66 7,054,106.31 4.58 CZK 7,100,000 Nimrod Capital Plc FRN Ser 2007-15 Tr 1 07/10.07.15 7,072,421.66 7,048,426.31 4.58 CZK 7,100,000 Opal Financial Products Plc FRN Ser 2007-15 Tr 1 07/10.07.15 7,072,421.66 7,027,836.31 4.56 CZK 7,150,000 Profile Finance Plc FRN Ser 2007-15 Tr 1 07/10.07.15 7,122,227.45 7,053,733.11 4.58 CZK 7,100,000 Recolte Securities Plc FRN Ser 2007-15 Tr 1 07/10.07.15 7,072,421.66 7,017,896.31 4.56 CZK 7,100,000 Silverstate Fin Inv Plc FRN Ser 2007-15 Tr 1 07/10.07.15 7,072,421.66 7,063,336.31 4.59 CZK 7,100,000 Vespucci Strut Fin Prod Plc FRN Ser 2007-15 Tr 1 07/10.07.15 7,072,421.66 7,037,066.31 4.57 CZK 7,100,000 Vigado Capital Plc FRN Ser 2007-15 Tr 1 07/10.07.15 7,072,421.67 7,052,686.31 4.58 CZK 7,100,000 Voyce Investments Plc FRN Ser 2007-15 Tr 1 07/10.07.15 7,072,421.66 7,073,276.31 4.59 CZK 7,100,000 Waterford Cap Investments Plc FRN Ser 2007-15 07/10.07.15 7,072,421.67 7,012,926.31 4.55 CZK 7,100,000 Waves Fin Inv Plc FRN Ser 2007-15 Tr 1 07/10.07.15 7,072,421.66 7,051,976.31 4.58
Total investments in securities 141,498,239.08 141,117,522.99 91.62
Cash at banks 14,802,127.67 9.61
Other net assets/(liabilities) -1,902,326.30 -1.23
Total 154,017,324.36 100.00

FUND PARTNERS CSOB World Growth Plus 9
Statement of investments and other net assets (in CZK) as at 30th September 2010
The accompanying notes are an integral part of these financial statements.
117
Currency Number / nominal value
Description Cost Market value % of total net assets
Investments in securities
Transferable securities admitted to an official stock exchange listing
Bonds
CZK 23,800,000 Amethyst Structured Fin Plc FRN Ser 2007-15 Tr 1 07/10.07.15 23,710,426.34 23,822,279.18 8.69 CZK 23,950,000 Beechwood Structured Fin Plc FRN Ser 2007-15 07/10.07.15 23,859,861.80 23,761,659.59 8.67 CZK 23,900,000 Brookfields Capital Plc FRN Ser 2007-15 Tr 1 07/10.07.15 23,810,049.98 23,783,752.79 8.67 CZK 23,950,000 Eperon Finance Plc FRN Ser 2007-15 Tr 1 07/10.07.15 23,859,861.80 23,840,694.59 8.70 CZK 12,000,000 Espaccio Securities Plc FRN Ser 2007-15 Tr 1 07/10.07.15 11,954,836.81 11,927,233.20 4.35 CZK 12,000,000 Greenstreet Struc Fin Prod Plc FRN Ser 2007-15 07/10.07.15 11,954,836.81 11,922,433.20 4.35 CZK 11,950,000 Nimrod Capital Plc FRN Ser 2007-15 Tr 1 07/10.07.15 11,905,024.99 11,863,196.40 4.33 CZK 12,000,000 Opal Financial Products Plc FRN Ser 2007-15 Tr 1 07/10.07.15 11,954,836.81 11,878,033.20 4.33 CZK 12,050,000 Profile Finance Plc FRN Ser 2007-15 Tr 1 07/10.07.15 12,004,648.63 11,887,760.01 4.33 CZK 12,000,000 Recolte Securities Plc FRN Ser 2007-15 Tr 1 07/10.07.15 11,954,836.81 11,861,233.20 4.33 CZK 11,950,000 Silverstate Fin Inv Plc FRN Ser 2007-15 Tr 1 07/10.07.15 11,905,024.99 11,888,291.40 4.34 CZK 11,950,000 Vespucci Strut Fin Prod Plc FRN Ser 2007-15 Tr 1 07/10.07.15 11,905,024.99 11,844,076.40 4.32 CZK 12,000,000 Vigado Capital Plc FRN Ser 2007-15 Tr 1 07/10.07.15 11,954,836.81 11,920,033.20 4.35 CZK 11,950,000 Voyce Investments Plc FRN Ser 2007-15 Tr 1 07/10.07.15 11,905,024.99 11,905,021.40 4.34 CZK 12,000,000 Waterford Cap Investments Plc FRN Ser 2007-15 07/10.07.15 11,954,836.81 11,852,833.20 4.32 CZK 11,950,000 Waves Fin Inv Plc FRN Ser 2007-15 Tr 1 07/10.07.15 11,905,024.99 11,869,171.40 4.33
Total investments in securities 238,498,994.36 237,827,702.36 86.75
Cash at banks 26,473,026.62 9.66
Other net assets/(liabilities) 9,848,335.25 3.59
Total 274,149,064.23 100.00

FUND PARTNERS CSOB Europe Growth Plus 2
Statement of investments and other net assets (in CZK) as at 30th September 2010
The accompanying notes are an integral part of these financial statements.
118
Currency Number / nominal value
Description Cost Market value % of total net assets
Investments in securities
Transferable securities admitted to an official stock exchange listing
Bonds
CZK 13,050,000 Amethyst Structured Fin Plc FRN Ser 2007-15 Tr 1 07/10.07.15 13,023,337.19 13,062,216.11 8.96 CZK 13,150,000 Beechwood Structured Fin Plc FRN Ser 2007-15 07/10.07.15 13,123,132.88 13,046,589.71 8.94 CZK 13,100,000 Brookfields Capital Plc FRN Ser 2007-15 Tr 1 07/10.07.15 13,073,235.04 13,036,282.91 8.94 CZK 13,100,000 Eperon Finance Plc FRN Ser 2007-15 Tr 1 07/10.07.15 13,073,235.04 13,040,212.91 8.94 CZK 6,550,000 Espaccio Securities Plc FRN Ser 2007-15 Tr 1 07/10.07.15 6,536,617.52 6,510,281.46 4.46 CZK 6,550,000 Greenstreet Struc Fin Prod Plc FRN Ser 2007-15 07/10.07.15 6,536,617.52 6,507,661.46 4.46 CZK 6,550,000 Nimrod Capital Plc FRN Ser 2007-15 Tr 1 07/10.07.15 6,536,617.52 6,502,421.46 4.46 CZK 6,550,000 Opal Financial Products Plc FRN Ser 2007-15 Tr 1 07/10.07.15 6,536,617.52 6,483,426.46 4.45 CZK 6,600,000 Profile Finance Plc FRN Ser 2007-15 Tr 1 07/10.07.15 6,586,515.36 6,511,138.26 4.46 CZK 6,550,000 Recolte Securities Plc FRN Ser 2007-15 Tr 1 07/10.07.15 6,536,617.52 6,474,256.46 4.44 CZK 6,550,000 Silverstate Fin Inv Plc FRN Ser 2007-15 Tr 1 07/10.07.15 6,536,617.52 6,516,176.46 4.47 CZK 6,550,000 Vespucci Strut Fin Prod Plc FRN Ser 2007-15 Tr 1 07/10.07.15 6,536,617.52 6,491,941.46 4.45 CZK 6,550,000 Vigado Capital Plc FRN Ser 2007-15 Tr 1 07/10.07.15 6,536,617.52 6,506,351.46 4.46 CZK 6,550,000 Voyce Investments Plc FRN Ser 2007-15 Tr 1 07/10.07.15 6,536,617.52 6,525,346.46 4.47 CZK 6,550,000 Waterford Cap Investments Plc FRN Ser 2007-15 07/10.07.15 6,536,617.52 6,469,671.46 4.44 CZK 6,550,000 Waves Fin Inv Plc FRN Ser 2007-15 Tr 1 07/10.07.15 6,536,617.52 6,505,696.46 4.46
Total investments in securities 130,782,248.23 130,189,670.96 89.26
Cash at banks 13,743,140.49 9.42
Other net assets/(liabilities) 1,924,793.30 1.32
Total 145,857,604.75 100.00

FUND PARTNERS CSOB Global Growth Plus 1
Statement of investments and other net assets (in CZK) as at 30th September 2010
The accompanying notes are an integral part of these financial statements.
119
Currency Number / nominal value
Description Cost Market value % of total net assets
Investments in securities
Transferable securities admitted to an official stock exchange listing
Bonds
CZK 11,200,000 Amethyst Structured Fin Plc FRN Ser 2007-15 Tr 1 07/10.07.15 11,172,080.73 11,210,484.32 8.85 CZK 11,300,000 Beechwood Structured Fin Plc FRN Ser 2007-15 07/10.07.15 11,271,831.45 11,211,137.93 8.85 CZK 11,250,000 Brookfields Capital Plc FRN Ser 2007-15 Tr 1 07/10.07.15 11,221,956.09 11,195,281.13 8.84 CZK 11,250,000 Eperon Finance Plc FRN Ser 2007-15 Tr 1 07/10.07.15 11,221,956.09 11,198,656.13 8.84 CZK 5,650,000 Espaccio Securities Plc FRN Ser 2007-15 Tr 1 07/10.07.15 5,635,915.72 5,615,738.97 4.43 CZK 5,650,000 Greenstreet Struc Fin Prod Plc FRN Ser 2007-15 07/10.07.15 5,635,915.72 5,613,478.97 4.43 CZK 5,650,000 Nimrod Capital Plc FRN Ser 2007-15 Tr 1 07/10.07.15 5,635,915.72 5,608,958.97 4.43 CZK 5,650,000 Opal Financial Products Plc FRN Ser 2007-15 Tr 1 07/10.07.15 5,635,915.72 5,592,573.97 4.41 CZK 5,650,000 Profile Finance Plc FRN Ser 2007-15 Tr 1 07/10.07.15 5,635,915.72 5,573,928.97 4.40 CZK 5,650,000 Recolte Securities Plc FRN Ser 2007-15 Tr 1 07/10.07.15 5,635,915.72 5,584,663.97 4.41 CZK 5,600,000 Silverstate Fin Inv Plc FRN Ser 2007-15 Tr 1 07/10.07.15 5,586,040.36 5,571,082.16 4.40 CZK 5,650,000 Vespucci Strut Fin Prod Plc FRN Ser 2007-15 Tr 1 07/10.07.15 5,635,915.72 5,599,918.97 4.42 CZK 5,650,000 Vigado Capital Plc FRN Ser 2007-15 Tr 1 07/10.07.15 5,635,915.72 5,612,348.97 4.43 CZK 5,600,000 Voyce Investments Plc FRN Ser 2007-15 Tr 1 07/10.07.15 5,586,040.36 5,578,922.16 4.40 CZK 5,650,000 Waterford Cap Investments Plc FRN Ser 2007-15 07/10.07.15 5,635,915.72 5,580,708.97 4.40 CZK 5,650,000 Waves Fin Inv Plc FRN Ser 2007-15 Tr 1 07/10.07.15 5,635,915.72 5,611,783.97 4.43
Total investments in securities 112,419,062.28 111,959,668.53 88.37
Cash at banks 12,275,801.46 9.69
Other net assets/(liabilities) 2,464,098.81 1.94
Total 126,699,568.80 100.00

FUND PARTNERS CSOB Global Growth Plus 2
Statement of investments and other net assets (in CZK) as at 30th September 2010
The accompanying notes are an integral part of these financial statements.
120
Currency Number / nominal value
Description Cost Market value % of total net assets
Investments in securities
Transferable securities admitted to an official stock exchange listing
Bonds
CZK 15,550,000 Amethyst Structured Fin Plc FRN Ser 2007-15 Tr 1 07/10.07.15 15,491,294.62 15,564,556.36 8.57 CZK 15,650,000 Beechwood Structured Fin Plc FRN Ser 2007-15 07/10.07.15 15,590,917.09 15,526,929.97 8.55 CZK 15,600,000 Brookfields Capital Plc FRN Ser 2007-15 Tr 1 07/10.07.15 15,541,105.86 15,524,123.16 8.54 CZK 15,600,000 Eperon Finance Plc FRN Ser 2007-15 Tr 1 07/10.07.15 15,541,105.86 15,528,803.16 8.55 CZK 7,800,000 Espaccio Securities Plc FRN Ser 2007-15 Tr 1 07/10.07.15 7,770,552.92 7,752,701.58 4.27 CZK 7,800,000 Greenstreet Struc Fin Prod Plc FRN Ser 2007-15 07/10.07.15 7,770,552.92 7,749,581.58 4.26 CZK 7,800,000 Nimrod Capital Plc FRN Ser 2007-15 Tr 1 07/10.07.15 7,770,552.92 7,743,341.58 4.26 CZK 7,800,000 Opal Financial Products Plc FRN Ser 2007-15 Tr 1 07/10.07.15 7,770,552.92 7,720,721.58 4.25 CZK 7,850,000 Profile Finance Plc FRN Ser 2007-15 Tr 1 07/10.07.15 7,820,364.16 7,744,308.38 4.26 CZK 7,850,000 Recolte Securities Plc FRN Ser 2007-15 Tr 1 07/10.07.15 7,820,364.16 7,759,223.38 4.27 CZK 7,800,000 Silverstate Fin Inv Plc FRN Ser 2007-15 Tr 1 07/10.07.15 7,770,552.92 7,759,721.58 4.27 CZK 7,800,000 Vespucci Strut Fin Prod Plc FRN Ser 2007-15 Tr 1 07/10.07.15 7,770,552.92 7,730,861.58 4.25 CZK 7,800,000 Vigado Capital Plc FRN Ser 2007-15 Tr 1 07/10.07.15 7,770,552.92 7,748,021.58 4.26 CZK 7,800,000 Voyce Investments Plc FRN Ser 2007-15 Tr 1 07/10.07.15 7,770,552.92 7,770,641.58 4.28 CZK 7,850,000 Waterford Cap Investments Plc FRN Ser 2007-15 07/10.07.15 7,820,364.16 7,753,728.38 4.27 CZK 7,800,000 Waves Fin Inv Plc FRN Ser 2007-15 Tr 1 07/10.07.15 7,770,552.92 7,747,241.58 4.26
Total investments in securities 155,560,492.19 155,124,507.01 85.37
Cash at banks 17,013,944.79 9.36
Other net assets/(liabilities) 9,565,336.49 5.27
Total 181,703,788.29 100.00

FUND PARTNERS CSOB Global Growth Plus 3
Statement of investments and other net assets (in CZK) as at 30th September 2010
The accompanying notes are an integral part of these financial statements.
121
Currency Number / nominal value
Description Cost Market value % of total net assets
Investments in securities
Transferable securities admitted to an official stock exchange listing
Bonds
CZK 13,300,000 Amethyst Structured Fin Plc FRN Ser 2007-15 Tr 1 07/10.07.15 13,271,608.16 13,312,450.13 8.65 CZK 13,350,000 Beechwood Structured Fin Plc FRN Ser 2007-15 07/10.07.15 13,321,501.43 13,245,016.93 8.61 CZK 13,350,000 Brookfields Capital Plc FRN Ser 2007-15 Tr 1 07/10.07.15 13,321,501.43 13,285,066.93 8.64 CZK 13,350,000 Eperon Finance Plc FRN Ser 2007-15 Tr 1 07/10.07.15 13,321,501.43 13,289,071.93 8.64 CZK 6,700,000 Espaccio Securities Plc FRN Ser 2007-15 Tr 1 07/10.07.15 6,685,697.34 6,659,371.87 4.33 CZK 6,700,000 Greenstreet Struc Fin Prod Plc FRN Ser 2007-15 07/10.07.15 6,685,697.34 6,656,691.87 4.33 CZK 6,650,000 Nimrod Capital Plc FRN Ser 2007-15 Tr 1 07/10.07.15 6,635,804.08 6,601,695.07 4.29 CZK 6,700,000 Opal Financial Products Plc FRN Ser 2007-15 Tr 1 07/10.07.15 6,685,697.34 6,631,901.87 4.31 CZK 6,700,000 Profile Finance Plc FRN Ser 2007-15 Tr 1 07/10.07.15 6,685,697.34 6,609,791.87 4.30 CZK 6,700,000 Recolte Securities Plc FRN Ser 2007-15 Tr 1 07/10.07.15 6,685,697.34 6,622,521.87 4.31 CZK 6,650,000 Silverstate Fin Inv Plc FRN Ser 2007-15 Tr 1 07/10.07.15 6,635,804.08 6,615,660.07 4.30 CZK 6,650,000 Vespucci Strut Fin Prod Plc FRN Ser 2007-15 Tr 1 07/10.07.15 6,635,804.08 6,591,055.07 4.29 CZK 6,700,000 Vigado Capital Plc FRN Ser 2007-15 Tr 1 07/10.07.15 6,685,697.34 6,655,351.87 4.33 CZK 6,650,000 Voyce Investments Plc FRN Ser 2007-15 Tr 1 07/10.07.15 6,635,804.08 6,624,970.07 4.31 CZK 6,700,000 Waterford Cap Investments Plc FRN Ser 2007-15 07/10.07.15 6,685,697.34 6,617,831.87 4.30 CZK 6,650,000 Waves Fin Inv Plc FRN Ser 2007-15 Tr 1 07/10.07.15 6,635,804.08 6,605,020.07 4.29
Total investments in securities 133,215,014.23 132,623,469.36 86.23
Cash at banks 15,086,677.64 9.81
Other net assets/(liabilities) 6,099,300.57 3.96
Total 153,809,447.57 100.00
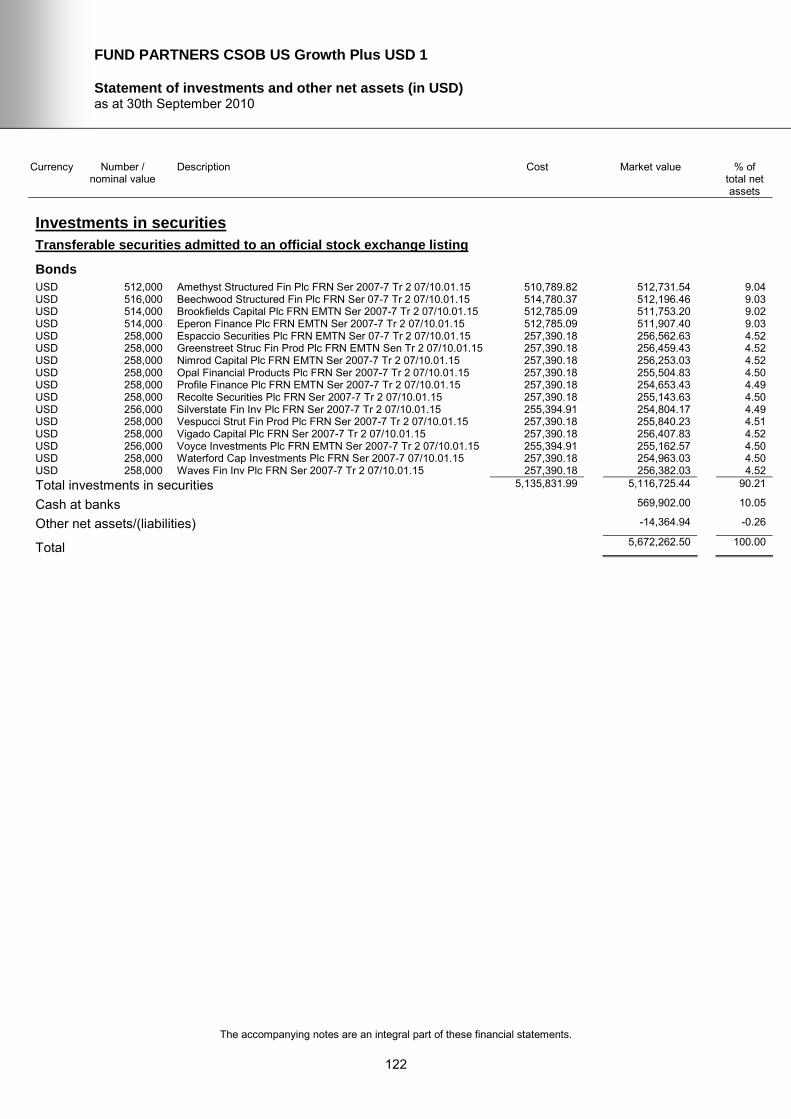
FUND PARTNERS CSOB US Growth Plus USD 1
Statement of investments and other net assets (in USD) as at 30th September 2010
The accompanying notes are an integral part of these financial statements.
122
Currency Number / nominal value
Description Cost Market value % of total net assets
Investments in securities
Transferable securities admitted to an official stock exchange listing
Bonds
USD 512,000 Amethyst Structured Fin Plc FRN Ser 2007-7 Tr 2 07/10.01.15 510,789.82 512,731.54 9.04 USD 516,000 Beechwood Structured Fin Plc FRN Ser 07-7 Tr 2 07/10.01.15 514,780.37 512,196.46 9.03 USD 514,000 Brookfields Capital Plc FRN EMTN Ser 2007-7 Tr 2 07/10.01.15 512,785.09 511,753.20 9.02 USD 514,000 Eperon Finance Plc FRN EMTN Ser 2007-7 Tr 2 07/10.01.15 512,785.09 511,907.40 9.03 USD 258,000 Espaccio Securities Plc FRN EMTN Ser 07-7 Tr 2 07/10.01.15 257,390.18 256,562.63 4.52 USD 258,000 Greenstreet Struc Fin Prod Plc FRN EMTN Sen Tr 2 07/10.01.15 257,390.18 256,459.43 4.52 USD 258,000 Nimrod Capital Plc FRN EMTN Ser 2007-7 Tr 2 07/10.01.15 257,390.18 256,253.03 4.52 USD 258,000 Opal Financial Products Plc FRN Ser 2007-7 Tr 2 07/10.01.15 257,390.18 255,504.83 4.50 USD 258,000 Profile Finance Plc FRN EMTN Ser 2007-7 Tr 2 07/10.01.15 257,390.18 254,653.43 4.49 USD 258,000 Recolte Securities Plc FRN Ser 2007-7 Tr 2 07/10.01.15 257,390.18 255,143.63 4.50 USD 256,000 Silverstate Fin Inv Plc FRN Ser 2007-7 Tr 2 07/10.01.15 255,394.91 254,804.17 4.49 USD 258,000 Vespucci Strut Fin Prod Plc FRN Ser 2007-7 Tr 2 07/10.01.15 257,390.18 255,840.23 4.51 USD 258,000 Vigado Capital Plc FRN Ser 2007-7 Tr 2 07/10.01.15 257,390.18 256,407.83 4.52 USD 256,000 Voyce Investments Plc FRN EMTN Ser 2007-7 Tr 2 07/10.01.15 255,394.91 255,162.57 4.50 USD 258,000 Waterford Cap Investments Plc FRN Ser 2007-7 07/10.01.15 257,390.18 254,963.03 4.50 USD 258,000 Waves Fin Inv Plc FRN Ser 2007-7 Tr 2 07/10.01.15 257,390.18 256,382.03 4.52
Total investments in securities 5,135,831.99 5,116,725.44 90.21
Cash at banks 569,902.00 10.05
Other net assets/(liabilities) -14,364.94 -0.26
Total 5,672,262.50 100.00

FUND PARTNERS CSOB World Growth Plus EUR 1
Statement of investments and other net assets (in EUR) as at 30th September 2010
The accompanying notes are an integral part of these financial statements.
123
Currency Number / nominal value
Description Cost Market value % of total net assets
Investments in securities
Transferable securities admitted to an official stock exchange listing
Bonds
EUR 647,000 Amethyst Finance Plc FRN Ser 2006-3 Tr 2 06/23.10.14 644,984.64 647,268.96 7.06 EUR 647,000 Beechwood Structured Fin Plc FRN Ser 2006-3 Tr 2 06/23.10.14 645,036.24 641,575.36 6.99 EUR 646,000 Brookfields Capital Plc FRN EMTN Ser 2006-3 Tr 2 06/23.10.14 644,554.06 642,521.74 7.00 EUR 647,000 Eperon Finance Plc FRN EMTN Ser 2006-3 Tr 2 06/23.10.14 645,191.04 643,710.46 7.02 EUR 323,000 Espaccio Securities Plc FRN EMTN Ser 2006-3 Tr 2 06/23.10.14 322,188.84 320,873.27 3.50 EUR 323,000 Greenstreet Struc Fin Prod Plc FRN Ser 2006-3 06/23.10.14 322,188.84 320,744.07 3.50 EUR 400,000 Infinity Finance Plc FRN EMTN Ser 1004 04/23.10.13 389,531.68 391,726.28 4.27 EUR 323,000 Nimrod Capital Plc FRN EMTN Ser 2006-3 Tr 2 06/23.10.14 322,188.84 320,485.67 3.49 EUR 324,000 Opal Financial Products Plc FRN EMTN Ser 2006-3 06/23.10.14 323,186.33 320,538.29 3.49 EUR 323,000 Profile Finance Plc FRN EMTN Ser 2006-3 Tr 2 06/23.10.14 322,188.84 318,483.07 3.47 EUR 324,000 Recolte Securities Plc FRN EMTN Ser 2006-3 Tr 2 06/23.10.14 323,186.33 320,084.69 3.49 EUR 400,000 Sierra Finance Plc FRN EMTN Ser 1004 04/23.10.13 382,611.68 385,566.28 4.20 EUR 322,000 Silverstate Fin Inv Plc FRN EMTN Ser 2006-3 Tr 2 06/23.10.14 321,191.35 320,169.66 3.49 EUR 400,000 Venice Finance Plc FRN EMTN Ser 1004 04/23.10.13 383,771.68 386,006.28 4.21 EUR 323,000 Vespucci Strut Fin Prod Plc FRN Ser 2006-3 Tr 2 06/23.10.14 322,188.84 319,968.87 3.49 EUR 323,000 Vigado Capital Plc FRN EMTN Ser 2006-3 Tr 2 06/23.10.14 322,188.84 320,679.47 3.50 EUR 323,000 Voyce Investments Plc FRN EMTN Ser 2006-3 Tr 2 06/23.10.14 322,188.84 321,616.17 3.51 EUR 323,000 Waterford Cap Investments Plc FRN Ser 2006-3 06/23.10.14 322,188.84 318,870.67 3.48 EUR 323,000 Waves Fin Inv Plc FRN EMTN Ser 2006-3 06/23.10.14 322,188.84 320,647.17 3.49 EUR 400,000 Zulma Finance Plc FRN EMTN Ser 1004 04/23.10.13 391,571.68 393,926.28 4.29
Total bonds 7,994,516.27 7,975,462.71 86.94
Other transferable securities
Bonds
EUR 371,000 D-Star Finance Plc FRN C Ser 2008-4 AprOct 09/10.03.14 371,639.90 372,415.44 4.06
Total bonds 371,639.90 372,415.44 4.06
Total investments in securities 8,366,156.17 8,347,878.15 91.00
Cash at banks 814,197.41 8.88
Other net assets/(liabilities) 11,328.71 0.12
Total 9,173,404.27 100.00

FUND PARTNERS CSOB Central Europe Winners 2
Statement of investments and other net assets (in CZK) as at 30th September 2010
The accompanying notes are an integral part of these financial statements.
124
Currency Number / nominal value
Description Cost Market value % of total net assets
Investments in securities
Transferable securities admitted to an official stock exchange listing
Bonds
CZK 14,650,000 Amethyst Structured Fin Plc FRN Ser 2007-15 Tr 1 07/10.07.15 14,608,142.15 14,663,713.87 8.79 CZK 14,750,000 Beechwood Structured Fin Plc FRN Ser 2007-15 07/10.07.15 14,707,856.43 14,634,007.48 8.77 CZK 14,700,000 Brookfields Capital Plc FRN Ser 2007-15 Tr 1 07/10.07.15 14,657,999.29 14,628,500.67 8.77 CZK 14,700,000 Eperon Finance Plc FRN Ser 2007-15 Tr 1 07/10.07.15 14,657,999.29 14,632,910.67 8.77 CZK 7,350,000 Espaccio Securities Plc FRN Ser 2007-15 Tr 1 07/10.07.15 7,328,999.64 7,305,430.34 4.38 CZK 7,350,000 Greenstreet Struc Fin Prod Plc FRN Ser 2007-15 07/10.07.15 7,328,999.64 7,302,490.34 4.38 CZK 7,350,000 Nimrod Capital Plc FRN Ser 2007-15 Tr 1 07/10.07.15 7,328,999.64 7,296,610.34 4.37 CZK 7,350,000 Opal Financial Products Plc FRN Ser 2007-15 Tr 1 07/10.07.15 7,328,999.64 7,275,295.34 4.36 CZK 7,400,000 Profile Finance Plc FRN Ser 2007-15 Tr 1 07/10.07.15 7,378,856.78 7,300,367.14 4.37 CZK 7,400,000 Recolte Securities Plc FRN Ser 2007-15 Tr 1 07/10.07.15 7,378,856.78 7,314,427.14 4.38 CZK 7,350,000 Silverstate Fin Inv Plc FRN Ser 2007-15 Tr 1 07/10.07.15 7,328,999.64 7,312,045.34 4.38 CZK 7,350,000 Vespucci Strut Fin Prod Plc FRN Ser 2007-15 Tr 1 07/10.07.15 7,328,999.64 7,284,850.34 4.36 CZK 7,400,000 Vigado Capital Plc FRN Ser 2007-15 Tr 1 07/10.07.15 7,378,856.78 7,350,687.14 4.40 CZK 7,350,000 Voyce Investments Plc FRN Ser 2007-15 Tr 1 07/10.07.15 7,328,999.64 7,322,335.34 4.39 CZK 7,400,000 Waterford Cap Investments Plc FRN Ser 2007-15 07/10.07.15 7,378,856.78 7,309,247.14 4.38 CZK 7,350,000 Waves Fin Inv Plc FRN Ser 2007-15 Tr 1 07/10.07.15 7,328,999.64 7,300,285.34 4.37
Total investments in securities 146,779,421.40 146,233,203.97 87.62
Cash at banks 15,891,242.83 9.52
Other net assets/(liabilities) 4,769,426.92 2.86
Total 166,893,873.72 100.00

FUND PARTNERS CSOB China Winners 1
Statement of investments and other net assets (in CZK) as at 30th September 2010
The accompanying notes are an integral part of these financial statements.
125
Currency Number / nominal value
Description Cost Market value % of total net assets
Investments in securities
Transferable securities admitted to an official stock exchange listing
Bonds
CZK 35,300,000 Amethyst Structured Fin Plc FRN Ser 2007-15 Tr 1 07/10.07.15 35,177,257.51 35,333,044.33 8.82 CZK 35,550,000 Beechwood Structured Fin Plc FRN Ser 2007-15 07/10.07.15 35,426,388.23 35,270,438.36 8.80 CZK 35,450,000 Brookfields Capital Plc FRN Ser 2007-15 Tr 1 07/10.07.15 35,326,735.94 35,277,574.75 8.80 CZK 35,500,000 Eperon Finance Plc FRN Ser 2007-15 Tr 1 07/10.07.15 35,376,562.08 35,337,981.55 8.82 CZK 17,800,000 Espaccio Securities Plc FRN Ser 2007-15 Tr 1 07/10.07.15 17,738,107.18 17,692,062.58 4.42 CZK 17,800,000 Greenstreet Struc Fin Prod Plc FRN Ser 2007-15 07/10.07.15 17,738,107.18 17,684,942.58 4.41 CZK 17,750,000 Nimrod Capital Plc FRN Ser 2007-15 Tr 1 07/10.07.15 17,688,281.03 17,621,065.77 4.40 CZK 17,800,000 Opal Financial Products Plc FRN Ser 2007-15 Tr 1 07/10.07.15 17,738,107.18 17,619,082.58 4.40 CZK 17,850,000 Profile Finance Plc FRN Ser 2007-15 Tr 1 07/10.07.15 17,787,933.32 17,609,669.38 4.39 CZK 17,800,000 Recolte Securities Plc FRN Ser 2007-15 Tr 1 07/10.07.15 17,738,107.18 17,594,162.58 4.39 CZK 17,700,000 Silverstate Fin Inv Plc FRN Ser 2007-15 Tr 1 07/10.07.15 17,638,454.89 17,608,598.97 4.39 CZK 17,750,000 Vespucci Strut Fin Prod Plc FRN Ser 2007-15 Tr 1 07/10.07.15 17,688,281.03 17,592,665.77 4.39 CZK 17,800,000 Vigado Capital Plc FRN Ser 2007-15 Tr 1 07/10.07.15 17,738,107.18 17,681,382.58 4.41 CZK 17,700,000 Voyce Investments Plc FRN Ser 2007-15 Tr 1 07/10.07.15 17,638,454.89 17,633,378.97 4.40 CZK 17,800,000 Waterford Cap Investments Plc FRN Ser 2007-15 07/10.07.15 17,738,107.18 17,581,702.58 4.39 CZK 17,750,000 Waves Fin Inv Plc FRN Ser 2007-15 Tr 1 07/10.07.15 17,688,281.03 17,629,940.77 4.40
Total investments in securities 353,865,273.03 352,767,694.10 88.03
Cash at banks 35,134,768.96 8.77
Other net assets/(liabilities) 12,820,048.41 3.20
Total 400,722,511.47 100.00

FUND PARTNERS CSOB Asian Growth 2
Statement of investments and other net assets (in CZK) as at 30th September 2010
The accompanying notes are an integral part of these financial statements.
126
Currency Number / nominal value
Description Cost Market value % of total net assets
Investments in securities
Transferable securities admitted to an official stock exchange listing
Bonds
CZK 23,600,000 Amethyst Structured Fin Plc FRN Ser 2007-15 Tr 1 07/10.07.15 23,556,240.32 23,622,091.96 8.72 CZK 23,750,000 Beechwood Structured Fin Plc FRN Ser 2007-15 07/10.07.15 23,705,962.19 23,563,232.38 8.70 CZK 23,700,000 Brookfields Capital Plc FRN Ser 2007-15 Tr 1 07/10.07.15 23,656,054.90 23,584,725.57 8.71 CZK 23,750,000 Eperon Finance Plc FRN Ser 2007-15 Tr 1 07/10.07.15 23,705,962.19 23,641,607.38 8.73 CZK 11,900,000 Espaccio Securities Plc FRN Ser 2007-15 Tr 1 07/10.07.15 11,877,934.74 11,827,839.59 4.37 CZK 11,900,000 Greenstreet Struc Fin Prod Plc FRN Ser 2007-15 07/10.07.15 11,877,934.74 11,823,079.59 4.37 CZK 11,900,000 Nimrod Capital Plc FRN Ser 2007-15 Tr 1 07/10.07.15 11,877,934.74 11,813,559.59 4.36 CZK 11,900,000 Opal Financial Products Plc FRN Ser 2007-15 Tr 1 07/10.07.15 11,877,934.74 11,779,049.59 4.35 CZK 11,950,000 Profile Finance Plc FRN Ser 2007-15 Tr 1 07/10.07.15 11,927,842.03 11,789,106.40 4.35 CZK 11,900,000 Recolte Securities Plc FRN Ser 2007-15 Tr 1 07/10.07.15 11,877,934.74 11,762,389.59 4.34 CZK 11,850,000 Silverstate Fin Inv Plc FRN Ser 2007-15 Tr 1 07/10.07.15 11,828,027.45 11,788,807.79 4.35 CZK 11,900,000 Vespucci Strut Fin Prod Plc FRN Ser 2007-15 Tr 1 07/10.07.15 11,877,934.74 11,794,519.59 4.36 CZK 11,900,000 Vigado Capital Plc FRN Ser 2007-15 Tr 1 07/10.07.15 11,877,934.74 11,820,699.59 4.37 CZK 11,850,000 Voyce Investments Plc FRN Ser 2007-15 Tr 1 07/10.07.15 11,828,027.45 11,805,397.79 4.36 CZK 11,900,000 Waterford Cap Investments Plc FRN Ser 2007-15 07/10.07.15 11,877,934.74 11,754,059.59 4.34 CZK 11,850,000 Waves Fin Inv Plc FRN Ser 2007-15 Tr 1 07/10.07.15 11,828,027.45 11,769,847.79 4.35
Total investments in securities 237,059,621.90 235,940,013.78 87.13
Cash at banks 23,850,581.30 8.81
Other net assets/(liabilities) 11,008,092.67 4.06
Total 270,798,687.75 100.00

FUND PARTNERS Warta Financials 1
Statement of investments and other net assets (in PLN) as at 30th September 2010
The accompanying notes are an integral part of these financial statements.
127
Currency Number / nominal value
Description Cost Market value % of total net assets
Investments in securities
Transferable securities admitted to an official stock exchange listing
Bonds
PLN 4,690,000 Amethyst Structured Fin Plc FRN Ser 2007-16 Tr 1 07/10.07.15 4,675,684.67 4,693,498.74 9.54 PLN 4,720,000 Beechwood Structured Fin Plc FRN Ser 2007-16 07/10.07.15 4,705,593.10 4,681,985.12 9.51 PLN 4,710,000 Brookfields Capital Plc FRN Ser 2007-16 Tr 1 07/10.07.15 4,695,623.62 4,686,195.66 9.52 PLN 4,715,000 Eperon Finance Plc FRN Ser 2007-16 Tr 1 07/10.07.15 4,700,608.36 4,692,584.89 9.53 PLN 2,365,000 Espaccio Securities Plc FRN Ser 2007-16 Tr 1 07/10.07.15 2,357,781.29 2,350,209.29 4.77 PLN 2,365,000 Greenstreet Struc Fin Prod Plc FRN Ser 2007-16 07/10.07.15 2,357,781.29 2,349,263.29 4.77 PLN 2,360,000 Nimrod Capital Plc FRN Ser 2007-16 Tr 1 07/10.07.15 2,352,796.55 2,342,408.56 4.76 PLN 2,365,000 Opal Financial Products Plc FRN Ser 2007-16 Tr 1 07/10.07.15 2,357,781.29 2,340,512.79 4.76 PLN 2,375,000 Profile Finance Plc FRN Ser 2007-16 Tr 1 07/10.07.15 2,367,750.77 2,342,571.75 4.76 PLN 2,365,000 Recolte Securities Plc FRN Ser 2007-16 Tr 1 07/10.07.15 2,357,781.29 2,337,201.79 4.75 PLN 2,355,000 Silverstate Fin Inv Plc FRN Ser 2007-16 Tr 1 07/10.07.15 2,347,811.81 2,342,391.33 4.76 PLN 2,360,000 Vespucci Strut Fin Prod Plc FRN Ser 2007-16 07/10.07.15 2,352,796.55 2,338,632.56 4.75 PLN 2,365,000 Vigado Capital Plc FRN Ser 2007-16 Tr 1 07/10.07.15 2,357,781.29 2,348,790.29 4.77 PLN 2,355,000 Voyce Investments Plc FRN Ser 2007-16 Tr 1 07/10.07.15 2,347,811.81 2,345,688.33 4.77 PLN 2,365,000 Waterford Cap Investments Plc FRN Ser 2007-16 07/10.07.15 2,357,781.29 2,335,546.29 4.75 PLN 2,360,000 Waves Fin Investments Plc FRN Ser 2007-16 Tr 1 07/10.07.15 2,352,796.55 2,343,588.56 4.76
Total investments in securities 47,045,961.53 46,871,069.24 95.23
Cash at banks 4,284,573.27 8.71
Other net assets/(liabilities) -1,936,288.91 -3.94
Total 49,219,353.60 100.00

FUND PARTNERS Warta Pharma 1
Statement of investments and other net assets (in PLN) as at 30th September 2010
The accompanying notes are an integral part of these financial statements.
128
Currency Number / nominal value
Description Cost Market value % of total net assets
Investments in securities
Transferable securities admitted to an official stock exchange listing
Bonds
PLN 2,925,000 Amethyst Structured Fin Plc FRN Ser 2007-16 Tr 1 07/10.07.15 2,925,168.19 2,927,182.05 9.13 PLN 2,940,000 Beechwood Structured Fin Plc FRN Ser 2007-16 07/10.07.15 2,940,169.05 2,916,321.24 9.10 PLN 2,935,000 Brookfields Capital Plc FRN Ser 2007-16 Tr 1 07/10.07.15 2,935,168.76 2,920,166.51 9.11 PLN 2,940,000 Eperon Finance Plc FRN Ser 2007-16 Tr 1 07/10.07.15 2,940,169.05 2,926,023.24 9.13 PLN 1,470,000 Espaccio Securities Plc FRN Ser 2007-16 Tr 1 07/10.07.15 1,470,084.52 1,460,806.62 4.56 PLN 1,470,000 Greenstreet Struc Fin Prod Plc FRN Ser 2007-16 07/10.07.15 1,470,084.52 1,460,218.62 4.56 PLN 1,470,000 Nimrod Capital Plc FRN Ser 2007-16 Tr 1 07/10.07.15 1,470,084.52 1,459,042.62 4.55 PLN 1,475,000 Opal Financial Products Plc FRN Ser 2007-16 Tr 1 07/10.07.15 1,475,084.81 1,459,727.85 4.55 PLN 1,480,000 Profile Finance Plc FRN Ser 2007-16 Tr 1 07/10.07.15 1,480,085.10 1,459,792.08 4.56 PLN 1,475,000 Recolte Securities Plc FRN Ser 2007-16 Tr 1 07/10.07.15 1,475,084.81 1,457,662.85 4.55 PLN 1,465,000 Silverstate Fin Inv Plc FRN Ser 2007-16 Tr 1 07/10.07.15 1,465,084.24 1,457,156.39 4.55 PLN 1,470,000 Vespucci Strut Fin Prod Plc FRN Ser 2007-16 07/10.07.15 1,470,084.52 1,456,690.62 4.55 PLN 1,475,000 Vigado Capital Plc FRN Ser 2007-16 Tr 1 07/10.07.15 1,475,084.81 1,464,890.35 4.57 PLN 1,465,000 Voyce Investments Plc FRN Ser 2007-16 Tr 1 07/10.07.15 1,465,084.24 1,459,207.39 4.55 PLN 1,475,000 Waterford Cap Investments Plc FRN Ser 2007-16 07/10.07.15 1,475,084.81 1,456,630.35 4.55 PLN 1,470,000 Waves Fin Investments Plc FRN Ser 2007-16 Tr 1 07/10.07.15 1,470,084.52 1,459,777.62 4.55
Total investments in securities 29,401,690.47 29,201,296.40 91.12
Cash at banks 2,890,803.16 9.02
Other net assets/(liabilities) -46,433.28 -0.14
Total 32,045,666.28 100.00

FUND PARTNERS CSOB Global Growth Plus 4
Statement of investments and other net assets (in CZK) as at 30th September 2010
The accompanying notes are an integral part of these financial statements.
129
Currency Number / nominal value
Description Cost Market value % of total net assets
Investments in securities
Transferable securities admitted to an official stock exchange listing
Bonds
CZK 16,000,000 Amethyst Structured Fin Plc FRN Ser 2007-15 Tr 1 07/10.07.15 15,936,950.67 16,014,977.60 8.55 CZK 16,100,000 Beechwood Structured Fin Plc FRN Ser 2007-15 07/10.07.15 16,036,556.61 15,973,391.21 8.53 CZK 16,050,000 Brookfields Capital Plc FRN Ser 2007-15 Tr 1 07/10.07.15 15,986,753.64 15,971,934.40 8.53 CZK 16,100,000 Eperon Finance Plc FRN Ser 2007-15 Tr 1 07/10.07.15 16,036,556.61 16,026,521.21 8.56 CZK 8,050,000 Espaccio Securities Plc FRN Ser 2007-15 Tr 1 07/10.07.15 8,018,278.30 8,001,185.60 4.27 CZK 8,050,000 Greenstreet Struc Fin Prod Plc FRN Ser 2007-15 07/10.07.15 8,018,278.30 7,997,965.60 4.27 CZK 8,050,000 Nimrod Capital Plc FRN Ser 2007-15 Tr 1 07/10.07.15 8,018,278.30 7,991,525.60 4.27 CZK 8,050,000 Opal Financial Products Plc FRN Ser 2007-15 Tr 1 07/10.07.15 8,018,278.30 7,968,180.60 4.25 CZK 8,100,000 Profile Finance Plc FRN Ser 2007-15 Tr 1 07/10.07.15 8,068,081.27 7,990,942.41 4.27 CZK 8,050,000 Recolte Securities Plc FRN Ser 2007-15 Tr 1 07/10.07.15 8,018,278.30 7,956,910.60 4.25 CZK 8,000,000 Silverstate Fin Inv Plc FRN Ser 2007-15 Tr 1 07/10.07.15 7,968,475.32 7,958,688.80 4.25 CZK 8,050,000 Vespucci Strut Fin Prod Plc FRN Ser 2007-15 Tr 1 07/10.07.15 8,018,278.30 7,978,645.60 4.26 CZK 8,050,000 Vigado Capital Plc FRN Ser 2007-15 Tr 1 07/10.07.15 8,018,278.30 7,996,355.60 4.27 CZK 8,050,000 Voyce Investments Plc FRN Ser 2007-15 Tr 1 07/10.07.15 8,018,278.30 8,019,700.60 4.28 CZK 8,050,000 Waterford Cap Investments Plc FRN Ser 2007-15 07/10.07.15 8,018,278.30 7,951,275.60 4.25 CZK 8,050,000 Waves Fin Inv Plc FRN Ser 2007-15 Tr 1 07/10.07.15 8,018,278.30 7,995,550.60 4.27
Total investments in securities 160,216,157.12 159,793,751.63 85.33
Cash at banks 18,289,182.67 9.77
Other net assets/(liabilities) 9,182,661.76 4.90
Total 187,265,596.06 100.00
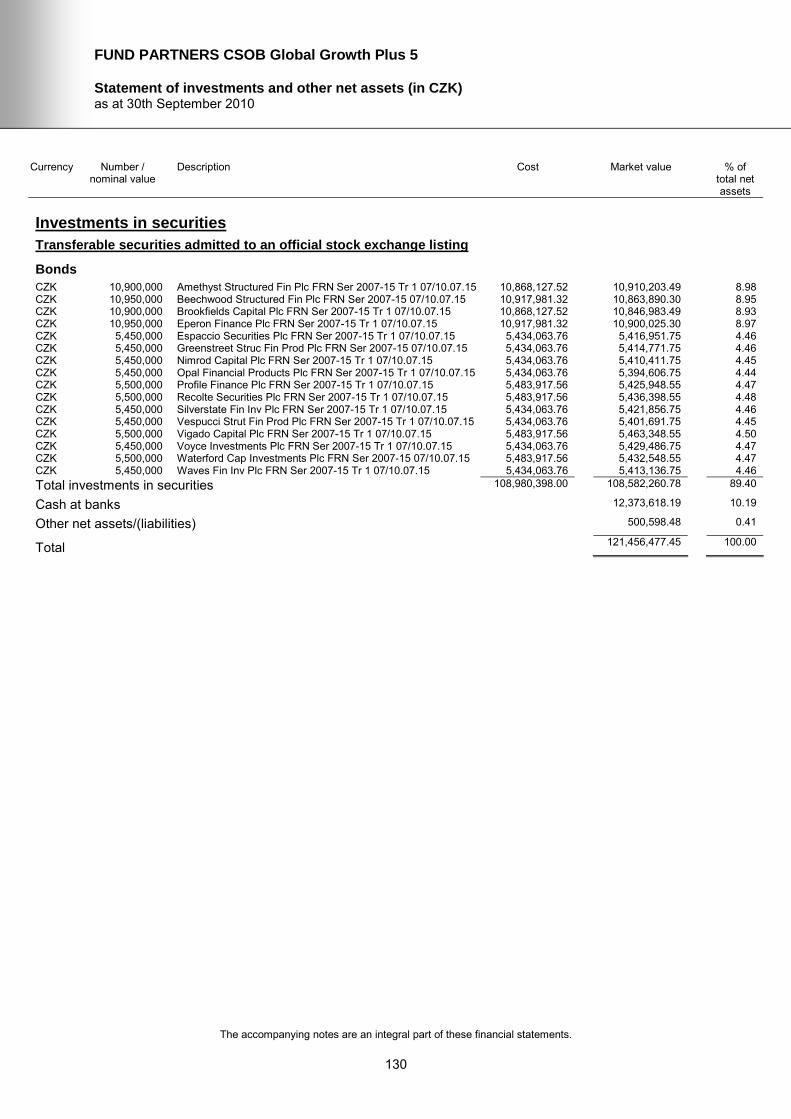
FUND PARTNERS CSOB Global Growth Plus 5
Statement of investments and other net assets (in CZK) as at 30th September 2010
The accompanying notes are an integral part of these financial statements.
130
Currency Number / nominal value
Description Cost Market value % of total net assets
Investments in securities
Transferable securities admitted to an official stock exchange listing
Bonds
CZK 10,900,000 Amethyst Structured Fin Plc FRN Ser 2007-15 Tr 1 07/10.07.15 10,868,127.52 10,910,203.49 8.98 CZK 10,950,000 Beechwood Structured Fin Plc FRN Ser 2007-15 07/10.07.15 10,917,981.32 10,863,890.30 8.95 CZK 10,900,000 Brookfields Capital Plc FRN Ser 2007-15 Tr 1 07/10.07.15 10,868,127.52 10,846,983.49 8.93 CZK 10,950,000 Eperon Finance Plc FRN Ser 2007-15 Tr 1 07/10.07.15 10,917,981.32 10,900,025.30 8.97 CZK 5,450,000 Espaccio Securities Plc FRN Ser 2007-15 Tr 1 07/10.07.15 5,434,063.76 5,416,951.75 4.46 CZK 5,450,000 Greenstreet Struc Fin Prod Plc FRN Ser 2007-15 07/10.07.15 5,434,063.76 5,414,771.75 4.46 CZK 5,450,000 Nimrod Capital Plc FRN Ser 2007-15 Tr 1 07/10.07.15 5,434,063.76 5,410,411.75 4.45 CZK 5,450,000 Opal Financial Products Plc FRN Ser 2007-15 Tr 1 07/10.07.15 5,434,063.76 5,394,606.75 4.44 CZK 5,500,000 Profile Finance Plc FRN Ser 2007-15 Tr 1 07/10.07.15 5,483,917.56 5,425,948.55 4.47 CZK 5,500,000 Recolte Securities Plc FRN Ser 2007-15 Tr 1 07/10.07.15 5,483,917.56 5,436,398.55 4.48 CZK 5,450,000 Silverstate Fin Inv Plc FRN Ser 2007-15 Tr 1 07/10.07.15 5,434,063.76 5,421,856.75 4.46 CZK 5,450,000 Vespucci Strut Fin Prod Plc FRN Ser 2007-15 Tr 1 07/10.07.15 5,434,063.76 5,401,691.75 4.45 CZK 5,500,000 Vigado Capital Plc FRN Ser 2007-15 Tr 1 07/10.07.15 5,483,917.56 5,463,348.55 4.50 CZK 5,450,000 Voyce Investments Plc FRN Ser 2007-15 Tr 1 07/10.07.15 5,434,063.76 5,429,486.75 4.47 CZK 5,500,000 Waterford Cap Investments Plc FRN Ser 2007-15 07/10.07.15 5,483,917.56 5,432,548.55 4.47 CZK 5,450,000 Waves Fin Inv Plc FRN Ser 2007-15 Tr 1 07/10.07.15 5,434,063.76 5,413,136.75 4.46
Total investments in securities 108,980,398.00 108,582,260.78 89.40
Cash at banks 12,373,618.19 10.19
Other net assets/(liabilities) 500,598.48 0.41
Total 121,456,477.45 100.00

FUND PARTNERS CSOB Sustainables 1
Statement of investments and other net assets (in CZK) as at 30th September 2010
The accompanying notes are an integral part of these financial statements.
131
Currency Number / nominal value
Description Cost Market value % of total net assets
Investments in securities
Transferable securities admitted to an official stock exchange listing
Bonds
CZK 10,500,000 Amethyst Structured Fin Plc FRN Ser 2007-8 Tr 1 07/23.03.15 10,490,445.00 10,503,514.35 8.80 CZK 10,600,000 Beechwood Structured Fin Plc FRN Ser 2007-8 Tr 1 07/23.03.15 10,590,354.00 10,510,267.82 8.81 CZK 10,550,000 Brookfields Capital Plc FRN Ser 2007-8 Tr 1 07/23.03.15 10,540,399.50 10,492,341.09 8.80 CZK 10,600,000 Eperon Finance Plc FRN Ser 2007-8 Tr 1 07/23.03.15 10,590,354.00 10,545,247.82 8.84 CZK 5,300,000 Espaccio Securities Plc FRN Ser 2007-8 Tr 1 07/23.03.15 5,295,177.00 5,264,673.91 4.41 CZK 5,300,000 Greenstreet Struc Fin Prod Plc FRN Ser 2007-8 07/23.03.15 5,295,177.00 5,262,553.91 4.41 CZK 5,300,000 Nimrod Capital Plc FRN Ser 2007-8 Tr 1 07/23.03.15 5,295,177.00 5,258,313.91 4.41 CZK 5,300,000 Opal Financial Products Plc FRN Ser 2007-8 Tr 1 07/23.03.15 5,295,177.00 5,242,943.91 4.39 CZK 5,300,000 Profile Finance Plc FRN Ser 2007-8 Tr 1 07/23.03.15 5,295,177.00 5,225,453.91 4.38 CZK 5,300,000 Recolte Securities Plc FRN Ser 2007-8 Tr 1 07/23.03.15 5,295,177.00 5,235,523.91 4.39 CZK 5,250,000 Silverstate Fin Inv Plc FRN Ser 2007-8 07/23.03.15 5,245,222.50 5,219,732.18 4.38 CZK 5,300,000 Vespucci Strut Fin Prod Plc FRN Ser 2007-8 Tr 1 07/23.03.15 5,295,177.00 5,249,833.91 4.40 CZK 5,300,000 Vigado Capital Plc FRN Ser 2007-8 Tr 1 07/23.03.15 5,295,177.00 5,261,493.91 4.41 CZK 5,250,000 Voyce Investments Plc FRN Ser 2007-8 Tr 1 07/23.03.15 5,245,222.50 5,227,082.18 4.38 CZK 5,300,000 Waterford Cap Investments Plc FRN Ser 07-8 Tr 1 07/23.03.15 5,295,177.00 5,231,813.91 4.39 CZK 5,250,000 Waves Fin Inv Plc FRN Ser 2007-8 Tr 1 07/23.03.15 5,245,222.50 5,211,332.18 4.37
Total investments in securities 105,603,813.00 104,942,122.81 87.97
Cash at banks 13,457,769.10 11.28
Other net assets/(liabilities) 886,488.02 0.75
Total 119,286,379.93 100.00

FUND PARTNERS CSOB Asian Growth 3
Statement of investments and other net assets (in CZK) as at 30th September 2010
The accompanying notes are an integral part of these financial statements.
132
Currency Number / nominal value
Description Cost Market value % of total net assets
Investments in securities
Transferable securities admitted to an official stock exchange listing
Bonds
CZK 17,550,000 Amethyst Structured Fin Plc FRN Ser 2007-15 Tr 1 07/10.07.15 17,491,526.71 17,566,428.56 8.70 CZK 17,650,000 Beechwood Structured Fin Plc FRN Ser 2007-15 07/10.07.15 17,591,193.53 17,511,202.16 8.67 CZK 17,600,000 Brookfields Capital Plc FRN Ser 2007-15 Tr 1 07/10.07.15 17,541,360.12 17,514,395.36 8.67 CZK 17,600,000 Eperon Finance Plc FRN Ser 2007-15 Tr 1 07/10.07.15 17,541,360.12 17,519,675.36 8.67 CZK 8,800,000 Espaccio Securities Plc FRN Ser 2007-15 Tr 1 07/10.07.15 8,770,680.06 8,746,637.68 4.33 CZK 8,800,000 Greenstreet Struc Fin Prod Plc FRN Ser 2007-15 07/10.07.15 8,770,680.06 8,743,117.68 4.33 CZK 8,800,000 Nimrod Capital Plc FRN Ser 2007-15 Tr 1 07/10.07.15 8,770,680.06 8,736,077.68 4.33 CZK 8,850,000 Opal Financial Products Plc FRN Ser 2007-15 Tr 1 07/10.07.15 8,820,513.47 8,760,049.48 4.34 CZK 8,850,000 Profile Finance Plc FRN Ser 2007-15 Tr 1 07/10.07.15 8,820,513.47 8,730,844.48 4.32 CZK 8,850,000 Recolte Securities Plc FRN Ser 2007-15 Tr 1 07/10.07.15 8,820,513.47 8,747,659.48 4.33 CZK 8,800,000 Silverstate Fin Inv Plc FRN Ser 2007-15 Tr 1 07/10.07.15 8,770,680.06 8,754,557.68 4.33 CZK 8,800,000 Vespucci Strut Fin Prod Plc FRN Ser 2007-15 Tr 1 07/10.07.15 8,770,680.06 8,721,997.68 4.32 CZK 8,850,000 Vigado Capital Plc FRN Ser 2007-15 Tr 1 07/10.07.15 8,820,513.47 8,791,024.48 4.35 CZK 8,800,000 Voyce Investments Plc FRN Ser 2007-15 Tr 1 07/10.07.15 8,770,680.06 8,766,877.68 4.34 CZK 8,850,000 Waterford Cap Investments Plc FRN Ser 2007-15 07/10.07.15 8,820,513.47 8,741,464.48 4.33 CZK 8,800,000 Waves Fin Inv Plc FRN Ser 2007-15 Tr 1 07/10.07.15 8,770,680.06 8,740,477.68 4.33
Total investments in securities 175,662,768.25 175,092,487.60 86.69
Cash at banks 19,678,301.55 9.74
Other net assets/(liabilities) 7,193,191.31 3.57
Total 201,963,980.46 100.00
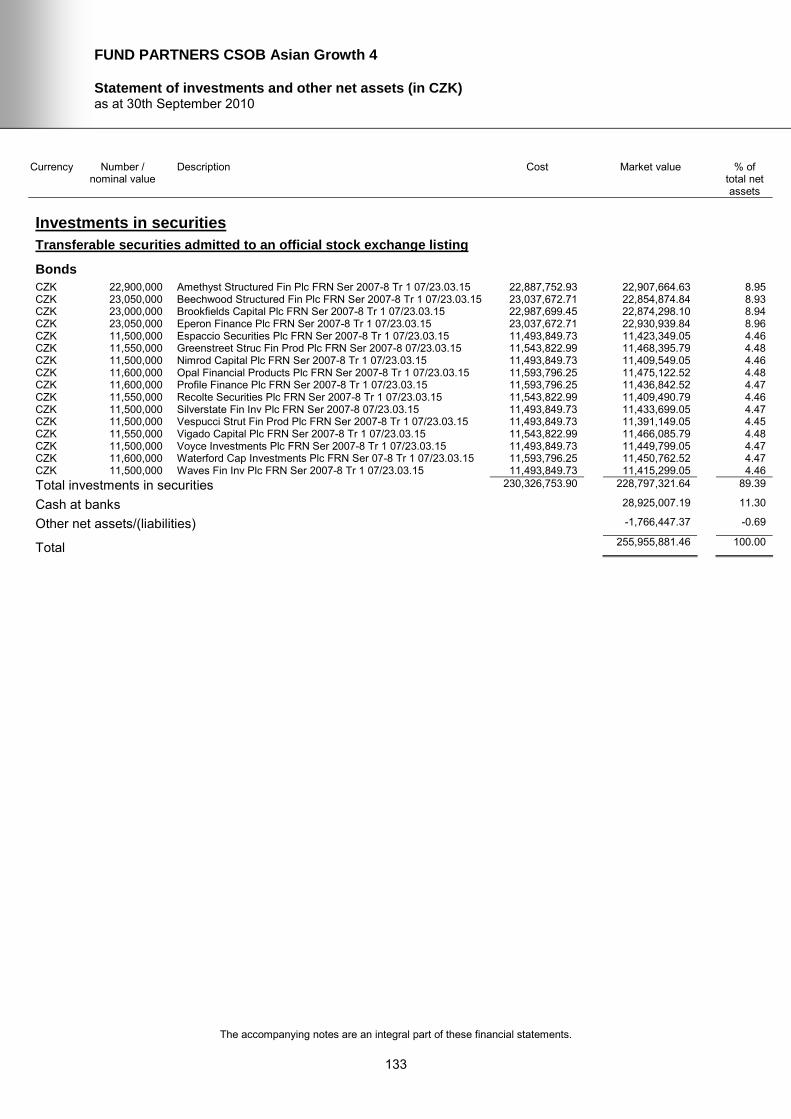
FUND PARTNERS CSOB Asian Growth 4
Statement of investments and other net assets (in CZK) as at 30th September 2010
The accompanying notes are an integral part of these financial statements.
133
Currency Number / nominal value
Description Cost Market value % of total net assets
Investments in securities
Transferable securities admitted to an official stock exchange listing
Bonds
CZK 22,900,000 Amethyst Structured Fin Plc FRN Ser 2007-8 Tr 1 07/23.03.15 22,887,752.93 22,907,664.63 8.95 CZK 23,050,000 Beechwood Structured Fin Plc FRN Ser 2007-8 Tr 1 07/23.03.15 23,037,672.71 22,854,874.84 8.93 CZK 23,000,000 Brookfields Capital Plc FRN Ser 2007-8 Tr 1 07/23.03.15 22,987,699.45 22,874,298.10 8.94 CZK 23,050,000 Eperon Finance Plc FRN Ser 2007-8 Tr 1 07/23.03.15 23,037,672.71 22,930,939.84 8.96 CZK 11,500,000 Espaccio Securities Plc FRN Ser 2007-8 Tr 1 07/23.03.15 11,493,849.73 11,423,349.05 4.46 CZK 11,550,000 Greenstreet Struc Fin Prod Plc FRN Ser 2007-8 07/23.03.15 11,543,822.99 11,468,395.79 4.48 CZK 11,500,000 Nimrod Capital Plc FRN Ser 2007-8 Tr 1 07/23.03.15 11,493,849.73 11,409,549.05 4.46 CZK 11,600,000 Opal Financial Products Plc FRN Ser 2007-8 Tr 1 07/23.03.15 11,593,796.25 11,475,122.52 4.48 CZK 11,600,000 Profile Finance Plc FRN Ser 2007-8 Tr 1 07/23.03.15 11,593,796.25 11,436,842.52 4.47 CZK 11,550,000 Recolte Securities Plc FRN Ser 2007-8 Tr 1 07/23.03.15 11,543,822.99 11,409,490.79 4.46 CZK 11,500,000 Silverstate Fin Inv Plc FRN Ser 2007-8 07/23.03.15 11,493,849.73 11,433,699.05 4.47 CZK 11,500,000 Vespucci Strut Fin Prod Plc FRN Ser 2007-8 Tr 1 07/23.03.15 11,493,849.73 11,391,149.05 4.45 CZK 11,550,000 Vigado Capital Plc FRN Ser 2007-8 Tr 1 07/23.03.15 11,543,822.99 11,466,085.79 4.48 CZK 11,500,000 Voyce Investments Plc FRN Ser 2007-8 Tr 1 07/23.03.15 11,493,849.73 11,449,799.05 4.47 CZK 11,600,000 Waterford Cap Investments Plc FRN Ser 07-8 Tr 1 07/23.03.15 11,593,796.25 11,450,762.52 4.47 CZK 11,500,000 Waves Fin Inv Plc FRN Ser 2007-8 Tr 1 07/23.03.15 11,493,849.73 11,415,299.05 4.46
Total investments in securities 230,326,753.90 228,797,321.64 89.39
Cash at banks 28,925,007.19 11.30
Other net assets/(liabilities) -1,766,447.37 -0.69
Total 255,955,881.46 100.00

FUND PARTNERS CSOB Asian Winners 1
Statement of investments and other net assets (in CZK) as at 30th September 2010
The accompanying notes are an integral part of these financial statements.
134
Currency Number / nominal value
Description Cost Market value % of total net assets
Investments in securities
Transferable securities admitted to an official stock exchange listing
Bonds
CZK 6,300,000 Amethyst Structured Fin Plc FRN Ser 2007-8 Tr 1 07/23.03.15 6,298,299.00 6,302,108.61 8.74 CZK 6,350,000 Beechwood Structured Fin Plc FRN Ser 2007-8 Tr 1 07/23.03.15 6,348,285.50 6,296,245.35 8.73 CZK 6,350,000 Brookfields Capital Plc FRN Ser 2007-8 Tr 1 07/23.03.15 6,348,285.50 6,315,295.35 8.76 CZK 6,350,000 Eperon Finance Plc FRN Ser 2007-8 Tr 1 07/23.03.15 6,348,285.50 6,317,200.35 8.76 CZK 3,150,000 Espaccio Securities Plc FRN Ser 2007-8 Tr 1 07/23.03.15 3,149,149.50 3,129,004.31 4.34 CZK 3,150,000 Greenstreet Struc Fin Prod Plc FRN Ser 2007-8 07/23.03.15 3,149,149.50 3,127,744.31 4.34 CZK 3,150,000 Nimrod Capital Plc FRN Ser 2007-8 Tr 1 07/23.03.15 3,149,149.50 3,125,224.31 4.33 CZK 3,150,000 Opal Financial Products Plc FRN Ser 2007-8 Tr 1 07/23.03.15 3,149,149.50 3,116,089.31 4.32 CZK 3,200,000 Profile Finance Plc FRN Ser 2007-8 Tr 1 07/23.03.15 3,199,136.00 3,154,991.04 4.37 CZK 3,150,000 Recolte Securities Plc FRN Ser 2007-8 Tr 1 07/23.03.15 3,149,149.50 3,111,679.31 4.31 CZK 3,150,000 Silverstate Fin Inv Plc FRN Ser 2007-8 07/23.03.15 3,149,149.50 3,131,839.31 4.34 CZK 3,150,000 Vespucci Strut Fin Prod Plc FRN Ser 2007-8 Tr 1 07/23.03.15 3,149,149.50 3,120,184.31 4.33 CZK 3,150,000 Vigado Capital Plc FRN Ser 2007-8 Tr 1 07/23.03.15 3,149,149.50 3,127,114.31 4.34 CZK 3,150,000 Voyce Investments Plc FRN Ser 2007-8 Tr 1 07/23.03.15 3,149,149.50 3,136,249.31 4.35 CZK 3,150,000 Waterford Cap Investments Plc FRN Ser 07-8 Tr 1 07/23.03.15 3,149,149.50 3,109,474.31 4.31 CZK 3,150,000 Waves Fin Inv Plc FRN Ser 2007-8 Tr 1 07/23.03.15 3,149,149.50 3,126,799.31 4.34
Total investments in securities 63,182,936.00 62,747,243.11 87.01
Cash at banks 8,296,490.85 11.50
Other net assets/(liabilities) 1,075,292.43 1.49
Total 72,119,026.39 100.00

FUND PARTNERS CSOB Asian Winners 2
Statement of investments and other net assets (in CZK) as at 30th September 2010
The accompanying notes are an integral part of these financial statements.
135
Currency Number / nominal value
Description Cost Market value % of total net assets
Investments in securities
Transferable securities admitted to an official stock exchange listing
Bonds
CZK 12,200,000 Amethyst Structured Fin Plc FRN Ser 2007-8 Tr 1 07/23.03.15 12,159,646.18 12,204,083.34 9.03 CZK 12,250,000 Beechwood Structured Fin Plc FRN Ser 2007-8 Tr 1 07/23.03.15 12,209,480.79 12,146,300.08 8.99 CZK 12,250,000 Brookfields Capital Plc FRN Ser 2007-8 Tr 1 07/23.03.15 12,209,480.80 12,183,050.08 9.02 CZK 12,250,000 Eperon Finance Plc FRN Ser 2007-8 Tr 1 07/23.03.15 12,209,480.79 12,186,725.08 9.02 CZK 6,150,000 Espaccio Securities Plc FRN Ser 2007-8 Tr 1 07/23.03.15 6,129,657.69 6,109,008.41 4.52 CZK 6,150,000 Greenstreet Struc Fin Prod Plc FRN Ser 2007-8 07/23.03.15 6,129,657.69 6,106,548.41 4.52 CZK 6,150,000 Nimrod Capital Plc FRN Ser 2007-8 Tr 1 07/23.03.15 6,129,657.69 6,101,628.41 4.52 CZK 6,150,000 Opal Financial Products Plc FRN Ser 2007-8 Tr 1 07/23.03.15 6,129,657.69 6,083,793.41 4.50 CZK 6,150,000 Profile Finance Plc FRN Ser 2007-8 Tr 1 07/23.03.15 6,129,657.69 6,063,498.41 4.49 CZK 6,150,000 Recolte Securities Plc FRN Ser 2007-8 Tr 1 07/23.03.15 6,129,657.69 6,075,183.41 4.50 CZK 6,100,000 Silverstate Fin Inv Plc FRN Ser 2007-8 07/23.03.15 6,079,823.08 6,064,831.67 4.49 CZK 6,150,000 Vespucci Strut Fin Prod Plc FRN Ser 2007-8 Tr 1 07/23.03.15 6,129,659.63 6,091,788.41 4.51 CZK 6,150,000 Vigado Capital Plc FRN Ser 2007-8 Tr 1 07/23.03.15 6,129,657.69 6,105,318.41 4.52 CZK 6,100,000 Voyce Investments Plc FRN Ser 2007-8 Tr 1 07/23.03.15 6,079,823.08 6,073,371.67 4.50 CZK 6,150,000 Waterford Cap Investments Plc FRN Ser 07-8 Tr 1 07/23.03.15 6,129,657.69 6,070,878.41 4.49 CZK 6,100,000 Waves Fin Inv Plc FRN Ser 2007-8 Tr 1 07/23.03.15 6,079,823.08 6,055,071.67 4.48
Total investments in securities 122,194,478.95 121,721,079.28 90.10
Cash at banks 15,477,031.38 11.46
Other net assets/(liabilities) -2,104,735.46 -1.56
Total 135,093,375.20 100.00

FUND PARTNERS Kredyt Bank Conservative 4
Statement of investments and other net assets (in PLN) as at 30th September 2010
The accompanying notes are an integral part of these financial statements.
136
Currency Number / nominal value
Description Cost Market value % of total net assets
Investments in securities
Transferable securities admitted to an official stock exchange listing
Bonds
PLN 3,060,000 Amethyst Structured Fin Plc FRN Ser 2007-16 Tr 1 07/10.07.15 3,055,075.68 3,062,282.76 9.68 PLN 3,080,000 Beechwood Structured Fin Plc FRN Ser 2007-16 07/10.07.15 3,075,043.49 3,055,193.68 9.66 PLN 3,070,000 Brookfields Capital Plc FRN Ser 2007-16 Tr 1 07/10.07.15 3,065,059.58 3,054,484.22 9.66 PLN 3,075,000 Eperon Finance Plc FRN Ser 2007-16 Tr 1 07/10.07.15 3,070,051.54 3,060,381.45 9.67 PLN 1,540,000 Espaccio Securities Plc FRN Ser 2007-16 Tr 1 07/10.07.15 1,537,521.76 1,530,368.84 4.84 PLN 1,540,000 Greenstreet Struc Fin Prod Plc FRN Ser 2007-16 07/10.07.15 1,537,521.76 1,529,752.84 4.84 PLN 1,540,000 Nimrod Capital Plc FRN Ser 2007-16 Tr 1 07/10.07.15 1,537,521.76 1,528,520.84 4.83 PLN 1,540,000 Opal Financial Products Plc FRN Ser 2007-16 Tr 1 07/10.07.15 1,537,521.76 1,524,054.84 4.82 PLN 1,550,000 Profile Finance Plc FRN Ser 2007-16 Tr 1 07/10.07.15 1,547,505.67 1,528,836.30 4.83 PLN 1,545,000 Recolte Securities Plc FRN Ser 2007-16 Tr 1 07/10.07.15 1,542,513.71 1,526,840.07 4.83 PLN 1,535,000 Silverstate Fin Inv Plc FRN Ser 2007-16 Tr 1 07/10.07.15 1,532,529.81 1,526,781.61 4.83 PLN 1,540,000 Vespucci Strut Fin Prod Plc FRN Ser 2007-16 07/10.07.15 1,537,521.76 1,526,056.84 4.82 PLN 1,540,000 Vigado Capital Plc FRN Ser 2007-16 Tr 1 07/10.07.15 1,537,521.76 1,529,444.84 4.84 PLN 1,535,000 Voyce Investments Plc FRN Ser 2007-16 Tr 1 07/10.07.15 1,532,529.81 1,528,930.61 4.83 PLN 1,545,000 Waterford Cap Investments Plc FRN Ser 2007-16 07/10.07.15 1,542,513.71 1,525,758.57 4.82 PLN 1,540,000 Waves Fin Investments Plc FRN Ser 2007-16 Tr 1 07/10.07.15 1,537,521.76 1,529,290.84 4.83
Total investments in securities 30,725,475.32 30,566,979.15 96.63
Cash at banks 2,129,264.11 6.73
Other net assets/(liabilities) -1,064,207.95 -3.36
Total 31,632,035.31 100.00

FUND PARTNERS Kredyt Bank Conservative 5
Statement of investments and other net assets (in PLN) as at 30th September 2010
The accompanying notes are an integral part of these financial statements.
137
Currency Number / nominal value
Description Cost Market value % of total net assets
Investments in securities
Transferable securities admitted to an official stock exchange listing
Bonds
PLN 7,370,000 Amethyst Structured Fin Plc FRN Ser 2007-16 Tr 1 07/10.07.15 7,334,518.87 7,375,498.02 9.58 PLN 7,370,000 Beechwood Structured Fin Plc FRN Ser 2007-16 07/10.07.15 7,334,518.87 7,310,642.02 9.50 PLN 7,370,000 Brookfields Capital Plc FRN Ser 2007-16 Tr 1 07/10.07.15 7,334,518.87 7,332,752.02 9.52 PLN 7,370,000 Eperon Finance Plc FRN Ser 2007-16 Tr 1 07/10.07.15 7,334,518.87 7,334,963.02 9.53 PLN 3,685,000 Espaccio Securities Plc FRN Ser 2007-16 Tr 1 07/10.07.15 3,667,259.44 3,661,954.01 4.76 PLN 3,685,000 Greenstreet Struc Fin Prod Plc FRN Ser 2007-16 07/10.07.15 3,667,259.44 3,660,480.01 4.75 PLN 3,685,000 Nimrod Capital Plc FRN Ser 2007-16 Tr 1 07/10.07.15 3,667,259.44 3,657,532.01 4.75 PLN 3,685,000 Opal Financial Products Plc FRN Ser 2007-16 Tr 1 07/10.07.15 3,667,259.44 3,646,845.51 4.74 PLN 3,685,000 Profile Finance Plc FRN Ser 2007-16 Tr 1 07/10.07.15 3,667,259.44 3,634,685.01 4.72 PLN 3,685,000 Recolte Securities Plc FRN Ser 2007-16 Tr 1 07/10.07.15 3,667,259.44 3,641,686.51 4.73 PLN 3,685,000 Silverstate Fin Inv Plc FRN Ser 2007-16 Tr 1 07/10.07.15 3,667,259.44 3,665,270.51 4.76 PLN 3,685,000 Vespucci Strut Fin Prod Plc FRN Ser 2007-16 07/10.07.15 3,667,259.44 3,651,636.01 4.74 PLN 3,685,000 Vigado Capital Plc FRN Ser 2007-16 Tr 1 07/10.07.15 3,667,259.44 3,659,743.01 4.75 PLN 3,685,000 Voyce Investments Plc FRN Ser 2007-16 Tr 1 07/10.07.15 3,667,259.44 3,670,429.51 4.77 PLN 3,685,000 Waterford Cap Investments Plc FRN Ser 2007-16 07/10.07.15 3,667,259.44 3,639,107.01 4.73 PLN 3,685,000 Waves Fin Investments Plc FRN Ser 2007-16 Tr 1 07/10.07.15 3,667,259.44 3,659,374.51 4.75
Total investments in securities 73,345,188.76 73,202,598.70 95.08
Cash at banks 7,416,761.35 9.63
Other net assets/(liabilities) -3,627,917.15 -4.71
Total 76,991,442.90 100.00

FUND PARTNERS Kredyt Bank Conservative 6
Statement of investments and other net assets (in PLN) as at 30th September 2010
The accompanying notes are an integral part of these financial statements.
138
Currency Number / nominal value
Description Cost Market value % of total net assets
Investments in securities
Transferable securities admitted to an official stock exchange listing
Bonds
PLN 5,890,000 Amethyst Structured Fin Plc FRN Ser 2007-16 Tr 1 07/10.07.15 5,876,569.83 5,894,393.94 8.87 PLN 5,925,000 Beechwood Structured Fin Plc FRN Ser 2007-16 07/10.07.15 5,911,490.03 5,877,280.05 8.85 PLN 5,910,000 Brookfields Capital Plc FRN Ser 2007-16 Tr 1 07/10.07.15 5,896,524.23 5,880,130.86 8.85 PLN 5,920,000 Eperon Finance Plc FRN Ser 2007-16 Tr 1 07/10.07.15 5,906,501.43 5,891,856.32 8.87 PLN 2,965,000 Espaccio Securities Plc FRN Ser 2007-16 Tr 1 07/10.07.15 2,958,239.32 2,946,456.89 4.44 PLN 2,965,000 Greenstreet Struc Fin Prod Plc FRN Ser 2007-16 07/10.07.15 2,958,239.32 2,945,270.89 4.43 PLN 2,965,000 Nimrod Capital Plc FRN Ser 2007-16 Tr 1 07/10.07.15 2,958,239.32 2,942,898.89 4.43 PLN 2,965,000 Opal Financial Products Plc FRN Ser 2007-16 Tr 1 07/10.07.15 2,958,239.32 2,934,300.39 4.42 PLN 2,980,000 Profile Finance Plc FRN Ser 2007-16 Tr 1 07/10.07.15 2,973,205.12 2,939,311.08 4.42 PLN 2,970,000 Recolte Securities Plc FRN Ser 2007-16 Tr 1 07/10.07.15 2,963,227.92 2,935,090.62 4.42 PLN 2,955,000 Silverstate Fin Inv Plc FRN Ser 2007-16 Tr 1 07/10.07.15 2,948,262.12 2,939,178.93 4.42 PLN 2,965,000 Vespucci Strut Fin Prod Plc FRN Ser 2007-16 07/10.07.15 2,958,239.32 2,938,154.89 4.42 PLN 2,970,000 Vigado Capital Plc FRN Ser 2007-16 Tr 1 07/10.07.15 2,963,227.92 2,949,643.62 4.44 PLN 2,955,000 Voyce Investments Plc FRN Ser 2007-16 Tr 1 07/10.07.15 2,948,262.12 2,943,315.93 4.43 PLN 2,970,000 Waterford Cap Investments Plc FRN Ser 2007-16 07/10.07.15 2,963,227.92 2,933,011.62 4.42 PLN 2,960,000 Waves Fin Investments Plc FRN Ser 2007-16 Tr 1 07/10.07.15 2,953,250.72 2,939,416.16 4.43
Total investments in securities 59,094,945.96 58,829,711.08 88.56
Cash at banks 6,197,318.77 9.33
Other net assets/(liabilities) 1,403,709.10 2.11
Total 66,430,738.95 100.00

FUND PARTNERS Kredyt Bank Financials 1
Statement of investments and other net assets (in PLN) as at 30th September 2010
The accompanying notes are an integral part of these financial statements.
139
Currency Number / nominal value
Description Cost Market value % of total net assets
Investments in securities
Transferable securities admitted to an official stock exchange listing
Bonds
PLN 5,790,000 Amethyst Structured Fin Plc FRN Ser 2007-16 Tr 1 07/10.07.15 5,766,491.29 5,794,319.34 9.64 PLN 5,830,000 Beechwood Structured Fin Plc FRN Ser 2007-16 07/10.07.15 5,806,328.89 5,783,045.18 9.62 PLN 5,815,000 Brookfields Capital Plc FRN Ser 2007-16 Tr 1 07/10.07.15 5,791,389.79 5,785,610.99 9.62 PLN 5,820,000 Eperon Finance Plc FRN Ser 2007-16 Tr 1 07/10.07.15 5,796,369.49 5,792,331.72 9.63 PLN 2,920,000 Espaccio Securities Plc FRN Ser 2007-16 Tr 1 07/10.07.15 2,908,144.15 2,901,738.32 4.83 PLN 2,915,000 Greenstreet Struc Fin Prod Plc FRN Ser 2007-16 07/10.07.15 2,903,164.45 2,895,603.59 4.82 PLN 2,915,000 Nimrod Capital Plc FRN Ser 2007-16 Tr 1 07/10.07.15 2,903,164.45 2,893,271.59 4.81 PLN 2,920,000 Opal Financial Products Plc FRN Ser 2007-16 Tr 1 07/10.07.15 2,908,144.15 2,889,766.32 4.81 PLN 2,935,000 Profile Finance Plc FRN Ser 2007-16 Tr 1 07/10.07.15 2,923,083.24 2,894,925.51 4.82 PLN 2,920,000 Recolte Securities Plc FRN Ser 2007-16 Tr 1 07/10.07.15 2,908,144.15 2,885,678.32 4.80 PLN 2,905,000 Silverstate Fin Inv Plc FRN Ser 2007-16 Tr 1 07/10.07.15 2,893,205.05 2,889,446.63 4.81 PLN 2,915,000 Vespucci Strut Fin Prod Plc FRN Ser 2007-16 07/10.07.15 2,903,164.45 2,888,607.59 4.80 PLN 2,920,000 Vigado Capital Plc FRN Ser 2007-16 Tr 1 07/10.07.15 2,908,144.15 2,899,986.32 4.82 PLN 2,910,000 Voyce Investments Plc FRN Ser 2007-16 Tr 1 07/10.07.15 2,898,184.75 2,898,493.86 4.82 PLN 2,920,000 Waterford Cap Investments Plc FRN Ser 2007-16 07/10.07.15 2,908,144.15 2,883,634.32 4.80 PLN 2,915,000 Waves Fin Investments Plc FRN Ser 2007-16 Tr 1 07/10.07.15 2,903,164.45 2,894,729.09 4.81
Total investments in securities 58,028,431.05 57,871,188.69 96.26
Cash at banks 4,517,416.77 7.51
Other net assets/(liabilities) -2,268,743.65 -3.77
Total 60,119,861.81 100.00

FUND PARTNERS Kredyt Bank Central European Winners 1
Statement of investments and other net assets (in PLN) as at 30th September 2010
The accompanying notes are an integral part of these financial statements.
140
Currency Number / nominal value
Description Cost Market value % of total net assets
Investments in securities
Transferable securities admitted to an official stock exchange listing
Bonds
PLN 6,095,000 Amethyst Structured Fin Plc FRN Ser 2007-10 Tr 1 07/23.03.15 6,081,728.22 6,098,991.00 9.63 PLN 6,145,000 Beechwood Structured Fin Plc FRN Ser 2007-10 07/23.03.15 6,131,619.36 6,094,947.75 9.62 PLN 6,125,000 Brookfields Capital Plc FRN Ser 2007-10 Tr 1 07/23.03.15 6,111,662.90 6,093,485.65 9.62 PLN 6,135,000 Eperon Finance Plc FRN Ser 2007-10 Tr 1 07/23.03.15 6,121,641.13 6,105,274.69 9.64 PLN 3,070,000 Espaccio Securities Plc FRN Ser 2007-10 Tr 1 07/23.03.15 3,063,318.60 3,050,520.24 4.82 PLN 3,070,000 Greenstreet Struc Fin Prod Plc FRN Ser 2007-10 07/23.03.15 3,063,315.11 3,049,292.24 4.82 PLN 3,070,000 Nimrod Capital Plc FRN Ser 2007-10 Tr 1 07/23.03.15 3,063,315.12 3,046,836.24 4.81 PLN 3,080,000 Opal Financial Products Plc FRN Ser 2007-10 Tr 1 07/23.03.15 3,073,293.34 3,047,828.78 4.81 PLN 3,085,000 Profile Finance Plc FRN Ser 2007-10 Tr 1 07/23.03.15 3,078,282.45 3,042,596.06 4.80 PLN 3,080,000 Recolte Securities Plc FRN Ser 2007-10 Tr 1 07/23.03.15 3,073,296.84 3,043,516.78 4.81 PLN 3,065,000 Silverstate Fin Inv Plc FRN Ser 2007-10 Tr 1 07/23.03.15 3,058,326.01 3,048,310.46 4.81 PLN 3,070,000 Vespucci Strut Fin Prod Plc FRN Ser 2007-10 07/23.03.15 3,063,315.12 3,041,924.24 4.80 PLN 3,070,000 Vigado Capital Plc FRN Ser 2007-10 Tr 1 07/23.03.15 3,063,315.11 3,048,678.24 4.81 PLN 3,060,000 Voyce Investments Plc FRN Ser 2007-10 Tr 1 07/23.03.15 3,053,336.89 3,047,621.69 4.81 PLN 3,085,000 Waterford Cap Investments Plc FRN Ser 2007-10 07/23.03.15 3,078,282.45 3,046,298.06 4.81 PLN 3,065,000 Waves Fin Investments Plc FRN Ser 2007-10 Tr 1 07/23.03.15 3,058,326.00 3,043,406.46 4.81
Total investments in securities 61,236,374.65 60,949,528.58 96.23
Cash at banks 8,032,401.64 12.68
Other net assets/(liabilities) -5,641,766.84 -8.91
Total 63,340,163.38 100.00

FUND PARTNERS Kredyt Bank Conservative 7
Statement of investments and other net assets (in PLN) as at 30th September 2010
The accompanying notes are an integral part of these financial statements.
141
Currency Number / nominal value
Description Cost Market value % of total net assets
Investments in securities
Transferable securities admitted to an official stock exchange listing
Bonds
PLN 3,585,000 Amethyst Structured Fin Plc FRN Ser 2007-16 Tr 1 07/10.07.15 3,564,646.54 3,587,674.41 9.77 PLN 3,610,000 Beechwood Structured Fin Plc FRN Ser 2007-16 07/10.07.15 3,588,618.20 3,580,925.06 9.75 PLN 3,605,000 Brookfields Capital Plc FRN Ser 2007-16 Tr 1 07/10.07.15 3,584,013.91 3,586,780.33 9.77 PLN 3,610,000 Eperon Finance Plc FRN Ser 2007-16 Tr 1 07/10.07.15 3,588,764.17 3,592,838.06 9.79 PLN 1,805,000 Espaccio Securities Plc FRN Ser 2007-16 Tr 1 07/10.07.15 1,794,149.69 1,793,711.53 4.89 PLN 1,805,000 Greenstreet Struc Fin Prod Plc FRN Ser 2007-16 07/10.07.15 1,794,165.22 1,792,989.53 4.88 PLN 1,805,000 Nimrod Capital Plc FRN Ser 2007-16 Tr 1 07/10.07.15 1,794,250.73 1,791,545.53 4.88 PLN 1,815,000 Opal Financial Products Plc FRN Ser 2007-16 Tr 1 07/10.07.15 1,804,058.35 1,796,207.49 4.89 PLN 1,815,000 Profile Finance Plc FRN Ser 2007-16 Tr 1 07/10.07.15 1,803,573.57 1,790,217.99 4.88 PLN 1,815,000 Recolte Securities Plc FRN Ser 2007-16 Tr 1 07/10.07.15 1,803,980.29 1,793,666.49 4.89 PLN 1,800,000 Silverstate Fin Inv Plc FRN Ser 2007-16 Tr 1 07/10.07.15 1,789,536.49 1,790,362.80 4.88 PLN 1,805,000 Vespucci Strut Fin Prod Plc FRN Ser 2007-16 07/10.07.15 1,794,265.31 1,788,657.53 4.87 PLN 1,805,000 Vigado Capital Plc FRN Ser 2007-16 Tr 1 07/10.07.15 1,794,056.52 1,792,628.53 4.88 PLN 1,800,000 Voyce Investments Plc FRN Ser 2007-16 Tr 1 07/10.07.15 1,789,488.81 1,792,882.80 4.88 PLN 1,815,000 Waterford Cap Investments Plc FRN Ser 2007-16 07/10.07.15 1,803,980.29 1,792,395.99 4.88 PLN 1,805,000 Waves Fin Investments Plc FRN Ser 2007-16 Tr 1 07/10.07.15 1,794,309.09 1,792,448.03 4.88
Total investments in securities 35,885,857.18 35,855,932.10 97.66
Cash at banks 3,876,948.11 10.56
Other net assets/(liabilities) -3,017,075.39 -8.22
Total 36,715,804.82 100.00

FUND PARTNERS Kredyt Bank BRIC 1
Statement of investments and other net assets (in PLN) as at 30th September 2010
The accompanying notes are an integral part of these financial statements.
142
Currency Number / nominal value
Description Cost Market value % of total net assets
Investments in securities
Transferable securities admitted to an official stock exchange listing
Bonds
PLN 8,830,000 Amethyst Structured Fin Plc FRN Ser 2007-10 Tr 1 07/23.03.15 8,827,787.79 8,835,781.89 8.91 PLN 8,900,000 Beechwood Structured Fin Plc FRN Ser 2007-10 07/23.03.15 8,897,770.26 8,827,507.72 8.90 PLN 8,885,000 Brookfields Capital Plc FRN Ser 2007-10 Tr 1 07/23.03.15 8,882,774.01 8,839,284.90 8.92 PLN 8,895,000 Eperon Finance Plc FRN Ser 2007-10 Tr 1 07/23.03.15 8,892,771.50 8,851,901.95 8.93 PLN 4,450,000 Espaccio Securities Plc FRN Ser 2007-10 Tr 1 07/23.03.15 4,448,885.12 4,421,763.86 4.46 PLN 4,455,000 Greenstreet Struc Fin Prod Plc FRN Ser 2007-10 07/23.03.15 4,453,883.88 4,424,950.13 4.46 PLN 4,450,000 Nimrod Capital Plc FRN Ser 2007-10 Tr 1 07/23.03.15 4,448,885.13 4,416,423.86 4.46 PLN 4,470,000 Opal Financial Products Plc FRN Ser 2007-10 Tr 1 07/23.03.15 4,468,880.11 4,423,309.95 4.46 PLN 4,475,000 Profile Finance Plc FRN Ser 2007-10 Tr 1 07/23.03.15 4,473,878.86 4,413,490.23 4.45 PLN 4,470,000 Recolte Securities Plc FRN Ser 2007-10 Tr 1 07/23.03.15 4,468,880.11 4,417,051.95 4.46 PLN 4,440,000 Silverstate Fin Inv Plc FRN Ser 2007-10 Tr 1 07/23.03.15 4,438,887.63 4,415,823.32 4.45 PLN 4,450,000 Vespucci Strut Fin Prod Plc FRN Ser 2007-10 07/23.03.15 4,448,885.13 4,409,303.86 4.45 PLN 4,455,000 Vigado Capital Plc FRN Ser 2007-10 Tr 1 07/23.03.15 4,453,883.88 4,424,059.13 4.46 PLN 4,435,000 Voyce Investments Plc FRN Ser 2007-10 Tr 1 07/23.03.15 4,433,888.89 4,417,059.54 4.46 PLN 4,475,000 Waterford Cap Investments Plc FRN Ser 2007-10 07/23.03.15 4,473,878.87 4,418,860.23 4.46 PLN 4,445,000 Waves Fin Investments Plc FRN Ser 2007-10 Tr 1 07/23.03.15 4,443,886.38 4,413,684.08 4.45
Total investments in securities 88,957,707.55 88,370,256.60 89.14
Cash at banks 11,015,024.66 11.11
Other net assets/(liabilities) -246,612.21 -0.25
Total 99,138,669.05 100.00

FUND PARTNERS Centea Distri Opportunity 1
Statement of investments and other net assets (in EUR) as at 30th September 2010
The accompanying notes are an integral part of these financial statements.
143
Currency Number / nominal value
Description Cost Market value % of total net assets
Investments in securities
Transferable securities admitted to an official stock exchange listing
Bonds
EUR 435,000 Amethyst Finance Plc FRN Ser 2006-3 Tr 2 06/23.10.14 434,183.96 435,180.83 6.66 EUR 435,000 Beechwood Structured Fin Plc FRN Ser 2006-3 Tr 2 06/23.10.14 434,220.36 431,352.83 6.60 EUR 434,000 Brookfields Capital Plc FRN EMTN Ser 2006-3 Tr 2 06/23.10.14 433,586.18 431,663.21 6.60 EUR 435,000 Eperon Finance Plc FRN EMTN Ser 2006-3 Tr 2 06/23.10.14 434,329.56 432,788.33 6.62 EUR 217,000 Espaccio Securities Plc FRN EMTN Ser 2006-3 Tr 2 06/23.10.14 216,928.39 215,571.21 3.30 EUR 217,000 Greenstreet Struc Fin Prod Plc FRN Ser 2006-3 06/23.10.14 216,928.39 215,484.41 3.30 EUR 300,000 Infinity Finance Plc FRN EMTN Ser 1004 04/23.10.13 292,148.76 293,794.71 4.50 EUR 217,000 Nimrod Capital Plc FRN EMTN Ser 2006-3 Tr 2 06/23.10.14 216,928.39 215,310.81 3.29 EUR 218,000 Opal Financial Products Plc FRN EMTN Ser 2006-3 06/23.10.14 217,928.06 215,670.82 3.30 EUR 217,000 Profile Finance Plc FRN EMTN Ser 2006-3 Tr 2 06/23.10.14 216,928.39 213,965.41 3.27 EUR 218,000 Recolte Securities Plc FRN EMTN Ser 2006-3 Tr 2 06/23.10.14 217,928.06 215,365.62 3.30 EUR 300,000 Sierra Finance Plc FRN EMTN Ser 1004 04/23.10.13 286,958.76 289,174.71 4.42 EUR 217,000 Silverstate Fin Inv Plc FRN EMTN Ser 2006-3 Tr 2 06/23.10.14 216,928.39 215,766.51 3.30 EUR 300,000 Venice Finance Plc FRN EMTN Ser 1004 04/23.10.13 287,828.76 289,504.71 4.43 EUR 217,000 Vespucci Strut Fin Prod Plc FRN Ser 2006-3 Tr 2 06/23.10.14 216,928.39 214,963.61 3.29 EUR 217,000 Vigado Capital Plc FRN EMTN Ser 2006-3 Tr 2 06/23.10.14 216,928.39 215,441.01 3.30 EUR 217,000 Voyce Investments Plc FRN EMTN Ser 2006-3 Tr 2 06/23.10.14 216,928.39 216,070.31 3.31 EUR 217,000 Waterford Cap Investments Plc FRN Ser 2006-3 06/23.10.14 216,928.39 214,225.81 3.28 EUR 217,000 Waves Fin Inv Plc FRN EMTN Ser 2006-3 06/23.10.14 216,928.39 215,419.31 3.30 EUR 300,000 Zulma Finance Plc FRN EMTN Ser 1004 04/23.10.13 293,678.76 295,444.71 4.52
Total bonds 5,502,075.12 5,482,158.88 83.89
Other transferable securities
Bonds
EUR 279,000 D-Star Finance Plc FRN C Ser 2008-4 AprOct 09/10.03.14 279,481.22 280,064.44 4.29
Total bonds 279,481.22 280,064.44 4.29
Total investments in securities 5,781,556.34 5,762,223.32 88.18
Cash at banks 465,170.76 7.12
Other net assets/(liabilities) 307,536.17 4.70
Total 6,534,930.25 100.00
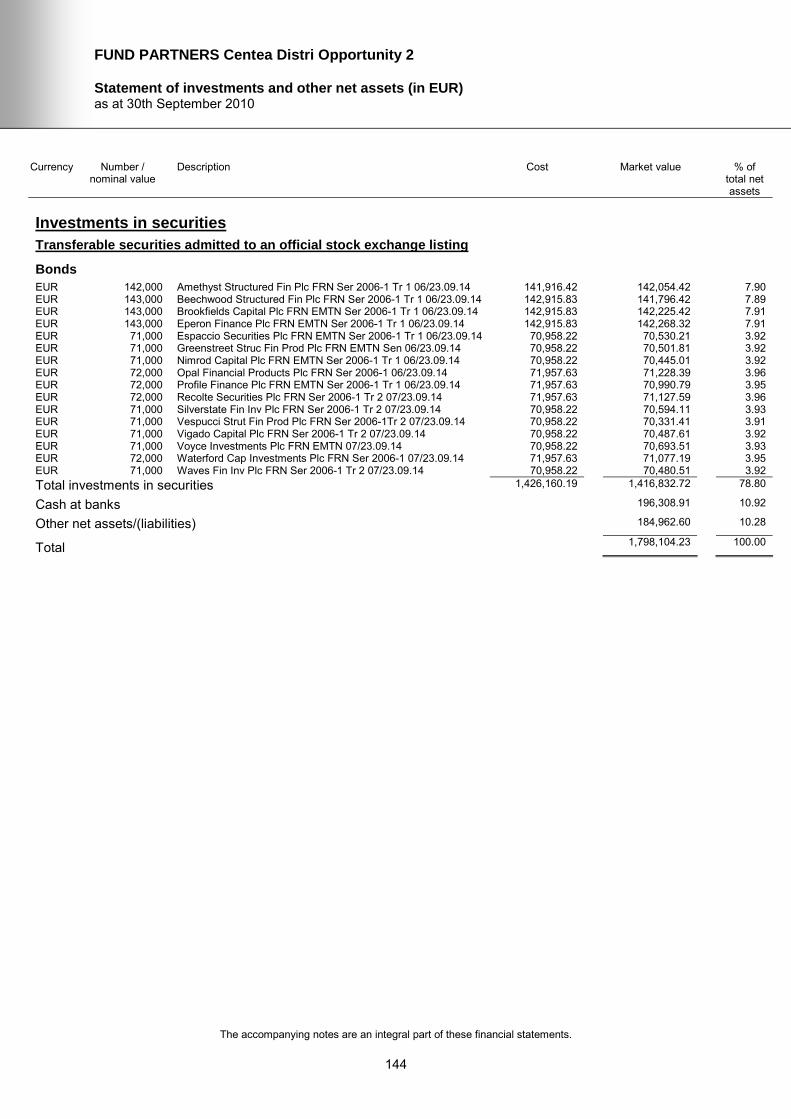
FUND PARTNERS Centea Distri Opportunity 2
Statement of investments and other net assets (in EUR) as at 30th September 2010
The accompanying notes are an integral part of these financial statements.
144
Currency Number / nominal value
Description Cost Market value % of total net assets
Investments in securities
Transferable securities admitted to an official stock exchange listing
Bonds
EUR 142,000 Amethyst Structured Fin Plc FRN Ser 2006-1 Tr 1 06/23.09.14 141,916.42 142,054.42 7.90 EUR 143,000 Beechwood Structured Fin Plc FRN Ser 2006-1 Tr 1 06/23.09.14 142,915.83 141,796.42 7.89 EUR 143,000 Brookfields Capital Plc FRN EMTN Ser 2006-1 Tr 1 06/23.09.14 142,915.83 142,225.42 7.91 EUR 143,000 Eperon Finance Plc FRN EMTN Ser 2006-1 Tr 1 06/23.09.14 142,915.83 142,268.32 7.91 EUR 71,000 Espaccio Securities Plc FRN EMTN Ser 2006-1 Tr 1 06/23.09.14 70,958.22 70,530.21 3.92 EUR 71,000 Greenstreet Struc Fin Prod Plc FRN EMTN Sen 06/23.09.14 70,958.22 70,501.81 3.92 EUR 71,000 Nimrod Capital Plc FRN EMTN Ser 2006-1 Tr 1 06/23.09.14 70,958.22 70,445.01 3.92 EUR 72,000 Opal Financial Products Plc FRN Ser 2006-1 06/23.09.14 71,957.63 71,228.39 3.96 EUR 72,000 Profile Finance Plc FRN EMTN Ser 2006-1 Tr 1 06/23.09.14 71,957.63 70,990.79 3.95 EUR 72,000 Recolte Securities Plc FRN Ser 2006-1 Tr 2 07/23.09.14 71,957.63 71,127.59 3.96 EUR 71,000 Silverstate Fin Inv Plc FRN Ser 2006-1 Tr 2 07/23.09.14 70,958.22 70,594.11 3.93 EUR 71,000 Vespucci Strut Fin Prod Plc FRN Ser 2006-1Tr 2 07/23.09.14 70,958.22 70,331.41 3.91 EUR 71,000 Vigado Capital Plc FRN Ser 2006-1 Tr 2 07/23.09.14 70,958.22 70,487.61 3.92 EUR 71,000 Voyce Investments Plc FRN EMTN 07/23.09.14 70,958.22 70,693.51 3.93 EUR 72,000 Waterford Cap Investments Plc FRN Ser 2006-1 07/23.09.14 71,957.63 71,077.19 3.95 EUR 71,000 Waves Fin Inv Plc FRN Ser 2006-1 Tr 2 07/23.09.14 70,958.22 70,480.51 3.92
Total investments in securities 1,426,160.19 1,416,832.72 78.80
Cash at banks 196,308.91 10.92
Other net assets/(liabilities) 184,962.60 10.28
Total 1,798,104.23 100.00

FUND PARTNERS CSOB Rastovy Plus SKK 3
Statement of investments and other net assets (in EUR) as at 30th September 2010
The accompanying notes are an integral part of these financial statements.
145
Currency Number / nominal value
Description Cost Market value % of total net assets
Investments in securities
Transferable securities admitted to an official stock exchange listing
Bonds
EUR 209,000 Amethyst Structured Fin Plc FRN Ser 2007-6 Tr 2 07/10.01.15 199,210.58 209,135.20 3.36 EUR 210,000 Beechwood Structured Fin Plc FRN Sen 2007-6 Tr 2 07/10.01.15 200,163.74 208,287.84 3.34 EUR 210,000 Brookfields Capital Plc FRN EMTN Ser 2007-6 Tr 2 07/10.01.15 200,163.74 208,917.84 3.35 EUR 210,000 Eperon Finance Plc FRN EMTN Ser 2007-6 Tr 2 07/10.01.15 200,163.74 208,980.84 3.35 EUR 210,000 Espaccio Securities Plc FRN EMTN Ser 2007-6 Tr 2 07/10.01.15 200,163.75 208,665.84 3.35 EUR 211,000 Greenstreet Struc Fin Prod Plc FRN EMTN Sen 07/10.01.15 201,116.91 209,575.10 3.36 EUR 500,000 Infinity Finance Plc FRN EMTN Ser 0704 05/10.01.14 488,355.21 489,773.45 7.86 EUR 210,000 Nimrod Capital Plc FRN EMTN Ser 2007-6 Tr 2 07/10.01.15 200,163.75 208,413.84 3.34 EUR 211,000 Opal Financial Prod Plc FRN EMTN Ser 2007-6 Tr 2 07/10.01.15 201,116.91 208,794.40 3.35 EUR 212,000 Profile Finance Plc FRN EMTN Ser 2007-6 Tr 2 07/10.01.15 202,070.07 209,084.35 3.35 EUR 211,000 Recolte Securities Plc FRN EMTN Ser 2007-6 Tr 2 07/10.01.15 201,116.91 208,499.00 3.34 EUR 500,000 Sierra Finance Plc FRN Ser 0704 05/10.01.14 480,275.21 482,073.45 7.73 EUR 210,000 Silverstate Fin Inv Plc FRN EMTN Ser 2007-6 Tr 2 07/10.01.15 200,163.75 208,854.84 3.35 EUR 500,000 Venice Finance Plc FRN Ser 0704 05/10.01.14 481,125.21 482,623.45 7.74 EUR 210,000 Vespucci Strut Fin Prod Plc FRN Ser 2007-6 Tr 2 07/10.01.15 200,163.75 208,077.84 3.34 EUR 211,000 Vigado Capital Plc FRN EMTN Ser 2007-6 Tr 2 07/10.01.15 201,116.91 209,532.90 3.36 EUR 210,000 Voyce Investments Plc FRN EMTN Ser 2007-6 Tr 2 07/10.01.15 200,163.75 209,148.84 3.36 EUR 211,000 Waterford Cap Investments Plc FRN Ser 2007-6 07/10.01.15 201,116.91 208,351.30 3.34 EUR 210,000 Waves Fin Inv Plc FRN Ser 2007-6 Tr 2 07/10.01.15 200,163.75 208,518.84 3.35 EUR 500,000 Zulma Finance Plc FRN Ser 0704 05/10.01.14 490,995.21 492,523.45 7.90
Total bonds 5,149,089.76 5,287,832.61 84.82
Other transferable securities
Bonds
EUR 465,000 D-Star Finance Plc FRN B Ser 2008-4 JanJul 09/10.03.14 465,581.01 466,881.11 7.49
Total bonds 465,581.01 466,881.11 7.49
Total investments in securities 5,614,670.77 5,754,713.72 92.31
Cash at banks 475,801.58 7.63
Other net assets/(liabilities) 3,760.26 0.06
Total 6,234,275.56 100.00

FUND PARTNERS CSOB Reality SKK 1
Statement of investments and other net assets (in EUR) as at 30th September 2010
The accompanying notes are an integral part of these financial statements.
146
Currency Number / nominal value
Description Cost Market value % of total net assets
Investments in securities
Transferable securities admitted to an official stock exchange listing
Bonds
EUR 617,000 Amethyst Structured Fin Plc FRN Ser 2006-1 Tr 1 06/23.09.14 591,580.95 617,236.50 7.76 EUR 622,000 Beechwood Structured Fin Plc FRN Ser 2006-1 Tr 1 06/23.09.14 596,366.70 616,764.81 7.75 EUR 621,000 Brookfields Capital Plc FRN EMTN Ser 2006-1 Tr 1 06/23.09.14 595,387.98 617,636.23 7.76 EUR 186,000 D-Star Finance Plc FRN EMTN Ser 2008-4 Tr1 08/23.03.14 186,325.21 186,703.64 2.35 EUR 621,000 Eperon Finance Plc FRN EMTN Ser 2006-1 Tr 1 06/23.09.14 595,387.45 617,822.53 7.76 EUR 311,000 Espaccio Securities Plc FRN EMTN Ser 2006-1 Tr 1 06/23.09.14 298,163.26 308,942.21 3.88 EUR 311,000 Greenstreet Struc Fin Prod Plc FRN EMTN Sen 06/23.09.14 298,182.94 308,817.81 3.88 EUR 200,000 Infinity Finance Plc FRN EMTN Ser 0904 05/23.09.13 194,769.92 195,856.66 2.46 EUR 311,000 Nimrod Capital Plc FRN EMTN Ser 2006-1 Tr 1 06/23.09.14 298,178.02 308,569.01 3.88 EUR 312,000 Opal Financial Products Plc FRN Ser 2006-1 06/23.09.14 299,118.03 308,656.39 3.88 EUR 313,000 Profile Finance Plc FRN EMTN Ser 2006-1 Tr 1 06/23.09.14 300,099.53 308,612.77 3.88 EUR 312,000 Recolte Securities Plc FRN Ser 2006-1 Tr 2 07/23.09.14 299,120.01 308,219.59 3.87 EUR 200,000 Sierra Finance Plc FRN EMTN Ser 0904 04/23.09.13 191,309.92 192,776.66 2.42 EUR 310,000 Silverstate Fin Inv Plc FRN Ser 2006-1 Tr 2 07/23.09.14 297,225.14 308,227.82 3.87 EUR 200,000 Venice Finance Plc Ser 0904 FRN EMTN 04/23.09.13 191,889.92 192,996.66 2.43 EUR 311,000 Vespucci Strut Fin Prod Plc FRN Ser 2006-1Tr 2 07/23.09.14 298,159.31 308,071.41 3.87 EUR 311,000 Vigado Capital Plc FRN Ser 2006-1 Tr 2 07/23.09.14 298,170.15 308,755.61 3.88 EUR 310,000 Voyce Investments Plc FRN EMTN 07/23.09.14 297,224.15 308,661.82 3.88 EUR 312,000 Waterford Cap Investments Plc FRN Ser 2006-1 07/23.09.14 299,133.83 308,001.19 3.87 EUR 310,000 Waves Fin Inv Plc FRN Ser 2006-1 Tr 2 07/23.09.14 297,221.21 307,731.82 3.87 EUR 200,000 Zulma Finance Plc FRN EMTN Ser 04/23.09.13 195,789.92 196,956.66 2.47
Total investments in securities 6,918,803.55 7,136,017.80 89.67
Cash at banks 880,055.07 11.06
Other net assets/(liabilities) -58,021.85 -0.73
Total 7,958,051.02 100.00

FUND PARTNERS CSOB World Tree 3
Statement of investments and other net assets (in CZK) as at 30th September 2010
The accompanying notes are an integral part of these financial statements.
147
Currency Number / nominal value
Description Cost Market value % of total net assets
Investments in securities
Transferable securities admitted to an official stock exchange listing
Bonds
CZK 1,900,000 Amethyst Structured Fin Plc FRN Ser 2007-15 Tr 1 07/10.07.15 1,898,739.79 1,901,778.59 8.22 CZK 1,900,000 Beechwood Structured Fin Plc FRN Ser 2007-15 07/10.07.15 1,898,359.79 1,885,058.59 8.15 CZK 1,900,000 Brookfields Capital Plc FRN Ser 2007-15 Tr 1 07/10.07.15 1,898,494.79 1,890,758.59 8.18 CZK 1,900,000 Eperon Finance Plc FRN Ser 2007-15 Tr 1 07/10.07.15 1,898,439.79 1,891,328.59 8.18 CZK 950,000 Espaccio Securities Plc FRN Ser 2007-15 Tr 1 07/10.07.15 948,894.72 944,239.30 4.08 CZK 950,000 Greenstreet Struc Fin Prod Plc FRN Ser 2007-15 07/10.07.15 948,829.72 943,859.30 4.08 CZK 950,000 Nimrod Capital Plc FRN Ser 2007-15 Tr 1 07/10.07.15 948,934.72 943,099.30 4.08 CZK 950,000 Opal Financial Products Plc FRN Ser 2007-15 Tr 1 07/10.07.15 948,834.72 940,344.30 4.07 CZK 950,000 Profile Finance Plc FRN Ser 2007-15 Tr 1 07/10.07.15 948,679.72 937,209.30 4.05 CZK 950,000 Recolte Securities Plc FRN Ser 2007-15 Tr 1 07/10.07.15 948,764.72 939,014.30 4.06 CZK 950,000 Silverstate Fin Inv Plc FRN Ser 2007-15 Tr 1 07/10.07.15 949,049.72 945,094.30 4.09 CZK 950,000 Vespucci Strut Fin Prod Plc FRN Ser 2007-15 Tr 1 07/10.07.15 948,954.72 941,579.30 4.07 CZK 950,000 Vigado Capital Plc FRN Ser 2007-15 Tr 1 07/10.07.15 948,874.72 943,669.30 4.08 CZK 950,000 Voyce Investments Plc FRN Ser 2007-15 Tr 1 07/10.07.15 949,059.72 946,424.30 4.09 CZK 950,000 Waterford Cap Investments Plc FRN Ser 2007-15 07/10.07.15 948,779.72 938,349.30 4.06 CZK 950,000 Waves Fin Inv Plc FRN Ser 2007-15 Tr 1 07/10.07.15 948,979.72 943,574.30 4.08
Total investments in securities 18,980,670.80 18,875,380.96 81.62
Cash at banks 1,785,133.87 7.72
Other net assets/(liabilities) 2,466,744.48 10.66
Total 23,127,259.31 100.00

FUND PARTNERS CSOB World Tree SKK 1
Statement of investments and other net assets (in EUR) as at 30th September 2010
The accompanying notes are an integral part of these financial statements.
148
Currency Number / nominal value
Description Cost Market value % of total net assets
Investments in securities
Transferable securities admitted to an official stock exchange listing
Bonds
EUR 316,000 Amethyst Structured Fin Plc FRN Ser 2007-6 Tr 2 07/10.01.15 301,200.29 316,204.42 2.78 EUR 318,000 Beechwood Structured Fin Plc FRN Sen 2007-6 Tr 2 07/10.01.15 303,106.62 315,407.32 2.77 EUR 317,000 Brookfields Capital Plc FRN EMTN Ser 2007-6 Tr 2 07/10.01.15 302,153.46 315,366.46 2.77 EUR 318,000 Eperon Finance Plc FRN EMTN Ser 2007-6 Tr 2 07/10.01.15 303,106.63 316,456.72 2.78 EUR 319,000 Espaccio Securities Plc FRN EMTN Ser 2007-6 Tr 2 07/10.01.15 305,084.63 316,973.37 2.79 EUR 318,000 Greenstreet Struc Fin Prod Plc FRN EMTN Sen 07/10.01.15 304,156.17 315,852.52 2.78 EUR 900,000 Infinity Finance Plc FRN EMTN Ser 0704 05/10.01.14 878,013.93 881,592.21 7.75 EUR 318,000 Nimrod Capital Plc FRN EMTN Ser 2007-6 Tr 2 07/10.01.15 304,143.49 315,598.12 2.77 EUR 319,000 Opal Financial Prod Plc FRN EMTN Ser 2007-6 Tr 2 07/10.01.15 305,064.27 315,665.47 2.78 EUR 320,000 Profile Finance Plc FRN EMTN Ser 2007-6 Tr 2 07/10.01.15 305,994.32 315,599.01 2.77 EUR 319,000 Recolte Securities Plc FRN EMTN Ser 2007-6 Tr 2 07/10.01.15 305,079.98 315,218.87 2.77 EUR 900,000 Sierra Finance Plc FRN Ser 0704 05/10.01.14 863,183.93 867,732.21 7.63 EUR 317,000 Silverstate Fin Inv Plc FRN EMTN Ser 2007-6 Tr 2 07/10.01.15 303,228.50 315,271.36 2.77 EUR 900,000 Venice Finance Plc FRN Ser 0704 05/10.01.14 864,983.93 868,722.21 7.64 EUR 318,000 Vespucci Strut Fin Prod Plc FRN Ser 2007-6 Tr 2 07/10.01.15 304,167.80 315,089.32 2.77 EUR 319,000 Vigado Capital Plc FRN EMTN Ser 2007-6 Tr 2 07/10.01.15 305,071.91 316,781.97 2.79 EUR 317,000 Voyce Investments Plc FRN EMTN Ser 2007-6 Tr 2 07/10.01.15 303,201.47 315,715.16 2.78 EUR 319,000 Waterford Cap Investments Plc FRN Ser 2007-6 07/10.01.15 305,059.17 314,995.57 2.77 EUR 318,000 Waves Fin Inv Plc FRN Ser 2007-6 Tr 2 07/10.01.15 304,165.34 315,757.12 2.78 EUR 900,000 Zulma Finance Plc FRN Ser 0704 05/10.01.14 882,713.93 886,542.21 7.80
Total bonds 8,352,879.77 8,556,541.62 75.24
Other transferable securities
Bonds
EUR 836,000 D-Star Finance Plc FRN B Ser 2008-4 JanJul 09/10.03.14 837,399.19 839,381.95 7.38
Total bonds 837,399.19 839,381.95 7.38
Total investments in securities 9,190,278.96 9,395,923.57 82.62
Cash at banks 1,022,253.10 8.99
Other net assets/(liabilities) 954,776.64 8.39
Total 11,372,953.31 100.00
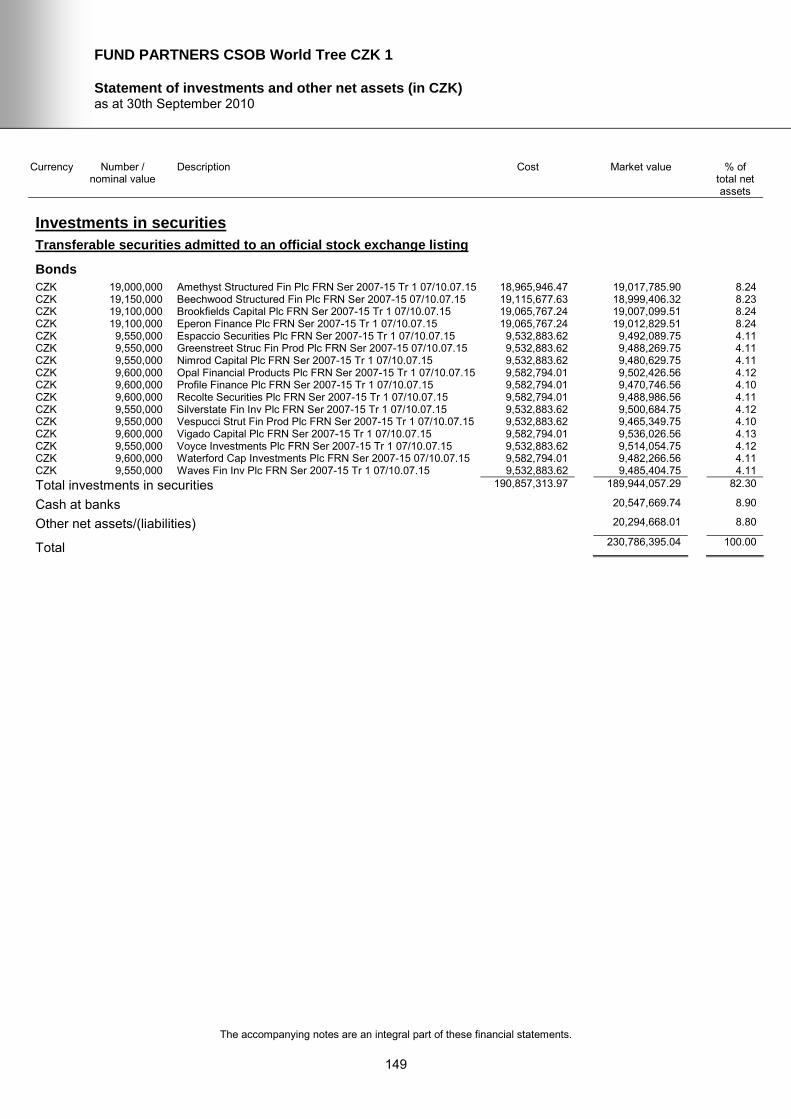
FUND PARTNERS CSOB World Tree CZK 1
Statement of investments and other net assets (in CZK) as at 30th September 2010
The accompanying notes are an integral part of these financial statements.
149
Currency Number / nominal value
Description Cost Market value % of total net assets
Investments in securities
Transferable securities admitted to an official stock exchange listing
Bonds
CZK 19,000,000 Amethyst Structured Fin Plc FRN Ser 2007-15 Tr 1 07/10.07.15 18,965,946.47 19,017,785.90 8.24 CZK 19,150,000 Beechwood Structured Fin Plc FRN Ser 2007-15 07/10.07.15 19,115,677.63 18,999,406.32 8.23 CZK 19,100,000 Brookfields Capital Plc FRN Ser 2007-15 Tr 1 07/10.07.15 19,065,767.24 19,007,099.51 8.24 CZK 19,100,000 Eperon Finance Plc FRN Ser 2007-15 Tr 1 07/10.07.15 19,065,767.24 19,012,829.51 8.24 CZK 9,550,000 Espaccio Securities Plc FRN Ser 2007-15 Tr 1 07/10.07.15 9,532,883.62 9,492,089.75 4.11 CZK 9,550,000 Greenstreet Struc Fin Prod Plc FRN Ser 2007-15 07/10.07.15 9,532,883.62 9,488,269.75 4.11 CZK 9,550,000 Nimrod Capital Plc FRN Ser 2007-15 Tr 1 07/10.07.15 9,532,883.62 9,480,629.75 4.11 CZK 9,600,000 Opal Financial Products Plc FRN Ser 2007-15 Tr 1 07/10.07.15 9,582,794.01 9,502,426.56 4.12 CZK 9,600,000 Profile Finance Plc FRN Ser 2007-15 Tr 1 07/10.07.15 9,582,794.01 9,470,746.56 4.10 CZK 9,600,000 Recolte Securities Plc FRN Ser 2007-15 Tr 1 07/10.07.15 9,582,794.01 9,488,986.56 4.11 CZK 9,550,000 Silverstate Fin Inv Plc FRN Ser 2007-15 Tr 1 07/10.07.15 9,532,883.62 9,500,684.75 4.12 CZK 9,550,000 Vespucci Strut Fin Prod Plc FRN Ser 2007-15 Tr 1 07/10.07.15 9,532,883.62 9,465,349.75 4.10 CZK 9,600,000 Vigado Capital Plc FRN Ser 2007-15 Tr 1 07/10.07.15 9,582,794.01 9,536,026.56 4.13 CZK 9,550,000 Voyce Investments Plc FRN Ser 2007-15 Tr 1 07/10.07.15 9,532,883.62 9,514,054.75 4.12 CZK 9,600,000 Waterford Cap Investments Plc FRN Ser 2007-15 07/10.07.15 9,582,794.01 9,482,266.56 4.11 CZK 9,550,000 Waves Fin Inv Plc FRN Ser 2007-15 Tr 1 07/10.07.15 9,532,883.62 9,485,404.75 4.11
Total investments in securities 190,857,313.97 189,944,057.29 82.30
Cash at banks 20,547,669.74 8.90
Other net assets/(liabilities) 20,294,668.01 8.80
Total 230,786,395.04 100.00

FUND PARTNERS World Tree USD 1
Statement of investments and other net assets (in USD) as at 30th September 2010
The accompanying notes are an integral part of these financial statements.
150
Currency Number / nominal value
Description Cost Market value % of total net assets
Investments in securities
Transferable securities admitted to an official stock exchange listing
Bonds
USD 818,000 Amethyst Structured Fin Plc FRN Ser 2007-7 Tr 2 07/10.01.15 817,153.90 819,168.76 7.97 USD 822,000 Beechwood Structured Fin Plc FRN Ser 07-7 Tr 2 07/10.01.15 821,149.76 815,940.87 7.94 USD 820,000 Brookfields Capital Plc FRN EMTN Ser 2007-7 Tr 2 07/10.01.15 819,151.83 816,415.61 7.94 USD 822,000 Eperon Finance Plc FRN EMTN Ser 2007-7 Tr 2 07/10.01.15 821,149.76 818,653.47 7.96 USD 412,000 Espaccio Securities Plc FRN EMTN Ser 07-7 Tr 2 07/10.01.15 411,573.86 409,704.67 3.99 USD 412,000 Greenstreet Struc Fin Prod Plc FRN EMTN Sen Tr 2 07/10.01.15 411,573.86 409,539.87 3.98 USD 412,000 Nimrod Capital Plc FRN EMTN Ser 2007-7 Tr 2 07/10.01.15 411,573.86 409,210.27 3.98 USD 412,000 Opal Financial Products Plc FRN Ser 2007-7 Tr 2 07/10.01.15 411,573.86 408,015.47 3.97 USD 414,000 Profile Finance Plc FRN EMTN Ser 2007-7 Tr 2 07/10.01.15 413,571.79 408,629.93 3.98 USD 412,000 Recolte Securities Plc FRN Ser 2007-7 Tr 2 07/10.01.15 411,573.86 407,438.67 3.96 USD 410,000 Silverstate Fin Inv Plc FRN Ser 2007-7 Tr 2 07/10.01.15 409,575.93 408,084.81 3.97 USD 412,000 Vespucci Strut Fin Prod Plc FRN Ser 2007-7 Tr 2 07/10.01.15 411,573.86 408,551.07 3.97 USD 412,000 Vigado Capital Plc FRN Ser 2007-7 Tr 2 07/10.01.15 411,573.86 409,457.47 3.98 USD 410,000 Voyce Investments Plc FRN EMTN Ser 2007-7 Tr 2 07/10.01.15 409,575.93 408,658.81 3.98 USD 412,000 Waterford Cap Investments Plc FRN Ser 2007-7 07/10.01.15 411,573.86 407,150.27 3.96 USD 410,000 Waves Fin Inv Plc FRN Ser 2007-7 Tr 2 07/10.01.15 409,575.93 407,428.81 3.96
Total investments in securities 8,213,495.71 8,172,048.83 79.49
Cash at banks 929,022.03 9.04
Other net assets/(liabilities) 1,179,475.27 11.47
Total 10,280,546.13 100.00

FUND PARTNERS CSOB World Tree 4
Statement of investments and other net assets (in CZK) as at 30th September 2010
The accompanying notes are an integral part of these financial statements.
151
Currency Number / nominal value
Description Cost Market value % of total net assets
Investments in securities
Transferable securities admitted to an official stock exchange listing
Bonds
CZK 12,700,000 Amethyst Structured Fin Plc FRN Ser 2007-8 Tr 1 07/23.03.15 12,697,982.51 12,704,250.69 8.22 CZK 12,800,000 Beechwood Structured Fin Plc FRN Ser 2007-8 Tr 1 07/23.03.15 12,797,966.63 12,691,644.16 8.22 CZK 12,800,000 Brookfields Capital Plc FRN Ser 2007-8 Tr 1 07/23.03.15 12,797,966.63 12,730,044.16 8.24 CZK 12,800,000 Eperon Finance Plc FRN Ser 2007-8 Tr 1 07/23.03.15 12,797,966.63 12,733,884.16 8.24 CZK 6,400,000 Espaccio Securities Plc FRN Ser 2007-8 Tr 1 07/23.03.15 6,398,983.31 6,357,342.08 4.12 CZK 6,400,000 Greenstreet Struc Fin Prod Plc FRN Ser 2007-8 07/23.03.15 6,398,983.31 6,354,782.08 4.11 CZK 6,400,000 Nimrod Capital Plc FRN Ser 2007-8 Tr 1 07/23.03.15 6,398,983.31 6,349,662.08 4.11 CZK 6,450,000 Opal Financial Products Plc FRN Ser 2007-8 Tr 1 07/23.03.15 6,448,975.37 6,380,563.82 4.13 CZK 6,450,000 Profile Finance Plc FRN Ser 2007-8 Tr 1 07/23.03.15 6,448,975.37 6,359,278.82 4.12 CZK 6,450,000 Recolte Securities Plc FRN Ser 2007-8 Tr 1 07/23.03.15 6,448,975.37 6,371,533.82 4.13 CZK 6,400,000 Silverstate Fin Inv Plc FRN Ser 2007-8 07/23.03.15 6,398,983.31 6,363,102.08 4.12 CZK 6,400,000 Vespucci Strut Fin Prod Plc FRN Ser 2007-8 Tr 1 07/23.03.15 6,398,983.31 6,339,422.08 4.10 CZK 6,400,000 Vigado Capital Plc FRN Ser 2007-8 Tr 1 07/23.03.15 6,398,983.31 6,353,502.08 4.11 CZK 6,400,000 Voyce Investments Plc FRN Ser 2007-8 Tr 1 07/23.03.15 6,398,983.31 6,372,062.08 4.13 CZK 6,450,000 Waterford Cap Investments Plc FRN Ser 07-8 Tr 1 07/23.03.15 6,448,975.37 6,367,018.82 4.12 CZK 6,400,000 Waves Fin Inv Plc FRN Ser 2007-8 Tr 1 07/23.03.15 6,398,983.31 6,352,862.08 4.11
Total investments in securities 128,079,650.36 127,180,955.09 82.33
Cash at banks 16,262,161.09 10.53
Other net assets/(liabilities) 11,028,463.32 7.14
Total 154,471,579.50 100.00

FUND PARTNERS CSOB World Tree 5
Statement of investments and other net assets (in CZK) as at 30th September 2010
The accompanying notes are an integral part of these financial statements.
152
Currency Number / nominal value
Description Cost Market value % of total net assets
Investments in securities
Transferable securities admitted to an official stock exchange listing
Bonds
CZK 7,950,000 Amethyst Structured Fin Plc FRN Ser 2007-8 Tr 1 07/23.03.15 7,948,728.00 7,952,660.87 8.25 CZK 8,000,000 Beechwood Structured Fin Plc FRN Ser 2007-8 Tr 1 07/23.03.15 7,998,720.00 7,932,277.60 8.23 CZK 8,000,000 Brookfields Capital Plc FRN Ser 2007-8 Tr 1 07/23.03.15 7,998,720.00 7,956,277.60 8.25 CZK 8,000,000 Eperon Finance Plc FRN Ser 2007-8 Tr 1 07/23.03.15 7,998,720.00 7,958,677.60 8.26 CZK 4,000,000 Espaccio Securities Plc FRN Ser 2007-8 Tr 1 07/23.03.15 3,999,360.00 3,973,338.80 4.12 CZK 4,000,000 Greenstreet Struc Fin Prod Plc FRN Ser 2007-8 07/23.03.15 3,999,360.00 3,971,738.80 4.12 CZK 4,000,000 Nimrod Capital Plc FRN Ser 2007-8 Tr 1 07/23.03.15 3,999,360.00 3,968,538.80 4.12 CZK 4,000,000 Opal Financial Products Plc FRN Ser 2007-8 Tr 1 07/23.03.15 3,999,360.00 3,956,938.80 4.10 CZK 4,000,000 Profile Finance Plc FRN Ser 2007-8 Tr 1 07/23.03.15 3,999,360.00 3,943,738.80 4.09 CZK 4,000,000 Recolte Securities Plc FRN Ser 2007-8 Tr 1 07/23.03.15 3,999,360.00 3,951,338.80 4.10 CZK 4,000,000 Silverstate Fin Inv Plc FRN Ser 2007-8 07/23.03.15 3,999,360.00 3,976,938.80 4.13 CZK 4,000,000 Vespucci Strut Fin Prod Plc FRN Ser 2007-8 Tr 1 07/23.03.15 3,999,360.00 3,962,138.80 4.11 CZK 4,000,000 Vigado Capital Plc FRN Ser 2007-8 Tr 1 07/23.03.15 3,999,360.00 3,970,938.80 4.12 CZK 4,000,000 Voyce Investments Plc FRN Ser 2007-8 Tr 1 07/23.03.15 3,999,360.00 3,982,538.80 4.13 CZK 4,000,000 Waterford Cap Investments Plc FRN Ser 07-8 Tr 1 07/23.03.15 3,999,360.00 3,948,538.80 4.10 CZK 4,000,000 Waves Fin Inv Plc FRN Ser 2007-8 Tr 1 07/23.03.15 3,999,360.00 3,970,538.80 4.12
Total investments in securities 79,937,208.00 79,377,159.27 82.35
Cash at banks 10,263,599.80 10.65
Other net assets/(liabilities) 6,754,111.21 7.00
Total 96,394,870.28 100.00

FUND PARTNERS CSOB World Tree 6
Statement of investments and other net assets (in CZK) as at 30th September 2010
The accompanying notes are an integral part of these financial statements.
153
Currency Number / nominal value
Description Cost Market value % of total net assets
Investments in securities
Transferable securities admitted to an official stock exchange listing
Bonds
CZK 4,700,000 Amethyst Structured Fin Plc FRN Ser 2007-15 Tr 1 07/10.07.15 4,685,094.28 4,704,399.67 8.58 CZK 4,700,000 Beechwood Structured Fin Plc FRN Ser 2007-15 07/10.07.15 4,685,094.28 4,663,039.67 8.50 CZK 4,700,000 Brookfields Capital Plc FRN Ser 2007-15 Tr 1 07/10.07.15 4,685,094.28 4,677,139.67 8.53 CZK 4,700,000 Eperon Finance Plc FRN Ser 2007-15 Tr 1 07/10.07.15 4,685,094.28 4,678,549.67 8.53 CZK 2,350,000 Espaccio Securities Plc FRN Ser 2007-15 Tr 1 07/10.07.15 2,342,547.13 2,335,749.83 4.26 CZK 2,350,000 Greenstreet Struc Fin Prod Plc FRN Ser 2007-15 07/10.07.15 2,342,547.13 2,334,809.83 4.26 CZK 2,350,000 Nimrod Capital Plc FRN Ser 2007-15 Tr 1 07/10.07.15 2,342,547.13 2,332,929.83 4.25 CZK 2,350,000 Opal Financial Products Plc FRN Ser 2007-15 Tr 1 07/10.07.15 2,342,547.13 2,326,114.83 4.24 CZK 2,350,000 Profile Finance Plc FRN Ser 2007-15 Tr 1 07/10.07.15 2,342,547.13 2,318,359.83 4.23 CZK 2,350,000 Recolte Securities Plc FRN Ser 2007-15 Tr 1 07/10.07.15 2,342,547.13 2,322,824.83 4.24 CZK 2,350,000 Silverstate Fin Inv Plc FRN Ser 2007-15 Tr 1 07/10.07.15 2,342,547.13 2,337,864.83 4.26 CZK 2,350,000 Vespucci Strut Fin Prod Plc FRN Ser 2007-15 Tr 1 07/10.07.15 2,342,547.13 2,329,169.83 4.25 CZK 2,350,000 Vigado Capital Plc FRN Ser 2007-15 Tr 1 07/10.07.15 2,342,547.13 2,334,339.83 4.26 CZK 2,350,000 Voyce Investments Plc FRN Ser 2007-15 Tr 1 07/10.07.15 2,342,547.13 2,341,154.83 4.27 CZK 2,350,000 Waterford Cap Investments Plc FRN Ser 2007-15 07/10.07.15 2,342,547.13 2,321,179.83 4.23 CZK 2,350,000 Waves Fin Inv Plc FRN Ser 2007-15 Tr 1 07/10.07.15 2,342,547.13 2,334,104.83 4.26
Total investments in securities 46,850,942.68 46,691,731.64 85.15
Cash at banks 5,677,881.35 10.35
Other net assets/(liabilities) 2,463,971.11 4.50
Total 54,833,584.10 100.00

FUND PARTNERS CSOB World Tree 7
Statement of investments and other net assets (in CZK) as at 30th September 2010
The accompanying notes are an integral part of these financial statements.
154
Currency Number / nominal value
Description Cost Market value % of total net assets
Investments in securities
Transferable securities admitted to an official stock exchange listing
Bonds
CZK 18,150,000 Amethyst Structured Fin Plc FRN Ser 2007-15 Tr 1 07/10.07.15 18,116,294.59 18,166,990.22 8.50 CZK 18,250,000 Beechwood Structured Fin Plc FRN Ser 2007-15 07/10.07.15 18,216,108.89 18,106,483.83 8.47 CZK 18,200,000 Brookfields Capital Plc FRN Ser 2007-15 Tr 1 07/10.07.15 18,166,201.74 18,111,477.02 8.47 CZK 18,250,000 Eperon Finance Plc FRN Ser 2007-15 Tr 1 07/10.07.15 18,216,108.89 18,166,708.83 8.50 CZK 9,150,000 Espaccio Securities Plc FRN Ser 2007-15 Tr 1 07/10.07.15 9,133,008.01 9,094,515.32 4.25 CZK 9,150,000 Greenstreet Struc Fin Prod Plc FRN Ser 2007-15 07/10.07.15 9,133,008.01 9,090,855.32 4.25 CZK 9,150,000 Nimrod Capital Plc FRN Ser 2007-15 Tr 1 07/10.07.15 9,133,008.01 9,083,535.32 4.25 CZK 9,150,000 Opal Financial Products Plc FRN Ser 2007-15 Tr 1 07/10.07.15 9,133,008.01 9,057,000.32 4.24 CZK 9,200,000 Profile Finance Plc FRN Ser 2007-15 Tr 1 07/10.07.15 9,182,915.16 9,076,132.12 4.25 CZK 9,150,000 Recolte Securities Plc FRN Ser 2007-15 Tr 1 07/10.07.15 9,133,008.01 9,044,190.32 4.23 CZK 9,100,000 Silverstate Fin Inv Plc FRN Ser 2007-15 Tr 1 07/10.07.15 9,083,100.87 9,053,008.51 4.23 CZK 9,100,000 Vespucci Strut Fin Prod Plc FRN Ser 2007-15 Tr 1 07/10.07.15 9,083,100.87 9,019,338.51 4.22 CZK 9,150,000 Vigado Capital Plc FRN Ser 2007-15 Tr 1 07/10.07.15 9,133,008.01 9,089,025.32 4.25 CZK 9,100,000 Voyce Investments Plc FRN Ser 2007-15 Tr 1 07/10.07.15 9,083,100.87 9,065,748.51 4.24 CZK 9,150,000 Waterford Cap Investments Plc FRN Ser 2007-15 07/10.07.15 9,133,008.01 9,037,785.32 4.23 CZK 9,100,000 Waves Fin Inv Plc FRN Ser 2007-15 Tr 1 07/10.07.15 9,083,100.87 9,038,448.51 4.23
Total investments in securities 182,161,088.82 181,301,243.30 84.81
Cash at banks 20,503,657.34 9.59
Other net assets/(liabilities) 11,976,728.18 5.60
Total 213,781,628.82 100.00

FUND PARTNERS CSOB World Tree 8
Statement of investments and other net assets (in CZK) as at 30th September 2010
The accompanying notes are an integral part of these financial statements.
155
Currency Number / nominal value
Description Cost Market value % of total net assets
Investments in securities
Transferable securities admitted to an official stock exchange listing
Bonds
CZK 12,350,000 Amethyst Structured Fin Plc FRN Ser 2007-15 Tr 1 07/10.07.15 12,321,519.23 12,361,560.83 8.42 CZK 12,450,000 Beechwood Structured Fin Plc FRN Ser 2007-15 07/10.07.15 12,421,288.62 12,352,094.44 8.41 CZK 12,400,000 Brookfields Capital Plc FRN Ser 2007-15 Tr 1 07/10.07.15 12,371,403.93 12,339,687.64 8.41 CZK 12,400,000 Eperon Finance Plc FRN Ser 2007-15 Tr 1 07/10.07.15 12,371,403.93 12,343,407.64 8.41 CZK 6,200,000 Espaccio Securities Plc FRN Ser 2007-15 Tr 1 07/10.07.15 6,185,701.96 6,162,403.82 4.20 CZK 6,200,000 Greenstreet Struc Fin Prod Plc FRN Ser 2007-15 07/10.07.15 6,185,701.96 6,159,923.82 4.20 CZK 6,200,000 Nimrod Capital Plc FRN Ser 2007-15 Tr 1 07/10.07.15 6,185,701.96 6,154,963.82 4.19 CZK 6,200,000 Opal Financial Products Plc FRN Ser 2007-15 Tr 1 07/10.07.15 6,185,701.96 6,136,983.82 4.18 CZK 6,250,000 Profile Finance Plc FRN Ser 2007-15 Tr 1 07/10.07.15 6,235,586.66 6,165,850.62 4.20 CZK 6,200,000 Recolte Securities Plc FRN Ser 2007-15 Tr 1 07/10.07.15 6,185,701.96 6,128,303.82 4.17 CZK 6,200,000 Silverstate Fin Inv Plc FRN Ser 2007-15 Tr 1 07/10.07.15 6,185,701.96 6,167,983.82 4.20 CZK 6,200,000 Vespucci Strut Fin Prod Plc FRN Ser 2007-15 Tr 1 07/10.07.15 6,185,701.96 6,145,043.82 4.19 CZK 6,200,000 Vigado Capital Plc FRN Ser 2007-15 Tr 1 07/10.07.15 6,185,701.96 6,158,683.82 4.20 CZK 6,200,000 Voyce Investments Plc FRN Ser 2007-15 Tr 1 07/10.07.15 6,185,701.96 6,176,663.82 4.21 CZK 6,200,000 Waterford Cap Investments Plc FRN Ser 2007-15 07/10.07.15 6,185,701.96 6,123,963.82 4.17 CZK 6,200,000 Waves Fin Inv Plc FRN Ser 2007-15 Tr 1 07/10.07.15 6,185,701.96 6,158,063.82 4.20
Total investments in securities 123,763,923.93 123,235,583.19 83.96
Cash at banks 13,130,197.63 8.95
Other net assets/(liabilities) 10,413,595.71 7.09
Total 146,779,376.53 100.00

FUND PARTNERS CSOB World Tree EUR 1
Statement of investments and other net assets (in EUR) as at 30th September 2010
The accompanying notes are an integral part of these financial statements.
156
Currency Number / nominal value
Description Cost Market value % of total net assets
Investments in securities
Transferable securities admitted to an official stock exchange listing
Bonds
EUR 243,000 Amethyst Structured Fin Plc FRN Ser 2006-1 Tr 1 06/23.09.14 242,929.53 243,093.14 6.80 EUR 244,000 Beechwood Structured Fin Plc FRN Ser 2006-1 Tr 1 06/23.09.14 243,929.24 241,946.32 6.77 EUR 244,000 Brookfields Capital Plc FRN EMTN Ser 2006-1 Tr 1 06/23.09.14 243,929.24 242,678.32 6.79 EUR 93,000 D-Star Finance Plc FRN EMTN Ser 2008-4 Tr1 08/23.03.14 93,162.60 93,351.82 2.61 EUR 244,000 Eperon Finance Plc FRN EMTN Ser 2006-1 Tr 1 06/23.09.14 243,929.24 242,751.52 6.79 EUR 122,000 Espaccio Securities Plc FRN EMTN Ser 2006-1 Tr 1 06/23.09.14 121,964.62 121,192.76 3.39 EUR 122,000 Greenstreet Struc Fin Prod Plc FRN EMTN Sen 06/23.09.14 121,964.62 121,143.96 3.39 EUR 100,000 Infinity Finance Plc FRN EMTN Ser 0904 05/23.09.13 97,384.96 97,928.33 2.74 EUR 122,000 Nimrod Capital Plc FRN EMTN Ser 2006-1 Tr 1 06/23.09.14 121,964.62 121,046.36 3.39 EUR 123,000 Opal Financial Products Plc FRN Ser 2006-1 06/23.09.14 122,964.33 121,681.84 3.41 EUR 123,000 Profile Finance Plc FRN EMTN Ser 2006-1 Tr 1 06/23.09.14 122,964.33 121,275.94 3.40 EUR 123,000 Recolte Securities Plc FRN Ser 2006-1 Tr 2 07/23.09.14 122,964.33 121,509.64 3.40 EUR 100,000 Sierra Finance Plc FRN EMTN Ser 0904 04/23.09.13 95,654.96 96,388.33 2.70 EUR 122,000 Silverstate Fin Inv Plc FRN Ser 2006-1 Tr 2 07/23.09.14 121,964.62 121,302.56 3.40 EUR 100,000 Venice Finance Plc Ser 0904 FRN EMTN 04/23.09.13 95,944.96 96,498.33 2.70 EUR 122,000 Vespucci Strut Fin Prod Plc FRN Ser 2006-1Tr 2 07/23.09.14 121,964.62 120,851.16 3.38 EUR 122,000 Vigado Capital Plc FRN Ser 2006-1 Tr 2 07/23.09.14 121,964.62 121,119.56 3.39 EUR 122,000 Voyce Investments Plc FRN EMTN 07/23.09.14 121,964.62 121,473.36 3.40 EUR 123,000 Waterford Cap Investments Plc FRN Ser 2006-1 07/23.09.14 122,964.33 121,423.54 3.40 EUR 122,000 Waves Fin Inv Plc FRN Ser 2006-1 Tr 2 07/23.09.14 121,964.62 121,107.36 3.39 EUR 100,000 Zulma Finance Plc FRN EMTN Ser 04/23.09.13 97,894.96 98,478.33 2.76
Total investments in securities 2,922,333.97 2,908,242.48 81.40
Cash at banks 361,188.90 10.11
Other net assets/(liabilities) 303,481.41 8.49
Total 3,572,912.79 100.00

FUND PARTNERS CSOB World Tree 9
Statement of investments and other net assets (in CZK) as at 30th September 2010
The accompanying notes are an integral part of these financial statements.
157
Currency Number / nominal value
Description Cost Market value % of total net assets
Investments in securities
Transferable securities admitted to an official stock exchange listing
Bonds
CZK 8,900,000 Amethyst Structured Fin Plc FRN Ser 2007-15 Tr 1 07/10.07.15 8,883,861.72 8,908,331.29 8.32 CZK 8,950,000 Beechwood Structured Fin Plc FRN Ser 2007-15 07/10.07.15 8,933,771.05 8,879,618.09 8.30 CZK 8,950,000 Brookfields Capital Plc FRN Ser 2007-15 Tr 1 07/10.07.15 8,933,771.05 8,906,468.09 8.32 CZK 8,950,000 Eperon Finance Plc FRN Ser 2007-15 Tr 1 07/10.07.15 8,933,771.05 8,909,153.09 8.32 CZK 4,450,000 Espaccio Securities Plc FRN Ser 2007-15 Tr 1 07/10.07.15 4,441,930.85 4,423,015.64 4.13 CZK 4,450,000 Greenstreet Struc Fin Prod Plc FRN Ser 2007-15 07/10.07.15 4,441,930.85 4,421,235.64 4.13 CZK 4,450,000 Nimrod Capital Plc FRN Ser 2007-15 Tr 1 07/10.07.15 4,441,930.85 4,417,675.64 4.13 CZK 4,450,000 Opal Financial Products Plc FRN Ser 2007-15 Tr 1 07/10.07.15 4,441,930.85 4,404,770.64 4.12 CZK 4,500,000 Profile Finance Plc FRN Ser 2007-15 Tr 1 07/10.07.15 4,491,840.19 4,439,412.45 4.15 CZK 4,500,000 Recolte Securities Plc FRN Ser 2007-15 Tr 1 07/10.07.15 4,491,840.19 4,447,962.45 4.16 CZK 4,450,000 Silverstate Fin Inv Plc FRN Ser 2007-15 Tr 1 07/10.07.15 4,441,930.85 4,427,020.64 4.14 CZK 4,450,000 Vespucci Strut Fin Prod Plc FRN Ser 2007-15 Tr 1 07/10.07.15 4,441,930.85 4,410,555.64 4.12 CZK 4,500,000 Vigado Capital Plc FRN Ser 2007-15 Tr 1 07/10.07.15 4,491,840.19 4,470,012.45 4.18 CZK 4,450,000 Voyce Investments Plc FRN Ser 2007-15 Tr 1 07/10.07.15 4,441,930.85 4,433,250.64 4.14 CZK 4,500,000 Waterford Cap Investments Plc FRN Ser 2007-15 07/10.07.15 4,491,840.19 4,444,812.45 4.15 CZK 4,450,000 Waves Fin Inv Plc FRN Ser 2007-15 Tr 1 07/10.07.15 4,441,930.85 4,419,900.64 4.13
Total investments in securities 89,187,982.43 88,763,195.48 82.94
Cash at banks 9,996,886.49 9.34
Other net assets/(liabilities) 8,263,575.04 7.72
Total 107,023,657.01 100.00
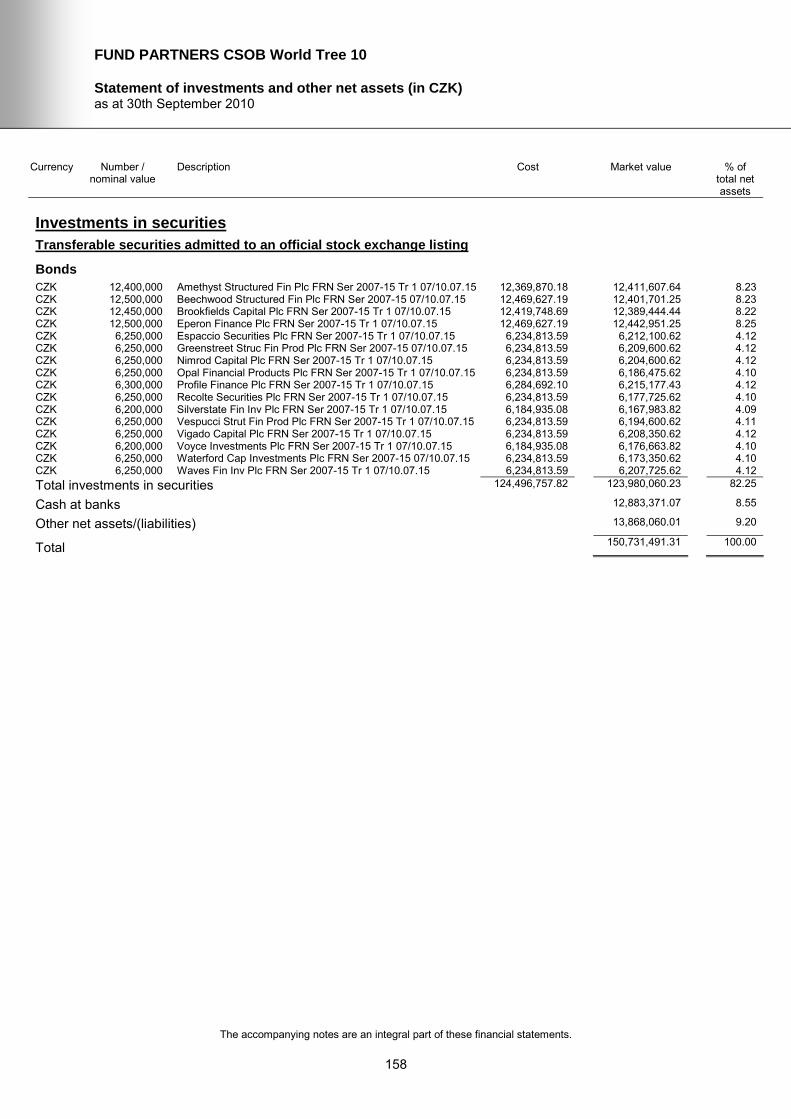
FUND PARTNERS CSOB World Tree 10
Statement of investments and other net assets (in CZK) as at 30th September 2010
The accompanying notes are an integral part of these financial statements.
158
Currency Number / nominal value
Description Cost Market value % of total net assets
Investments in securities
Transferable securities admitted to an official stock exchange listing
Bonds
CZK 12,400,000 Amethyst Structured Fin Plc FRN Ser 2007-15 Tr 1 07/10.07.15 12,369,870.18 12,411,607.64 8.23 CZK 12,500,000 Beechwood Structured Fin Plc FRN Ser 2007-15 07/10.07.15 12,469,627.19 12,401,701.25 8.23 CZK 12,450,000 Brookfields Capital Plc FRN Ser 2007-15 Tr 1 07/10.07.15 12,419,748.69 12,389,444.44 8.22 CZK 12,500,000 Eperon Finance Plc FRN Ser 2007-15 Tr 1 07/10.07.15 12,469,627.19 12,442,951.25 8.25 CZK 6,250,000 Espaccio Securities Plc FRN Ser 2007-15 Tr 1 07/10.07.15 6,234,813.59 6,212,100.62 4.12 CZK 6,250,000 Greenstreet Struc Fin Prod Plc FRN Ser 2007-15 07/10.07.15 6,234,813.59 6,209,600.62 4.12 CZK 6,250,000 Nimrod Capital Plc FRN Ser 2007-15 Tr 1 07/10.07.15 6,234,813.59 6,204,600.62 4.12 CZK 6,250,000 Opal Financial Products Plc FRN Ser 2007-15 Tr 1 07/10.07.15 6,234,813.59 6,186,475.62 4.10 CZK 6,300,000 Profile Finance Plc FRN Ser 2007-15 Tr 1 07/10.07.15 6,284,692.10 6,215,177.43 4.12 CZK 6,250,000 Recolte Securities Plc FRN Ser 2007-15 Tr 1 07/10.07.15 6,234,813.59 6,177,725.62 4.10 CZK 6,200,000 Silverstate Fin Inv Plc FRN Ser 2007-15 Tr 1 07/10.07.15 6,184,935.08 6,167,983.82 4.09 CZK 6,250,000 Vespucci Strut Fin Prod Plc FRN Ser 2007-15 Tr 1 07/10.07.15 6,234,813.59 6,194,600.62 4.11 CZK 6,250,000 Vigado Capital Plc FRN Ser 2007-15 Tr 1 07/10.07.15 6,234,813.59 6,208,350.62 4.12 CZK 6,200,000 Voyce Investments Plc FRN Ser 2007-15 Tr 1 07/10.07.15 6,184,935.08 6,176,663.82 4.10 CZK 6,250,000 Waterford Cap Investments Plc FRN Ser 2007-15 07/10.07.15 6,234,813.59 6,173,350.62 4.10 CZK 6,250,000 Waves Fin Inv Plc FRN Ser 2007-15 Tr 1 07/10.07.15 6,234,813.59 6,207,725.62 4.12
Total investments in securities 124,496,757.82 123,980,060.23 82.25
Cash at banks 12,883,371.07 8.55
Other net assets/(liabilities) 13,868,060.01 9.20
Total 150,731,491.31 100.00

FUND PARTNERS CSOB Strom SKK 2
Statement of investments and other net assets (in EUR) as at 30th September 2010
The accompanying notes are an integral part of these financial statements.
159
Currency Number / nominal value
Description Cost Market value % of total net assets
Investments in securities
Transferable securities admitted to an official stock exchange listing
Bonds
EUR 145,000 Amethyst Structured Fin Plc FRN Ser 2006-1 Tr 1 06/23.09.14 138,851.12 145,055.58 3.69 EUR 146,000 Beechwood Structured Fin Plc FRN Ser 2006-1 Tr 1 06/23.09.14 139,808.72 144,771.16 3.68 EUR 146,000 Brookfields Capital Plc FRN EMTN Ser 2006-1 Tr 1 06/23.09.14 139,808.71 145,209.16 3.69 EUR 186,000 D-Star Finance Plc FRN EMTN Ser 2008-4 Tr1 08/23.03.14 186,325.20 186,703.64 4.74 EUR 146,000 Eperon Finance Plc FRN EMTN Ser 2006-1 Tr 1 06/23.09.14 139,808.72 145,252.96 3.69 EUR 146,000 Espaccio Securities Plc FRN EMTN Ser 2006-1 Tr 1 06/23.09.14 139,808.72 145,033.96 3.69 EUR 146,000 Greenstreet Struc Fin Prod Plc FRN EMTN Sen 06/23.09.14 139,808.72 144,975.56 3.68 EUR 200,000 Infinity Finance Plc FRN EMTN Ser 0904 05/23.09.13 194,769.92 195,856.66 4.98 EUR 146,000 Nimrod Capital Plc FRN EMTN Ser 2006-1 Tr 1 06/23.09.14 139,808.72 144,858.76 3.68 EUR 147,000 Opal Financial Products Plc FRN Ser 2006-1 06/23.09.14 140,766.31 145,424.64 3.70 EUR 147,000 Profile Finance Plc FRN EMTN Ser 2006-1 Tr 1 06/23.09.14 140,766.31 144,939.54 3.68 EUR 147,000 Recolte Securities Plc FRN Ser 2006-1 Tr 2 07/23.09.14 140,766.31 145,218.84 3.69 EUR 200,000 Sierra Finance Plc FRN EMTN Ser 0904 04/23.09.13 191,309.92 192,776.66 4.90 EUR 146,000 Silverstate Fin Inv Plc FRN Ser 2006-1 Tr 2 07/23.09.14 139,808.72 145,165.36 3.69 EUR 200,000 Venice Finance Plc Ser 0904 FRN EMTN 04/23.09.13 191,889.92 192,996.66 4.90 EUR 146,000 Vespucci Strut Fin Prod Plc FRN Ser 2006-1Tr 2 07/23.09.14 139,808.71 144,625.16 3.68 EUR 146,000 Vigado Capital Plc FRN Ser 2006-1 Tr 2 07/23.09.14 139,808.72 144,946.36 3.68 EUR 146,000 Voyce Investments Plc FRN EMTN 07/23.09.14 139,808.72 145,369.76 3.69 EUR 147,000 Waterford Cap Investments Plc FRN Ser 2006-1 07/23.09.14 140,766.31 145,115.94 3.69 EUR 146,000 Waves Fin Inv Plc FRN Ser 2006-1 Tr 2 07/23.09.14 139,808.72 144,931.76 3.68 EUR 200,000 Zulma Finance Plc FRN EMTN Ser 04/23.09.13 195,789.92 196,956.66 5.01
Total investments in securities 3,199,897.14 3,286,184.78 83.51
Cash at banks 403,270.09 10.25
Other net assets/(liabilities) 245,615.69 6.24
Total 3,935,070.56 100.00
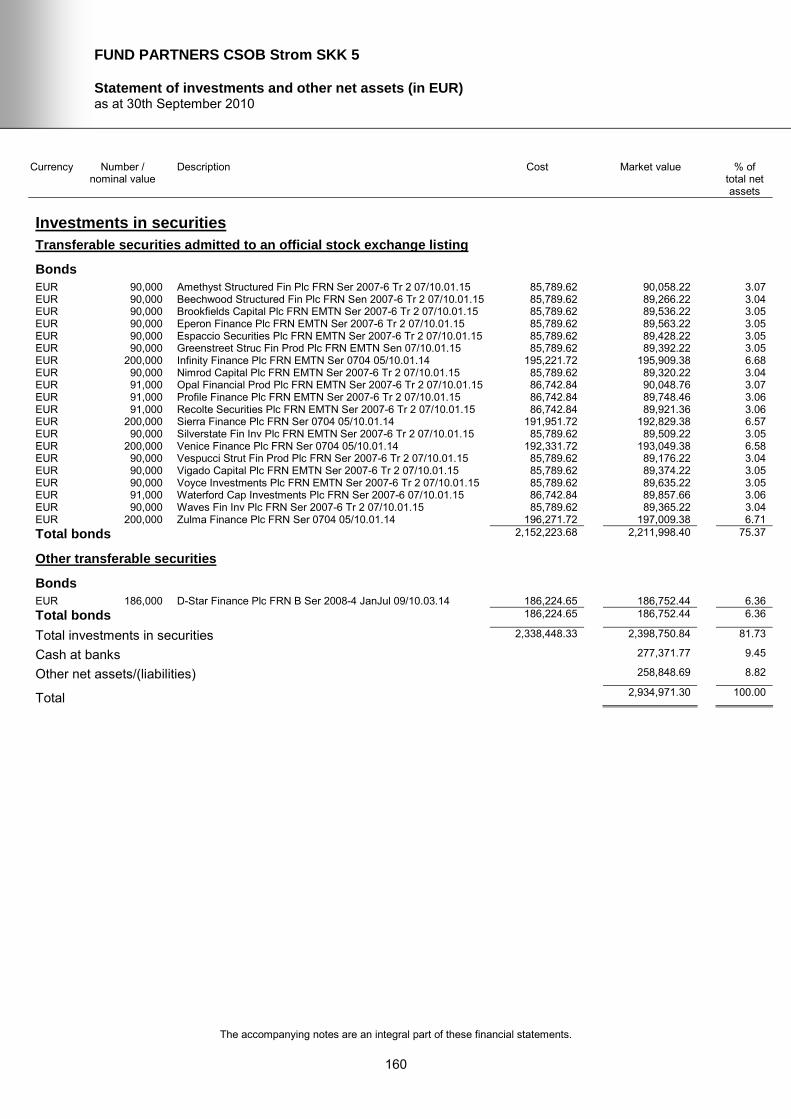
FUND PARTNERS CSOB Strom SKK 5
Statement of investments and other net assets (in EUR) as at 30th September 2010
The accompanying notes are an integral part of these financial statements.
160
Currency Number / nominal value
Description Cost Market value % of total net assets
Investments in securities
Transferable securities admitted to an official stock exchange listing
Bonds
EUR 90,000 Amethyst Structured Fin Plc FRN Ser 2007-6 Tr 2 07/10.01.15 85,789.62 90,058.22 3.07 EUR 90,000 Beechwood Structured Fin Plc FRN Sen 2007-6 Tr 2 07/10.01.15 85,789.62 89,266.22 3.04 EUR 90,000 Brookfields Capital Plc FRN EMTN Ser 2007-6 Tr 2 07/10.01.15 85,789.62 89,536.22 3.05 EUR 90,000 Eperon Finance Plc FRN EMTN Ser 2007-6 Tr 2 07/10.01.15 85,789.62 89,563.22 3.05 EUR 90,000 Espaccio Securities Plc FRN EMTN Ser 2007-6 Tr 2 07/10.01.15 85,789.62 89,428.22 3.05 EUR 90,000 Greenstreet Struc Fin Prod Plc FRN EMTN Sen 07/10.01.15 85,789.62 89,392.22 3.05 EUR 200,000 Infinity Finance Plc FRN EMTN Ser 0704 05/10.01.14 195,221.72 195,909.38 6.68 EUR 90,000 Nimrod Capital Plc FRN EMTN Ser 2007-6 Tr 2 07/10.01.15 85,789.62 89,320.22 3.04 EUR 91,000 Opal Financial Prod Plc FRN EMTN Ser 2007-6 Tr 2 07/10.01.15 86,742.84 90,048.76 3.07 EUR 91,000 Profile Finance Plc FRN EMTN Ser 2007-6 Tr 2 07/10.01.15 86,742.84 89,748.46 3.06 EUR 91,000 Recolte Securities Plc FRN EMTN Ser 2007-6 Tr 2 07/10.01.15 86,742.84 89,921.36 3.06 EUR 200,000 Sierra Finance Plc FRN Ser 0704 05/10.01.14 191,951.72 192,829.38 6.57 EUR 90,000 Silverstate Fin Inv Plc FRN EMTN Ser 2007-6 Tr 2 07/10.01.15 85,789.62 89,509.22 3.05 EUR 200,000 Venice Finance Plc FRN Ser 0704 05/10.01.14 192,331.72 193,049.38 6.58 EUR 90,000 Vespucci Strut Fin Prod Plc FRN Ser 2007-6 Tr 2 07/10.01.15 85,789.62 89,176.22 3.04 EUR 90,000 Vigado Capital Plc FRN EMTN Ser 2007-6 Tr 2 07/10.01.15 85,789.62 89,374.22 3.05 EUR 90,000 Voyce Investments Plc FRN EMTN Ser 2007-6 Tr 2 07/10.01.15 85,789.62 89,635.22 3.05 EUR 91,000 Waterford Cap Investments Plc FRN Ser 2007-6 07/10.01.15 86,742.84 89,857.66 3.06 EUR 90,000 Waves Fin Inv Plc FRN Ser 2007-6 Tr 2 07/10.01.15 85,789.62 89,365.22 3.04 EUR 200,000 Zulma Finance Plc FRN Ser 0704 05/10.01.14 196,271.72 197,009.38 6.71
Total bonds 2,152,223.68 2,211,998.40 75.37
Other transferable securities
Bonds
EUR 186,000 D-Star Finance Plc FRN B Ser 2008-4 JanJul 09/10.03.14 186,224.65 186,752.44 6.36
Total bonds 186,224.65 186,752.44 6.36
Total investments in securities 2,338,448.33 2,398,750.84 81.73
Cash at banks 277,371.77 9.45
Other net assets/(liabilities) 258,848.69 8.82
Total 2,934,971.30 100.00

FUND PARTNERS CSOB World Tree 11
Statement of investments and other net assets (in CZK) as at 30th September 2010
The accompanying notes are an integral part of these financial statements.
161
Currency Number / nominal value
Description Cost Market value % of total net assets
Investments in securities
Transferable securities admitted to an official stock exchange listing
Bonds
CZK 6,300,000 Amethyst Structured Fin Plc FRN Ser 2007-15 Tr 1 07/10.07.15 6,279,769.84 6,305,897.43 8.28 CZK 6,300,000 Beechwood Structured Fin Plc FRN Ser 2007-15 07/10.07.15 6,279,769.84 6,250,457.43 8.21 CZK 6,300,000 Brookfields Capital Plc FRN Ser 2007-15 Tr 1 07/10.07.15 6,279,769.84 6,269,357.43 8.23 CZK 6,300,000 Eperon Finance Plc FRN Ser 2007-15 Tr 1 07/10.07.15 6,279,769.84 6,271,247.43 8.24 CZK 3,150,000 Espaccio Securities Plc FRN Ser 2007-15 Tr 1 07/10.07.15 3,139,884.91 3,130,898.72 4.11 CZK 3,150,000 Greenstreet Struc Fin Prod Plc FRN Ser 2007-15 07/10.07.15 3,139,884.91 3,129,638.72 4.11 CZK 3,150,000 Nimrod Capital Plc FRN Ser 2007-15 Tr 1 07/10.07.15 3,139,884.91 3,127,118.72 4.11 CZK 3,150,000 Opal Financial Products Plc FRN Ser 2007-15 Tr 1 07/10.07.15 3,139,884.91 3,117,983.72 4.09 CZK 3,150,000 Profile Finance Plc FRN Ser 2007-15 Tr 1 07/10.07.15 3,139,884.91 3,107,588.72 4.08 CZK 3,150,000 Recolte Securities Plc FRN Ser 2007-15 Tr 1 07/10.07.15 3,139,884.91 3,113,573.72 4.09 CZK 3,150,000 Silverstate Fin Inv Plc FRN Ser 2007-15 Tr 1 07/10.07.15 3,139,884.91 3,133,733.72 4.11 CZK 3,150,000 Vespucci Strut Fin Prod Plc FRN Ser 2007-15 Tr 1 07/10.07.15 3,139,884.91 3,122,078.72 4.10 CZK 3,150,000 Vigado Capital Plc FRN Ser 2007-15 Tr 1 07/10.07.15 3,139,884.91 3,129,008.72 4.11 CZK 3,150,000 Voyce Investments Plc FRN Ser 2007-15 Tr 1 07/10.07.15 3,139,884.91 3,138,143.72 4.12 CZK 3,150,000 Waterford Cap Investments Plc FRN Ser 2007-15 07/10.07.15 3,139,884.91 3,111,368.72 4.09 CZK 3,150,000 Waves Fin Inv Plc FRN Ser 2007-15 Tr 1 07/10.07.15 3,139,884.91 3,128,693.72 4.11
Total investments in securities 62,797,698.28 62,586,789.36 82.19
Cash at banks 7,249,026.93 9.52
Other net assets/(liabilities) 6,317,336.30 8.29
Total 76,153,152.59 100.00

FUND PARTNERS CSOB World Tree 12
Statement of investments and other net assets (in CZK) as at 30th September 2010
The accompanying notes are an integral part of these financial statements.
162
Currency Number / nominal value
Description Cost Market value % of total net assets
Investments in securities
Transferable securities admitted to an official stock exchange listing
Bonds
CZK 6,350,000 Amethyst Structured Fin Plc FRN Ser 2007-15 Tr 1 07/10.07.15 6,338,752.52 6,355,944.24 8.43 CZK 6,350,000 Beechwood Structured Fin Plc FRN Ser 2007-15 07/10.07.15 6,338,752.52 6,300,064.24 8.35 CZK 6,350,000 Brookfields Capital Plc FRN Ser 2007-15 Tr 1 07/10.07.15 6,338,752.52 6,319,114.24 8.38 CZK 6,350,000 Eperon Finance Plc FRN Ser 2007-15 Tr 1 07/10.07.15 6,338,752.52 6,321,019.24 8.38 CZK 3,200,000 Espaccio Securities Plc FRN Ser 2007-15 Tr 1 07/10.07.15 3,194,331.97 3,180,595.52 4.22 CZK 3,200,000 Greenstreet Struc Fin Prod Plc FRN Ser 2007-15 07/10.07.15 3,194,331.97 3,179,315.52 4.21 CZK 3,200,000 Nimrod Capital Plc FRN Ser 2007-15 Tr 1 07/10.07.15 3,194,331.97 3,176,755.52 4.21 CZK 3,200,000 Opal Financial Products Plc FRN Ser 2007-15 Tr 1 07/10.07.15 3,194,331.97 3,167,475.52 4.20 CZK 3,200,000 Profile Finance Plc FRN Ser 2007-15 Tr 1 07/10.07.15 3,194,331.97 3,156,915.52 4.18 CZK 3,200,000 Recolte Securities Plc FRN Ser 2007-15 Tr 1 07/10.07.15 3,194,331.97 3,162,995.52 4.19 CZK 3,150,000 Silverstate Fin Inv Plc FRN Ser 2007-15 Tr 1 07/10.07.15 3,144,420.53 3,133,733.72 4.15 CZK 3,200,000 Vespucci Strut Fin Prod Plc FRN Ser 2007-15 Tr 1 07/10.07.15 3,194,331.97 3,171,635.52 4.20 CZK 3,200,000 Vigado Capital Plc FRN Ser 2007-15 Tr 1 07/10.07.15 3,194,331.97 3,178,675.52 4.21 CZK 3,150,000 Voyce Investments Plc FRN Ser 2007-15 Tr 1 07/10.07.15 3,144,420.53 3,138,143.72 4.16 CZK 3,200,000 Waterford Cap Investments Plc FRN Ser 2007-15 07/10.07.15 3,194,331.97 3,160,755.52 4.19 CZK 3,150,000 Waves Fin Inv Plc FRN Ser 2007-15 Tr 1 07/10.07.15 3,144,420.53 3,128,693.72 4.15
Total investments in securities 63,537,259.40 63,231,832.80 83.81
Cash at banks 6,268,269.64 8.31
Other net assets/(liabilities) 5,943,595.02 7.88
Total 75,443,697.46 100.00

FUND PARTNERS CSOB Staircase Click 1
Statement of investments and other net assets (in CZK) as at 30th September 2010
The accompanying notes are an integral part of these financial statements.
163
Currency Number / nominal value
Description Cost Market value % of total net assets
Investments in securities
Transferable securities admitted to an official stock exchange listing
Bonds
CZK 9,050,000 Amethyst Structured Fin Plc FRN Ser 2007-15 Tr 1 07/10.07.15 9,018,990.68 9,058,471.71 9.26 CZK 9,100,000 Beechwood Structured Fin Plc FRN Ser 2007-15 07/10.07.15 9,068,819.36 9,028,438.51 9.23 CZK 9,050,000 Brookfields Capital Plc FRN Ser 2007-15 Tr 1 07/10.07.15 9,018,990.68 9,005,981.71 9.20 CZK 9,100,000 Eperon Finance Plc FRN Ser 2007-15 Tr 1 07/10.07.15 9,068,819.36 9,058,468.51 9.26 CZK 4,550,000 Espaccio Securities Plc FRN Ser 2007-15 Tr 1 07/10.07.15 4,534,409.68 4,522,409.26 4.62 CZK 4,550,000 Greenstreet Struc Fin Prod Plc FRN Ser 2007-15 07/10.07.15 4,534,409.68 4,520,589.26 4.62 CZK 4,550,000 Nimrod Capital Plc FRN Ser 2007-15 Tr 1 07/10.07.15 4,534,409.68 4,516,949.26 4.62 CZK 4,550,000 Opal Financial Products Plc FRN Ser 2007-15 Tr 1 07/10.07.15 4,534,409.68 4,503,754.26 4.60 CZK 4,550,000 Profile Finance Plc FRN Ser 2007-15 Tr 1 07/10.07.15 4,534,409.68 4,488,739.26 4.59 CZK 4,550,000 Recolte Securities Plc FRN Ser 2007-15 Tr 1 07/10.07.15 4,534,409.68 4,497,384.26 4.60 CZK 4,500,000 Silverstate Fin Inv Plc FRN Ser 2007-15 Tr 1 07/10.07.15 4,484,581.00 4,476,762.45 4.58 CZK 4,550,000 Vespucci Strut Fin Prod Plc FRN Ser 2007-15 Tr 1 07/10.07.15 4,534,409.68 4,509,669.26 4.61 CZK 4,550,000 Vigado Capital Plc FRN Ser 2007-15 Tr 1 07/10.07.15 4,534,409.68 4,519,679.26 4.62 CZK 4,500,000 Voyce Investments Plc FRN Ser 2007-15 Tr 1 07/10.07.15 4,484,581.00 4,483,062.45 4.58 CZK 4,550,000 Waterford Cap Investments Plc FRN Ser 2007-15 07/10.07.15 4,534,409.68 4,494,199.26 4.59 CZK 4,550,000 Waves Fin Inv Plc FRN Ser 2007-15 Tr 1 07/10.07.15 4,534,409.68 4,519,224.26 4.62
Total investments in securities 90,488,878.88 90,203,782.94 92.20
Cash at banks 8,551,236.21 8.74
Other net assets/(liabilities) -917,214.08 -0.94
Total 97,837,805.07 100.00

FUND PARTNERS NLB SKLADI - GARANTIRANI SKLAD EVROPA 1
Statement of investments and other net assets (in EUR) as at 30th September 2010
The accompanying notes are an integral part of these financial statements.
164
Currency Number / nominal value
Description Cost Market value % of total net assets
Investments in securities
Transferable securities admitted to an official stock exchange listing
Bonds
EUR 416,000 Amethyst Structured Fin Plc EMTN FRN Ser 2006-5 06/23.12.14 413,601.95 416,257.79 7.18 EUR 416,000 Beechwood Structured Fin Plc FRN Sen 2006-5 Tr 1 06/23.12.14 413,601.95 412,596.99 7.12 EUR 416,000 Brookfields Capital Plc FRN EMTN Sen 2006-5 Tr 2 07/23.12.14 413,601.95 413,844.99 7.14 EUR 416,000 Eperon Finance Plc FRN EMTN Sen 2006-5 Tr 2 07/23.12.14 413,601.95 413,969.79 7.14 EUR 208,000 Espaccio Securities Plc FRN EMTN Sen 2006-5 Tr 2 07/23.12.14 206,800.96 206,672.90 3.57 EUR 208,000 Greenstreet Struc Fin Prod Plc FRN Sen 2006-5 07/23.12.14 206,800.96 206,589.70 3.57 EUR 200,000 Infinity Finance Plc FRN Ser 0604 04/23.06.13 194,651.80 195,903.94 3.38 EUR 208,000 Nimrod Capital Plc FRN EMTN Sen 2006-5 Tr 2 07/23.12.14 206,800.96 206,423.30 3.56 EUR 209,000 Opal Financial Products Plc FRN EMTN Sen 2006-5 07/23.12.14 207,795.19 206,809.62 3.57 EUR 210,000 Profile Finance Plc FRN EMTN Sen 2006-5 Tr 2 07/23.12.14 208,789.43 207,106.13 3.57 EUR 208,000 Recolte Securities Plc FRN EMTN Sen 2006-5 Tr 2 07/23.12.14 206,800.96 205,528.90 3.55 EUR 200,000 Sierra Finance Plc FRN EMTN Ser 0604 04/23.06.13 191,191.80 192,823.94 3.33 EUR 207,000 Silverstate Fin Inv Plc FRN EMTN Sen 2006-5 Tr 2 07/23.12.14 205,806.72 205,865.58 3.55 EUR 200,000 Venice Finance Plc FRN EMTN Ser 0604 04/23.06.13 191,771.80 193,043.94 3.33 EUR 208,000 Vespucci Strut Fin Prod Plc FRN Sen 2006-5 Tr 2 07/23.12.14 206,800.96 206,090.50 3.56 EUR 209,000 Vigado Capital Plc FRN EMTN Sen 2006-5 Tr 2 07/23.12.14 207,795.19 207,541.12 3.58 EUR 207,000 Voyce Investments Plc FRN EMTN Sen 2006-5 Tr 2 07/23.12.14 205,806.72 206,155.38 3.56 EUR 209,000 Waterford Cap Investments Plc FRN Sen 2006-5 07/23.12.14 207,795.19 206,370.72 3.56 EUR 208,000 Waves Fin Inv Plc FRN EMTN Sen 2006-5 07/23.12.14 206,800.96 206,527.30 3.57 EUR 200,000 Zulma Finance Plc FRN Ser 0604 04/23.06.13 195,671.80 197,003.94 3.40
Total bonds 4,912,289.20 4,913,126.47 84.79
Other transferable securities
Bonds
EUR 186,000 D-Star Finance Plc FRN E Ser 2008-4 JunDec 09/21.03.14 186,215.48 186,747.40 3.22
Total bonds 186,215.48 186,747.40 3.22
Total investments in securities 5,098,504.68 5,099,873.87 88.01
Cash at banks 602,913.30 10.40
Other net assets/(liabilities) 91,926.07 1.59
Total 5,794,713.24 100.00

FUND PARTNERS CSOB Asian Growth 1
Statement of investments and other net assets (in CZK) as at 30th September 2010
The accompanying notes are an integral part of these financial statements.
165
Currency Number / nominal value
Description Cost Market value % of total net assets
Investments in securities
Transferable securities admitted to an official stock exchange listing
Bonds
CZK 44,650,000 Amethyst Structured Fin Plc FRN Ser 2007-15 Tr 1 07/10.07.15 44,523,070.49 44,691,796.86 8.30 CZK 44,950,000 Beechwood Structured Fin Plc FRN Ser 2007-15 07/10.07.15 44,822,217.66 44,596,517.69 8.29 CZK 44,850,000 Brookfields Capital Plc FRN Ser 2007-15 Tr 1 07/10.07.15 44,722,501.94 44,631,854.08 8.29 CZK 44,900,000 Eperon Finance Plc FRN Ser 2007-15 Tr 1 07/10.07.15 44,772,359.80 44,695,080.89 8.30 CZK 22,500,000 Espaccio Securities Plc FRN Ser 2007-15 Tr 1 07/10.07.15 22,436,037.74 22,363,562.25 4.16 CZK 22,500,000 Greenstreet Struc Fin Prod Plc FRN Ser 2007-15 07/10.07.15 22,436,037.74 22,354,562.25 4.15 CZK 22,500,000 Nimrod Capital Plc FRN Ser 2007-15 Tr 1 07/10.07.15 22,436,037.74 22,336,562.25 4.15 CZK 22,500,000 Opal Financial Products Plc FRN Ser 2007-15 Tr 1 07/10.07.15 22,436,037.74 22,271,312.25 4.14 CZK 22,600,000 Profile Finance Plc FRN Ser 2007-15 Tr 1 07/10.07.15 22,535,753.47 22,295,715.86 4.14 CZK 22,550,000 Recolte Securities Plc FRN Ser 2007-15 Tr 1 07/10.07.15 22,485,895.60 22,289,234.06 4.14 CZK 22,400,000 Silverstate Fin Inv Plc FRN Ser 2007-15 Tr 1 07/10.07.15 22,336,322.02 22,284,328.64 4.14 CZK 22,450,000 Vespucci Strut Fin Prod Plc FRN Ser 2007-15 Tr 1 07/10.07.15 22,386,179.88 22,251,005.44 4.14 CZK 22,550,000 Vigado Capital Plc FRN Ser 2007-15 Tr 1 07/10.07.15 22,485,895.60 22,399,729.06 4.16 CZK 22,400,000 Voyce Investments Plc FRN Ser 2007-15 Tr 1 07/10.07.15 22,336,322.02 22,315,688.64 4.15 CZK 22,550,000 Waterford Cap Investments Plc FRN Ser 2007-15 07/10.07.15 22,485,895.60 22,273,449.06 4.14 CZK 22,450,000 Waves Fin Inv Plc FRN Ser 2007-15 Tr 1 07/10.07.15 22,386,179.88 22,298,150.44 4.14
Total investments in securities 448,022,744.92 446,348,549.72 82.93
Cash at banks 46,450,670.09 8.63
Other net assets/(liabilities) 45,440,394.97 8.44
Total 538,239,614.78 100.00

FUND PARTNERS CSOB Central Europe Winners 1
Statement of investments and other net assets (in CZK) as at 30th September 2010
The accompanying notes are an integral part of these financial statements.
166
Currency Number / nominal value
Description Cost Market value % of total net assets
Investments in securities
Transferable securities admitted to an official stock exchange listing
Bonds
CZK 8,750,000 Amethyst Structured Fin Plc FRN Ser 2007-15 Tr 1 07/10.07.15 8,734,186.77 8,758,190.87 8.71 CZK 8,800,000 Beechwood Structured Fin Plc FRN Ser 2007-15 07/10.07.15 8,784,096.41 8,730,797.68 8.68 CZK 8,800,000 Brookfields Capital Plc FRN Ser 2007-15 Tr 1 07/10.07.15 8,784,096.41 8,757,197.68 8.71 CZK 8,800,000 Eperon Finance Plc FRN Ser 2007-15 Tr 1 07/10.07.15 8,784,096.41 8,759,837.68 8.71 CZK 4,400,000 Espaccio Securities Plc FRN Ser 2007-15 Tr 1 07/10.07.15 4,392,048.20 4,373,318.84 4.35 CZK 4,400,000 Greenstreet Struc Fin Prod Plc FRN Ser 2007-15 07/10.07.15 4,392,048.20 4,371,558.84 4.35 CZK 4,400,000 Nimrod Capital Plc FRN Ser 2007-15 Tr 1 07/10.07.15 4,392,048.20 4,368,038.84 4.34 CZK 4,400,000 Opal Financial Products Plc FRN Ser 2007-15 Tr 1 07/10.07.15 4,392,048.20 4,355,278.84 4.33 CZK 4,450,000 Profile Finance Plc FRN Ser 2007-15 Tr 1 07/10.07.15 4,441,957.84 4,390,085.64 4.36 CZK 4,400,000 Recolte Securities Plc FRN Ser 2007-15 Tr 1 07/10.07.15 4,392,048.20 4,349,118.84 4.32 CZK 4,400,000 Silverstate Fin Inv Plc FRN Ser 2007-15 Tr 1 07/10.07.15 4,392,048.20 4,377,278.84 4.35 CZK 4,400,000 Vespucci Strut Fin Prod Plc FRN Ser 2007-15 Tr 1 07/10.07.15 4,392,048.20 4,360,998.84 4.34 CZK 4,400,000 Vigado Capital Plc FRN Ser 2007-15 Tr 1 07/10.07.15 4,392,048.20 4,370,678.84 4.35 CZK 4,400,000 Voyce Investments Plc FRN Ser 2007-15 Tr 1 07/10.07.15 4,392,048.20 4,383,438.84 4.36 CZK 4,400,000 Waterford Cap Investments Plc FRN Ser 2007-15 07/10.07.15 4,392,048.20 4,346,038.84 4.32 CZK 4,400,000 Waves Fin Inv Plc FRN Ser 2007-15 Tr 1 07/10.07.15 4,392,048.20 4,370,238.84 4.34
Total investments in securities 87,840,964.04 87,422,096.79 86.92
Cash at banks 9,777,882.95 9.72
Other net assets/(liabilities) 3,374,490.68 3.36
Total 100,574,470.42 100.00

FUND PARTNERS CSOB Stock Selection Short Term 4
Statement of investments and other net assets (in CZK) as at 30th September 2010
The accompanying notes are an integral part of these financial statements.
167
Currency Number / nominal value
Description Cost Market value % of total net assets
Investments in securities
Transferable securities admitted to an official stock exchange listing
Bonds
CZK 9,750,000 Amethyst Structured Fin Plc FRN Ser 2007-15 Tr 1 07/10.07.15 9,736,404.98 9,759,126.97 8.67 CZK 9,850,000 Beechwood Structured Fin Plc FRN Ser 2007-15 07/10.07.15 9,836,265.54 9,772,540.58 8.68 CZK 9,800,000 Brookfields Capital Plc FRN Ser 2007-15 Tr 1 07/10.07.15 9,786,335.26 9,752,333.78 8.66 CZK 9,800,000 Eperon Finance Plc FRN Ser 2007-15 Tr 1 07/10.07.15 9,786,335.26 9,755,273.78 8.67 CZK 4,900,000 Espaccio Securities Plc FRN Ser 2007-15 Tr 1 07/10.07.15 4,893,167.63 4,870,286.89 4.33 CZK 4,900,000 Greenstreet Struc Fin Prod Plc FRN Ser 2007-15 07/10.07.15 4,893,167.63 4,868,326.89 4.33 CZK 4,900,000 Nimrod Capital Plc FRN Ser 2007-15 Tr 1 07/10.07.15 4,893,167.63 4,864,406.89 4.32 CZK 4,900,000 Opal Financial Products Plc FRN Ser 2007-15 Tr 1 07/10.07.15 4,893,167.63 4,850,196.89 4.31 CZK 4,950,000 Profile Finance Plc FRN Ser 2007-15 Tr 1 07/10.07.15 4,943,097.91 4,883,353.70 4.34 CZK 4,900,000 Recolte Securities Plc FRN Ser 2007-15 Tr 1 07/10.07.15 4,893,167.63 4,843,336.89 4.30 CZK 4,900,000 Silverstate Fin Inv Plc FRN Ser 2007-15 Tr 1 07/10.07.15 4,893,167.63 4,874,696.89 4.33 CZK 4,900,000 Vespucci Strut Fin Prod Plc FRN Ser 2007-15 Tr 1 07/10.07.15 4,893,167.63 4,856,566.89 4.32 CZK 4,900,000 Vigado Capital Plc FRN Ser 2007-15 Tr 1 07/10.07.15 4,893,167.63 4,867,346.89 4.32 CZK 4,900,000 Voyce Investments Plc FRN Ser 2007-15 Tr 1 07/10.07.15 4,893,167.63 4,881,556.89 4.34 CZK 4,900,000 Waterford Cap Investments Plc FRN Ser 2007-15 07/10.07.15 4,893,167.63 4,839,906.89 4.30 CZK 4,900,000 Waves Fin Inv Plc FRN Ser 2007-15 Tr 1 07/10.07.15 4,893,167.63 4,866,856.89 4.32
Total investments in securities 97,913,282.88 97,406,114.60 86.54
Cash at banks 11,035,148.50 9.80
Other net assets/(liabilities) 4,120,322.84 3.66
Total 112,561,585.94 100.00

FUND PARTNERS Kredyt Bank Asia 1
Statement of investments and other net assets (in PLN) as at 30th September 2010
The accompanying notes are an integral part of these financial statements.
168
Currency Number / nominal value
Description Cost Market value % of total net assets
Investments in securities
Transferable securities admitted to an official stock exchange listing
Bonds
PLN 3,540,000 Amethyst Structured Fin Plc FRN Ser 2007-16 Tr 1 07/10.07.15 3,523,116.70 3,542,640.84 9.59 PLN 3,560,000 Beechwood Structured Fin Plc FRN Ser 2007-16 07/10.07.15 3,543,021.31 3,531,327.76 9.56 PLN 3,550,000 Brookfields Capital Plc FRN Ser 2007-16 Tr 1 07/10.07.15 3,533,069.00 3,532,058.30 9.57 PLN 3,555,000 Eperon Finance Plc FRN Ser 2007-16 Tr 1 07/10.07.15 3,538,045.16 3,538,099.53 9.58 PLN 1,780,000 Espaccio Securities Plc FRN Ser 2007-16 Tr 1 07/10.07.15 1,771,510.65 1,768,867.88 4.79 PLN 1,780,000 Greenstreet Struc Fin Prod Plc FRN Ser 2007-16 07/10.07.15 1,771,510.65 1,768,155.88 4.79 PLN 1,780,000 Nimrod Capital Plc FRN Ser 2007-16 Tr 1 07/10.07.15 1,771,510.65 1,766,731.88 4.78 PLN 1,780,000 Opal Financial Products Plc FRN Ser 2007-16 Tr 1 07/10.07.15 1,771,510.65 1,761,569.88 4.77 PLN 1,790,000 Profile Finance Plc FRN Ser 2007-16 Tr 1 07/10.07.15 1,781,462.96 1,765,559.34 4.78 PLN 1,785,000 Recolte Securities Plc FRN Ser 2007-16 Tr 1 07/10.07.15 1,776,486.81 1,764,019.11 4.78 PLN 1,775,000 Silverstate Fin Inv Plc FRN Ser 2007-16 Tr 1 07/10.07.15 1,766,534.50 1,765,496.65 4.78 PLN 1,780,000 Vespucci Strut Fin Prod Plc FRN Ser 2007-16 07/10.07.15 1,771,510.65 1,763,883.88 4.78 PLN 1,785,000 Vigado Capital Plc FRN Ser 2007-16 Tr 1 07/10.07.15 1,776,486.81 1,772,765.61 4.80 PLN 1,775,000 Voyce Investments Plc FRN Ser 2007-16 Tr 1 07/10.07.15 1,766,534.50 1,767,981.65 4.79 PLN 1,785,000 Waterford Cap Investments Plc FRN Ser 2007-16 07/10.07.15 1,776,486.81 1,762,769.61 4.77 PLN 1,780,000 Waves Fin Investments Plc FRN Ser 2007-16 Tr 1 07/10.07.15 1,771,510.65 1,767,621.88 4.79
Total investments in securities 35,410,308.46 35,339,549.68 95.70
Cash at banks 3,371,557.09 9.13
Other net assets/(liabilities) -1,782,435.88 -4.83
Total 36,928,670.89 100.00

FUND PARTNERS Kredyt Bank Sustainables 1
Statement of investments and other net assets (in PLN) as at 30th September 2010
The accompanying notes are an integral part of these financial statements.
169
Currency Number / nominal value
Description Cost Market value % of total net assets
Investments in securities
Transferable securities admitted to an official stock exchange listing
Bonds
PLN 5,230,000 Amethyst Structured Fin Plc FRN Ser 2007-16 Tr 1 07/10.07.15 5,187,647.99 5,233,901.58 9.49 PLN 5,260,000 Beechwood Structured Fin Plc FRN Ser 2007-16 07/10.07.15 5,218,457.05 5,217,635.96 9.46 PLN 5,250,000 Brookfields Capital Plc FRN Ser 2007-16 Tr 1 07/10.07.15 5,217,986.03 5,223,466.50 9.48 PLN 5,255,000 Eperon Finance Plc FRN Ser 2007-16 Tr 1 07/10.07.15 5,216,124.04 5,230,017.73 9.49 PLN 2,635,000 Espaccio Securities Plc FRN Ser 2007-16 Tr 1 07/10.07.15 2,611,554.03 2,618,520.71 4.75 PLN 2,635,000 Greenstreet Struc Fin Prod Plc FRN Ser 2007-16 07/10.07.15 2,612,871.53 2,617,466.71 4.75 PLN 2,630,000 Nimrod Capital Plc FRN Ser 2007-16 Tr 1 07/10.07.15 2,605,546.52 2,610,395.98 4.73 PLN 2,635,000 Opal Financial Products Plc FRN Ser 2007-16 Tr 1 07/10.07.15 2,610,763.53 2,607,717.21 4.73 PLN 2,650,000 Profile Finance Plc FRN Ser 2007-16 Tr 1 07/10.07.15 2,616,615.56 2,613,816.90 4.74 PLN 2,640,000 Recolte Securities Plc FRN Ser 2007-16 Tr 1 07/10.07.15 2,613,077.54 2,608,969.44 4.73 PLN 2,625,000 Silverstate Fin Inv Plc FRN Ser 2007-16 Tr 1 07/10.07.15 2,612,668.01 2,610,945.75 4.74 PLN 2,630,000 Vespucci Strut Fin Prod Plc FRN Ser 2007-16 07/10.07.15 2,615,277.52 2,606,187.98 4.73 PLN 2,640,000 Vigado Capital Plc FRN Ser 2007-16 Tr 1 07/10.07.15 2,612,285.54 2,621,905.44 4.76 PLN 2,625,000 Voyce Investments Plc FRN Ser 2007-16 Tr 1 07/10.07.15 2,616,080.51 2,614,620.75 4.74 PLN 2,640,000 Waterford Cap Investments Plc FRN Ser 2007-16 07/10.07.15 2,611,229.54 2,607,121.44 4.73 PLN 2,630,000 Waves Fin Investments Plc FRN Ser 2007-16 Tr 1 07/10.07.15 2,615,277.52 2,611,710.98 4.74
Total investments in securities 52,193,462.46 52,254,401.06 94.79
Cash at banks 5,369,403.75 9.74
Other net assets/(liabilities) -2,495,749.33 -4.53
Total 55,128,055.48 100.00

FUND PARTNERS NLB Skladi - Garantirani sklad Azija 1
Statement of investments and other net assets (in USD) as at 30th September 2010
The accompanying notes are an integral part of these financial statements.
170
Currency Number / nominal value
Description Cost Market value % of total net assets
Investments in securities
Transferable securities admitted to an official stock exchange listing
Bonds
USD 184,000 Amethyst Structured Fin Plc FRN Ser 2007-7 Tr 2 07/10.01.15 184,023.74 184,262.90 6.87 USD 184,000 Beechwood Structured Fin Plc FRN Ser 07-7 Tr 2 07/10.01.15 184,023.74 182,643.70 6.81 USD 184,000 Brookfields Capital Plc FRN EMTN Ser 2007-7 Tr 2 07/10.01.15 184,023.74 183,195.70 6.83 USD 184,000 Eperon Finance Plc FRN EMTN Ser 2007-7 Tr 2 07/10.01.15 184,023.74 183,250.90 6.83 USD 92,000 Espaccio Securities Plc FRN EMTN Ser 07-7 Tr 2 07/10.01.15 92,011.87 91,487.45 3.41 USD 92,000 Greenstreet Struc Fin Prod Plc FRN EMTN Sen Tr 2 07/10.01.15 92,011.87 91,450.65 3.41 USD 92,000 Nimrod Capital Plc FRN EMTN Ser 2007-7 Tr 2 07/10.01.15 92,011.87 91,377.05 3.41 USD 92,000 Opal Financial Products Plc FRN Ser 2007-7 Tr 2 07/10.01.15 92,011.87 91,110.25 3.40 USD 92,000 Profile Finance Plc FRN EMTN Ser 2007-7 Tr 2 07/10.01.15 92,011.87 90,806.65 3.39 USD 92,000 Recolte Securities Plc FRN Ser 2007-7 Tr 2 07/10.01.15 92,011.87 90,981.45 3.39 USD 92,000 Silverstate Fin Inv Plc FRN Ser 2007-7 Tr 2 07/10.01.15 92,011.87 91,570.25 3.42 USD 92,000 Vespucci Strut Fin Prod Plc FRN Ser 2007-7 Tr 2 07/10.01.15 92,011.87 91,229.85 3.40 USD 92,000 Vigado Capital Plc FRN Ser 2007-7 Tr 2 07/10.01.15 92,011.87 91,432.25 3.41 USD 92,000 Voyce Investments Plc FRN EMTN Ser 2007-7 Tr 2 07/10.01.15 92,011.87 91,699.05 3.42 USD 92,000 Waterford Cap Investments Plc FRN Ser 2007-7 07/10.01.15 92,011.87 90,917.05 3.39 USD 92,000 Waves Fin Inv Plc FRN Ser 2007-7 Tr 2 07/10.01.15 92,011.87 91,423.05 3.41
Total investments in securities 1,840,237.40 1,828,838.20 68.20
Cash at banks 216,697.19 8.08
Other net assets/(liabilities) 635,906.89 23.72
Total 2,681,442.28 100.00

FUND PARTNERS Warta High Dividend Europe 1
Statement of investments and other net assets (in PLN) as at 30th September 2010
The accompanying notes are an integral part of these financial statements.
171
Currency Number / nominal value
Description Cost Market value % of total net assets
Investments in securities
Transferable securities admitted to an official stock exchange listing
Bonds
PLN 4,475,000 Amethyst Structured Fin Plc FRN Ser 2007-16 Tr 1 07/10.07.15 4,475,469.87 4,478,338.35 9.24 PLN 4,505,000 Beechwood Structured Fin Plc FRN Ser 2007-16 07/10.07.15 4,505,473.02 4,468,716.73 9.22 PLN 4,490,000 Brookfields Capital Plc FRN Ser 2007-16 Tr 1 07/10.07.15 4,490,471.45 4,467,307.54 9.22 PLN 4,500,000 Eperon Finance Plc FRN Ser 2007-16 Tr 1 07/10.07.15 4,500,472.50 4,478,607.00 9.24 PLN 2,255,000 Espaccio Securities Plc FRN Ser 2007-16 Tr 1 07/10.07.15 2,255,236.77 2,240,897.23 4.62 PLN 2,255,000 Greenstreet Struc Fin Prod Plc FRN Ser 2007-16 07/10.07.15 2,255,236.77 2,239,995.23 4.62 PLN 2,250,000 Nimrod Capital Plc FRN Ser 2007-16 Tr 1 07/10.07.15 2,250,236.25 2,233,228.50 4.61 PLN 2,255,000 Opal Financial Products Plc FRN Ser 2007-16 Tr 1 07/10.07.15 2,255,236.77 2,231,651.73 4.61 PLN 2,265,000 Profile Finance Plc FRN Ser 2007-16 Tr 1 07/10.07.15 2,265,237.82 2,234,073.69 4.61 PLN 2,255,000 Recolte Securities Plc FRN Ser 2007-16 Tr 1 07/10.07.15 2,255,236.77 2,228,494.73 4.60 PLN 2,245,000 Silverstate Fin Inv Plc FRN Ser 2007-16 Tr 1 07/10.07.15 2,245,235.72 2,232,980.27 4.61 PLN 2,250,000 Vespucci Strut Fin Prod Plc FRN Ser 2007-16 07/10.07.15 2,250,236.25 2,229,628.50 4.60 PLN 2,255,000 Vigado Capital Plc FRN Ser 2007-16 Tr 1 07/10.07.15 2,255,236.77 2,239,544.23 4.62 PLN 2,245,000 Voyce Investments Plc FRN Ser 2007-16 Tr 1 07/10.07.15 2,245,235.72 2,236,123.27 4.61 PLN 2,255,000 Waterford Cap Investments Plc FRN Ser 2007-16 07/10.07.15 2,255,236.77 2,226,916.23 4.60 PLN 2,250,000 Waves Fin Investments Plc FRN Ser 2007-16 Tr 1 07/10.07.15 2,250,236.25 2,234,353.50 4.61
Total investments in securities 45,009,725.47 44,700,856.73 92.24
Cash at banks 4,827,356.05 9.96
Other net assets/(liabilities) -1,064,218.82 -2.20
Total 48,463,993.96 100.00

FUND PARTNERS CSOB World Growth Plus 11
Statement of investments and other net assets (in CZK) as at 30th September 2010
The accompanying notes are an integral part of these financial statements.
172
Currency Number / nominal value
Description Cost Market value % of total net assets
Investments in securities
Transferable securities admitted to an official stock exchange listing
Bonds
CZK 7,150,000 Amethyst Structured Fin Plc FRN Ser 2007-15 Tr 1 07/10.07.15 7,133,630.57 7,156,693.11 8.63 CZK 7,200,000 Beechwood Structured Fin Plc FRN Ser 2007-15 07/10.07.15 7,183,516.10 7,143,379.92 8.62 CZK 7,200,000 Brookfields Capital Plc FRN Ser 2007-15 Tr 1 07/10.07.15 7,183,516.10 7,164,979.92 8.64 CZK 7,200,000 Eperon Finance Plc FRN Ser 2007-15 Tr 1 07/10.07.15 7,183,516.10 7,167,139.92 8.64 CZK 3,600,000 Espaccio Securities Plc FRN Ser 2007-15 Tr 1 07/10.07.15 3,591,758.04 3,578,169.96 4.32 CZK 3,600,000 Greenstreet Struc Fin Prod Plc FRN Ser 2007-15 07/10.07.15 3,591,758.04 3,576,729.96 4.31 CZK 3,600,000 Nimrod Capital Plc FRN Ser 2007-15 Tr 1 07/10.07.15 3,591,758.04 3,573,849.96 4.31 CZK 3,600,000 Opal Financial Products Plc FRN Ser 2007-15 Tr 1 07/10.07.15 3,591,758.04 3,563,409.96 4.30 CZK 3,600,000 Profile Finance Plc FRN Ser 2007-15 Tr 1 07/10.07.15 3,591,758.04 3,551,529.96 4.28 CZK 3,600,000 Recolte Securities Plc FRN Ser 2007-15 Tr 1 07/10.07.15 3,591,758.04 3,558,369.96 4.29 CZK 3,600,000 Silverstate Fin Inv Plc FRN Ser 2007-15 Tr 1 07/10.07.15 3,591,758.04 3,581,409.96 4.32 CZK 3,600,000 Vespucci Strut Fin Prod Plc FRN Ser 2007-15 Tr 1 07/10.07.15 3,591,758.04 3,568,089.96 4.30 CZK 3,600,000 Vigado Capital Plc FRN Ser 2007-15 Tr 1 07/10.07.15 3,591,758.04 3,576,009.96 4.31 CZK 3,600,000 Voyce Investments Plc FRN Ser 2007-15 Tr 1 07/10.07.15 3,591,758.04 3,586,449.96 4.33 CZK 3,600,000 Waterford Cap Investments Plc FRN Ser 2007-15 07/10.07.15 3,591,758.04 3,555,849.96 4.29 CZK 3,600,000 Waves Fin Inv Plc FRN Ser 2007-15 Tr 1 07/10.07.15 3,591,758.04 3,575,649.96 4.31
Total investments in securities 71,785,275.35 71,477,712.39 86.20
Cash at banks 8,415,924.42 10.15
Other net assets/(liabilities) 3,024,573.14 3.65
Total 82,918,209.95 100.00

FUND PARTNERS CSOB World Growth Plus 12
Statement of investments and other net assets (in CZK) as at 30th September 2010
The accompanying notes are an integral part of these financial statements.
173
Currency Number / nominal value
Description Cost Market value % of total net assets
Investments in securities
Transferable securities admitted to an official stock exchange listing
Bonds
CZK 7,300,000 Amethyst Structured Fin Plc FRN Ser 2007-15 Tr 1 07/10.07.15 7,283,985.56 7,306,833.53 8.72 CZK 7,350,000 Beechwood Structured Fin Plc FRN Ser 2007-15 07/10.07.15 7,333,875.87 7,292,200.34 8.70 CZK 7,300,000 Brookfields Capital Plc FRN Ser 2007-15 Tr 1 07/10.07.15 7,283,985.56 7,264,493.53 8.67 CZK 7,300,000 Eperon Finance Plc FRN Ser 2007-15 Tr 1 07/10.07.15 7,283,985.56 7,266,683.53 8.67 CZK 3,650,000 Espaccio Securities Plc FRN Ser 2007-15 Tr 1 07/10.07.15 3,641,992.77 3,627,866.77 4.33 CZK 3,650,000 Greenstreet Struc Fin Prod Plc FRN Ser 2007-15 07/10.07.15 3,641,992.77 3,626,406.77 4.33 CZK 3,650,000 Nimrod Capital Plc FRN Ser 2007-15 Tr 1 07/10.07.15 3,641,992.77 3,623,486.77 4.32 CZK 3,650,000 Opal Financial Products Plc FRN Ser 2007-15 Tr 1 07/10.07.15 3,641,992.77 3,612,901.77 4.31 CZK 3,700,000 Profile Finance Plc FRN Ser 2007-15 Tr 1 07/10.07.15 3,691,883.09 3,650,183.57 4.36 CZK 3,650,000 Recolte Securities Plc FRN Ser 2007-15 Tr 1 07/10.07.15 3,641,992.77 3,607,791.77 4.31 CZK 3,650,000 Silverstate Fin Inv Plc FRN Ser 2007-15 Tr 1 07/10.07.15 3,641,992.77 3,631,151.77 4.33 CZK 3,650,000 Vespucci Strut Fin Prod Plc FRN Ser 2007-15 Tr 1 07/10.07.15 3,641,992.77 3,617,646.77 4.32 CZK 3,650,000 Vigado Capital Plc FRN Ser 2007-15 Tr 1 07/10.07.15 3,641,992.77 3,625,676.77 4.33 CZK 3,650,000 Voyce Investments Plc FRN Ser 2007-15 Tr 1 07/10.07.15 3,641,992.77 3,636,261.77 4.34 CZK 3,650,000 Waterford Cap Investments Plc FRN Ser 2007-15 07/10.07.15 3,641,992.77 3,605,236.77 4.30 CZK 3,650,000 Waves Fin Inv Plc FRN Ser 2007-15 Tr 1 07/10.07.15 3,641,992.77 3,625,311.77 4.33
Total investments in securities 72,939,636.11 72,620,133.97 86.67
Cash at banks 8,191,031.45 9.78
Other net assets/(liabilities) 2,978,044.56 3.55
Total 83,789,209.98 100.00
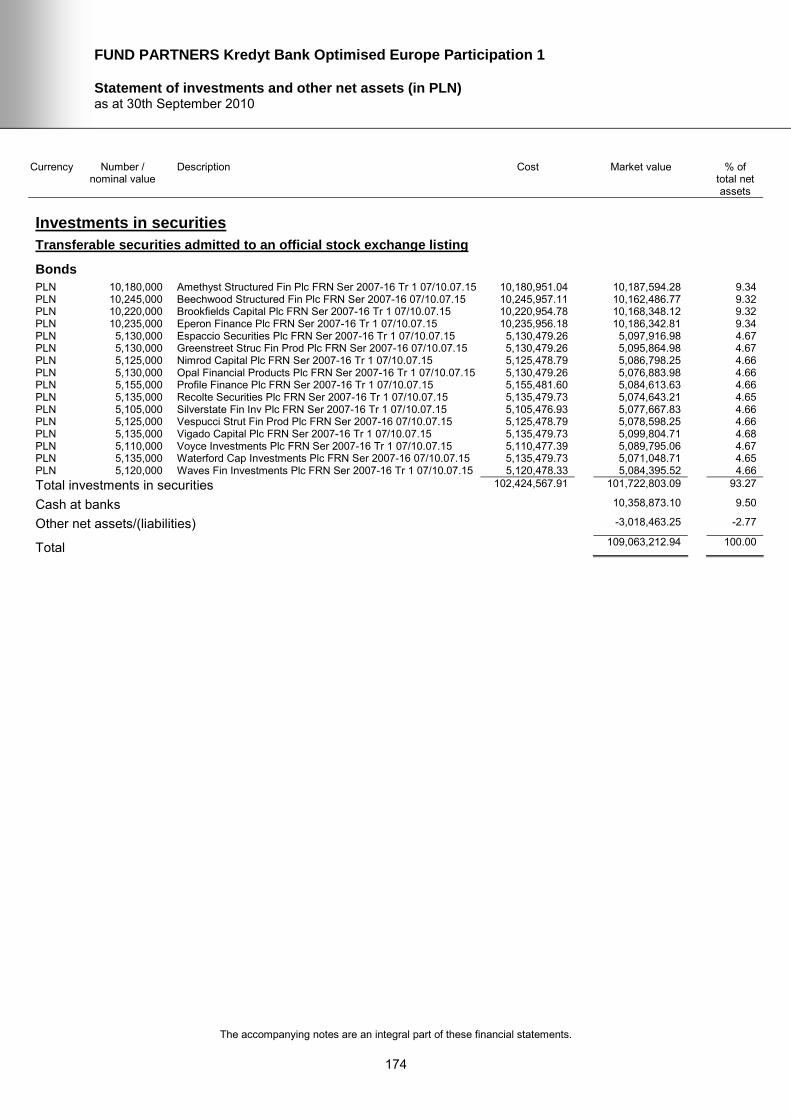
FUND PARTNERS Kredyt Bank Optimised Europe Participation 1
Statement of investments and other net assets (in PLN) as at 30th September 2010
The accompanying notes are an integral part of these financial statements.
174
Currency Number / nominal value
Description Cost Market value % of total net assets
Investments in securities
Transferable securities admitted to an official stock exchange listing
Bonds
PLN 10,180,000 Amethyst Structured Fin Plc FRN Ser 2007-16 Tr 1 07/10.07.15 10,180,951.04 10,187,594.28 9.34 PLN 10,245,000 Beechwood Structured Fin Plc FRN Ser 2007-16 07/10.07.15 10,245,957.11 10,162,486.77 9.32 PLN 10,220,000 Brookfields Capital Plc FRN Ser 2007-16 Tr 1 07/10.07.15 10,220,954.78 10,168,348.12 9.32 PLN 10,235,000 Eperon Finance Plc FRN Ser 2007-16 Tr 1 07/10.07.15 10,235,956.18 10,186,342.81 9.34 PLN 5,130,000 Espaccio Securities Plc FRN Ser 2007-16 Tr 1 07/10.07.15 5,130,479.26 5,097,916.98 4.67 PLN 5,130,000 Greenstreet Struc Fin Prod Plc FRN Ser 2007-16 07/10.07.15 5,130,479.26 5,095,864.98 4.67 PLN 5,125,000 Nimrod Capital Plc FRN Ser 2007-16 Tr 1 07/10.07.15 5,125,478.79 5,086,798.25 4.66 PLN 5,130,000 Opal Financial Products Plc FRN Ser 2007-16 Tr 1 07/10.07.15 5,130,479.26 5,076,883.98 4.66 PLN 5,155,000 Profile Finance Plc FRN Ser 2007-16 Tr 1 07/10.07.15 5,155,481.60 5,084,613.63 4.66 PLN 5,135,000 Recolte Securities Plc FRN Ser 2007-16 Tr 1 07/10.07.15 5,135,479.73 5,074,643.21 4.65 PLN 5,105,000 Silverstate Fin Inv Plc FRN Ser 2007-16 Tr 1 07/10.07.15 5,105,476.93 5,077,667.83 4.66 PLN 5,125,000 Vespucci Strut Fin Prod Plc FRN Ser 2007-16 07/10.07.15 5,125,478.79 5,078,598.25 4.66 PLN 5,135,000 Vigado Capital Plc FRN Ser 2007-16 Tr 1 07/10.07.15 5,135,479.73 5,099,804.71 4.68 PLN 5,110,000 Voyce Investments Plc FRN Ser 2007-16 Tr 1 07/10.07.15 5,110,477.39 5,089,795.06 4.67 PLN 5,135,000 Waterford Cap Investments Plc FRN Ser 2007-16 07/10.07.15 5,135,479.73 5,071,048.71 4.65 PLN 5,120,000 Waves Fin Investments Plc FRN Ser 2007-16 Tr 1 07/10.07.15 5,120,478.33 5,084,395.52 4.66
Total investments in securities 102,424,567.91 101,722,803.09 93.27
Cash at banks 10,358,873.10 9.50
Other net assets/(liabilities) -3,018,463.25 -2.77
Total 109,063,212.94 100.00

FUND PARTNERS Kredyt Bank Global Real Estate 1
Statement of investments and other net assets (in PLN) as at 30th September 2010
The accompanying notes are an integral part of these financial statements.
175
Currency Number / nominal value
Description Cost Market value % of total net assets
Investments in securities
Transferable securities admitted to an official stock exchange listing
Bonds
PLN 23,960,000 Amethyst Structured Fin Plc FRN Ser 2007-16 Tr 1 07/10.07.15 23,877,409.69 23,977,874.16 9.75 PLN 24,105,000 Beechwood Structured Fin Plc FRN Ser 2007-16 07/10.07.15 24,019,145.21 23,910,858.33 9.72 PLN 24,050,000 Brookfields Capital Plc FRN Ser 2007-16 Tr 1 07/10.07.15 23,965,621.88 23,928,451.30 9.72 PLN 24,085,000 Eperon Finance Plc FRN Ser 2007-16 Tr 1 07/10.07.15 23,999,761.73 23,970,499.91 9.74 PLN 12,075,000 Espaccio Securities Plc FRN Ser 2007-16 Tr 1 07/10.07.15 12,031,429.64 11,999,482.95 4.88 PLN 12,070,000 Greenstreet Struc Fin Prod Plc FRN Ser 2007-16 07/10.07.15 12,026,540.02 11,989,686.22 4.87 PLN 12,060,000 Nimrod Capital Plc FRN Ser 2007-16 Tr 1 07/10.07.15 12,016,817.77 11,970,104.76 4.86 PLN 12,080,000 Opal Financial Products Plc FRN Ser 2007-16 Tr 1 07/10.07.15 12,036,271.26 11,954,923.68 4.86 PLN 12,135,000 Profile Finance Plc FRN Ser 2007-16 Tr 1 07/10.07.15 12,089,179.60 11,969,308.71 4.86 PLN 12,090,000 Recolte Securities Plc FRN Ser 2007-16 Tr 1 07/10.07.15 12,045,894.50 11,947,894.14 4.86 PLN 12,020,000 Silverstate Fin Inv Plc FRN Ser 2007-16 Tr 1 07/10.07.15 11,977,873.80 11,955,644.92 4.86 PLN 12,060,000 Vespucci Strut Fin Prod Plc FRN Ser 2007-16 07/10.07.15 12,016,859.77 11,950,808.76 4.86 PLN 12,090,000 Vigado Capital Plc FRN Ser 2007-16 Tr 1 07/10.07.15 12,045,942.50 12,007,135.14 4.88 PLN 12,030,000 Voyce Investments Plc FRN Ser 2007-16 Tr 1 07/10.07.15 11,987,657.04 11,982,433.38 4.87 PLN 12,090,000 Waterford Cap Investments Plc FRN Ser 2007-16 07/10.07.15 12,045,894.50 11,939,431.14 4.85 PLN 12,050,000 Waves Fin Investments Plc FRN Ser 2007-16 Tr 1 07/10.07.15 12,007,101.53 11,966,204.30 4.86
Total investments in securities 240,189,400.44 239,420,741.80 97.30
Cash at banks 21,357,922.36 8.68
Other net assets/(liabilities) -14,720,548.48 -5.98
Total 246,058,115.68 100.00

FUND PARTNERS CSOB World Growth Plus 13
Statement of investments and other net assets (in CZK) as at 30th September 2010
The accompanying notes are an integral part of these financial statements.
176
Currency Number / nominal value
Description Cost Market value % of total net assets
Investments in securities
Transferable securities admitted to an official stock exchange listing
Bonds
CZK 12,900,000 Amethyst Structured Fin Plc FRN Ser 2007-15 Tr 1 07/10.07.15 12,872,809.00 12,912,075.69 8.90 CZK 12,950,000 Beechwood Structured Fin Plc FRN Ser 2007-15 07/10.07.15 12,922,703.61 12,848,162.50 8.85 CZK 12,950,000 Brookfields Capital Plc FRN Ser 2007-15 Tr 1 07/10.07.15 12,922,703.61 12,887,012.50 8.88 CZK 12,950,000 Eperon Finance Plc FRN Ser 2007-15 Tr 1 07/10.07.15 12,922,703.61 12,890,897.50 8.88 CZK 6,500,000 Espaccio Securities Plc FRN Ser 2007-15 Tr 1 07/10.07.15 6,486,299.11 6,460,584.65 4.45 CZK 6,500,000 Greenstreet Struc Fin Prod Plc FRN Ser 2007-15 07/10.07.15 6,486,299.11 6,457,984.65 4.45 CZK 6,450,000 Nimrod Capital Plc FRN Ser 2007-15 Tr 1 07/10.07.15 6,436,404.50 6,403,147.85 4.41 CZK 6,500,000 Opal Financial Products Plc FRN Ser 2007-15 Tr 1 07/10.07.15 6,486,299.11 6,433,934.65 4.43 CZK 6,500,000 Profile Finance Plc FRN Ser 2007-15 Tr 1 07/10.07.15 6,486,299.11 6,412,484.65 4.42 CZK 6,500,000 Recolte Securities Plc FRN Ser 2007-15 Tr 1 07/10.07.15 6,486,299.11 6,424,834.65 4.43 CZK 6,450,000 Silverstate Fin Inv Plc FRN Ser 2007-15 Tr 1 07/10.07.15 6,436,404.50 6,416,692.85 4.42 CZK 6,450,000 Vespucci Strut Fin Prod Plc FRN Ser 2007-15 Tr 1 07/10.07.15 6,436,404.50 6,392,827.85 4.41 CZK 6,500,000 Vigado Capital Plc FRN Ser 2007-15 Tr 1 07/10.07.15 6,486,299.11 6,456,684.65 4.45 CZK 6,450,000 Voyce Investments Plc FRN Ser 2007-15 Tr 1 07/10.07.15 6,436,404.50 6,425,722.85 4.43 CZK 6,500,000 Waterford Cap Investments Plc FRN Ser 2007-15 07/10.07.15 6,486,299.11 6,420,284.65 4.43 CZK 6,450,000 Waves Fin Inv Plc FRN Ser 2007-15 Tr 1 07/10.07.15 6,436,404.50 6,406,372.85 4.42
Total investments in securities 129,227,036.10 128,649,704.99 88.66
Cash at banks 14,049,932.95 9.68
Other net assets/(liabilities) 2,408,500.37 1.66
Total 145,108,138.31 100.00

FUND PARTNERS CSOB World Growth Plus 14
Statement of investments and other net assets (in CZK) as at 30th September 2010
The accompanying notes are an integral part of these financial statements.
177
Currency Number / nominal value
Description Cost Market value % of total net assets
Investments in securities
Transferable securities admitted to an official stock exchange listing
Bonds
CZK 9,600,000 Amethyst Structured Fin Plc FRN Ser 2007-8 Tr 1 07/23.03.15 9,597,408.00 9,603,213.12 8.77 CZK 9,650,000 Beechwood Structured Fin Plc FRN Ser 2007-8 Tr 1 07/23.03.15 9,647,394.50 9,568,309.86 8.74 CZK 9,650,000 Brookfields Capital Plc FRN Ser 2007-8 Tr 1 07/23.03.15 9,647,394.50 9,597,259.86 8.76 CZK 9,650,000 Eperon Finance Plc FRN Ser 2007-8 Tr 1 07/23.03.15 9,647,394.50 9,600,154.86 8.77 CZK 4,800,000 Espaccio Securities Plc FRN Ser 2007-8 Tr 1 07/23.03.15 4,798,704.00 4,768,006.56 4.35 CZK 4,800,000 Greenstreet Struc Fin Prod Plc FRN Ser 2007-8 07/23.03.15 4,798,704.00 4,766,086.56 4.35 CZK 4,800,000 Nimrod Capital Plc FRN Ser 2007-8 Tr 1 07/23.03.15 4,798,704.00 4,762,246.56 4.35 CZK 4,850,000 Opal Financial Products Plc FRN Ser 2007-8 Tr 1 07/23.03.15 4,848,690.50 4,797,788.30 4.38 CZK 4,850,000 Profile Finance Plc FRN Ser 2007-8 Tr 1 07/23.03.15 4,848,690.50 4,781,783.30 4.37 CZK 4,850,000 Recolte Securities Plc FRN Ser 2007-8 Tr 1 07/23.03.15 4,848,690.50 4,790,998.30 4.37 CZK 4,800,000 Silverstate Fin Inv Plc FRN Ser 2007-8 07/23.03.15 4,798,704.00 4,772,326.56 4.36 CZK 4,800,000 Vespucci Strut Fin Prod Plc FRN Ser 2007-8 Tr 1 07/23.03.15 4,798,704.00 4,754,566.56 4.34 CZK 4,800,000 Vigado Capital Plc FRN Ser 2007-8 Tr 1 07/23.03.15 4,798,704.00 4,765,126.56 4.35 CZK 4,800,000 Voyce Investments Plc FRN Ser 2007-8 Tr 1 07/23.03.15 4,798,704.00 4,779,046.56 4.36 CZK 4,850,000 Waterford Cap Investments Plc FRN Ser 07-8 Tr 1 07/23.03.15 4,848,690.50 4,787,603.30 4.37 CZK 4,800,000 Waves Fin Inv Plc FRN Ser 2007-8 Tr 1 07/23.03.15 4,798,704.00 4,764,646.56 4.35
Total investments in securities 96,323,985.50 95,659,163.38 87.34
Cash at banks 12,422,074.07 11.34
Other net assets/(liabilities) 1,440,534.96 1.32
Total 109,521,772.41 100.00

FUND PARTNERS CSOB World Growth Plus 15
Statement of investments and other net assets (in CZK) as at 30th September 2010
The accompanying notes are an integral part of these financial statements.
178
Currency Number / nominal value
Description Cost Market value % of total net assets
Investments in securities
Transferable securities admitted to an official stock exchange listing
Bonds
CZK 12,450,000 Amethyst Structured Fin Plc FRN Ser 2007-8 Tr 1 07/23.03.15 12,438,670.50 12,454,167.02 8.75 CZK 12,550,000 Beechwood Structured Fin Plc FRN Ser 2007-8 Tr 1 07/23.03.15 12,538,579.50 12,443,760.49 8.75 CZK 12,550,000 Brookfields Capital Plc FRN Ser 2007-8 Tr 1 07/23.03.15 12,538,579.50 12,481,410.49 8.77 CZK 12,550,000 Eperon Finance Plc FRN Ser 2007-8 Tr 1 07/23.03.15 12,538,579.50 12,485,175.49 8.77 CZK 6,250,000 Espaccio Securities Plc FRN Ser 2007-8 Tr 1 07/23.03.15 6,244,312.50 6,208,341.88 4.36 CZK 6,250,000 Greenstreet Struc Fin Prod Plc FRN Ser 2007-8 07/23.03.15 6,244,312.50 6,205,841.88 4.36 CZK 6,250,000 Nimrod Capital Plc FRN Ser 2007-8 Tr 1 07/23.03.15 6,244,312.50 6,200,841.88 4.36 CZK 6,300,000 Opal Financial Products Plc FRN Ser 2007-8 Tr 1 07/23.03.15 6,294,267.00 6,232,178.61 4.38 CZK 6,300,000 Profile Finance Plc FRN Ser 2007-8 Tr 1 07/23.03.15 6,294,267.00 6,211,388.61 4.37 CZK 6,300,000 Recolte Securities Plc FRN Ser 2007-8 Tr 1 07/23.03.15 6,294,267.00 6,223,358.61 4.37 CZK 6,250,000 Silverstate Fin Inv Plc FRN Ser 2007-8 07/23.03.15 6,244,312.50 6,213,966.88 4.37 CZK 6,250,000 Vespucci Strut Fin Prod Plc FRN Ser 2007-8 Tr 1 07/23.03.15 6,244,312.50 6,190,841.88 4.35 CZK 6,250,000 Vigado Capital Plc FRN Ser 2007-8 Tr 1 07/23.03.15 6,244,312.50 6,204,591.88 4.36 CZK 6,250,000 Voyce Investments Plc FRN Ser 2007-8 Tr 1 07/23.03.15 6,244,312.50 6,222,716.88 4.37 CZK 6,300,000 Waterford Cap Investments Plc FRN Ser 07-8 Tr 1 07/23.03.15 6,294,267.00 6,218,948.61 4.37 CZK 6,250,000 Waves Fin Inv Plc FRN Ser 2007-8 Tr 1 07/23.03.15 6,244,312.50 6,203,966.88 4.36
Total investments in securities 125,185,977.00 124,401,497.97 87.42
Cash at banks 15,981,840.65 11.23
Other net assets/(liabilities) 1,915,269.73 1.35
Total 142,298,608.35 100.00

FUND PARTNERS CSOB World Growth Plus 16
Statement of investments and other net assets (in CZK) as at 30th September 2010
The accompanying notes are an integral part of these financial statements.
179
Currency Number / nominal value
Description Cost Market value % of total net assets
Investments in securities
Transferable securities admitted to an official stock exchange listing
Bonds
CZK 13,500,000 Amethyst Structured Fin Plc FRN Ser 2007-8 Tr 1 07/23.03.15 13,496,355.00 13,504,518.45 8.63 CZK 13,600,000 Beechwood Structured Fin Plc FRN Ser 2007-8 Tr 1 07/23.03.15 13,596,328.00 13,484,871.92 8.62 CZK 13,600,000 Brookfields Capital Plc FRN Ser 2007-8 Tr 1 07/23.03.15 13,596,328.00 13,525,671.92 8.65 CZK 13,600,000 Eperon Finance Plc FRN Ser 2007-8 Tr 1 07/23.03.15 13,596,328.00 13,529,751.92 8.65 CZK 6,800,000 Espaccio Securities Plc FRN Ser 2007-8 Tr 1 07/23.03.15 6,798,164.00 6,754,675.96 4.32 CZK 6,800,000 Greenstreet Struc Fin Prod Plc FRN Ser 2007-8 07/23.03.15 6,798,164.00 6,751,955.96 4.32 CZK 6,800,000 Nimrod Capital Plc FRN Ser 2007-8 Tr 1 07/23.03.15 6,798,164.00 6,746,515.96 4.31 CZK 6,800,000 Opal Financial Products Plc FRN Ser 2007-8 Tr 1 07/23.03.15 6,798,164.00 6,726,795.96 4.30 CZK 6,850,000 Profile Finance Plc FRN Ser 2007-8 Tr 1 07/23.03.15 6,848,150.50 6,753,652.70 4.32 CZK 6,800,000 Recolte Securities Plc FRN Ser 2007-8 Tr 1 07/23.03.15 6,798,164.00 6,717,275.96 4.29 CZK 6,750,000 Silverstate Fin Inv Plc FRN Ser 2007-8 07/23.03.15 6,748,177.50 6,711,084.23 4.29 CZK 6,800,000 Vespucci Strut Fin Prod Plc FRN Ser 2007-8 Tr 1 07/23.03.15 6,798,164.00 6,735,635.96 4.31 CZK 6,800,000 Vigado Capital Plc FRN Ser 2007-8 Tr 1 07/23.03.15 6,798,164.00 6,750,595.96 4.31 CZK 6,750,000 Voyce Investments Plc FRN Ser 2007-8 Tr 1 07/23.03.15 6,748,177.50 6,720,534.23 4.30 CZK 6,850,000 Waterford Cap Investments Plc FRN Ser 07-8 Tr 1 07/23.03.15 6,848,150.50 6,761,872.70 4.32 CZK 6,800,000 Waves Fin Inv Plc FRN Ser 2007-8 Tr 1 07/23.03.15 6,798,164.00 6,749,915.96 4.31
Total investments in securities 135,863,307.00 134,925,325.75 86.25
Cash at banks 17,184,949.67 10.99
Other net assets/(liabilities) 4,316,033.04 2.76
Total 156,426,308.46 100.00

FUND PARTNERS CSOB Short Term Growth 5
Statement of investments and other net assets (in CZK) as at 30th September 2010
The accompanying notes are an integral part of these financial statements.
180
Currency Number / nominal value
Description Cost Market value % of total net assets
Investments in securities
Transferable securities admitted to an official stock exchange listing
Bonds
CZK 24,650,000 Amethyst Structured Fin Plc FRN Ser 2007-15 Tr 1 07/10.07.15 24,556,356.87 24,673,074.87 8.85 CZK 24,800,000 Beechwood Structured Fin Plc FRN Ser 2007-15 07/10.07.15 24,705,787.04 24,604,975.28 8.83 CZK 24,750,000 Brookfields Capital Plc FRN Ser 2007-15 Tr 1 07/10.07.15 24,655,976.98 24,629,618.48 8.83 CZK 24,800,000 Eperon Finance Plc FRN Ser 2007-15 Tr 1 07/10.07.15 24,705,787.04 24,686,815.28 8.85 CZK 12,400,000 Espaccio Securities Plc FRN Ser 2007-15 Tr 1 07/10.07.15 12,352,893.52 12,324,807.64 4.42 CZK 12,400,000 Greenstreet Struc Fin Prod Plc FRN Ser 2007-15 07/10.07.15 12,352,893.52 12,319,847.64 4.42 CZK 12,400,000 Nimrod Capital Plc FRN Ser 2007-15 Tr 1 07/10.07.15 12,352,893.52 12,309,927.64 4.42 CZK 12,400,000 Opal Financial Products Plc FRN Ser 2007-15 Tr 1 07/10.07.15 12,352,893.52 12,273,967.64 4.40 CZK 12,500,000 Profile Finance Plc FRN Ser 2007-15 Tr 1 07/10.07.15 12,452,513.63 12,331,701.25 4.42 CZK 12,450,000 Recolte Securities Plc FRN Ser 2007-15 Tr 1 07/10.07.15 12,402,703.57 12,306,029.44 4.41 CZK 12,350,000 Silverstate Fin Inv Plc FRN Ser 2007-15 Tr 1 07/10.07.15 12,303,083.46 12,286,225.83 4.41 CZK 12,400,000 Vespucci Strut Fin Prod Plc FRN Ser 2007-15 Tr 1 07/10.07.15 12,352,893.52 12,290,087.64 4.41 CZK 12,450,000 Vigado Capital Plc FRN Ser 2007-15 Tr 1 07/10.07.15 12,402,703.57 12,367,034.44 4.44 CZK 12,350,000 Voyce Investments Plc FRN Ser 2007-15 Tr 1 07/10.07.15 12,303,083.46 12,303,515.83 4.41 CZK 12,450,000 Waterford Cap Investments Plc FRN Ser 2007-15 07/10.07.15 12,402,703.57 12,297,314.44 4.41 CZK 12,400,000 Waves Fin Inv Plc FRN Ser 2007-15 Tr 1 07/10.07.15 12,352,893.52 12,316,127.64 4.42
Total investments in securities 247,008,060.31 246,321,070.98 88.35
Cash at banks 2,768,204.33 0.99
Other net assets/(liabilities) 29,702,101.06 10.66
Total 278,791,376.37 100.00
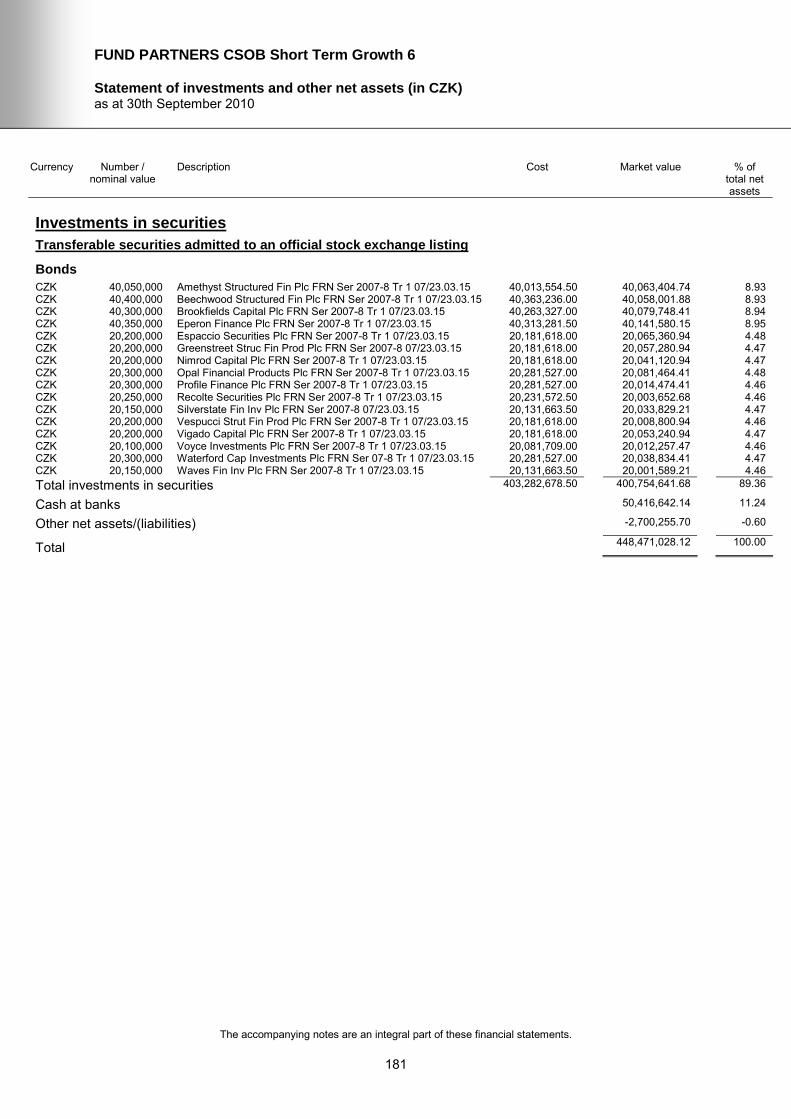
FUND PARTNERS CSOB Short Term Growth 6
Statement of investments and other net assets (in CZK) as at 30th September 2010
The accompanying notes are an integral part of these financial statements.
181
Currency Number / nominal value
Description Cost Market value % of total net assets
Investments in securities
Transferable securities admitted to an official stock exchange listing
Bonds
CZK 40,050,000 Amethyst Structured Fin Plc FRN Ser 2007-8 Tr 1 07/23.03.15 40,013,554.50 40,063,404.74 8.93 CZK 40,400,000 Beechwood Structured Fin Plc FRN Ser 2007-8 Tr 1 07/23.03.15 40,363,236.00 40,058,001.88 8.93 CZK 40,300,000 Brookfields Capital Plc FRN Ser 2007-8 Tr 1 07/23.03.15 40,263,327.00 40,079,748.41 8.94 CZK 40,350,000 Eperon Finance Plc FRN Ser 2007-8 Tr 1 07/23.03.15 40,313,281.50 40,141,580.15 8.95 CZK 20,200,000 Espaccio Securities Plc FRN Ser 2007-8 Tr 1 07/23.03.15 20,181,618.00 20,065,360.94 4.48 CZK 20,200,000 Greenstreet Struc Fin Prod Plc FRN Ser 2007-8 07/23.03.15 20,181,618.00 20,057,280.94 4.47 CZK 20,200,000 Nimrod Capital Plc FRN Ser 2007-8 Tr 1 07/23.03.15 20,181,618.00 20,041,120.94 4.47 CZK 20,300,000 Opal Financial Products Plc FRN Ser 2007-8 Tr 1 07/23.03.15 20,281,527.00 20,081,464.41 4.48 CZK 20,300,000 Profile Finance Plc FRN Ser 2007-8 Tr 1 07/23.03.15 20,281,527.00 20,014,474.41 4.46 CZK 20,250,000 Recolte Securities Plc FRN Ser 2007-8 Tr 1 07/23.03.15 20,231,572.50 20,003,652.68 4.46 CZK 20,150,000 Silverstate Fin Inv Plc FRN Ser 2007-8 07/23.03.15 20,131,663.50 20,033,829.21 4.47 CZK 20,200,000 Vespucci Strut Fin Prod Plc FRN Ser 2007-8 Tr 1 07/23.03.15 20,181,618.00 20,008,800.94 4.46 CZK 20,200,000 Vigado Capital Plc FRN Ser 2007-8 Tr 1 07/23.03.15 20,181,618.00 20,053,240.94 4.47 CZK 20,100,000 Voyce Investments Plc FRN Ser 2007-8 Tr 1 07/23.03.15 20,081,709.00 20,012,257.47 4.46 CZK 20,300,000 Waterford Cap Investments Plc FRN Ser 07-8 Tr 1 07/23.03.15 20,281,527.00 20,038,834.41 4.47 CZK 20,150,000 Waves Fin Inv Plc FRN Ser 2007-8 Tr 1 07/23.03.15 20,131,663.50 20,001,589.21 4.46
Total investments in securities 403,282,678.50 400,754,641.68 89.36
Cash at banks 50,416,642.14 11.24
Other net assets/(liabilities) -2,700,255.70 -0.60
Total 448,471,028.12 100.00

FUND PARTNERS CSOB Financials Short Term Growth 1
Statement of investments and other net assets (in CZK) as at 30th September 2010
The accompanying notes are an integral part of these financial statements.
182
Currency Number / nominal value
Description Cost Market value % of total net assets
Investments in securities
Transferable securities admitted to an official stock exchange listing
Bonds
CZK 49,100,000 Amethyst Structured Fin Plc FRN Ser 2007-8 Tr 1 07/23.03.15 49,086,743.00 49,116,433.77 8.94 CZK 49,450,000 Beechwood Structured Fin Plc FRN Ser 2007-8 Tr 1 07/23.03.15 49,436,648.50 49,031,390.92 8.93 CZK 49,400,000 Brookfields Capital Plc FRN Ser 2007-8 Tr 1 07/23.03.15 49,386,662.00 49,130,014.18 8.94 CZK 49,450,000 Eperon Finance Plc FRN Ser 2007-8 Tr 1 07/23.03.15 49,436,648.50 49,194,575.92 8.96 CZK 24,750,000 Espaccio Securities Plc FRN Ser 2007-8 Tr 1 07/23.03.15 24,743,317.50 24,585,033.83 4.48 CZK 24,750,000 Greenstreet Struc Fin Prod Plc FRN Ser 2007-8 07/23.03.15 24,743,317.50 24,575,133.83 4.47 CZK 24,750,000 Nimrod Capital Plc FRN Ser 2007-8 Tr 1 07/23.03.15 24,743,317.50 24,555,333.83 4.47 CZK 24,850,000 Opal Financial Products Plc FRN Ser 2007-8 Tr 1 07/23.03.15 24,843,290.50 24,582,482.30 4.47 CZK 24,900,000 Profile Finance Plc FRN Ser 2007-8 Tr 1 07/23.03.15 24,893,277.00 24,549,774.03 4.47 CZK 24,850,000 Recolte Securities Plc FRN Ser 2007-8 Tr 1 07/23.03.15 24,843,290.50 24,547,692.30 4.47 CZK 24,700,000 Silverstate Fin Inv Plc FRN Ser 2007-8 07/23.03.15 24,693,331.00 24,557,597.09 4.47 CZK 24,750,000 Vespucci Strut Fin Prod Plc FRN Ser 2007-8 Tr 1 07/23.03.15 24,743,317.50 24,515,733.83 4.46 CZK 24,750,000 Vigado Capital Plc FRN Ser 2007-8 Tr 1 07/23.03.15 24,743,317.50 24,570,183.83 4.47 CZK 24,650,000 Voyce Investments Plc FRN Ser 2007-8 Tr 1 07/23.03.15 24,643,344.50 24,542,395.36 4.47 CZK 24,850,000 Waterford Cap Investments Plc FRN Ser 07-8 Tr 1 07/23.03.15 24,843,290.50 24,530,297.30 4.47 CZK 24,700,000 Waves Fin Inv Plc FRN Ser 2007-8 Tr 1 07/23.03.15 24,693,331.00 24,518,077.09 4.46
Total investments in securities 494,516,444.50 491,102,149.41 89.40
Cash at banks 61,521,151.87 11.20
Other net assets/(liabilities) -3,299,798.48 -0.60
Total 549,323,502.80 100.00

FUND PARTNERS CSOB Europe Real Estate Growth Plus 2
Statement of investments and other net assets (in CZK) as at 30th September 2010
The accompanying notes are an integral part of these financial statements.
183
Currency Number / nominal value
Description Cost Market value % of total net assets
Investments in securities
Transferable securities admitted to an official stock exchange listing
Bonds
CZK 20,250,000 Amethyst Structured Fin Plc FRN Ser 2007-8 Tr 1 07/23.03.15 20,200,182.15 20,256,777.68 9.10 CZK 20,400,000 Beechwood Structured Fin Plc FRN Ser 2007-8 Tr 1 07/23.03.15 20,349,813.13 20,227,307.88 9.08 CZK 20,350,000 Brookfields Capital Plc FRN Ser 2007-8 Tr 1 07/23.03.15 20,299,936.13 20,238,781.15 9.09 CZK 20,400,000 Eperon Finance Plc FRN Ser 2007-8 Tr 1 07/23.03.15 20,349,813.13 20,294,627.88 9.11 CZK 10,200,000 Espaccio Securities Plc FRN Ser 2007-8 Tr 1 07/23.03.15 10,174,906.55 10,132,013.94 4.55 CZK 10,200,000 Greenstreet Struc Fin Prod Plc FRN Ser 2007-8 07/23.03.15 10,174,906.55 10,127,933.94 4.55 CZK 10,200,000 Nimrod Capital Plc FRN Ser 2007-8 Tr 1 07/23.03.15 10,174,906.55 10,119,773.94 4.55 CZK 10,250,000 Opal Financial Products Plc FRN Ser 2007-8 Tr 1 07/23.03.15 10,224,783.54 10,139,655.68 4.55 CZK 10,250,000 Profile Finance Plc FRN Ser 2007-8 Tr 1 07/23.03.15 10,224,783.54 10,105,830.68 4.54 CZK 10,250,000 Recolte Securities Plc FRN Ser 2007-8 Tr 1 07/23.03.15 10,224,783.54 10,125,305.68 4.55 CZK 10,150,000 Silverstate Fin Inv Plc FRN Ser 2007-8 07/23.03.15 10,125,029.56 10,091,482.21 4.53 CZK 10,200,000 Vespucci Strut Fin Prod Plc FRN Ser 2007-8 Tr 1 07/23.03.15 10,174,906.55 10,103,453.94 4.54 CZK 10,200,000 Vigado Capital Plc FRN Ser 2007-8 Tr 1 07/23.03.15 10,174,906.55 10,125,893.94 4.55 CZK 10,150,000 Voyce Investments Plc FRN Ser 2007-8 Tr 1 07/23.03.15 10,125,029.56 10,105,692.21 4.54 CZK 10,250,000 Waterford Cap Investments Plc FRN Ser 07-8 Tr 1 07/23.03.15 10,224,783.54 10,118,130.68 4.54 CZK 10,200,000 Waves Fin Inv Plc FRN Ser 2007-8 Tr 1 07/23.03.15 10,174,906.55 10,124,873.94 4.55
Total investments in securities 203,398,377.12 202,437,535.37 90.92
Cash at banks 25,131,342.55 11.29
Other net assets/(liabilities) -4,903,318.22 -2.21
Total 222,665,559.70 100.00
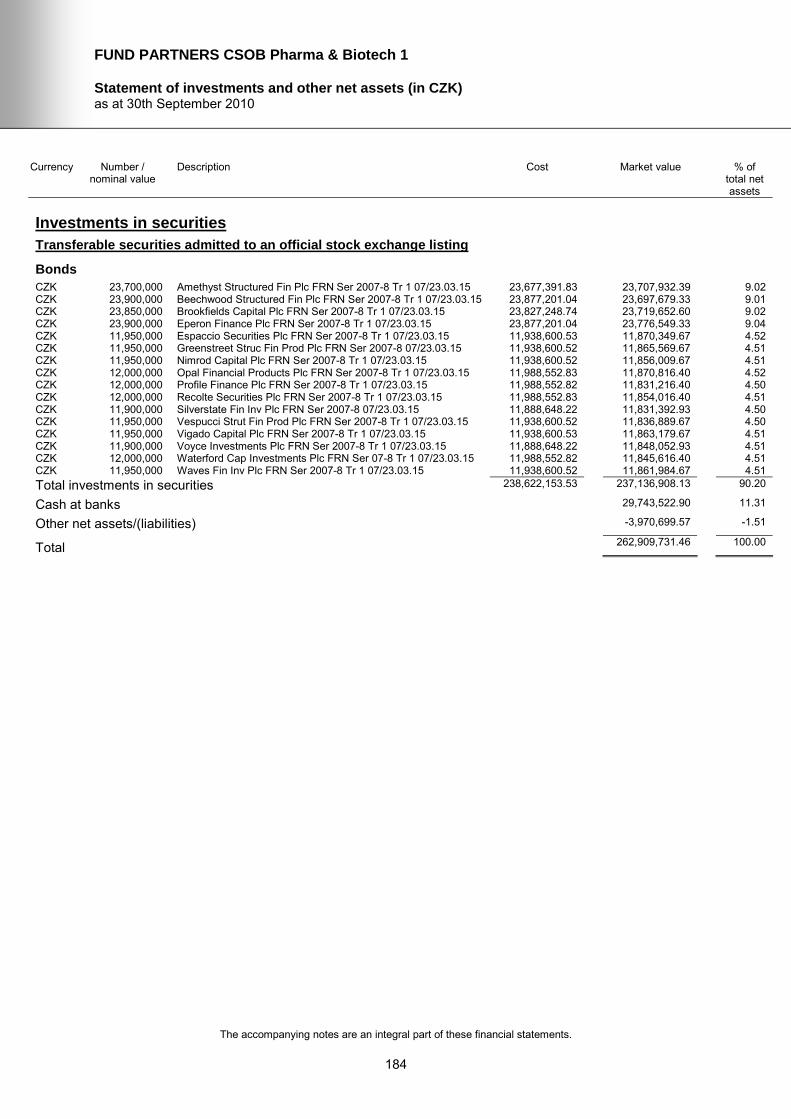
FUND PARTNERS CSOB Pharma & Biotech 1
Statement of investments and other net assets (in CZK) as at 30th September 2010
The accompanying notes are an integral part of these financial statements.
184
Currency Number / nominal value
Description Cost Market value % of total net assets
Investments in securities
Transferable securities admitted to an official stock exchange listing
Bonds
CZK 23,700,000 Amethyst Structured Fin Plc FRN Ser 2007-8 Tr 1 07/23.03.15 23,677,391.83 23,707,932.39 9.02 CZK 23,900,000 Beechwood Structured Fin Plc FRN Ser 2007-8 Tr 1 07/23.03.15 23,877,201.04 23,697,679.33 9.01 CZK 23,850,000 Brookfields Capital Plc FRN Ser 2007-8 Tr 1 07/23.03.15 23,827,248.74 23,719,652.60 9.02 CZK 23,900,000 Eperon Finance Plc FRN Ser 2007-8 Tr 1 07/23.03.15 23,877,201.04 23,776,549.33 9.04 CZK 11,950,000 Espaccio Securities Plc FRN Ser 2007-8 Tr 1 07/23.03.15 11,938,600.53 11,870,349.67 4.52 CZK 11,950,000 Greenstreet Struc Fin Prod Plc FRN Ser 2007-8 07/23.03.15 11,938,600.52 11,865,569.67 4.51 CZK 11,950,000 Nimrod Capital Plc FRN Ser 2007-8 Tr 1 07/23.03.15 11,938,600.52 11,856,009.67 4.51 CZK 12,000,000 Opal Financial Products Plc FRN Ser 2007-8 Tr 1 07/23.03.15 11,988,552.83 11,870,816.40 4.52 CZK 12,000,000 Profile Finance Plc FRN Ser 2007-8 Tr 1 07/23.03.15 11,988,552.82 11,831,216.40 4.50 CZK 12,000,000 Recolte Securities Plc FRN Ser 2007-8 Tr 1 07/23.03.15 11,988,552.83 11,854,016.40 4.51 CZK 11,900,000 Silverstate Fin Inv Plc FRN Ser 2007-8 07/23.03.15 11,888,648.22 11,831,392.93 4.50 CZK 11,950,000 Vespucci Strut Fin Prod Plc FRN Ser 2007-8 Tr 1 07/23.03.15 11,938,600.52 11,836,889.67 4.50 CZK 11,950,000 Vigado Capital Plc FRN Ser 2007-8 Tr 1 07/23.03.15 11,938,600.53 11,863,179.67 4.51 CZK 11,900,000 Voyce Investments Plc FRN Ser 2007-8 Tr 1 07/23.03.15 11,888,648.22 11,848,052.93 4.51 CZK 12,000,000 Waterford Cap Investments Plc FRN Ser 07-8 Tr 1 07/23.03.15 11,988,552.82 11,845,616.40 4.51 CZK 11,950,000 Waves Fin Inv Plc FRN Ser 2007-8 Tr 1 07/23.03.15 11,938,600.52 11,861,984.67 4.51
Total investments in securities 238,622,153.53 237,136,908.13 90.20
Cash at banks 29,743,522.90 11.31
Other net assets/(liabilities) -3,970,699.57 -1.51
Total 262,909,731.46 100.00

FUND PARTNERS Warta Asia 2
Statement of investments and other net assets (in PLN) as at 30th September 2010
The accompanying notes are an integral part of these financial statements.
185
Currency Number / nominal value
Description Cost Market value % of total net assets
Investments in securities
Transferable securities admitted to an official stock exchange listing
Bonds
PLN 3,350,000 Amethyst Structured Fin Plc FRN Ser 2007-16 Tr 1 07/10.07.15 3,349,778.60 3,352,499.10 8.43 PLN 3,370,000 Beechwood Structured Fin Plc FRN Ser 2007-16 07/10.07.15 3,369,777.28 3,342,858.02 8.40 PLN 3,360,000 Brookfields Capital Plc FRN Ser 2007-16 Tr 1 07/10.07.15 3,359,777.94 3,343,018.56 8.40 PLN 3,365,000 Eperon Finance Plc FRN Ser 2007-16 Tr 1 07/10.07.15 3,364,777.61 3,349,002.79 8.42 PLN 1,685,000 Espaccio Securities Plc FRN Ser 2007-16 Tr 1 07/10.07.15 1,684,888.64 1,674,462.01 4.21 PLN 1,685,000 Greenstreet Struc Fin Prod Plc FRN Ser 2007-16 07/10.07.15 1,684,888.64 1,673,788.01 4.21 PLN 1,685,000 Nimrod Capital Plc FRN Ser 2007-16 Tr 1 07/10.07.15 1,684,888.64 1,672,440.01 4.20 PLN 1,685,000 Opal Financial Products Plc FRN Ser 2007-16 Tr 1 07/10.07.15 1,684,888.64 1,667,553.51 4.19 PLN 1,695,000 Profile Finance Plc FRN Ser 2007-16 Tr 1 07/10.07.15 1,694,887.98 1,671,856.47 4.20 PLN 1,690,000 Recolte Securities Plc FRN Ser 2007-16 Tr 1 07/10.07.15 1,689,888.31 1,670,135.74 4.20 PLN 1,680,000 Silverstate Fin Inv Plc FRN Ser 2007-16 Tr 1 07/10.07.15 1,679,888.97 1,671,005.28 4.20 PLN 1,685,000 Vespucci Strut Fin Prod Plc FRN Ser 2007-16 07/10.07.15 1,684,888.64 1,669,744.01 4.20 PLN 1,690,000 Vigado Capital Plc FRN Ser 2007-16 Tr 1 07/10.07.15 1,689,888.31 1,678,416.74 4.22 PLN 1,680,000 Voyce Investments Plc FRN Ser 2007-16 Tr 1 07/10.07.15 1,679,888.97 1,673,357.28 4.21 PLN 1,690,000 Waterford Cap Investments Plc FRN Ser 2007-16 07/10.07.15 1,689,888.31 1,668,952.74 4.20 PLN 1,685,000 Waves Fin Investments Plc FRN Ser 2007-16 Tr 1 07/10.07.15 1,684,888.64 1,673,282.51 4.21
Total investments in securities 33,677,774.12 33,452,372.78 84.10
Cash at banks 3,470,401.89 8.73
Other net assets/(liabilities) 2,852,198.95 7.17
Total 39,774,973.62 100.00
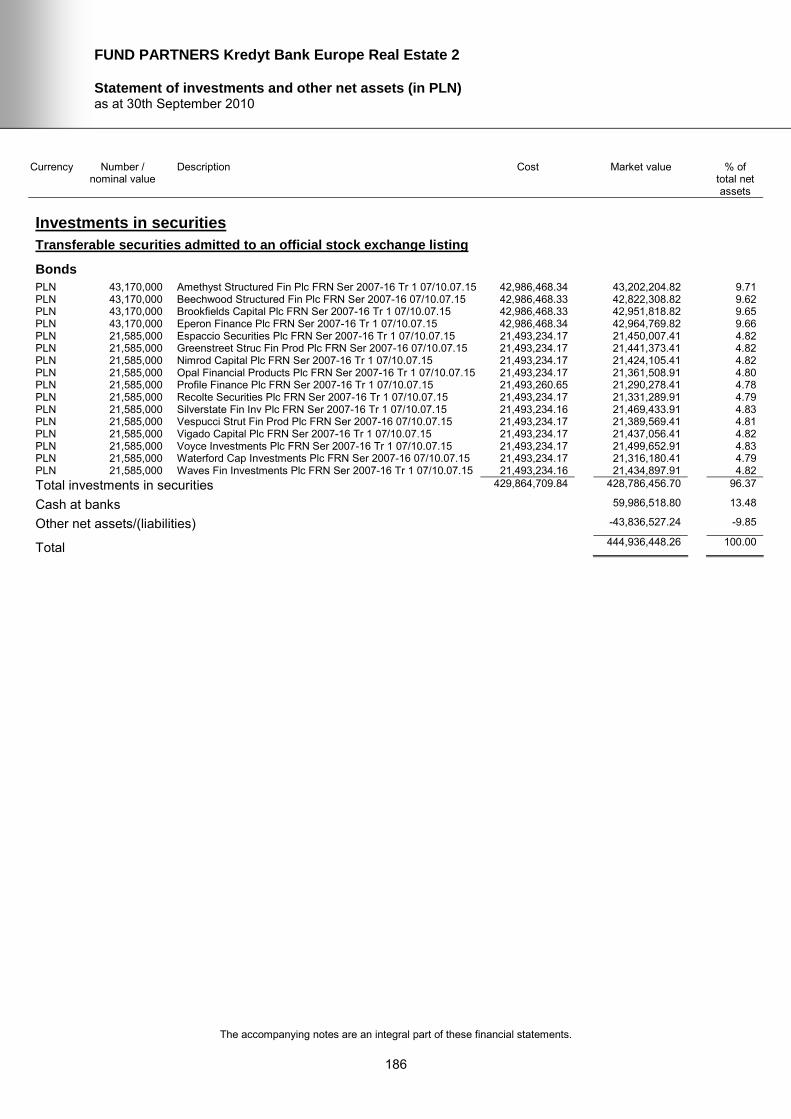
FUND PARTNERS Kredyt Bank Europe Real Estate 2
Statement of investments and other net assets (in PLN) as at 30th September 2010
The accompanying notes are an integral part of these financial statements.
186
Currency Number / nominal value
Description Cost Market value % of total net assets
Investments in securities
Transferable securities admitted to an official stock exchange listing
Bonds
PLN 43,170,000 Amethyst Structured Fin Plc FRN Ser 2007-16 Tr 1 07/10.07.15 42,986,468.34 43,202,204.82 9.71 PLN 43,170,000 Beechwood Structured Fin Plc FRN Ser 2007-16 07/10.07.15 42,986,468.33 42,822,308.82 9.62 PLN 43,170,000 Brookfields Capital Plc FRN Ser 2007-16 Tr 1 07/10.07.15 42,986,468.33 42,951,818.82 9.65 PLN 43,170,000 Eperon Finance Plc FRN Ser 2007-16 Tr 1 07/10.07.15 42,986,468.34 42,964,769.82 9.66 PLN 21,585,000 Espaccio Securities Plc FRN Ser 2007-16 Tr 1 07/10.07.15 21,493,234.17 21,450,007.41 4.82 PLN 21,585,000 Greenstreet Struc Fin Prod Plc FRN Ser 2007-16 07/10.07.15 21,493,234.17 21,441,373.41 4.82 PLN 21,585,000 Nimrod Capital Plc FRN Ser 2007-16 Tr 1 07/10.07.15 21,493,234.17 21,424,105.41 4.82 PLN 21,585,000 Opal Financial Products Plc FRN Ser 2007-16 Tr 1 07/10.07.15 21,493,234.17 21,361,508.91 4.80 PLN 21,585,000 Profile Finance Plc FRN Ser 2007-16 Tr 1 07/10.07.15 21,493,260.65 21,290,278.41 4.78 PLN 21,585,000 Recolte Securities Plc FRN Ser 2007-16 Tr 1 07/10.07.15 21,493,234.17 21,331,289.91 4.79 PLN 21,585,000 Silverstate Fin Inv Plc FRN Ser 2007-16 Tr 1 07/10.07.15 21,493,234.16 21,469,433.91 4.83 PLN 21,585,000 Vespucci Strut Fin Prod Plc FRN Ser 2007-16 07/10.07.15 21,493,234.17 21,389,569.41 4.81 PLN 21,585,000 Vigado Capital Plc FRN Ser 2007-16 Tr 1 07/10.07.15 21,493,234.17 21,437,056.41 4.82 PLN 21,585,000 Voyce Investments Plc FRN Ser 2007-16 Tr 1 07/10.07.15 21,493,234.17 21,499,652.91 4.83 PLN 21,585,000 Waterford Cap Investments Plc FRN Ser 2007-16 07/10.07.15 21,493,234.17 21,316,180.41 4.79 PLN 21,585,000 Waves Fin Investments Plc FRN Ser 2007-16 Tr 1 07/10.07.15 21,493,234.16 21,434,897.91 4.82
Total investments in securities 429,864,709.84 428,786,456.70 96.37
Cash at banks 59,986,518.80 13.48
Other net assets/(liabilities) -43,836,527.24 -9.85
Total 444,936,448.26 100.00

FUND PARTNERS Kredyt Bank Global Real Estate 2
Statement of investments and other net assets (in PLN) as at 30th September 2010
The accompanying notes are an integral part of these financial statements.
187
Currency Number / nominal value
Description Cost Market value % of total net assets
Investments in securities
Transferable securities admitted to an official stock exchange listing
Bonds
PLN 6,570,000 Amethyst Structured Fin Plc FRN Ser 2007-16 Tr 1 07/10.07.15 6,553,222.89 6,574,901.22 9.81 PLN 6,570,000 Beechwood Structured Fin Plc FRN Ser 2007-16 07/10.07.15 6,553,222.89 6,517,085.22 9.72 PLN 6,570,000 Brookfields Capital Plc FRN Ser 2007-16 Tr 1 07/10.07.15 6,553,222.89 6,536,795.22 9.75 PLN 6,570,000 Eperon Finance Plc FRN Ser 2007-16 Tr 1 07/10.07.15 6,553,222.89 6,538,766.22 9.76 PLN 3,285,000 Espaccio Securities Plc FRN Ser 2007-16 Tr 1 07/10.07.15 3,276,611.46 3,264,455.61 4.87 PLN 3,285,000 Greenstreet Struc Fin Prod Plc FRN Ser 2007-16 07/10.07.15 3,276,611.46 3,263,141.61 4.87 PLN 3,285,000 Nimrod Capital Plc FRN Ser 2007-16 Tr 1 07/10.07.15 3,276,611.46 3,260,513.61 4.86 PLN 3,285,000 Opal Financial Products Plc FRN Ser 2007-16 Tr 1 07/10.07.15 3,276,611.46 3,250,987.11 4.85 PLN 3,285,000 Profile Finance Plc FRN Ser 2007-16 Tr 1 07/10.07.15 3,276,611.46 3,240,146.61 4.83 PLN 3,285,000 Recolte Securities Plc FRN Ser 2007-16 Tr 1 07/10.07.15 3,276,611.46 3,246,388.11 4.84 PLN 3,285,000 Silverstate Fin Inv Plc FRN Ser 2007-16 Tr 1 07/10.07.15 3,276,611.46 3,267,412.11 4.88 PLN 3,285,000 Vespucci Strut Fin Prod Plc FRN Ser 2007-16 07/10.07.15 3,276,611.46 3,255,257.61 4.86 PLN 3,285,000 Vigado Capital Plc FRN Ser 2007-16 Tr 1 07/10.07.15 3,276,611.46 3,262,484.61 4.87 PLN 3,285,000 Voyce Investments Plc FRN Ser 2007-16 Tr 1 07/10.07.15 3,276,611.46 3,272,011.11 4.88 PLN 3,285,000 Waterford Cap Investments Plc FRN Ser 2007-16 07/10.07.15 3,276,611.46 3,244,088.61 4.84 PLN 3,285,000 Waves Fin Investments Plc FRN Ser 2007-16 Tr 1 07/10.07.15 3,276,611.46 3,262,156.11 4.87
Total investments in securities 65,532,229.08 65,256,590.70 97.36
Cash at banks 5,953,505.23 8.88
Other net assets/(liabilities) -4,183,689.05 -6.24
Total 67,026,406.88 100.00

FUND PARTNERS Warta Infrastructure 1
Statement of investments and other net assets (in PLN) as at 30th September 2010
The accompanying notes are an integral part of these financial statements.
188
Currency Number / nominal value
Description Cost Market value % of total net assets
Investments in securities
Transferable securities admitted to an official stock exchange listing
Bonds
PLN 1,955,000 Amethyst Structured Fin Plc FRN Ser 2007-10 Tr 1 07/23.03.15 1,954,511.25 1,956,280.13 9.34 PLN 1,970,000 Beechwood Structured Fin Plc FRN Ser 2007-10 07/23.03.15 1,969,507.50 1,953,953.95 9.32 PLN 1,965,000 Brookfields Capital Plc FRN Ser 2007-10 Tr 1 07/23.03.15 1,964,508.75 1,954,889.69 9.33 PLN 1,970,000 Eperon Finance Plc FRN Ser 2007-10 Tr 1 07/23.03.15 1,969,507.50 1,960,454.95 9.35 PLN 985,000 Espaccio Securities Plc FRN Ser 2007-10 Tr 1 07/23.03.15 984,753.75 978,749.98 4.67 PLN 985,000 Greenstreet Struc Fin Prod Plc FRN Ser 2007-10 07/23.03.15 984,753.75 978,355.98 4.67 PLN 985,000 Nimrod Capital Plc FRN Ser 2007-10 Tr 1 07/23.03.15 984,753.75 977,567.98 4.66 PLN 990,000 Opal Financial Products Plc FRN Ser 2007-10 Tr 1 07/23.03.15 989,752.50 979,659.25 4.67 PLN 990,000 Profile Finance Plc FRN Ser 2007-10 Tr 1 07/23.03.15 989,752.50 976,392.25 4.66 PLN 990,000 Recolte Securities Plc FRN Ser 2007-10 Tr 1 07/23.03.15 989,752.50 978,273.25 4.67 PLN 980,000 Silverstate Fin Inv Plc FRN Ser 2007-10 Tr 1 07/23.03.15 979,755.00 974,663.70 4.65 PLN 985,000 Vespucci Strut Fin Prod Plc FRN Ser 2007-10 07/23.03.15 984,753.75 975,991.98 4.66 PLN 985,000 Vigado Capital Plc FRN Ser 2007-10 Tr 1 07/23.03.15 984,753.75 978,158.98 4.67 PLN 980,000 Voyce Investments Plc FRN Ser 2007-10 Tr 1 07/23.03.15 979,755.00 976,035.70 4.66 PLN 990,000 Waterford Cap Investments Plc FRN Ser 2007-10 07/23.03.15 989,752.50 977,580.25 4.66 PLN 985,000 Waves Fin Investments Plc FRN Ser 2007-10 Tr 1 07/23.03.15 984,753.75 978,060.48 4.67
Total investments in securities 19,685,077.50 19,555,068.50 93.31
Cash at banks 2,367,331.35 11.30
Other net assets/(liabilities) -966,139.83 -4.61
Total 20,956,260.02 100.00

FUND PARTNERS CSOB Performance Lock 1
Statement of investments and other net assets (in CZK) as at 30th September 2010
The accompanying notes are an integral part of these financial statements.
189
Currency Number / nominal value
Description Cost Market value % of total net assets
Investments in securities
Transferable securities admitted to an official stock exchange listing
Bonds
CZK 6,400,000 Amethyst Structured Fin Plc FRN Ser 2007-15 Tr 1 07/10.07.15 6,373,455.34 6,405,991.04 9.25 CZK 6,450,000 Beechwood Structured Fin Plc FRN Ser 2007-15 07/10.07.15 6,423,247.96 6,399,277.85 9.25 CZK 6,400,000 Brookfields Capital Plc FRN Ser 2007-15 Tr 1 07/10.07.15 6,373,455.34 6,368,871.04 9.20 CZK 6,450,000 Eperon Finance Plc FRN Ser 2007-15 Tr 1 07/10.07.15 6,423,247.96 6,420,562.85 9.28 CZK 3,200,000 Espaccio Securities Plc FRN Ser 2007-15 Tr 1 07/10.07.15 3,186,727.68 3,180,595.52 4.59 CZK 3,200,000 Greenstreet Struc Fin Prod Plc FRN Ser 2007-15 07/10.07.15 3,186,727.68 3,179,315.52 4.59 CZK 3,200,000 Nimrod Capital Plc FRN Ser 2007-15 Tr 1 07/10.07.15 3,186,727.68 3,176,755.52 4.59 CZK 3,200,000 Opal Financial Products Plc FRN Ser 2007-15 Tr 1 07/10.07.15 3,186,727.68 3,167,475.52 4.58 CZK 3,250,000 Profile Finance Plc FRN Ser 2007-15 Tr 1 07/10.07.15 3,236,520.30 3,206,242.32 4.63 CZK 3,200,000 Recolte Securities Plc FRN Ser 2007-15 Tr 1 07/10.07.15 3,186,727.68 3,162,995.52 4.57 CZK 3,200,000 Silverstate Fin Inv Plc FRN Ser 2007-15 Tr 1 07/10.07.15 3,186,727.68 3,183,475.52 4.60 CZK 3,200,000 Vespucci Strut Fin Prod Plc FRN Ser 2007-15 Tr 1 07/10.07.15 3,186,727.68 3,171,635.52 4.58 CZK 3,200,000 Vigado Capital Plc FRN Ser 2007-15 Tr 1 07/10.07.15 3,186,727.68 3,178,675.52 4.59 CZK 3,200,000 Voyce Investments Plc FRN Ser 2007-15 Tr 1 07/10.07.15 3,186,727.68 3,187,955.52 4.61 CZK 3,200,000 Waterford Cap Investments Plc FRN Ser 2007-15 07/10.07.15 3,186,727.68 3,160,755.52 4.57 CZK 3,200,000 Waves Fin Inv Plc FRN Ser 2007-15 Tr 1 07/10.07.15 3,186,727.68 3,178,355.52 4.59
Total investments in securities 63,883,931.38 63,728,935.82 92.07
Cash at banks 6,502,897.99 9.39
Other net assets/(liabilities) -1,013,331.57 -1.46
Total 69,218,502.24 100.00

FUND PARTNERS CSOB Bull & Bear 1
Statement of investments and other net assets (in CZK) as at 30th September 2010
The accompanying notes are an integral part of these financial statements.
190
Currency Number / nominal value
Description Cost Market value % of total net assets
Investments in securities
Transferable securities admitted to an official stock exchange listing
Bonds
CZK 13,550,000 Amethyst Structured Fin Plc FRN Ser 2007-15 Tr 1 07/10.07.15 13,525,867.45 13,562,684.16 9.45 CZK 13,600,000 Beechwood Structured Fin Plc FRN Ser 2007-15 07/10.07.15 13,575,778.40 13,493,050.96 9.40 CZK 13,600,000 Brookfields Capital Plc FRN Ser 2007-15 Tr 1 07/10.07.15 13,575,778.40 13,533,850.96 9.43 CZK 13,600,000 Eperon Finance Plc FRN Ser 2007-15 Tr 1 07/10.07.15 13,575,778.40 13,537,930.96 9.44 CZK 6,800,000 Espaccio Securities Plc FRN Ser 2007-15 Tr 1 07/10.07.15 6,787,889.21 6,758,765.48 4.71 CZK 6,800,000 Greenstreet Struc Fin Prod Plc FRN Ser 2007-15 07/10.07.15 6,787,889.21 6,756,045.48 4.71 CZK 6,800,000 Nimrod Capital Plc FRN Ser 2007-15 Tr 1 07/10.07.15 6,787,889.21 6,750,605.48 4.71 CZK 6,800,000 Opal Financial Products Plc FRN Ser 2007-15 Tr 1 07/10.07.15 6,787,889.21 6,730,885.48 4.69 CZK 6,850,000 Profile Finance Plc FRN Ser 2007-15 Tr 1 07/10.07.15 6,837,800.16 6,757,772.28 4.71 CZK 6,800,000 Recolte Securities Plc FRN Ser 2007-15 Tr 1 07/10.07.15 6,787,889.21 6,721,365.48 4.68 CZK 6,800,000 Silverstate Fin Inv Plc FRN Ser 2007-15 Tr 1 07/10.07.15 6,787,889.21 6,764,885.48 4.72 CZK 6,800,000 Vespucci Strut Fin Prod Plc FRN Ser 2007-15 Tr 1 07/10.07.15 6,787,889.21 6,739,725.48 4.70 CZK 6,800,000 Vigado Capital Plc FRN Ser 2007-15 Tr 1 07/10.07.15 6,787,889.21 6,754,685.48 4.71 CZK 6,800,000 Voyce Investments Plc FRN Ser 2007-15 Tr 1 07/10.07.15 6,787,889.21 6,774,405.48 4.72 CZK 6,800,000 Waterford Cap Investments Plc FRN Ser 2007-15 07/10.07.15 6,787,889.21 6,716,605.48 4.68 CZK 6,800,000 Waves Fin Inv Plc FRN Ser 2007-15 Tr 1 07/10.07.15 6,787,889.21 6,754,005.48 4.71
Total investments in securities 135,757,784.12 135,107,269.60 94.17
Cash at banks 4,237,574.22 2.95
Other net assets/(liabilities) 4,121,951.85 2.88
Total 143,466,795.67 100.00

FUND PARTNERS Kredyt Bank Variable Participation 1
Statement of investments and other net assets (in PLN) as at 30th September 2010
The accompanying notes are an integral part of these financial statements.
191
Currency Number / nominal value
Description Cost Market value % of total net assets
Investments in securities
Transferable securities admitted to an official stock exchange listing
Bonds
PLN 2,405,000 Amethyst Structured Fin Plc FRN Ser 2007-10 Tr 1 07/23.03.15 2,400,802.89 2,406,574.79 9.60 PLN 2,425,000 Beechwood Structured Fin Plc FRN Ser 2007-10 07/23.03.15 2,420,767.99 2,405,247.89 9.60 PLN 2,415,000 Brookfields Capital Plc FRN Ser 2007-10 Tr 1 07/23.03.15 2,410,785.44 2,402,574.35 9.58 PLN 2,420,000 Eperon Finance Plc FRN Ser 2007-10 Tr 1 07/23.03.15 2,415,776.72 2,408,274.61 9.61 PLN 1,210,000 Espaccio Securities Plc FRN Ser 2007-10 Tr 1 07/23.03.15 1,207,888.35 1,202,322.31 4.80 PLN 1,210,000 Greenstreet Struc Fin Prod Plc FRN Ser 2007-10 07/23.03.15 1,207,888.35 1,201,838.31 4.79 PLN 1,210,000 Nimrod Capital Plc FRN Ser 2007-10 Tr 1 07/23.03.15 1,207,888.35 1,200,870.31 4.79 PLN 1,215,000 Opal Financial Products Plc FRN Ser 2007-10 Tr 1 07/23.03.15 1,212,879.63 1,202,309.08 4.80 PLN 1,215,000 Profile Finance Plc FRN Ser 2007-10 Tr 1 07/23.03.15 1,212,879.63 1,198,299.58 4.78 PLN 1,215,000 Recolte Securities Plc FRN Ser 2007-10 Tr 1 07/23.03.15 1,212,879.63 1,200,608.08 4.79 PLN 1,210,000 Silverstate Fin Inv Plc FRN Ser 2007-10 Tr 1 07/23.03.15 1,207,888.36 1,203,411.31 4.80 PLN 1,210,000 Vespucci Strut Fin Prod Plc FRN Ser 2007-10 07/23.03.15 1,207,888.36 1,198,934.31 4.78 PLN 1,210,000 Vigado Capital Plc FRN Ser 2007-10 Tr 1 07/23.03.15 1,207,888.35 1,201,596.31 4.79 PLN 1,205,000 Voyce Investments Plc FRN Ser 2007-10 Tr 1 07/23.03.15 1,202,897.08 1,200,125.53 4.79 PLN 1,215,000 Waterford Cap Investments Plc FRN Ser 2007-10 07/23.03.15 1,212,879.63 1,199,757.58 4.79 PLN 1,210,000 Waves Fin Investments Plc FRN Ser 2007-10 Tr 1 07/23.03.15 1,207,888.36 1,201,475.31 4.79
Total investments in securities 24,157,767.12 24,034,219.66 95.88
Cash at banks 3,732,314.43 14.89
Other net assets/(liabilities) -2,698,257.97 -10.77
Total 25,068,276.12 100.00

FUND PARTNERS
Notes to the financial statements as at 30th September 2010
192
Note 1 - Accounting Policies a) Presentation of the financial statements The financial statements of the SICAV are established in accordance with the Luxembourg legal and regulatory requirements concerning undertakings for collective investment. b) Valuation of the assets The value of the assets is determined as follows: The value of the cash in hand or on deposit, of bills and demand notes payable and accounts receivable, pre-paid expenses, dividends and interest declared or accrued but not yet received, are the nominal amount thereof. If, however, it is unlikely that the full amount of these assets will be received, they are valued by applying a discount the SICAV considers appropriate to reflect their true value. The value of all securities that are traded or quoted on a stock exchange or on another regulated exchange are based on the latest available price unless this price is not representative of their true value. In the context of the sub-funds structured with equity/index linked swaps, interest rate swaps and inflation interest rate swaps, bonds are valued at fair value, based upon the mark-to-market or mark-to-model prices of the assets in the underlying portfolios. If securities held in the portfolio are not traded or quoted on a stock exchange or other regulated market or if the price of securities quoted or traded on such an exchange or regulated market determined in accordance with the terms above is not representative of their true value, these securities are valued on the basis of their foreseeable realisation value, which is estimated prudently and in good faith. c) Net realised gain (loss) on sales of securities The realised gains and losses on the sales of securities are calculated on the basis of the average cost. d) Acquisition cost of securities in the portfolio The acquisition cost of the securities held by each sub-fund that are denominated in a currency other than that of the sub-fund is converted to the sub-fund’s currency at the exchange rates prevailing on the date of purchase. e) Conversion of foreign currencies The value of all the assets and liabilities not expressed in the reference currency of the sub-fund are converted into the reference currency of the sub-fund at the last known exchange rates. If these rates are not available, the exchange rate is determined prudently and in good faith by and in accordance with the procedures laid down by the Board of Directors.

FUND PARTNERS
Notes to the financial statements (continued) as at 30th September 2010
193
f) Consolidation The consolidated financial statements of the SICAV are presented in EUR and correspond to the sum of the financial statements of all sub-funds. Assets and liabilities and income and expenses which are expressed in currencies other than the EUR are converted into EUR at the exchange rates available at the date of the report: 1 EUR = 24.5725703 CZK Czech koruna 276.4849327 HUF Hungarian Forint 3.9767948 PLN Polish zloty 1.3646500 USD US Dollar g) Formation expenses The formation expenses are amortised over five years, or the remaining period until the maturity of the sub-fund if less than five years, from the first day following the end of the initial subscription period. h) Swap contracts Equity/index linked swap contracts are assessed as follows: In the framework of these swap contracts, the SICAV will receive one or several payment(s) from the Counterparty (optional leg) and will make payments to the Counterparty (floating leg). The two legs are assessed and the total value of the swap contract is equal to the value of the optional leg less the value of the floating leg. The SICAV will receive a payment from the Counterparties on the settlement date (and in some cases after several sub-periods). The amount of the payment will depend on the evolution/performance of the underlying (share basket, index basket, exchange rate) and will only be known with certainty after the settlement date (or, where relevant, after the sub-period under consideration). The optional leg is assessed using the modified Black & Scholes model, via a Monte Carlo simulation which requires the following valuation elements: the volatilities of the underlying assets, the correlations between the underlying assets, the prices of the underlying assets with estimate of their future dividends if applicable, the level of the exchange rates with their respective volatilities, the correlations between the exchange rate and the underlying assets, the various observations and references already made in the framework of the instrument’s calculation conditions, the interest rates curve (swap curve) on the date of valuation, and the time-to-maturity. The SICAV periodically makes payments to the Counterparties which are tied to a benchmark interest rate. This floating leg is assessed according to the discounted cash flows method. i) Investment income Interest income is recorded on an accrual basis. j) Receivable / payable on treasury transactions The caption "Receivable on treasury transactions" comprises maturities of time deposits, new loans or foreign exchange transactions not yet recorded under the caption "Cash at banks". The caption "Payable on treasury transactions" comprises new time deposits, maturities of loans or foreign exchange transactions not yet recorded under the caption "Cash at banks". For a sub-fund possessing amounts "Receivable on treasury transactions" and amounts "Payable on treasury transactions" at the date of the report, only the net amount is disclosed in the statement of net assets.

FUND PARTNERS
Notes to the financial statements (continued) as at 30th September 2010
194
Note 2 - Asset Allocation In order to achieve the investment objectives, the sub-funds of the SICAV may invest in securities (including bonds and other debt instruments), money market instruments, units in undertakings for collective investment, deposits, financial derivatives, cash and any other instruments permitted under the amended Law of 20th December 2002. As at 30th September 2010, the SICAV invested in: - notes issued by 16 Special Purpose Vehicles (SPVs) incorporated under Irish law, listed on the
Dublin stock exchange and managed by KBC ASSET MANAGEMENT S.A. (Belgium):
Amethyst Structured Finance Plc Beechwood Structured Finance Plc Brookfields Capital Plc Eperon Finance Plc Espaccio Securities Plc Greenstreet Structured Financial Products Plc Nimrod Capital Plc Opal Financial Products Plc Profile Finance Plc Recolte Securities Plc Silverstate Financial Investments Plc Vespucci Structured Finance Products Plc Vigado Capital Plc Voyce Investments Plc Waterford Capital Investments Plc Waves Financial Investments Plc
As at 30th September 2010, the underlying of the notes issued by these SPVs was a diversified portfolio of deposits with financial institutions, bonds, other debt instruments, interest rate swaps and currency swaps. - notes issued by 4 SPVs incorporated under Irish law, listed on the Dublin stock exchange and set
up in collaboration with Goldman Sachs International:
Infinity Finance Plc Sierra Finance Plc Venice Finance Plc Zulma Finance Plc
- D-Star Finance Plc R4, ring-fenced notes issued by D-Star Finance Plc, an SPV incorporated
under Irish law set up in collaboration with KBC ASSET MANAGEMENT S.A. (Belgium), of which the underlying assets are: 1) a diversified portfolio of deposits with financial institutions, bonds and other debt instruments and 2) securities acquired according to the terms and conditions of a Total Return Swap concluded with Goldman Sachs International.
These SPVs are all managed by KBC ASSET MANAGEMENT S.A. (Belgium) or a subsidiary.
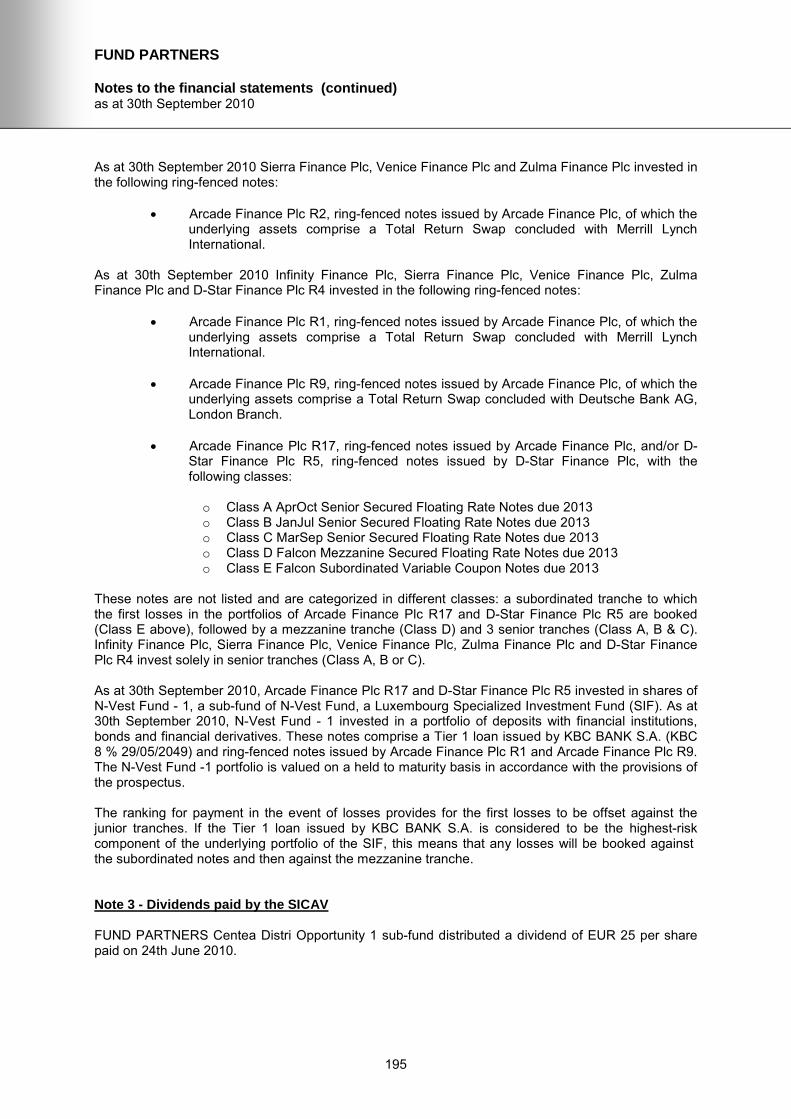
FUND PARTNERS
Notes to the financial statements (continued) as at 30th September 2010
195
As at 30th September 2010 Sierra Finance Plc, Venice Finance Plc and Zulma Finance Plc invested in the following ring-fenced notes:
Arcade Finance Plc R2, ring-fenced notes issued by Arcade Finance Plc, of which the underlying assets comprise a Total Return Swap concluded with Merrill Lynch International.
As at 30th September 2010 Infinity Finance Plc, Sierra Finance Plc, Venice Finance Plc, Zulma Finance Plc and D-Star Finance Plc R4 invested in the following ring-fenced notes:
Arcade Finance Plc R1, ring-fenced notes issued by Arcade Finance Plc, of which the underlying assets comprise a Total Return Swap concluded with Merrill Lynch International.
Arcade Finance Plc R9, ring-fenced notes issued by Arcade Finance Plc, of which the
underlying assets comprise a Total Return Swap concluded with Deutsche Bank AG, London Branch.
Arcade Finance Plc R17, ring-fenced notes issued by Arcade Finance Plc, and/or D-
Star Finance Plc R5, ring-fenced notes issued by D-Star Finance Plc, with the following classes:
o Class A AprOct Senior Secured Floating Rate Notes due 2013 o Class B JanJul Senior Secured Floating Rate Notes due 2013 o Class C MarSep Senior Secured Floating Rate Notes due 2013 o Class D Falcon Mezzanine Secured Floating Rate Notes due 2013 o Class E Falcon Subordinated Variable Coupon Notes due 2013
These notes are not listed and are categorized in different classes: a subordinated tranche to which the first losses in the portfolios of Arcade Finance Plc R17 and D-Star Finance Plc R5 are booked (Class E above), followed by a mezzanine tranche (Class D) and 3 senior tranches (Class A, B & C). Infinity Finance Plc, Sierra Finance Plc, Venice Finance Plc, Zulma Finance Plc and D-Star Finance Plc R4 invest solely in senior tranches (Class A, B or C). As at 30th September 2010, Arcade Finance Plc R17 and D-Star Finance Plc R5 invested in shares of N-Vest Fund - 1, a sub-fund of N-Vest Fund, a Luxembourg Specialized Investment Fund (SIF). As at 30th September 2010, N-Vest Fund - 1 invested in a portfolio of deposits with financial institutions, bonds and financial derivatives. These notes comprise a Tier 1 loan issued by KBC BANK S.A. (KBC 8 % 29/05/2049) and ring-fenced notes issued by Arcade Finance Plc R1 and Arcade Finance Plc R9. The N-Vest Fund -1 portfolio is valued on a held to maturity basis in accordance with the provisions of the prospectus. The ranking for payment in the event of losses provides for the first losses to be offset against the junior tranches. If the Tier 1 loan issued by KBC BANK S.A. is considered to be the highest-risk component of the underlying portfolio of the SIF, this means that any losses will be booked against the subordinated notes and then against the mezzanine tranche. Note 3 - Dividends paid by the SICAV FUND PARTNERS Centea Distri Opportunity 1 sub-fund distributed a dividend of EUR 25 per share paid on 24th June 2010.

FUND PARTNERS
Notes to the financial statements (continued) as at 30th September 2010
196
Note 4 - Management fees, distribution and risk management fees The Board of Directors of the SICAV is responsible for the management of the SICAV, as well as for determining the investment policy for each sub-fund. By a contract dated 1st May 2006, the SICAV has designed KBC ASSET MANAGEMENT S.A. as Management Company according to the provisions of Chapter 13 of the amended Law of 20th December 2002. As remuneration for its services rendered regarding management, distribution and risk management, the sub-funds pay the Management Company at the end of each semester a remuneration consisting of a fee per share in circulation at the start of that semester increased by a fee on an annual basis of maximum 0.1% of the net asset value of each sub-fund in the beginning of the quarter in question. As at 30th September 2010, the effective fees per share are:
Currency Effective fee per
share Sub-funds with a "Best of Capitalisation" structure
- FUND PARTNERS CSOB World Click Plus 7 CZK 95.000
- FUND PARTNERS CSOB World Click Plus 14 CZK 91.867
- FUND PARTNERS CSOB Click Program 1 CZK 87.118
- FUND PARTNERS CSOB Click Program 2 * CZK 0.0150 - FUND PARTNERS CSOB Click Program 4 CZK 0.0410
- FUND PARTNERS CSOB Click Program 5 CZK 0.0490
- FUND PARTNERS CSOB Click Program 6 CZK 0.0675
- FUND PARTNERS CSOB World Click Plus 15 * CZK 55.480 - FUND PARTNERS CSOB World Click Plus 17 * CZK 0.0310
- FUND PARTNERS CSOB World Click Plus 18 CZK 0.0310
- FUND PARTNERS CSOB World Click EUR Plus 4 EUR 4.6926
- FUND PARTNERS CSOB World Click USD Plus 5 * USD 3.5000 - FUND PARTNERS CSOB Equity Click Plus 2 * EUR 1.0622
- FUND PARTNERS CSOB Europe Click Plus 2 * EUR 1.2170
- FUND PARTNERS CSOB Europe Click Plus 3 EUR 3.1534
- FUND PARTNERS CSOB World Click Plus 19 CZK 0.0230 - FUND PARTNERS CSOB World Click Plus 20 CZK 0.0950
- FUND PARTNERS CSOB World Click Plus 21 CZK 0.0330
- FUND PARTNERS CSOB World Click Plus 22 CZK 0.0590
- FUND PARTNERS CSOB World Click Plus 23 CZK 0.0400 - FUND PARTNERS CSOB World Click Plus 24 CZK 0.0410
- FUND PARTNERS CSOB World Click USD Plus 6 USD 5.7840
Sub-funds with a "Best of Maximum Capitalisation" structure
- FUND PARTNERS CSOB Europe 1 * EUR 3.2360 - FUND PARTNERS CSOB World Growth Plus 1 CZK 60.000
- FUND PARTNERS CSOB World Growth Plus 5 * CZK 0.0530
- FUND PARTNERS CSOB Europe Real Estate Growth Plus 1 CZK 0.0370
- FUND PARTNERS CSOB World Growth Plus 9 CZK 0.0450 - FUND PARTNERS CSOB Europe Growth Plus 1 * CZK 0.0380
- FUND PARTNERS CSOB Europe Growth Plus 2 CZK 0.0410
- FUND PARTNERS CSOB Global Growth Plus 1 CZK 0.0510
- FUND PARTNERS CSOB Global Growth Plus 2 CZK 0.0410 - FUND PARTNERS CSOB Global Growth Plus 3 CZK 0.0400
- FUND PARTNERS CSOB US Growth Plus USD 1 USD 0.0786
- FUND PARTNERS CSOB World Growth Plus EUR 1 EUR 0.0600
- FUND PARTNERS CSOB Central Europe Winners 2 CZK 0.0440

FUND PARTNERS
Notes to the financial statements (continued) as at 30th September 2010
197
Currency Effective fee per
share - FUND PARTNERS CSOB China Winners 1 CZK 0.0440 - FUND PARTNERS CSOB Asian Growth 2 CZK 0.0580
- FUND PARTNERS Warta Financials 1 PLN 0.9500
- FUND PARTNERS Warta Pharma 1 PLN 0.7600
- FUND PARTNERS CSOB Global Growth Plus 4 CZK 0.0556 - FUND PARTNERS CSOB Global Growth Plus 5 CZK 0.0370
- FUND PARTNERS CSOB Sustainables 1 CZK 0.0490
- FUND PARTNERS CSOB Asian Growth 3 CZK 0.0950
- FUND PARTNERS CSOB Asian Growth 4 CZK 0.0700 - FUND PARTNERS CSOB Asian Winners 1 CZK 0.0470
- FUND PARTNERS CSOB Asian Winners 2 CZK 0.0950
- FUND PARTNERS Kredyt Bank Conservative 4 PLN 0.9500
- FUND PARTNERS Kredyt Bank Conservative 5 PLN 0.9500 - FUND PARTNERS Kredyt Bank Conservative 6 PLN 0.9500
- FUND PARTNERS Kredyt Bank Financials 1 PLN 0.9500
- FUND PARTNERS Kredyt Bank Central European Winners 1 PLN 0.9500
- FUND PARTNERS Kredyt Bank Conservative 7 PLN 0.7600 - FUND PARTNERS Kredyt Bank BRIC 1 PLN 0.6600
Sub-funds with a "Cliquet Large Digital Distribution" structure
- FUND PARTNERS Centea Distri Opportunity 1 EUR 4.5000 - FUND PARTNERS Centea Distri Opportunity 2 EUR 9.5000
Sub-funds with a "Minimum Capitalisation" structure
- FUND PARTNERS CSOB Europe Growth 2 * EUR 0.0032
- FUND PARTNERS CSOB Rastovy Plus SKK 3 EUR 0.0032
Sub-funds with a "Plain Vanilla" structure
- FUND PARTNERS CSOB World Growth 2 * CZK 53.7400
- FUND PARTNERS CSOB Equity Plus 3 * EUR 0.0032
- FUND PARTNERS CSOB Reality SKK 1 EUR 0.0032
Sub-funds with a "Cliquet Tree Capitalisation" structure
- FUND PARTNERS CSOB World Tree 3 CZK 0.0950
- FUND PARTNERS CSOB World Tree SKK 1 EUR 2.0211 - FUND PARTNERS CSOB World Tree CZK 1 CZK 0.0360
- FUND PARTNERS World Tree USD 1 USD 9.0942
- FUND PARTNERS CSOB World Tree 4 CZK 61.460
- FUND PARTNERS CSOB World Tree 5 CZK 0.0410 - FUND PARTNERS CSOB World Tree 6 CZK 0.0950
- FUND PARTNERS CSOB World Tree 7 CZK 0.0579
- FUND PARTNERS CSOB World Tree 8 CZK 0.0950
- FUND PARTNERS CSOB World Tree EUR 1 EUR 9.5000 - FUND PARTNERS CSOB World Tree 9 CZK 0.0454
- FUND PARTNERS CSOB World Tree 10 CZK 0.0601
- FUND PARTNERS CSOB Strom SKK 2 EUR 0.0032
- FUND PARTNERS CSOB Strom SKK 5 EUR 0.0032 - FUND PARTNERS CSOB World Tree 11 CZK 0.0537
- FUND PARTNERS CSOB World Tree 12 CZK 0.0557
Sub-funds with a "Step Down" structure
- FUND PARTNERS CSOB Staircase Click 1 CZK 0.0530
Sub-funds with a "Best of Unlimited Capitalisation" structure
- FUND PARTNERS K&H Hazai Fix 1 Alap * HUF 0.0000
- FUND PARTNERS NLB SKLADI - GARANTIRANI SKLAD EVROPA 1 EUR 0.6829
- FUND PARTNERS CSOB Asian Growth 1 CZK 0.0416 - FUND PARTNERS CSOB Central Europe Winners 1 CZK 0.0460

FUND PARTNERS
Notes to the financial statements (continued) as at 30th September 2010
198
Currency Effective fee per
share - FUND PARTNERS CSOB Stock Selection Short Term 2 * CZK 0.0430 - FUND PARTNERS CSOB Stock Selection Short Term 3 * CZK 0.0390
- FUND PARTNERS CSOB Stock Selection Short Term 4 CZK 0.0400
- FUND PARTNERS Kredyt Bank Asia 1 PLN 0.7200
- FUND PARTNERS Kredyt Bank Sustainables 1 PLN 0.6200 - FUND PARTNERS NBL Skladi - Garantirani sklad Azija 1 USD 0.9463
- FUND PARTNERS Warta High Dividend Europe 1 PLN 0.9500
- FUND PARTNERS CSOB World Growth Plus 10 * CZK 0.0500
- FUND PARTNERS CSOB World Growth Plus 11 CZK 0.0420 - FUND PARTNERS CSOB World Growth Plus 12 CZK 0.0360
- FUND PARTNERS Kredyt Bank Optimised Europe Participation 1 PLN 0.4900
- FUND PARTNERS Kredyt Bank Global Real Estate 1 PLN 0.7400
- FUND PARTNERS CSOB World Growth Plus 13 CZK 0.0450 - FUND PARTNERS CSOB World Growth Plus 14 CZK 0.0460
- FUND PARTNERS CSOB World Growth Plus 15 CZK 0.0560
- FUND PARTNERS CSOB World Growth Plus 16 CZK 0.0632
- FUND PARTNERS CSOB Short Term Growth 5 CZK 0.0410 - FUND PARTNERS CSOB Short Term Growth 6 CZK 0.0713
- FUND PARTNERS CSOB Financials Short Term Growth 1 CZK 0.0550
- FUND PARTNERS CSOB Europe Real Estate Growth Plus 2 CZK 0.0491
- FUND PARTNERS CSOB Pharma & Biotech 1 CZK 0.0478 - FUND PARTNERS Warta Asia 2 PLN 0.9500
- FUND PARTNERS Kredyt Bank Europe Real Estate 2 PLN 0.8015
- FUND PARTNERS Kredyt Bank Global Real Estate 2 PLN 0.8000
- FUND PARTNERS Warta Infrastructure 1 PLN 0.9500
Sub-funds with a "Fix Upside" structure
- FUND PARTNERS CSOB Fix Upside 2 * CZK 0.0480
- FUND PARTNERS CSOB Fix Upside 3 * CZK 0.0450
Sub-funds with a "Performance Lock" structure
- FUND PARTNERS CSOB Performance Lock 1 CZK 0.0460
Sub-funds with a "Best of Bull & Bear" structure
- FUND PARTNERS CSOB Bull & Bear 1 CZK 0.0397
Sub-funds with a "Best of Variable Participation" structure
- FUND PARTNERS Kredyt Bank Variable Participation 1 PLN 0.7851
* These sub-funds have been liquidated. (see General information). Note 5 - Subscription duty ("Taxe d’abonnement") The SICAV is governed by Luxembourg law. Pursuant to the legislation and regulations in force, the SICAV is subject to an annual subscription duty ("taxe d’abonnement") of 0.05% which is payable quarterly and calculated on the basis of the net assets of each sub-fund on the last day of each quarter. Pursuant to Article 129 (3) of the amended Law of 20th December 2002, the net assets invested in undertakings for collective investment already subject to the "taxe d’abonnement" are exempt from this tax.

FUND PARTNERS
Notes to the financial statements (continued) as at 30th September 2010
199
Note 6 - Annual Belgian tax FUND PARTNERS Centea Distri Opportunity 1 and FUND PARTNERS Centea Distri Opportunity 2 sub-funds, registered in Belgium, are subject to Belgian subscription tax. The Belgian regulation (the inheritance tax code, tome II bis) imposes to Undertakings for Collective Investment subject to Luxembourg law, which were authorised to market their shares publicly in Belgium, the payment of an annual tax. This tax amounts to 0.08% on the total of the net sums invested in Belgium at 31st December of the previous year, starting from their registration with the Commission Bancaire, Financière et des Assurances (Banking, Finance and Insurance Commission). The SICAV is required to make a tax payment at 31st March each year. Note 7 - Commitments linked to swap contracts. The sub-funds are structured with equity/index linked swaps, interest rate swaps or currency swaps whose unrealised result is recorded in the statement of net assets. For each sub-fund, under the heading “Permitted derivatives transactions”, the prospectus stipulates that swap contracts are entered into to achieve the investment objectives. For each sub-fund, under the heading “Selected strategy”, the prospectus describes these investment objectives. As at 30th September 2010, to realize the investment objectives, the SICAV is committed in the following swap contracts with KBC BANK S.A. which is committed itself with other counterparts:
- Swaps "equity/index linked"
FUND PARTNERS CSOB World Click Plus 7
Nominal Currency Counterparty Maturity Unrealised result
(in CZK) 105,612,000 CZK KBC Bank NV 19.06.2012 30,836,313.06
30,836,313.06
FUND PARTNERS CSOB World Click Plus 14
Nominal Currency Counterparty Maturity Unrealised result
(in CZK) 106,658,000 CZK KBC Bank NV 17.06.2011 28,373,664.8239,508,000 CZK KBC Bank NV 17.06.2011 10,851,508.72
39,225,173.54
FUND PARTNERS CSOB Click Program 1
Nominal Currency Counterparty Maturity Unrealised result
(in CZK) 95,359,000 CZK KBC Bank NV 19.09.2011 12,417,248.47
12,417,248.47

FUND PARTNERS
Notes to the financial statements (continued) as at 30th September 2010
200
FUND PARTNERS CSOB Click Program 4
Nominal Currency Counterparty Maturity Unrealised result
(in CZK) 98,491,000 CZK KBC Bank NV 17.03.2011 5,379,824.6568,379,940 CZK KBC Bank NV 17.03.2011 3,983,359.44
9,363,184.09
FUND PARTNERS CSOB Click Program 5
Nominal Currency Counterparty Maturity Unrealised result
(in CZK) 155,519,136 CZK KBC Bank NV 16.12.2011 12,128,154.64
12,128,154.64
FUND PARTNERS CSOB Click Program 6
Nominal Currency Counterparty Maturity Unrealised result
(in CZK) 70,280,542 CZK KBC Bank NV 19.06.2012 3,009,549.47
3,009,549.47
FUND PARTNERS CSOB World Click Plus 18
Nominal Currency Counterparty Maturity Unrealised result
(in CZK) 256,013,960 CZK KBC Bank NV 17.12.2010 24,371,927.36
24,371,927.36
FUND PARTNERS CSOB World Click EUR Plus 4
Nominal Currency Counterparty Maturity Unrealised result
(in EUR) 4,369,000 EUR KBC Bank NV 19.01.2011 174,857.21
174,857.21
FUND PARTNERS CSOB Europe Click Plus 3
Nominal Currency Counterparty Maturity Unrealised result
(in EUR) 3,770,778.76 EUR KBC Bank NV 19.01.2011 554,222.48
554,222.48
FUND PARTNERS CSOB World Click Plus 19
Nominal Currency Counterparty Maturity Unrealised result
(in CZK) 117,329,770 CZK KBC Bank NV 17.02.2011 9,351,897.07
9,351,897.07

FUND PARTNERS
Notes to the financial statements (continued) as at 30th September 2010
201
FUND PARTNERS CSOB World Click Plus 20
Nominal Currency Counterparty Maturity Unrealised result
(in CZK) 63,740,990 CZK KBC Bank NV 19.10.2011 5,112,948.10
5,112,948.10
FUND PARTNERS CSOB World Click Plus 21
Nominal Currency Counterparty Maturity Unrealised result
(in CZK) 205,654,020 CZK KBC Bank NV 18.05.2011 17,086,383.79
17,086,383.79
FUND PARTNERS CSOB World Click Plus 22
Nominal Currency Counterparty Maturity Unrealised result
(in CZK) 123,515,774 CZK KBC Bank NV 19.10.2011 6,638,335.03
6,638,335.03
FUND PARTNERS CSOB World Click Plus 23
Nominal Currency Counterparty Maturity Unrealised result
(in CZK) 78,156,656 CZK KBC Bank NV 19.12.2012 8,515,045.01
8,515,045.01
FUND PARTNERS CSOB World Click Plus 24
Nominal Currency Counterparty Maturity Unrealised result
(in CZK) 80,173,373 CZK KBC Bank NV 19.07.2011 4,490,243.38
200,000,000 CZK KBC Bank NV 19.07.2011 12,819,888.89 17,310,132.27
FUND PARTNERS CSOB World Click USD Plus 6
Nominal Currency Counterparty Maturity Unrealised result
(in USD) 3,264,945 USD KBC Bank NV 17.02.2011 531,606.73
531,606.73
FUND PARTNERS CSOB World Growth Plus 1
Nominal Currency Counterparty Maturity Unrealised result
(in CZK) 186,632,000 CZK KBC Bank NV 05.10.2010 26,199,555.69102,920,000 CZK KBC Bank NV 05.10.2010 14,519,497.89
40,719,053.58

FUND PARTNERS
Notes to the financial statements (continued) as at 30th September 2010
202
FUND PARTNERS CSOB Europe Real Estate Growth Plus 1
Nominal Currency Counterparty Maturity Unrealised result
(in CZK) 70,958,051 CZK KBC Bank NV 05.06.2012 -715,651.3784,436,510 CZK KBC Bank NV 05.06.2012 -799,613.75
-1,515,265.12
FUND PARTNERS CSOB World Growth Plus 9
Nominal Currency Counterparty Maturity Unrealised result
(in CZK) 263,850,500 CZK KBC Bank NV 03.12.2010 10,464,527.04
10,464,527.04
FUND PARTNERS CSOB Europe Growth Plus 2
Nominal Currency Counterparty Maturity Unrealised result
(in CZK) 93,885,320 CZK KBC Bank NV 03.03.2011 1,580,846.2448,629,570 CZK KBC Bank NV 03.03.2011 670,304.59
2,251,150.83
FUND PARTNERS CSOB Global Growth Plus 1
Nominal Currency Counterparty Maturity Unrealised result
(in CZK) 122,813,713 CZK KBC Bank NV 05.09.2012 2,919,606.05
2,919,606.05
FUND PARTNERS CSOB Global Growth Plus 2
Nominal Currency Counterparty Maturity Unrealised result
(in CZK) 175,286,824 CZK KBC Bank NV 06.06.2011 9,968,803.19
9,968,803.19
FUND PARTNERS CSOB Global Growth Plus 3
Nominal Currency Counterparty Maturity Unrealised result
(in CZK) 148,820,830 CZK KBC Bank NV 05.09.2011 6,451,005.14
6,451,005.14
FUND PARTNERS CSOB US Growth Plus USD 1
Nominal Currency Counterparty Maturity Unrealised result
(in USD) 5,755,185 USD KBC Bank NV 05.01.2011 9,333.94
9,333.94
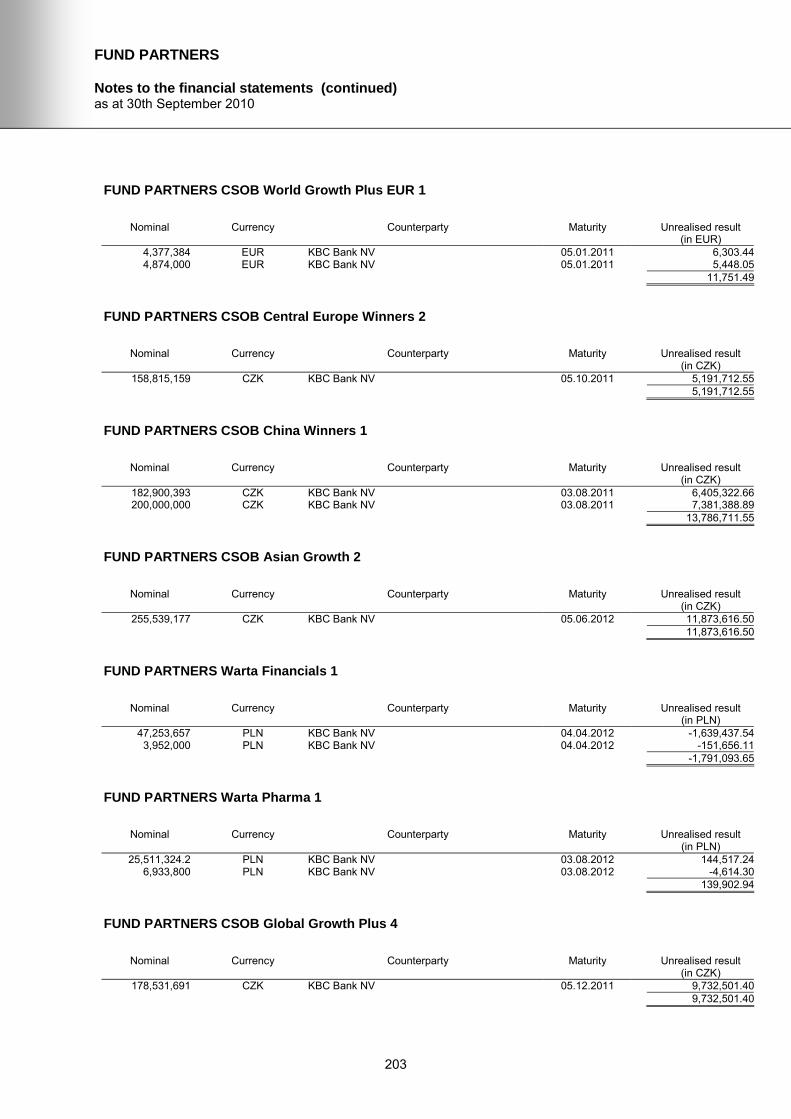
FUND PARTNERS
Notes to the financial statements (continued) as at 30th September 2010
203
FUND PARTNERS CSOB World Growth Plus EUR 1
Nominal Currency Counterparty Maturity Unrealised result
(in EUR) 4,377,384 EUR KBC Bank NV 05.01.2011 6,303.444,874,000 EUR KBC Bank NV 05.01.2011 5,448.05
11,751.49
FUND PARTNERS CSOB Central Europe Winners 2
Nominal Currency Counterparty Maturity Unrealised result
(in CZK) 158,815,159 CZK KBC Bank NV 05.10.2011 5,191,712.55
5,191,712.55
FUND PARTNERS CSOB China Winners 1
Nominal Currency Counterparty Maturity Unrealised result
(in CZK) 182,900,393 CZK KBC Bank NV 03.08.2011 6,405,322.66200,000,000 CZK KBC Bank NV 03.08.2011 7,381,388.89
13,786,711.55
FUND PARTNERS CSOB Asian Growth 2
Nominal Currency Counterparty Maturity Unrealised result
(in CZK) 255,539,177 CZK KBC Bank NV 05.06.2012 11,873,616.50
11,873,616.50
FUND PARTNERS Warta Financials 1
Nominal Currency Counterparty Maturity Unrealised result
(in PLN) 47,253,657 PLN KBC Bank NV 04.04.2012 -1,639,437.543,952,000 PLN KBC Bank NV 04.04.2012 -151,656.11
-1,791,093.65
FUND PARTNERS Warta Pharma 1
Nominal Currency Counterparty Maturity Unrealised result
(in PLN) 25,511,324.2 PLN KBC Bank NV 03.08.2012 144,517.24
6,933,800 PLN KBC Bank NV 03.08.2012 -4,614.30 139,902.94
FUND PARTNERS CSOB Global Growth Plus 4
Nominal Currency Counterparty Maturity Unrealised result
(in CZK) 178,531,691 CZK KBC Bank NV 05.12.2011 9,732,501.40
9,732,501.40

FUND PARTNERS
Notes to the financial statements (continued) as at 30th September 2010
204
FUND PARTNERS CSOB Global Growth Plus 5
Nominal Currency Counterparty Maturity Unrealised result
(in CZK) 122,377,375 CZK KBC Bank NV 05.06.2012 858,443.29
858,443.29
FUND PARTNERS CSOB Sustainables 1
Nominal Currency Counterparty Maturity Unrealised result
(in CZK) 117,202,996 CZK KBC Bank NV 03.08.2012 1,620,161.14
1,620,161.14
FUND PARTNERS CSOB Asian Growth 3
Nominal Currency Counterparty Maturity Unrealised result
(in CZK) 190,715,308 CZK KBC Bank NV 18.07.2012 8,084,399.65
8,084,399.65
FUND PARTNERS CSOB Asian Growth 4
Nominal Currency Counterparty Maturity Unrealised result
(in CZK) 92,686,200 CZK KBC Bank NV 03.02.2012 -165,934.04
166,713,418 CZK KBC Bank NV 03.02.2012 169,410.47 3,476.43
FUND PARTNERS CSOB Asian Winners 1
Nominal Currency Counterparty Maturity Unrealised result
(in CZK) 69,573,646 CZK KBC Bank NV 04.07.2012 1,532,411.34
1,532,411.34
FUND PARTNERS CSOB Asian Winners 2
Nominal Currency Counterparty Maturity Unrealised result
(in CZK) 134,846,934 CZK KBC Bank NV 05.09.2012 -901,733.44
-901,733.44
FUND PARTNERS Kredyt Bank Conservative 4
Nominal Currency Counterparty Maturity Unrealised result
(in PLN) 10,657,000 PLN KBC Bank NV 05.03.2012 -329,520.2821,026,662 PLN KBC Bank NV 05.03.2012 -644,877.24
-974,397.52

FUND PARTNERS
Notes to the financial statements (continued) as at 30th September 2010
205
FUND PARTNERS Kredyt Bank Conservative 5
Nominal Currency Counterparty Maturity Unrealised result
(in PLN) 10,094,500 PLN KBC Bank NV 05.06.2012 -431,787.4071,145,954 PLN KBC Bank NV 05.06.2012 -2,950,185.88
-3,381,973.28
FUND PARTNERS Kredyt Bank Conservative 6
Nominal Currency Counterparty Maturity Unrealised result
(in PLN) 55,541,539 PLN KBC Bank NV 05.03.2012 1,445,430.668,655,861 PLN KBC Bank NV 05.03.2012 214,411.94
1,659,842.60
FUND PARTNERS Kredyt Bank Financials 1
Nominal Currency Counterparty Maturity Unrealised result
(in PLN) 11,757,400 PLN KBC Bank NV 05.03.2012 -429,273.9550,982,016 PLN KBC Bank NV 05.03.2012 -1,659,270.75
-2,088,544.70
FUND PARTNERS Kredyt Bank Central European Winners 1
Nominal Currency Counterparty Maturity Unrealised result
(in PLN) 22,518,677 PLN KBC Bank NV 05.11.2013 -1,648,003.1644,973,000 PLN KBC Bank NV 05.11.2013 -3,341,025.69
-4,989,028.85
FUND PARTNERS Kredyt Bank Conservative 7
Nominal Currency Counterparty Maturity Unrealised result
(in PLN) 17,697,500 PLN KBC Bank NV 05.06.2013 -1,274,656.3822,066,583 PLN KBC Bank NV 05.06.2013 -1,622,799.25
-2,897,455.63
FUND PARTNERS Kredyt Bank BRIC 1
Nominal Currency Counterparty Maturity Unrealised result
(in PLN) 8,660,500 PLN KBC Bank NV 04.09.2013 247,196.77
89,299,369 PLN KBC Bank NV 04.09.2013 280,225.58 527,422.35
FUND PARTNERS Centea Distri Opportunity 1
Nominal Currency Counterparty Maturity Unrealised result
(in EUR) 3,723,000 EUR KBC Bank NV 04.07.2012 181,169.452,666,000 EUR KBC Bank NV 04.07.2012 126,949.00

FUND PARTNERS
Notes to the financial statements (continued) as at 30th September 2010
206
Nominal Currency Counterparty Maturity Unrealised result (in EUR)
308,118.45
FUND PARTNERS Centea Distri Opportunity 2
Nominal Currency Counterparty Maturity Unrealised result
(in EUR) 1,633,000 EUR KBC Bank NV 05.11.2013 232,293.03
232,293.03
FUND PARTNERS CSOB Rastovy Plus SKK 3
Nominal Currency Counterparty Maturity Unrealised result
(in EUR) 3,441,224.46 EUR KBC Bank NV 04.05.2011 13,810.302,835,857.63 EUR KBC Bank NV 04.05.2011 11,031.09
24,841.39
FUND PARTNERS CSOB Reality SKK 1
Nominal Currency Counterparty Maturity Unrealised result
(in EUR) 4,760,594.6 EUR KBC Bank NV 04.11.2010 21,425.73
3,293,503.84 EUR KBC Bank NV 04.11.2010 2,636.90 24,062.63
FUND PARTNERS CSOB World Tree 3
Nominal Currency Counterparty Maturity Unrealised result
(in CZK) 20,374,750 CZK KBC Bank NV 05.01.2011 2,571,151.96
2,571,151.96
FUND PARTNERS CSOB World Tree SKK 1
Nominal Currency Counterparty Maturity Unrealised result
(in EUR) 10,464,847.64 EUR KBC Bank NV 03.12.2010 982,191.91
982,191.91
FUND PARTNERS CSOB World Tree CZK 1
Nominal Currency Counterparty Maturity Unrealised result
(in CZK) 212,125,450 CZK KBC Bank NV 05.04.2011 20,710,785.82
20,710,785.82
FUND PARTNERS World Tree USD 1
Nominal Currency Counterparty Maturity Unrealised result
(in USD) 5,444,000 USD KBC Bank NV 03.11.2010 729,372.383,741,000 USD KBC Bank NV 03.11.2010 491,363.98

FUND PARTNERS
Notes to the financial statements (continued) as at 30th September 2010
207
Nominal Currency Counterparty Maturity Unrealised result (in USD)
1,220,736.36

FUND PARTNERS
Notes to the financial statements (continued) as at 30th September 2010
208
FUND PARTNERS CSOB World Tree 4
Nominal Currency Counterparty Maturity Unrealised result
(in CZK) 140,530,000 CZK KBC Bank NV 05.06.2012 11,867,106.99
11,867,106.99
FUND PARTNERS CSOB World Tree 5
Nominal Currency Counterparty Maturity Unrealised result
(in CZK) 87,506,970 CZK KBC Bank NV 05.08.2013 7,266,764.01
7,266,764.01
FUND PARTNERS CSOB World Tree 6
Nominal Currency Counterparty Maturity Unrealised result
(in CZK) 52,258,080 CZK KBC Bank NV 03.10.2013 2,768,415.33
2,768,415.33
FUND PARTNERS CSOB World Tree 7
Nominal Currency Counterparty Maturity Unrealised result
(in CZK) 202,324,800 CZK KBC Bank NV 05.11.2013 12,788,997.82
12,788,997.82
FUND PARTNERS CSOB World Tree 8
Nominal Currency Counterparty Maturity Unrealised result
(in CZK) 135,284,770 CZK KBC Bank NV 04.01.2013 11,183,375.64
11,183,375.64
FUND PARTNERS CSOB World Tree EUR 1
Nominal Currency Counterparty Maturity Unrealised result
(in EUR) 3,208,822 EUR KBC Bank NV 04.05.2012 329,403.70
329,403.70
FUND PARTNERS CSOB World Tree 9
Nominal Currency Counterparty Maturity Unrealised result
(in CZK) 98,771,760 CZK KBC Bank NV 05.03.2012 8,523,242.07
8,523,242.07
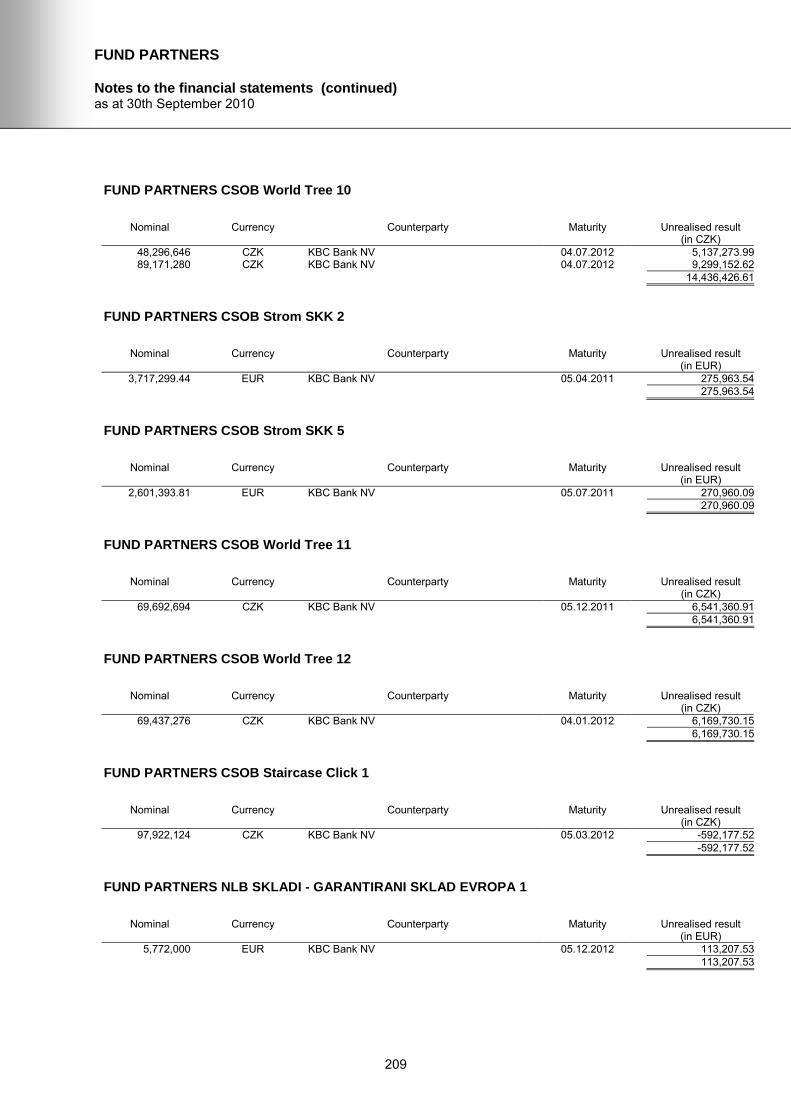
FUND PARTNERS
Notes to the financial statements (continued) as at 30th September 2010
209
FUND PARTNERS CSOB World Tree 10
Nominal Currency Counterparty Maturity Unrealised result
(in CZK) 48,296,646 CZK KBC Bank NV 04.07.2012 5,137,273.9989,171,280 CZK KBC Bank NV 04.07.2012 9,299,152.62
14,436,426.61
FUND PARTNERS CSOB Strom SKK 2
Nominal Currency Counterparty Maturity Unrealised result
(in EUR) 3,717,299.44 EUR KBC Bank NV 05.04.2011 275,963.54
275,963.54
FUND PARTNERS CSOB Strom SKK 5
Nominal Currency Counterparty Maturity Unrealised result
(in EUR) 2,601,393.81 EUR KBC Bank NV 05.07.2011 270,960.09
270,960.09
FUND PARTNERS CSOB World Tree 11
Nominal Currency Counterparty Maturity Unrealised result
(in CZK) 69,692,694 CZK KBC Bank NV 05.12.2011 6,541,360.91
6,541,360.91
FUND PARTNERS CSOB World Tree 12
Nominal Currency Counterparty Maturity Unrealised result
(in CZK) 69,437,276 CZK KBC Bank NV 04.01.2012 6,169,730.15
6,169,730.15
FUND PARTNERS CSOB Staircase Click 1
Nominal Currency Counterparty Maturity Unrealised result
(in CZK) 97,922,124 CZK KBC Bank NV 05.03.2012 -592,177.52
-592,177.52
FUND PARTNERS NLB SKLADI - GARANTIRANI SKLAD EVROPA 1
Nominal Currency Counterparty Maturity Unrealised result
(in EUR) 5,772,000 EUR KBC Bank NV 05.12.2012 113,207.53
113,207.53

FUND PARTNERS
Notes to the financial statements (continued) as at 30th September 2010
210
FUND PARTNERS CSOB Asian Growth 1
Nominal Currency Counterparty Maturity Unrealised result
(in CZK) 425,437,190 CZK KBC Bank NV 03.03.2011 40,949,759.4855,880,610 CZK KBC Bank NV 03.03.2011 5,519,938.03
46,469,697.51
FUND PARTNERS CSOB Central Europe Winners 1
Nominal Currency Counterparty Maturity Unrealised result
(in CZK) 99,673,178 CZK KBC Bank NV 05.09.2012 3,732,328.33
3,732,328.33
FUND PARTNERS CSOB Stock Selection Short Term 4
Nominal Currency Counterparty Maturity Unrealised result
(in CZK) 110,271,046 CZK KBC Bank NV 04.11.2010 4,386,082.31
4,386,082.31
FUND PARTNERS Kredyt Bank Asia 1
Nominal Currency Counterparty Maturity Unrealised result
(in PLN) 39,024,467 PLN KBC Bank NV 03.07.2013 -1,596,774.38
-1,596,774.38
FUND PARTNERS Kredyt Bank Sustainables 1
Nominal Currency Counterparty Maturity Unrealised result
(in PLN) 30,000,000 PLN KBC Bank NV 03.05.2012 -1,161,320.5523,182,100 PLN KBC Bank NV 03.05.2012 -984,858.174,097,700 PLN KBC Bank NV 03.05.2012 -145,549.18
-2,291,727.90
FUND PARTNERS NLB Skladi - Garantirani sklad Azija 1
Nominal Currency Counterparty Maturity Unrealised result
(in USD) 2,044,203 USD KBC Bank NV 05.06.2013 649,869.88
649,869.88
FUND PARTNERS Warta High Dividend Europe 1
Nominal Currency Counterparty Maturity Unrealised result
(in PLN) 4,163,000 PLN KBC Bank NV 03.03.2011 -50,717.89
45,552,600 PLN KBC Bank NV 03.03.2011 -762,661.10 -813,378.99

FUND PARTNERS
Notes to the financial statements (continued) as at 30th September 2010
211
FUND PARTNERS CSOB World Growth Plus 11
Nominal Currency Counterparty Maturity Unrealised result
(in CZK) 81,567,127 CZK KBC Bank NV 05.12.2010 3,230,905.62
3,230,905.62
FUND PARTNERS CSOB World Growth Plus 12
Nominal Currency Counterparty Maturity Unrealised result
(in CZK) 80,642,327 CZK KBC Bank NV 05.01.2011 3,152,442.97
3,152,442.97
FUND PARTNERS Kredyt Bank Optimised Europe Participation 1
Nominal Currency Counterparty Maturity Unrealised result
(in PLN) 16,275,500 PLN KBC Bank NV 03.08.2011 -413,970.6923,138,500 PLN KBC Bank NV 03.08.2011 -572,807.8323,519,100 PLN KBC Bank NV 03.08.2011 -562,132.2649,012,832 PLN KBC Bank NV 03.08.2011 -1,134,191.71
-2,683,102.49
FUND PARTNERS Kredyt Bank Global Real Estate 1
Nominal Currency Counterparty Maturity Unrealised result
(in PLN) 91,545,705 PLN KBC Bank NV 03.10.2012 -4,853,952.3719,667,500 PLN KBC Bank NV 03.10.2012 -1,139,502.94
152,552,295 PLN KBC Bank NV 03.10.2012 -7,421,852.21 -13,415,307.52
FUND PARTNERS CSOB World Growth Plus 13
Nominal Currency Counterparty Maturity Unrealised result
(in CZK) 140,801,915 CZK KBC Bank NV 05.04.2011 2,764,060.88
2,764,060.88
FUND PARTNERS CSOB World Growth Plus 14
Nominal Currency Counterparty Maturity Unrealised result
(in CZK) 110,140,028 CZK KBC Bank NV 04.05.2011 2,019,455.96
2,019,455.96
FUND PARTNERS CSOB World Growth Plus 15
Nominal Currency Counterparty Maturity Unrealised result
(in CZK) 137,131,846 CZK KBC Bank NV 05.07.2011 2,796,951.04
2,796,951.04

FUND PARTNERS
Notes to the financial statements (continued) as at 30th September 2010
212
FUND PARTNERS CSOB World Growth Plus 16
Nominal Currency Counterparty Maturity Unrealised result
(in CZK) 150,092,681 CZK KBC Bank NV 05.09.2011 5,325,888.28
5,325,888.28
FUND PARTNERS CSOB Short Term Growth 5
Nominal Currency Counterparty Maturity Unrealised result
(in CZK) 169,234,259 CZK KBC Bank NV 05.10.2010 3,501,564.47100,000,000 CZK KBC Bank NV 05.10.2010 1,999,194.44
5,500,758.91
FUND PARTNERS CSOB Short Term Growth 6
Nominal Currency Counterparty Maturity Unrealised result
(in CZK) 257,543,904 CZK KBC Bank NV 05.07.2011 454,820.39181,471,670 CZK KBC Bank NV 05.07.2011 107,330.41
562,150.80
FUND PARTNERS CSOB Financials Short Term Growth 1
Nominal Currency Counterparty Maturity Unrealised result
(in CZK) 134,470,520 CZK KBC Bank NV 04.05.2011 -130,025.52129,627,840 CZK KBC Bank NV 04.05.2011 54,875.79278,627,847 CZK KBC Bank NV 04.05.2011 84,671.90
9,522.17
FUND PARTNERS CSOB Europe Real Estate Growth Plus 2
Nominal Currency Counterparty Maturity Unrealised result
(in CZK) 176,871,930 CZK KBC Bank NV 03.07.2013 -3,016,255.9848,493,895 CZK KBC Bank NV 03.07.2013 -508,832.30
-3,525,088.28
FUND PARTNERS CSOB Pharma & Biotech 1
Nominal Currency Counterparty Maturity Unrealised result
(in CZK) 172,054,703 CZK KBC Bank NV 03.08.2012 -1,455,740.5192,697,170 CZK KBC Bank NV 03.08.2012 -933,177.26
-2,388,917.77
FUND PARTNERS Warta Asia 2
Nominal Currency Counterparty Maturity Unrealised result
(in PLN) 30,309,774 PLN KBC Bank NV 04.11.2011 2,642,148.01

FUND PARTNERS
Notes to the financial statements (continued) as at 30th September 2010
213
Nominal Currency Counterparty Maturity Unrealised result (in PLN)
5,714,400 PLN KBC Bank NV 04.11.2011 413,115.11 3,055,263.12
FUND PARTNERS Kredyt Bank Europe Real Estate 2
Nominal Currency Counterparty Maturity Unrealised result
(in PLN) 186,645,742 PLN KBC Bank NV 03.07.2013 -15,535,818.5428,741,100 PLN KBC Bank NV 03.07.2013 -2,308,870.99
272,459,000 PLN KBC Bank NV 03.07.2013 -22,976,798.154,851,100 PLN KBC Bank NV 03.07.2013 -370,808.78
-41,192,296.46
FUND PARTNERS Kredyt Bank Global Real Estate 2
Nominal Currency Counterparty Maturity Unrealised result
(in PLN) 18,792,232.82 PLN KBC Bank NV 05.12.2012 -1,135,122.7628,303,609.32 PLN KBC Bank NV 05.12.2012 -1,414,260.8723,012,117.15 PLN KBC Bank NV 05.12.2012 -1,250,440.62
-3,799,824.25
FUND PARTNERS Warta Infrastructure 1
Nominal Currency Counterparty Maturity Unrealised result
(in PLN) 21,428,793 PLN KBC Bank NV 05.09.2012 -744,336.47
-744,336.47
FUND PARTNERS CSOB Performance Lock 1
Nominal Currency Counterparty Maturity Unrealised result
(in CZK) 70,657,743 CZK KBC Bank NV 04.07.2012 -752,575.62
-752,575.62
FUND PARTNERS CSOB Bull & Bear 1
Nominal Currency Counterparty Maturity Unrealised result
(in CZK) 136,394,620 CZK KBC Bank NV 05.10.2011 4,463,677.99
4,463,677.99
FUND PARTNERS Kredyt Bank Variable Participation 1
Nominal Currency Counterparty Maturity Unrealised result
(in PLN) 21,392,354 PLN KBC Bank NV 04.12.2013 -1,959,940.636,222,000 PLN KBC Bank NV 04.12.2013 -522,751.98
-2,482,692.61
Note 9 - Statement of change in investments

FUND PARTNERS
Notes to the financial statements (continued) as at 30th September 2010
214
The statement of changes in investments for the period in reference to the report is available free of charge at the registered office of the SICAV or at the institutions responsible for providing financial services.


