13
August 2018 Luxury Report 2018 – Luxury Fashion Statista Consumer Market Outlook – Segment Report 1
August 2018
Luxury Report 2018 – Luxury Fashion Statista Consumer Market Outlook – Segment Report
1

The Luxury Fashion segment accounts for 29% of the total Luxury market
2
1: Worldwide includes all countries which are covered by the Consumer Market Outlook, for further information please see page 11 2: CAGR: Compound Annual Growth Rate / average growth rate per yearSource: Statista Consumer Market Outlook 2018
Overview
The conceptual key to understanding luxury in marketing is exclusivity. This exclusivity is maintained mainly by a high price point but also by consciously limiting sales volumes and outlets. In the Consumer Market Outlook, luxury goods encompass highly exclusive personal items that convey the taste and status of their owners.
The market data is based on an analysis of the financial filings for the years 2010 to 2017 of more than 100 companies that target the luxury segments within the specified categories. The most important key companies are shown as part of the competitive landscape.
The Luxury Fashion segment includes Luxury Apparel and Footwear. Fashion constitutes the bulk of sales in the global personal luxury goods industry and has a healthy growth outlook over the next five years.
Luxury market overview
Revenues by segments worldwide1 in 2017
15%
27%
29%
6%
23%
Luxury LeatherGoods
Luxury EyewearLuxury Fashion
Luxury Watches & Jewelry
Prestige Cosmetics& Fragrances
Revenues
US$88bnin 2017
+6%CAGR2 2010-2017
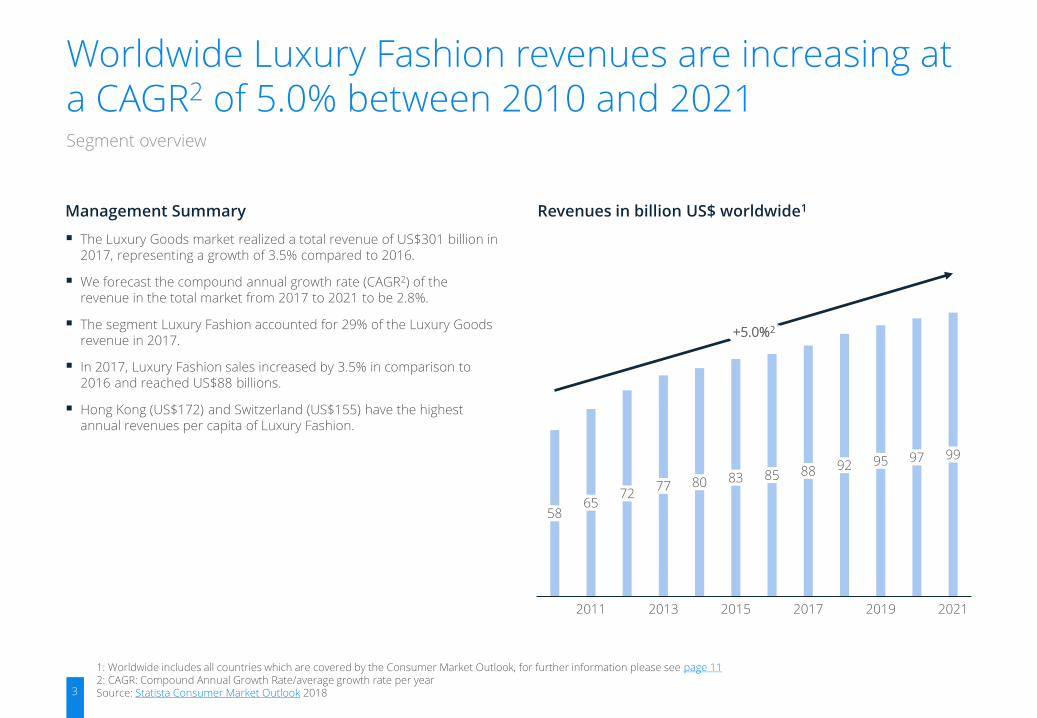
Worldwide Luxury Fashion revenues are increasing at a CAGR2 of 5.0% between 2010 and 2021
3
1: Worldwide includes all countries which are covered by the Consumer Market Outlook, for further information please see page 11 2: CAGR: Compound Annual Growth Rate/average growth rate per yearSource: Statista Consumer Market Outlook 2018
Management Summary
▪ The Luxury Goods market realized a total revenue of US$301 billion in 2017, representing a growth of 3.5% compared to 2016.
▪ We forecast the compound annual growth rate (CAGR2) of the revenue in the total market from 2017 to 2021 to be 2.8%.
▪ The segment Luxury Fashion accounted for 29% of the Luxury Goods revenue in 2017.
▪ In 2017, Luxury Fashion sales increased by 3.5% in comparison to 2016 and reached US$88 billions.
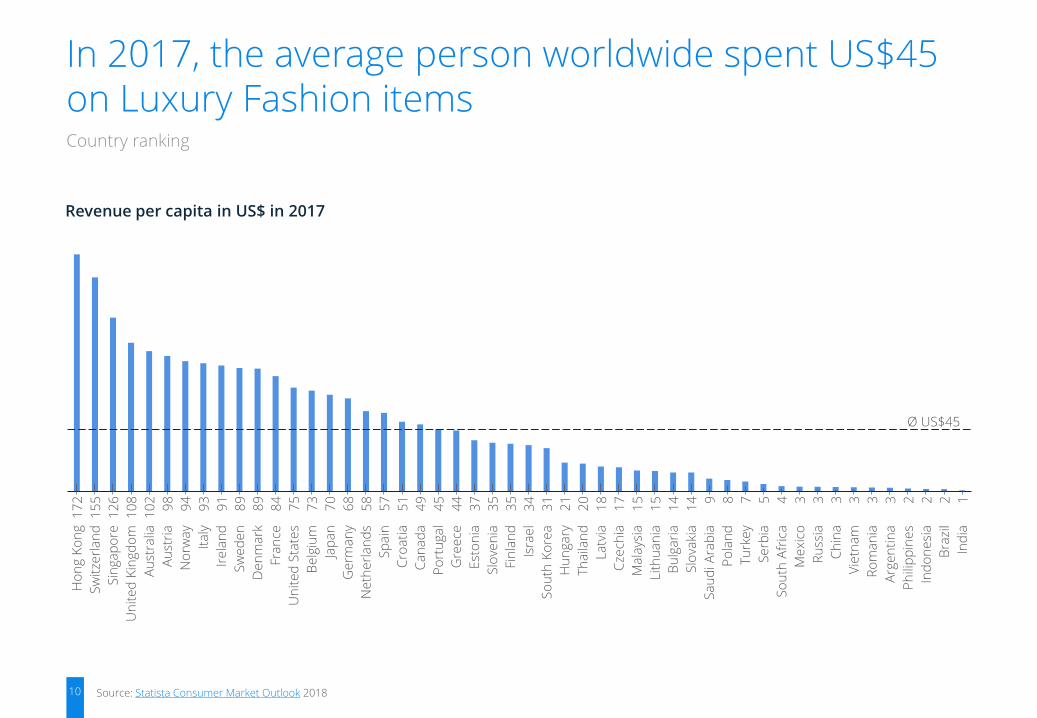
▪ Hong Kong (US$172) and Switzerland (US$155) have the highest annual revenues per capita of Luxury Fashion.
Segment overview
Revenues in billion US$ worldwide1
58
2011
6572
8377
2013 20192017
8880
2015
85
2021
92 95 97 99
+5.0%2

4
Revenue per capita in 2017
Source: Statista Consumer Market Outlook 2018
In 2017, Hong Kong spent by far the most on Luxury Fashion items with US$172 per capita
US$1 US$172 Country out of scope
5
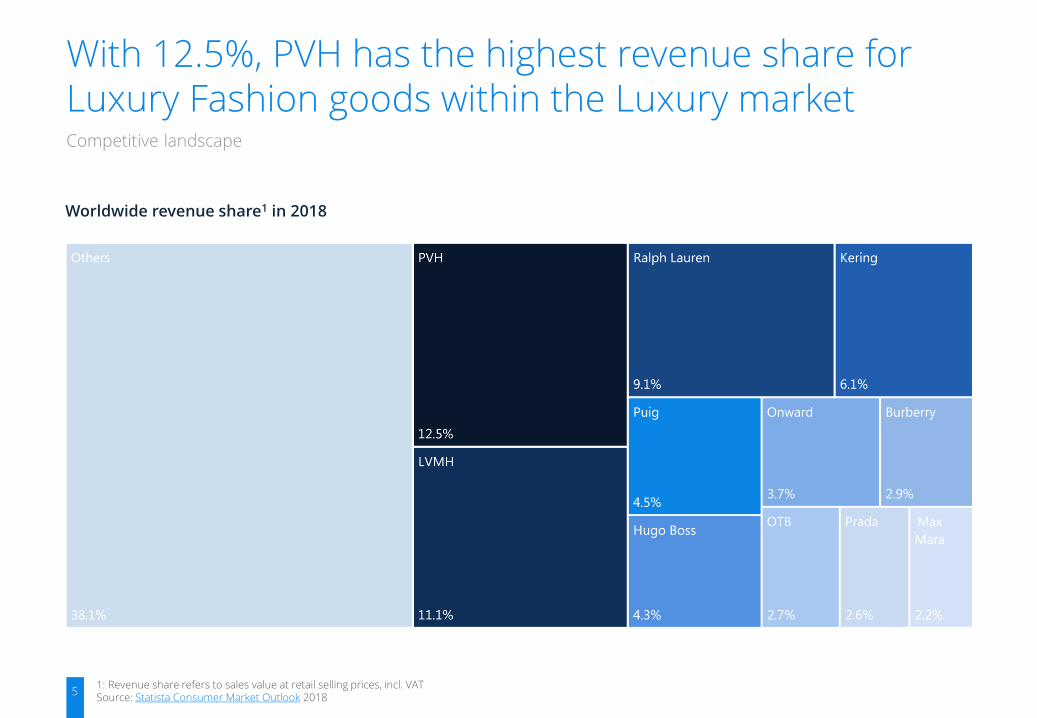
Worldwide revenue share1 in 2018
Competitive landscape
1: Revenue share refers to sales value at retail selling prices, incl. VATSource: Statista Consumer Market Outlook 2018
With 12.5%, PVH has the highest revenue share forLuxury Fashion goods within the Luxury market
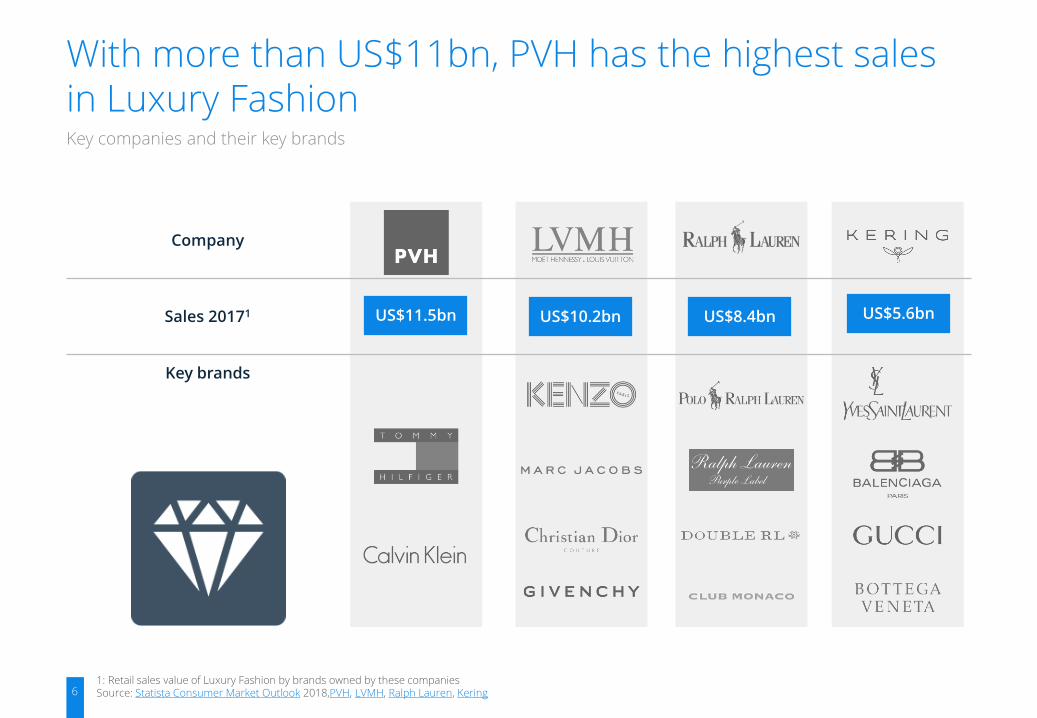
Key companies and their key brands
1: Retail sales value of Luxury Fashion by brands owned by these companiesSource: Statista Consumer Market Outlook 2018,PVH, LVMH, Ralph Lauren, Kering
With more than US$11bn, PVH has the highest sales in Luxury Fashion
Company
Sales 20171
Key brands
US$11.5bn US$10.2bn US$5.6bn
6
US$8.4bn
unit 2010 2011 2012 2013 2014 2015 2016 2017 2018 2019 2020 2021CAGR1
'10/'21CAGR1
‘16/‘17
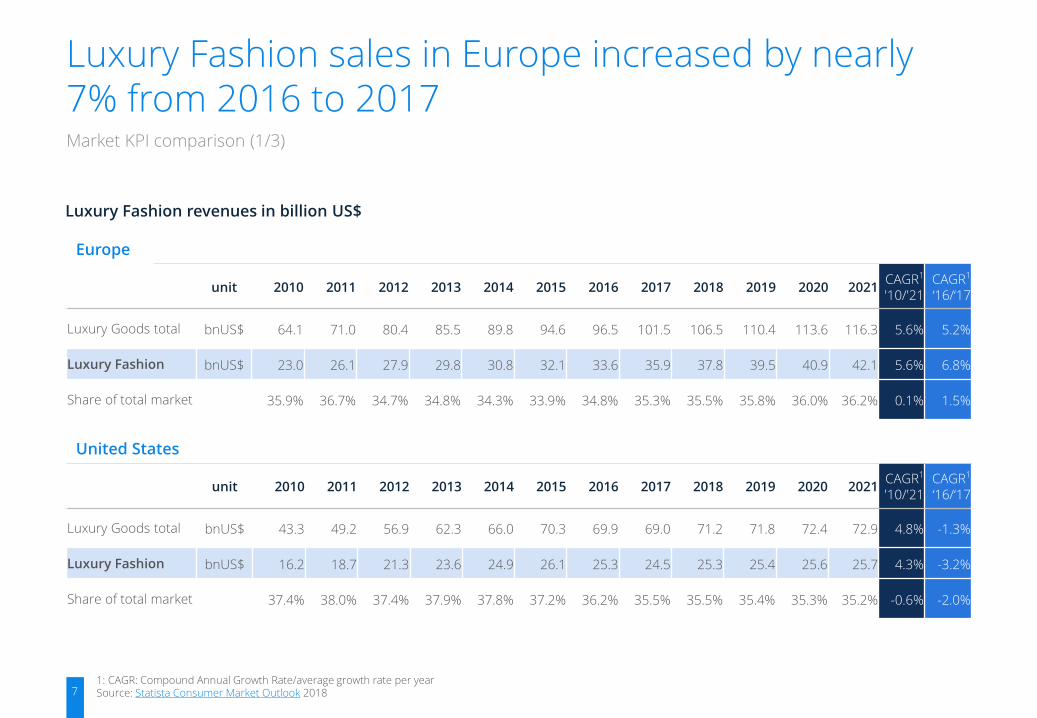
Luxury Goods total bnUS$ 64.1 71.0 80.4 85.5 89.8 94.6 96.5 101.5 106.5 110.4 113.6 116.3 5.6% 5.2%
Luxury Fashion bnUS$ 23.0 26.1 27.9 29.8 30.8 32.1 33.6 35.9 37.8 39.5 40.9 42.1 5.6% 6.8%
Share of total market 35.9% 36.7% 34.7% 34.8% 34.3% 33.9% 34.8% 35.3% 35.5% 35.8% 36.0% 36.2% 0.1% 1.5%
7
Luxury Fashion revenues in billion US$
Market KPI comparison (1/3)
1: CAGR: Compound Annual Growth Rate/average growth rate per yearSource: Statista Consumer Market Outlook 2018
Luxury Fashion sales in Europe increased by nearly 7% from 2016 to 2017
unit 2010 2011 2012 2013 2014 2015 2016 2017 2018 2019 2020 2021CAGR1
'10/'21CAGR1
‘16/‘17
Luxury Goods total bnUS$ 43.3 49.2 56.9 62.3 66.0 70.3 69.9 69.0 71.2 71.8 72.4 72.9 4.8% -1.3%
Luxury Fashion bnUS$ 16.2 18.7 21.3 23.6 24.9 26.1 25.3 24.5 25.3 25.4 25.6 25.7 4.3% -3.2%
Share of total market 37.4% 38.0% 37.4% 37.9% 37.8% 37.2% 36.2% 35.5% 35.5% 35.4% 35.3% 35.2% -0.6% -2.0%
Europe
United States
unit 2010 2011 2012 2013 2014 2015 2016 2017 2018 2019 2020 2021CAGR1
'10/'21CAGR1
‘16/‘17
Luxury Goods total bnUS$ 15.8 20.9 27.2 28.7 30.4 32.0 32.0 34.3 35.9 37.1 38.1 38.9 8.5% 7.3%
Luxury Fashion bnUS$ 2.4 2.9 3.2 3.4 3.2 3.5 3.8 4.4 4.7 5.0 5.3 5.5 7.8% 14.4%
Share of total market 15.2% 13.7% 11.8% 11.9% 10.7% 11.0% 12.0% 12.8% 13.1% 13.5% 13.9% 14.1% -0.7% 6.6%
8
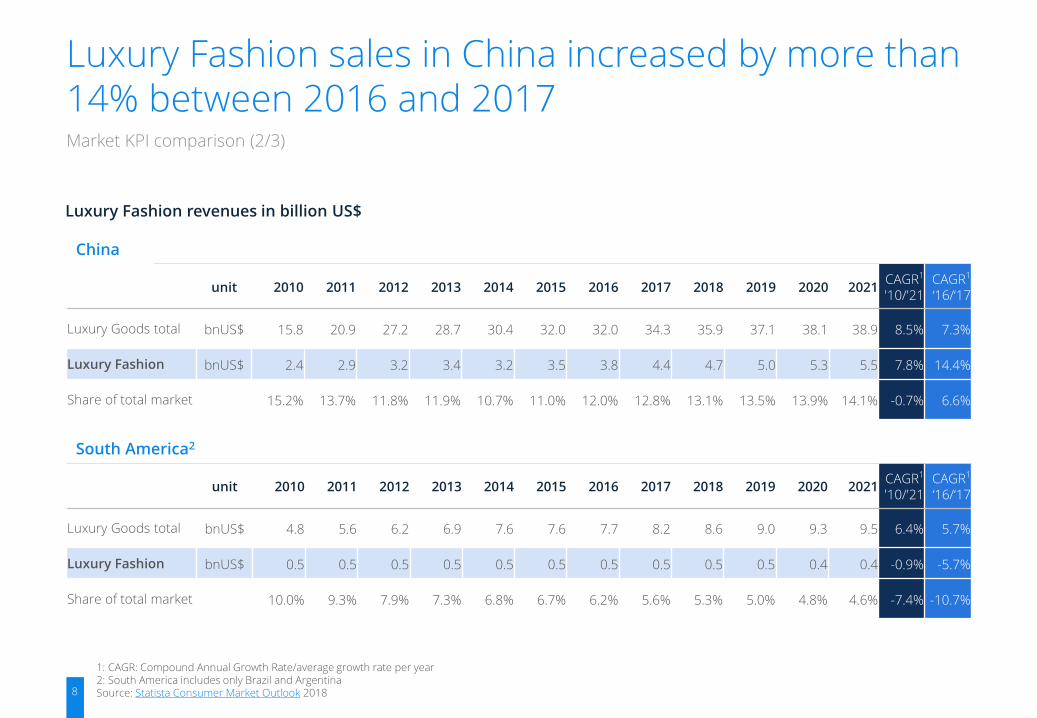
Luxury Fashion revenues in billion US$
Market KPI comparison (2/3)
1: CAGR: Compound Annual Growth Rate/average growth rate per year2: South America includes only Brazil and ArgentinaSource: Statista Consumer Market Outlook 2018
Luxury Fashion sales in China increased by more than 14% between 2016 and 2017
unit 2010 2011 2012 2013 2014 2015 2016 2017 2018 2019 2020 2021CAGR1
'10/'21CAGR1
‘16/‘17
Luxury Goods total bnUS$ 4.8 5.6 6.2 6.9 7.6 7.6 7.7 8.2 8.6 9.0 9.3 9.5 6.4% 5.7%
Luxury Fashion bnUS$ 0.5 0.5 0.5 0.5 0.5 0.5 0.5 0.5 0.5 0.5 0.4 0.4 -0.9% -5.7%
Share of total market 10.0% 9.3% 7.9% 7.3% 6.8% 6.7% 6.2% 5.6% 5.3% 5.0% 4.8% 4.6% -7.4% -10.7%
China
South America2
unit 2010 2011 2012 2013 2014 2015 2016 2017 2018 2019 2020 2021CAGR1
'10/'21CAGR1
‘16/‘17
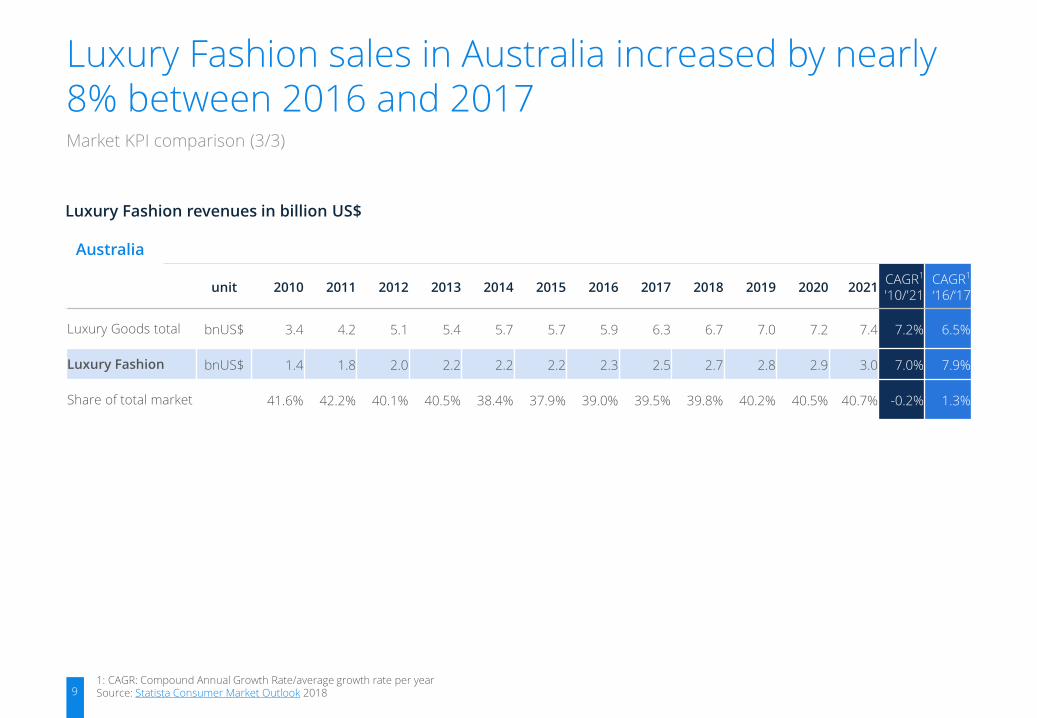
Luxury Goods total bnUS$ 3.4 4.2 5.1 5.4 5.7 5.7 5.9 6.3 6.7 7.0 7.2 7.4 7.2% 6.5%
Luxury Fashion bnUS$ 1.4 1.8 2.0 2.2 2.2 2.2 2.3 2.5 2.7 2.8 2.9 3.0 7.0% 7.9%
Share of total market 41.6% 42.2% 40.1% 40.5% 38.4% 37.9% 39.0% 39.5% 39.8% 40.2% 40.5% 40.7% -0.2% 1.3%
9
Luxury Fashion revenues in billion US$
Market KPI comparison (3/3)
1: CAGR: Compound Annual Growth Rate/average growth rate per yearSource: Statista Consumer Market Outlook 2018
Luxury Fashion sales in Australia increased by nearly 8% between 2016 and 2017
Australia
10
Revenue per capita in US$ in 2017
Country ranking
Source: Statista Consumer Market Outlook 2018
In 2017, the average person worldwide spent US$45 on Luxury Fashion items
17
2
15
5
12
6
10
8
10
2
98
94
93
91
89
89
84
75
73
70
68
58
57
51
49
45
44
37
35
35
34
31
21
20
18
17
15
15
14
14 9 8 7 5 4 3 3 3 3 3 3 2 2 2 1
Ne
the
rla
nd
s
Ge
rma
ny
Cro
ati
a
Po
rtu
ga
l
Gre
ece
Un
ite
d S
tate
s
Un
ite
d K
ingd
om
Fin
lan
d
Slo
ven
ia
Isra
el
Sw
itze
rla
nd
Sin
ga
po
re
So
uth
Ko
rea
Au
stra
lia
Th
aila
nd
La
tvia
Cze
chia
Ma
lays
ia
Au
stri
a
Lit
hu
an
ia
Hu
nga
ry
Bu
lga
ria
Slo
vaki
a
No
rwa
y
Ita
ly
Ire
lan
d
Est
on
ia
Tu
rke
y
Sw
ed
en
Sa
ud
i A
rab
ia
Se
rbia
So
uth
Afr
ica
Ca
na
da
Ru
ssia
De
nm
ark
Ch
ina
Sp
ain
Po
lan
d
Fra
nce
Ro
ma
nia
Be
lgiu
m
Arg
en
tin
a
Ind
on
esi
a
Ph
ilip
pin
es
Me
xico
Bra
zil
Jap
an
Ind
ia
Ho
ng K
on
g
Vie
tna
m
Ø US$45
Argentina
Brazil
North America
United States
Canada
China
Hong Kong
India
Indonesia
Japan
South Korea
Malaysia
Philippines
Singapore
Thailand
Vietnam
Australia
Africa & Middle East
South America
AustraliaSlovenia
Spain
Sweden
Switzerland
United Kingdom
Russia
Serbia
Hungary
Ireland
Italy
Latvia
Lithuania
Netherlands
Norway
Poland
Portugal
Romania
Slovakia
Austria
Belgium
Bulgaria
Croatia
Czechia
Denmark
Estonia
Finland
France
Germany
Greece
Europe
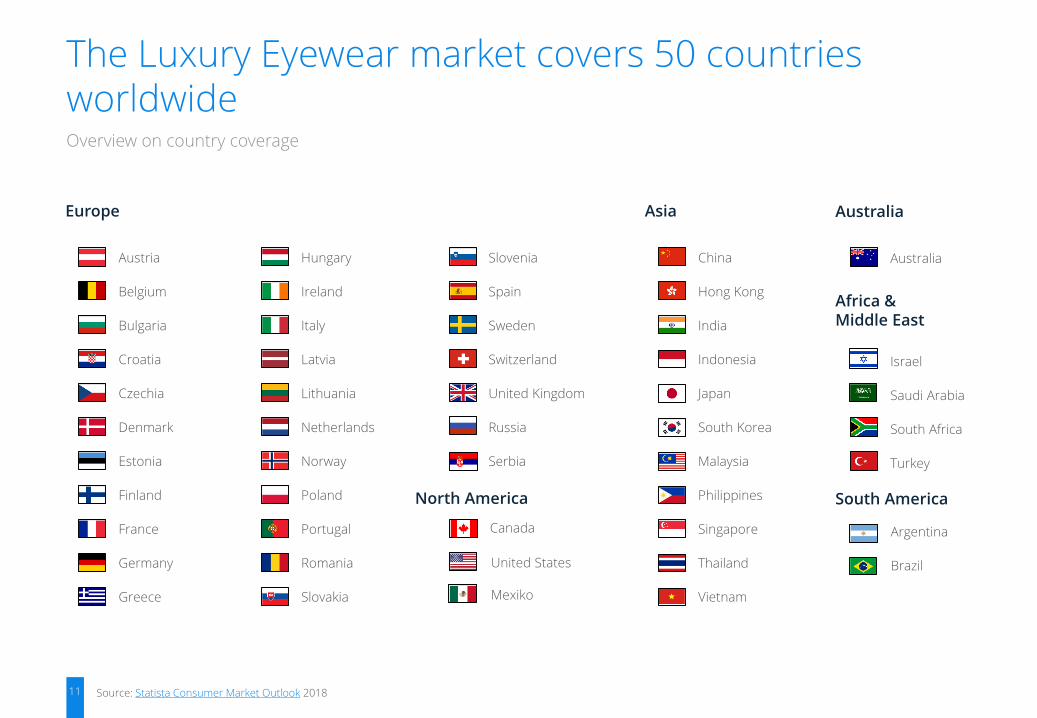
Overview on country coverage
Source: Statista Consumer Market Outlook 2018
The Luxury Eyewear market covers 50 countries worldwide
11
Asia
Israel
Saudi Arabia
South Africa
Turkey
Mexiko
AccessoriesHome &Laundry Care
Alcoholic Drinks Hot Drinks
ApparelHousehold Appliances
Consumer Electronics
Non-AlcoholicDrinks
Cosmetics & Personal Care
OTCPharmaceuticals
Eyewear Luxury Goods
FoodTissue & Hygiene Paper
FootwearTobacco Products
Furniture Toys & Hobby
12
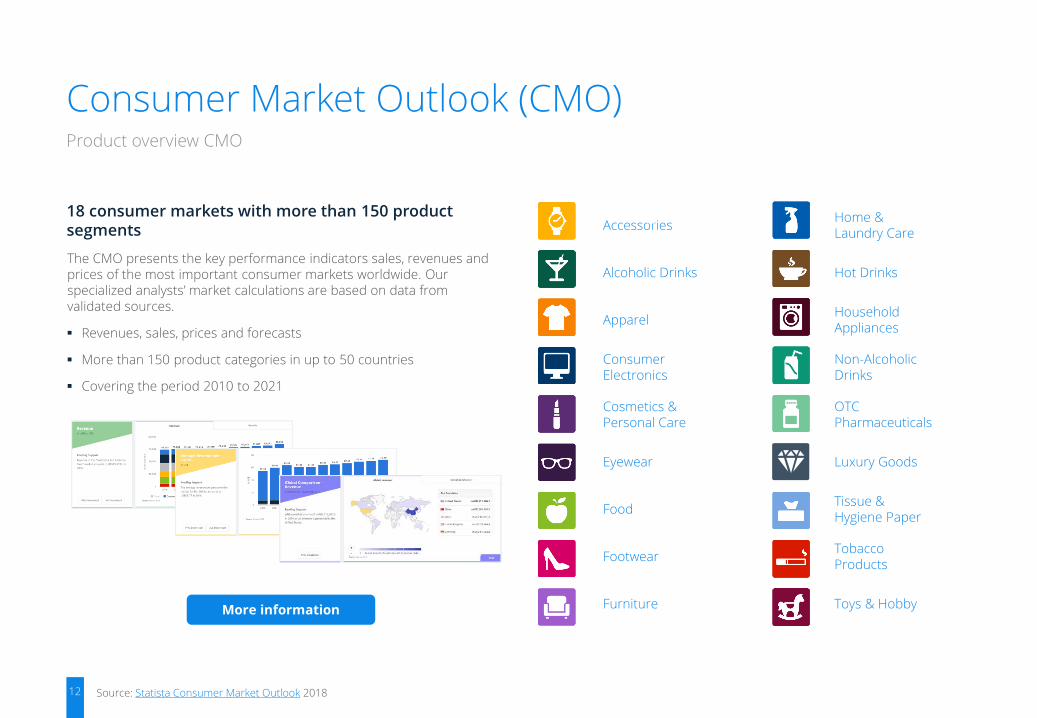
18 consumer markets with more than 150 product segments
The CMO presents the key performance indicators sales, revenues and prices of the most important consumer markets worldwide. Our specialized analysts’ market calculations are based on data from validated sources.
▪ Revenues, sales, prices and forecasts
▪ More than 150 product categories in up to 50 countries
▪ Covering the period 2010 to 2021
Product overview CMO
Source: Statista Consumer Market Outlook 2018
Consumer Market Outlook (CMO)
4
More information

www.statista.com
Madeleine Brinckmann
Analyst Consumer Goods
Author, imprint, and disclaimer
▪ Madeleine Brinckmann studied Sociology, Economics, Political Science and Law at the University of Hamburg. Before joining Statista she worked as a Business Partner in Category Management and later in Retail Environment Management at CP GABA GmbH (formerly Colgate-Palmolive).
ImprintStatista ▪ Johannes-Brahms-Platz 1 ▪ 20355 Hamburg ▪ +49 40 413 49 89 0 ▪ www.statista.com
DisclaimerThis study is based on survey and research data from the previously mentioned sources. The forecasts and market analysis presented were researched and prepared by Statista with great care.
For the presented survey data, estimations, and forecasts Statista cannot assume warranty of any kind. Surveys and forecasts contain information not naturally representing a reliable basis for decisions in individual cases and may require further interpretation. Therefore, Statista is not liable for any damage arising from the use of statistics and data provided in this report.


