20
1 Lynkurs Prosessregulering (Crash course process control) Sigurd Skogestad Institutt for kjemisk prosessteknologi Rom K4-211 [email protected]
1
Lynkurs Prosessregulering(Crash course process control)
Sigurd SkogestadInstitutt for kjemisk prosessteknologi
2
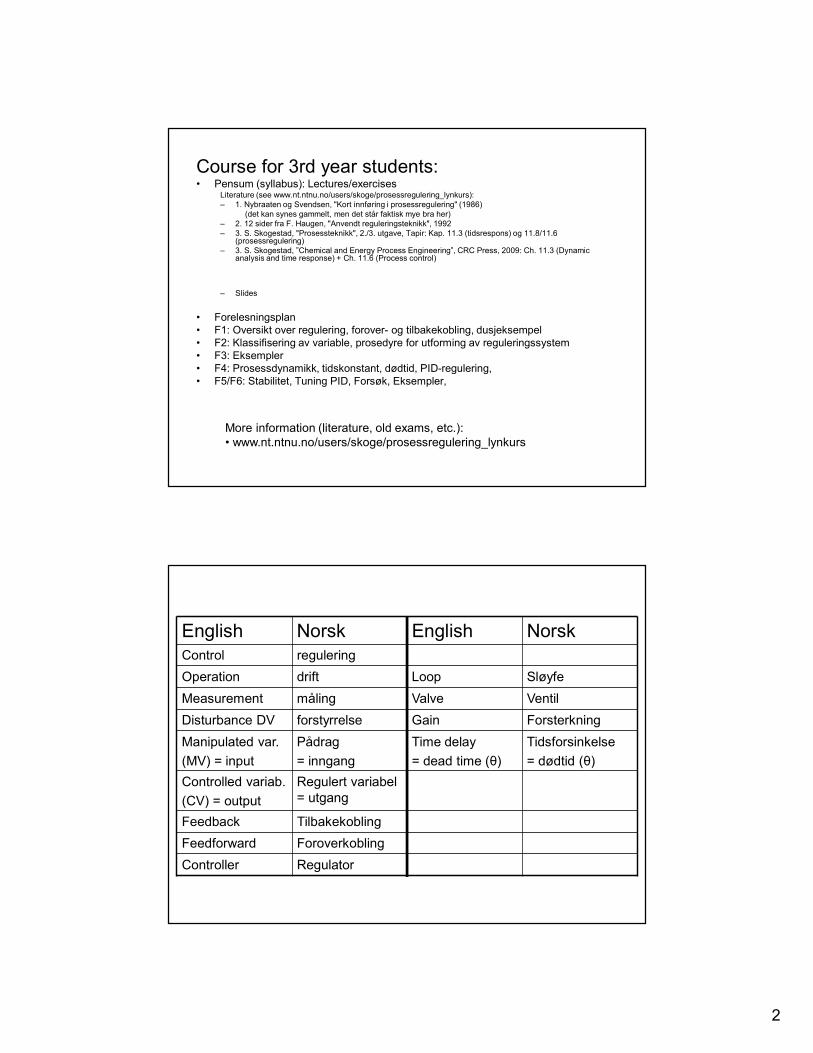
Course for 3rd year students:• Pensum (syllabus): Lectures/exercises
Literature (see www.nt.ntnu.no/users/skoge/prosessregulering_lynkurs):– 1. Nybraaten og Svendsen, "Kort innføring i prosessregulering" (1986)
(det kan synes gammelt, men det står faktisk mye bra her)– 2. 12 sider fra F. Haugen, "Anvendt reguleringsteknikk", 1992– 3. S. Skogestad, "Prosessteknikk", 2./3. utgave, Tapir: Kap. 11.3 (tidsrespons) og 11.8/11.6 (prosessregulering)– 3. S. Skogestad, ”Chemical and Energy Process Engineering”, CRC Press, 2009: Ch. 11.3 (Dynamicanalysis and time response) + Ch. 11.6 (Process control)
– Slides
• Forelesningsplan • F1: Oversikt over regulering, forover- og tilbakekobling, dusjeksempel• F2: Klassifisering av variable, prosedyre for utforming av reguleringssystem • F3: Eksempler • F4: Prosessdynamikk, tidskonstant, dødtid, PID-regulering, • F5/F6: Stabilitet, Tuning PID, Forsøk, Eksempler,
More information (literature, old exams, etc.):• www.nt.ntnu.no/users/skoge/prosessregulering_lynkurs
English Norsk English NorskControl reguleringOperation drift Loop SløyfeMeasurement måling Valve VentilDisturbance DV forstyrrelse Gain ForsterkningManipulated var.(MV) = input
Pådrag= inngang
Time delay= dead time (θ)
Tidsforsinkelse= dødtid (θ)
Controlled variab.(CV) = output
Regulert variabel = utgang
Feedback TilbakekoblingFeedforward ForoverkoblingController Regulator

3
Why control?• Until now: Design of process. Assume steady-state• Now: Operation
time
Actual value(dynamic)Steady-state (average)
In practice never steady-state:• Feed changes• Startup• Operator changes • Failures• …..
- Control is needed to reduce the effect of disturbances – remain at steady state- 30% of investment costs are typically for instrumentation and control
“Disturbances” (d’s)
Countermeasures to disturbances (I)I. Reduce/Eliminate the disturbance
(a) Design process so it is insensitive to disturbances• Example: Use buffertank to dampen disturbances
(b) Detect and remove source of disturbances• “Statistical process control” (SPC)• Example: Detect and eliminate variations in feed composition
inflow outflow∞Tin Tout

4
Countermeasures to disturbances (II)II. Counteract the disturbance: Process
control (prosessregulering)Do something (usually manipulate valve)to counteract the effect of the disturbances
(a) Manual control: Need operator(b) Automatic control: Need measurement + automatic valve + computer
Goals automatic control:• Smaller variations
• more consistent quality• More optimal (“squeeze and shift”)
• Smaller losses (environment)• Lower costs• More production
Industry: Still large potential for improvements! By improving control and squeezingthe variations we can shift the setpoint (average) closer to the constraint and increase production
time
MAX FLOW
beforeafter
Example: Control of shower temperature
Reaction time
qc
(valves)
5s delay in pipe (θ = V/q = 100ml/20 ml/s = 5s)T [K]q [m3/s] want constant

5
Classification of variablesProcess(shower)
uinput (MV)
youtput (CV)
d
Independent variables (“the cause”):(a) Inputs (MV, u): Variables we can adjust (valves)(b) Disturbances (DV, d): Variables outside our control
Dependent (output) variables (“the effect or result”):(c) Primary outputs (CVs, y): Variables we want to keep at a given
setpoint(d) Internal variables in dynamic model (“states”) (x)
MV = manipulated vartiable (input u)CV = controlled variable (output y)DV = disturbance variable (d)
Example: Control of shower temperature
5s delay: θ = V/q = 100ml/20 ml/s = 5s
qH[m3/s] qCT [K]q [m3/s] 1. Control objective
Keep temperature (y1=T) a given setpointKeep flow (y2=q) (”pressure”) at given setpoint
2. Classify variables MVs (u) = qH, qC (strictly speaking, valve positions zH, zC)CVs (y) = T, qDVs (d) = qH, qC (strictly speaking, upstream pressure which gives “uncontrolled” flow changes)
Control objective. MVs, CVs, DVs
Reaction time
qc
6
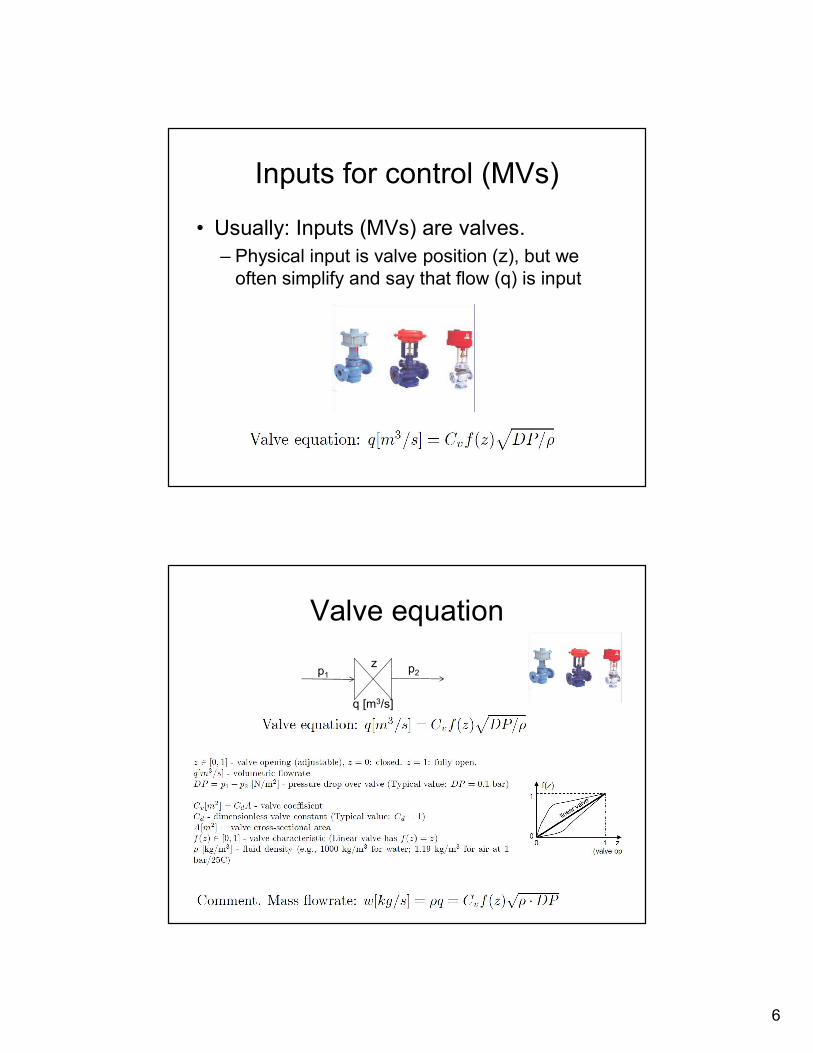
Inputs for control (MVs)• Usually: Inputs (MVs) are valves.
– Physical input is valve position (z), but we often simplify and say that flow (q) is input
Valve equationz
q [m3/s]p1 p2
7
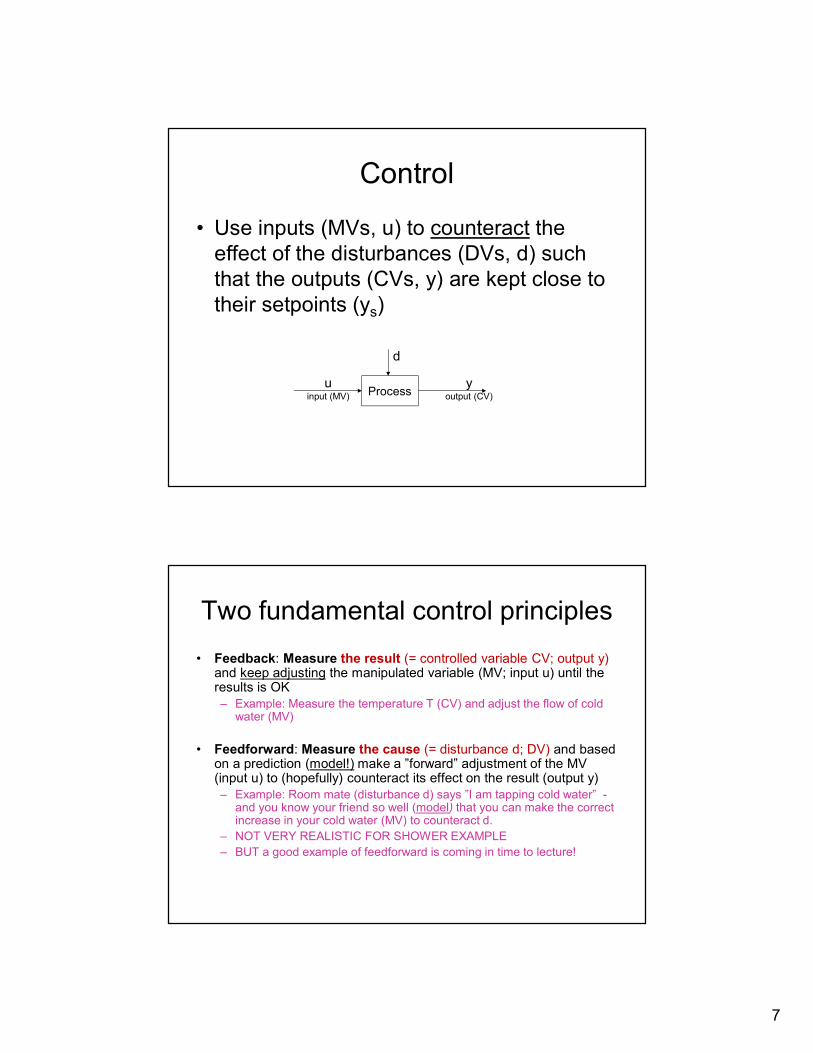
Control• Use inputs (MVs, u) to counteract the
effect of the disturbances (DVs, d) such that the outputs (CVs, y) are kept close to their setpoints (ys)
Processuinput (MV)
youtput (CV)
d
Two fundamental control principles• Feedback: Measure the result (= controlled variable CV; output y) and keep adjusting the manipulated variable (MV; input u) until the results is OK
– Example: Measure the temperature T (CV) and adjust the flow of cold water (MV)• Feedforward: Measure the cause (= disturbance d; DV) and based on a prediction (model!) make a ”forward” adjustment of the MV (input u) to (hopefully) counteract its effect on the result (output y)
– Example: Room mate (disturbance d) says ”I am tapping cold water” -and you know your friend so well (model) that you can make the correct increase in your cold water (MV) to counteract d. – NOT VERY REALISTIC FOR SHOWER EXAMPLE– BUT a good example of feedforward is coming in time to lecture!
8
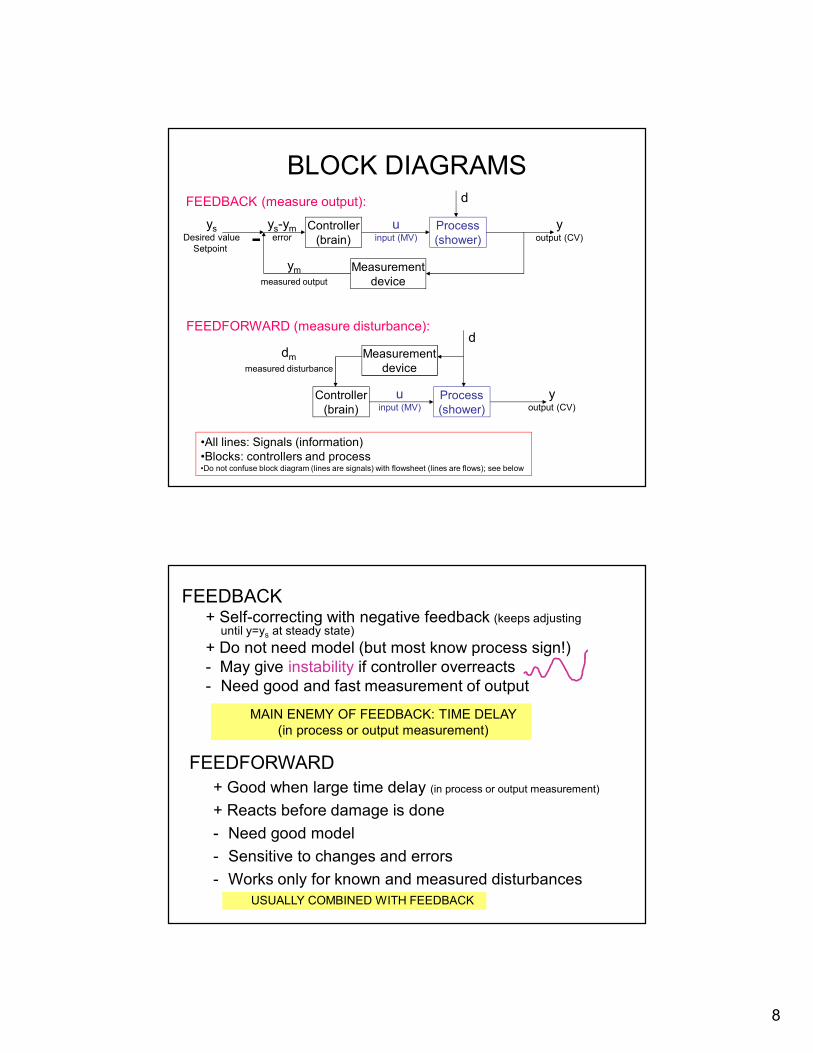
BLOCK DIAGRAMSController
(brain)Measurement
device
ysDesired valueSetpoint
ys-ymerror
ymmeasured output
FEEDBACK (measure output):Process(shower)
uinput (MV)
youtput (CV)
d
Controller(brain)
Process(shower)
Measurementdevice
FEEDFORWARD (measure disturbance):dm
measured disturbance
d
uinput (MV)
youtput (CV)
•All lines: Signals (information)•Blocks: controllers and process•Do not confuse block diagram (lines are signals) with flowsheet (lines are flows); see below
FEEDBACK+ Self-correcting with negative feedback (keeps adjusting until y=ys at steady state)+ Do not need model (but most know process sign!)- May give instability if controller overreacts- Need good and fast measurement of output
MAIN ENEMY OF FEEDBACK: TIME DELAY (in process or output measurement)
USUALLY COMBINED WITH FEEDBACK
FEEDFORWARD+ Good when large time delay (in process or output measurement)+ Reacts before damage is done- Need good model- Sensitive to changes and errors- Works only for known and measured disturbances
9
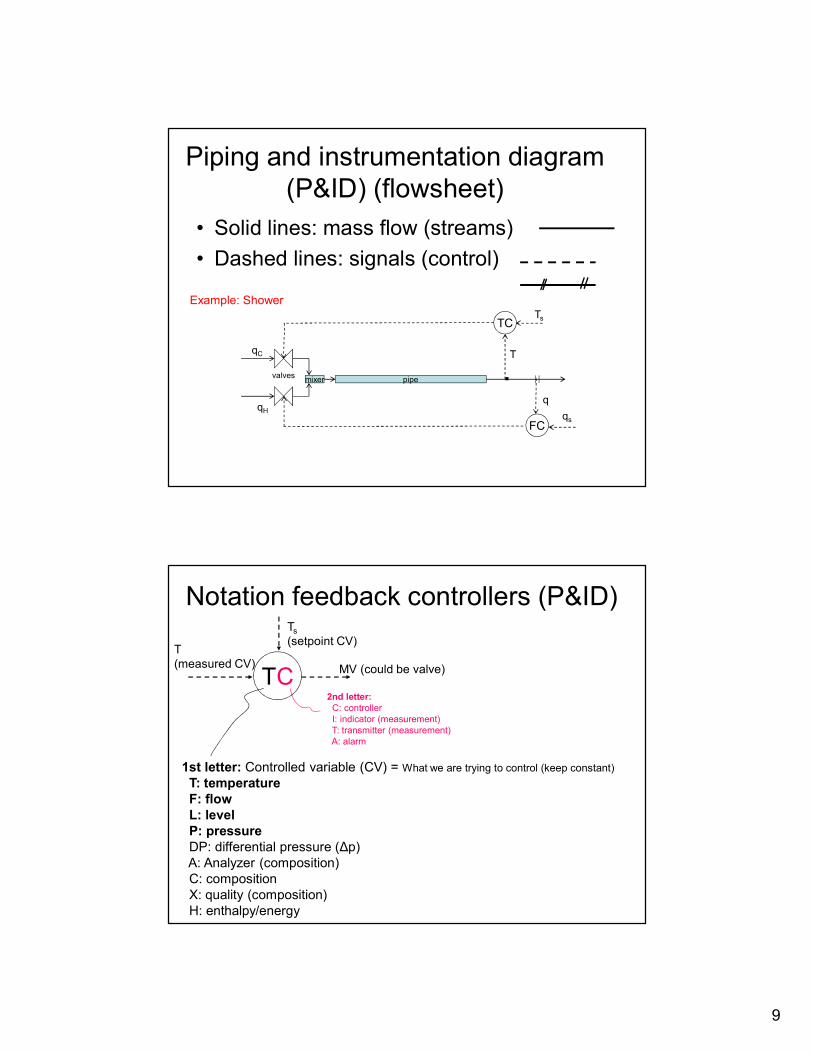
Piping and instrumentation diagram (P&ID) (flowsheet)
• Solid lines: mass flow (streams)• Dashed lines: signals (control)
Example: Shower
mixer pipe
TCT
Ts
qC
qH
.FC qs
qvalves
Notation feedback controllers (P&ID)
TC2nd letter:C: controllerI: indicator (measurement)T: transmitter (measurement)A: alarm
1st letter: Controlled variable (CV) = What we are trying to control (keep constant)T: temperatureF: flowL: levelP: pressureDP: differential pressure (Δp)A: Analyzer (composition)C: compositionX: quality (composition)H: enthalpy/energy
Ts(setpoint CV)T(measured CV) MV (could be valve)

10
LCHHs
Inflow (d)
Outflow (u)
INPUT (u, MV): OUTFLOW (Input for control!)OUTPUT (y, CV): LEVEL DISTURBANCE (d, DV): INFLOW
Example: Level control
CLASSIFICATION OF VARIABLES FOR CONTROL (MV, CV. DV):
LCHHs
Inflow (u)
Outflow (d)
INPUT (u, MV): INFLOW OUTPUT (y, CV): LEVEL DISTURBANCE (d, DV): OUTFLOW
Level control when product rate is given(less common)
CLASSIFICATION OF VARIABLES FOR CONTROL (MV, CV. DV):
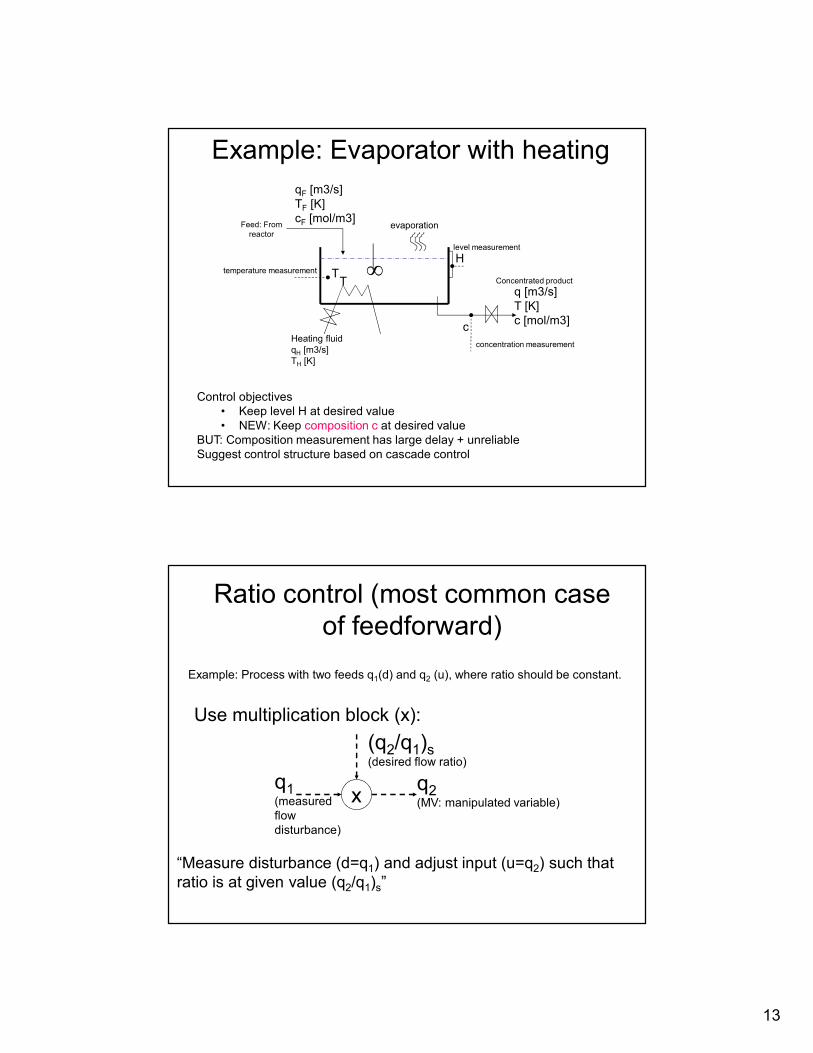
11
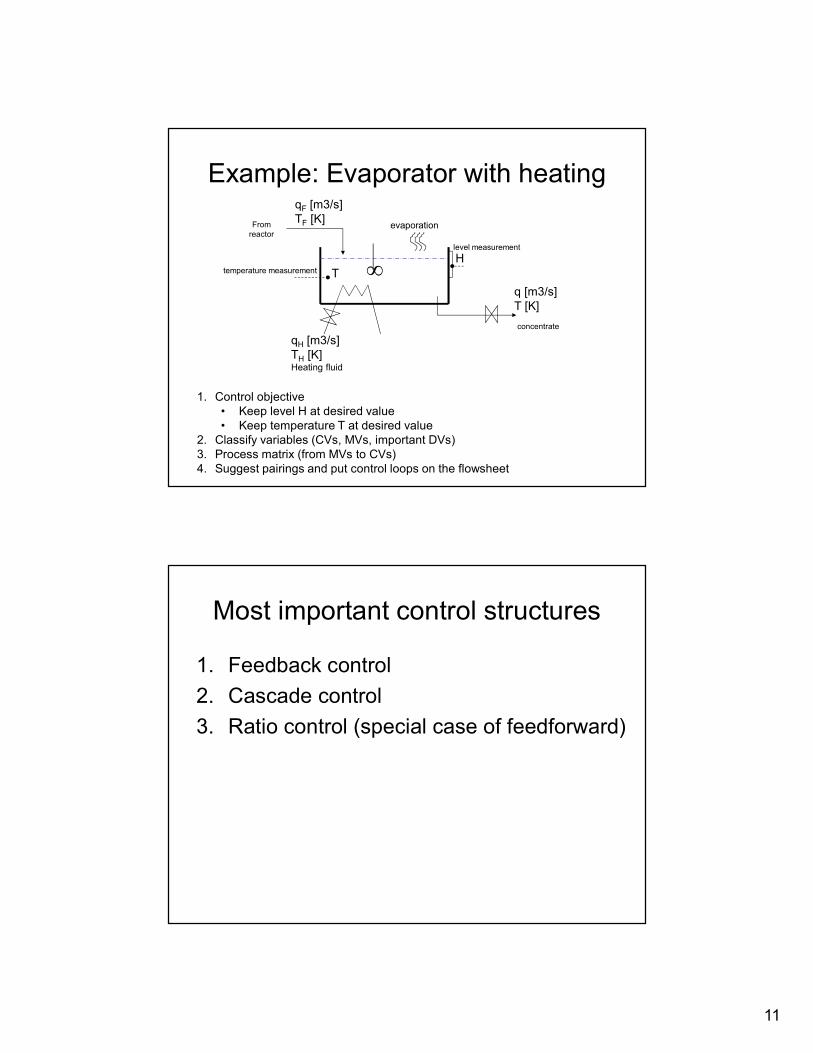
Example: Evaporator with heatingFrom
reactor
qF [m3/s]TF [K]
q [m3/s]T [K]
qH [m3/s]TH [K]Heating fluid
evaporationlevel measurement
temperature measurement T ∞ H
1. Control objective• Keep level H at desired value• Keep temperature T at desired value
2. Classify variables (CVs, MVs, important DVs)3. Process matrix (from MVs to CVs)4. Suggest pairings and put control loops on the flowsheet
concentrate
Most important control structures1. Feedback control2. Cascade control3. Ratio control (special case of feedforward)
12
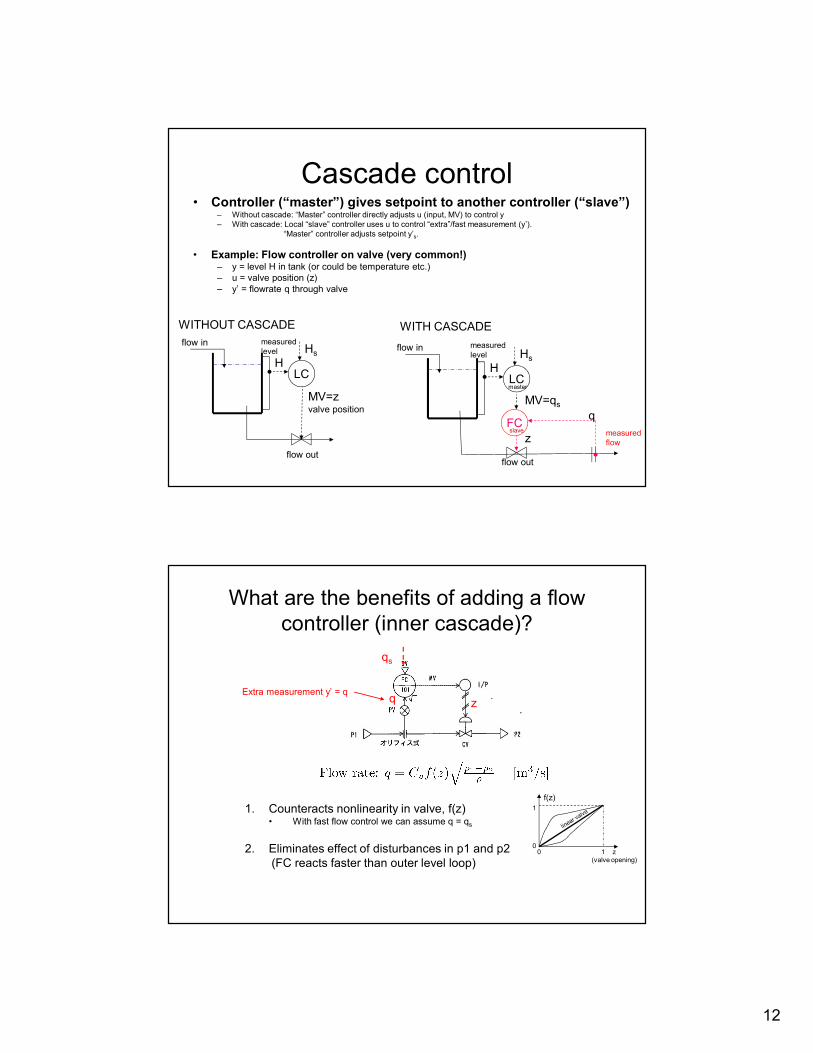
Cascade control• Controller (“master”) gives setpoint to another controller (“slave”)
– Without cascade: “Master” controller directly adjusts u (input, MV) to control y– With cascade: Local “slave” controller uses u to control “extra”/fast measurement (y’).
“Master” controller adjusts setpoint y’s. • Example: Flow controller on valve (very common!)
– y = level H in tank (or could be temperature etc.)– u = valve position (z)– y’ = flowrate q through valve
LCHHs
flow in
flow out
MV=zvalve position
WITHOUT CASCADE WITH CASCADE
measured flow
LCHHs
flow in
flow out
MV=qsFC q
z
master
slave
measured level measured
level
What are the benefits of adding a flow controller (inner cascade)?
q z
qs
1. Counteracts nonlinearity in valve, f(z)• With fast flow control we can assume q = qs
2. Eliminates effect of disturbances in p1 and p2(FC reacts faster than outer level loop)
Extra measurement y’ = q
z(valve opening)
f(z)
0 10
1
13
Example: Evaporator with heatingFeed: From
reactor
qF [m3/s]TF [K]cF [mol/m3]
q [m3/s]T [K]c [mol/m3]
Heating fluid qH [m3/s]TH [K]
evaporationlevel measurement
temperature measurement T ∞ H
Control objectives• Keep level H at desired value• NEW: Keep composition c at desired value
BUT: Composition measurement has large delay + unreliableSuggest control structure based on cascade control
Concentrated productT
concentration measurementc
Ratio control (most common case of feedforward)
x(q2/q1)s(desired flow ratio)q1(measured
flowdisturbance)
q2(MV: manipulated variable)
“Measure disturbance (d=q1) and adjust input (u=q2) such that ratio is at given value (q2/q1)s”
Use multiplication block (x):Example: Process with two feeds q1(d) and q2 (u), where ratio should be constant.
14
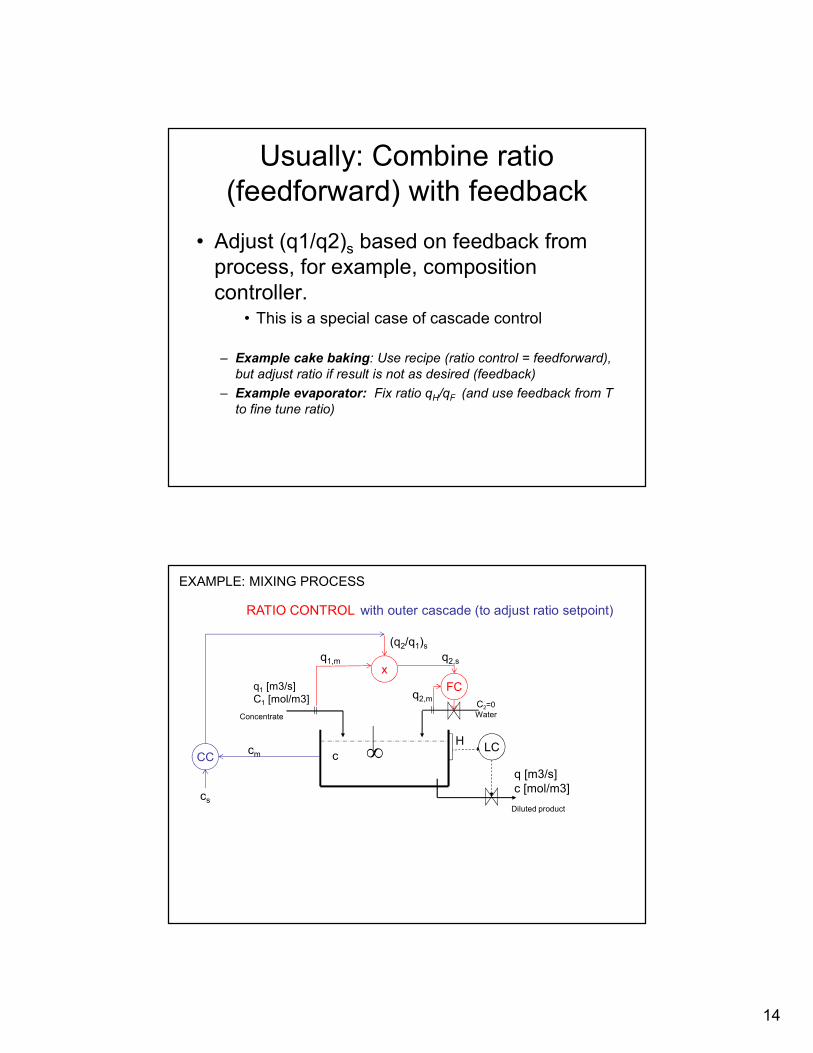
Usually: Combine ratio (feedforward) with feedback
• Adjust (q1/q2)s based on feedback from process, for example, composition controller.
• This is a special case of cascade control– Example cake baking: Use recipe (ratio control = feedforward),
but adjust ratio if result is not as desired (feedback)– Example evaporator: Fix ratio qH/qF (and use feedback from T
to fine tune ratio)
Concentrate
q1 [m3/s]C1 [mol/m3]
q [m3/s]c [mol/m3]
c ∞ H
Diluted product
LC
C2=0Water
FCx
(q2/q1)s q2,sq1,m
q2,m
CC cm
cs
RATIO CONTROL with outer cascade (to adjust ratio setpoint)EXAMPLE: MIXING PROCESS
15
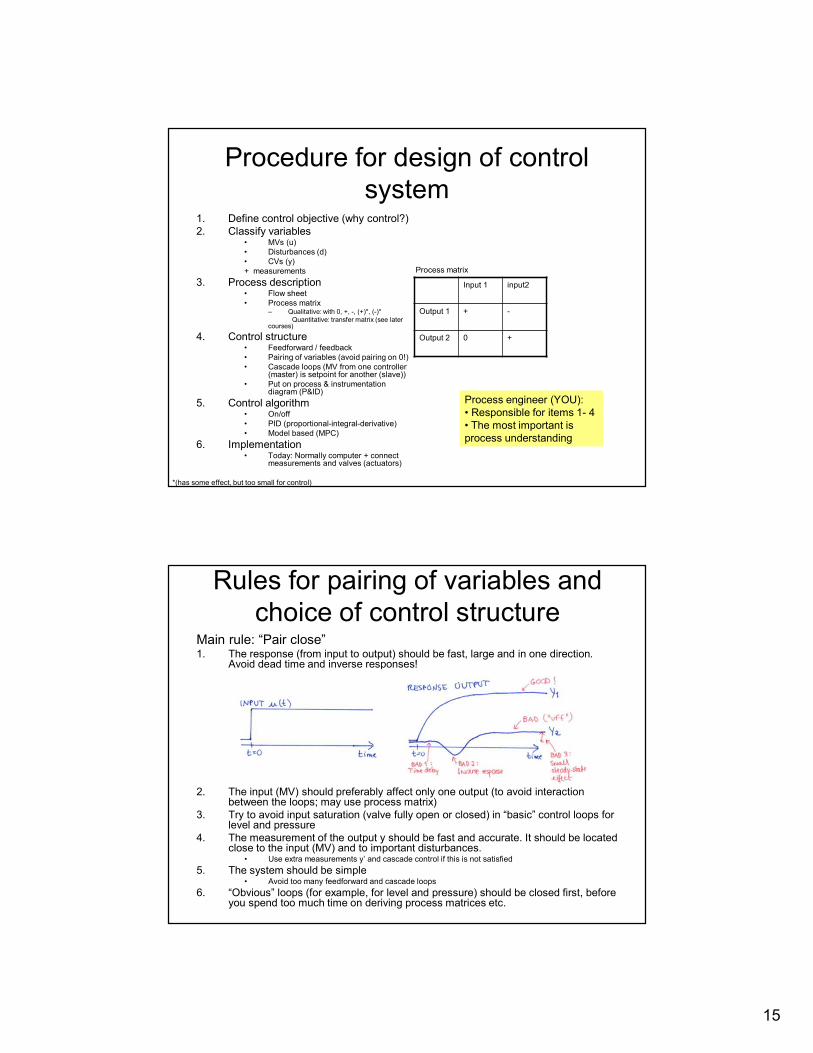
Procedure for design of control system
1. Define control objective (why control?)2. Classify variables
• MVs (u)• Disturbances (d)• CVs (y)+ measurements3. Process description• Flow sheet• Process matrix
– Qualitative: with 0, +, -, (+)*, (-)*Quantitative: transfer matrix (see later courses)4. Control structure
• Feedforward / feedback• Pairing of variables (avoid pairing on 0!)• Cascade loops (MV from one controller (master) is setpoint for another (slave))• Put on process & instrumentation diagram (P&ID)5. Control algorithm• On/off• PID (proportional-integral-derivative)• Model based (MPC)6. Implementation• Today: Normally computer + connect measurements and valves (actuators)
Process engineer (YOU):• Responsible for items 1- 4• The most important is process understanding
Input 1 input2
Output 1 + -
Output 2 0 +
Process matrix
*(has some effect, but too small for control)
Rules for pairing of variables and choice of control structure
Main rule: “Pair close”1. The response (from input to output) should be fast, large and in one direction. Avoid dead time and inverse responses!
2. The input (MV) should preferably affect only one output (to avoid interaction between the loops; may use process matrix)3. Try to avoid input saturation (valve fully open or closed) in “basic” control loops for level and pressure4. The measurement of the output y should be fast and accurate. It should be located close to the input (MV) and to important disturbances.
• Use extra measurements y’ and cascade control if this is not satisfied5. The system should be simple• Avoid too many feedforward and cascade loops6. “Obvious” loops (for example, for level and pressure) should be closed first, before you spend too much time on deriving process matrices etc.

16
Example: Shower
Input 1qc
Input2qh
Output 1TOutput 2q
1. Define control objective (why control?)• CVs: Control temperature T and flow q2. Classify variables• MVs (u): qc, qh• Disturbances (d): Focus on main• CVs (y): T, q3. Process description• Flow sheet• Process matrix4. Control structure • Pairing of variables (Alt.1, Alt.2)• Multivariable (Alt 3)
In this case the process matrix has no 0’s ) Interactive, so pairing is not obvious!Multivariable control (“decoupling”) is used in practice: One handle for total flow (qh+qc), one for ratio (qh/qc)
qc qh
Tq
- ++ +
3x3 pairing exampleInputs
Outputs
y1 + + +y2 0 + -y3 0 + 0
u1 u2 u3
Pairing: Choose one pairing from each row/column. Avoid pairing on 0’s
17
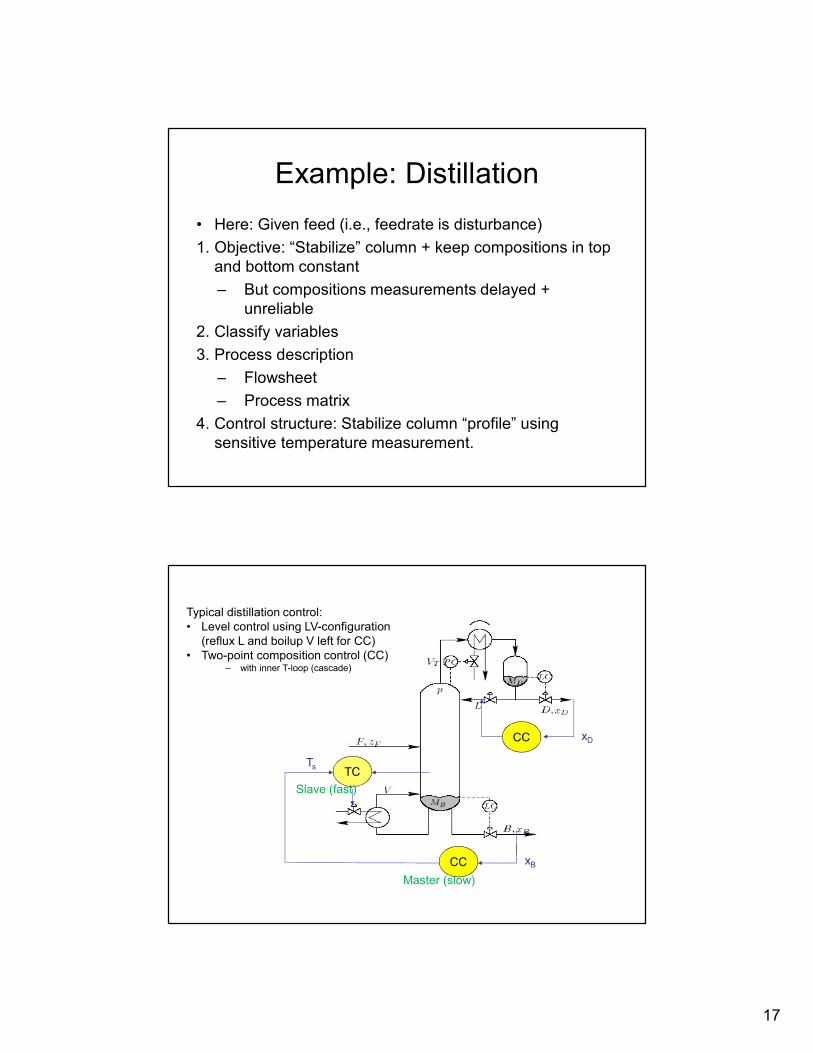
Example: Distillation• Here: Given feed (i.e., feedrate is disturbance) 1. Objective: “Stabilize” column + keep compositions in top
and bottom constant– But compositions measurements delayed +
unreliable2. Classify variables3. Process description
– Flowsheet– Process matrix
4. Control structure: Stabilize column “profile” using sensitive temperature measurement.
CC
LV
Typical distillation control: • Level control using LV-configuration
(reflux L and boilup V left for CC)• Two-point composition control (CC)
– with inner T-loop (cascade)
TCTs
xB
CC xD
Slave (fast)
Master (slow)

18
CC
LVTypical distillation control: Two-point composition control (CC)LV-configuration (L and V left for CC)with inner T-loop (cascade)
TCTs
xB
CC xD
Slave (fast)
Master (slow)
Control hierarchy based on “time scale separation”
MPC or cascade/feedforward/…(slower advanced and multivariable control)
PID (fast “regulatory” control)
PROCESS
setpoints
setpoints
MPC = model predictive controlPID = proportional+integral+derivative control
19
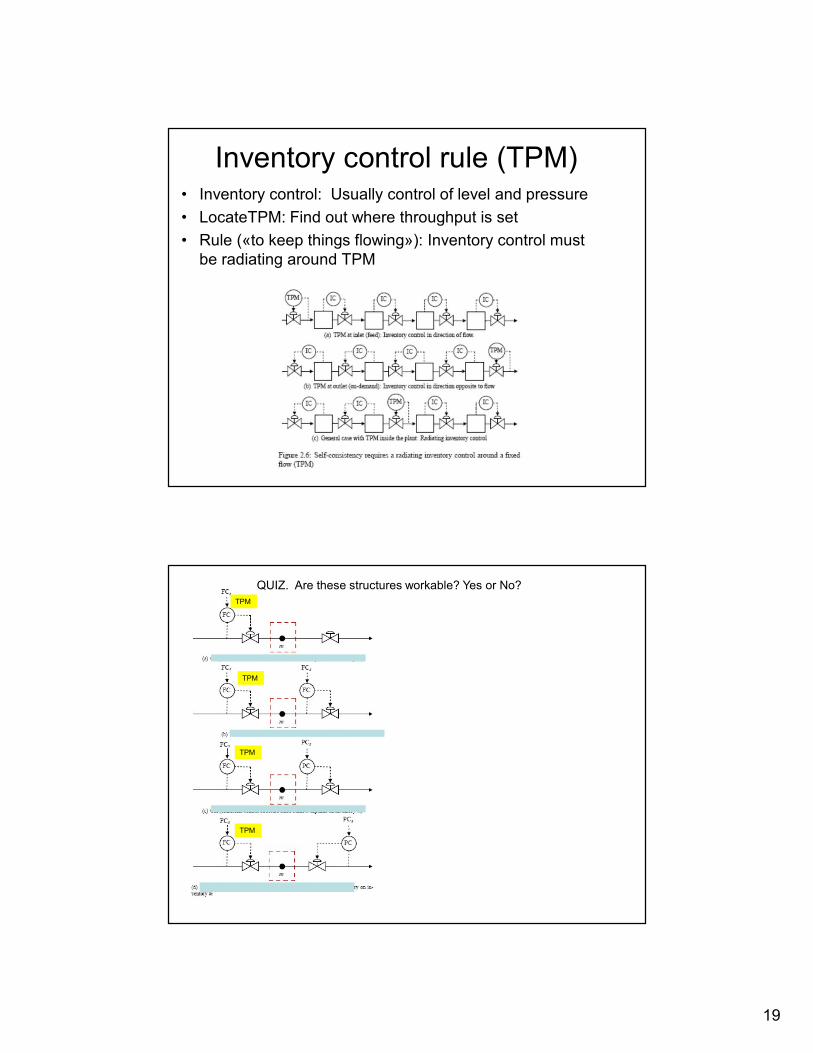
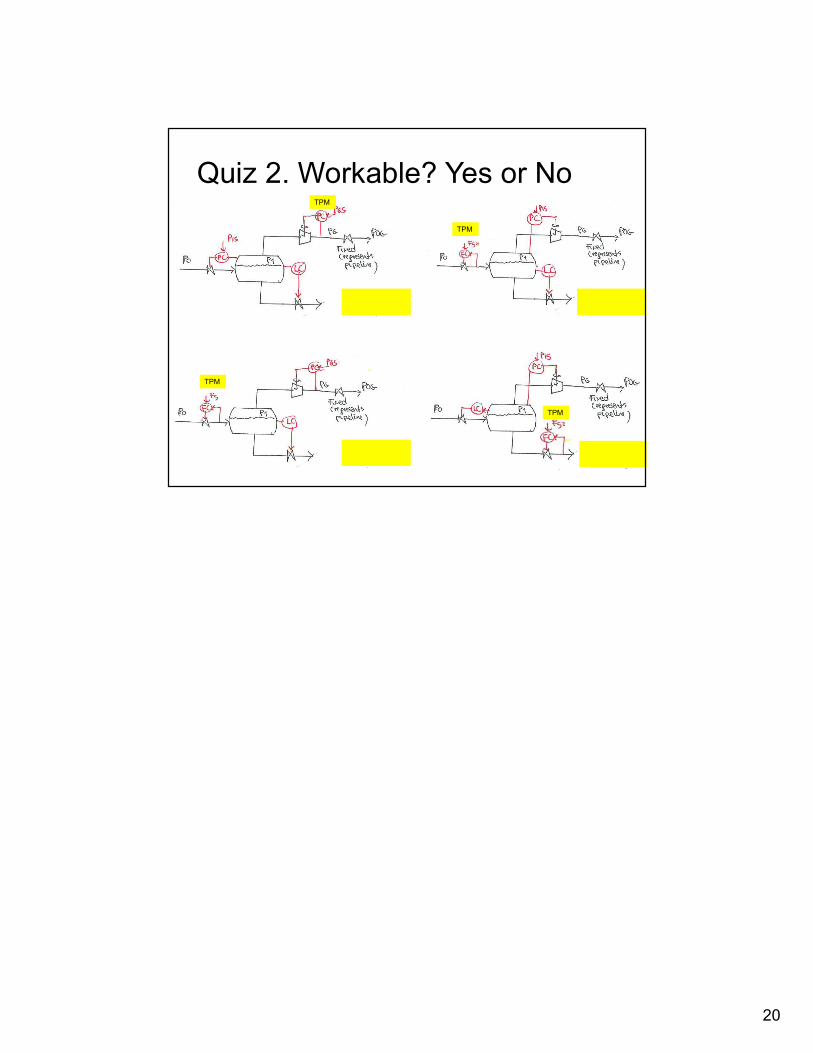
Inventory control rule (TPM)• Inventory control: Usually control of level and pressure• LocateTPM: Find out where throughput is set• Rule («to keep things flowing»): Inventory control must
be radiating around TPM
QUIZ. Are these structures workable? Yes or No?TPM
TPM
TPM
TPM
20
Quiz 2. Workable? Yes or NoTPM
TPM
TPM
TPM


