Microcalcification identification in digital mammogram for early detection of breast cancer Masters -2 Presentation Nashid Alam Registration No: 2012321028 [email protected]Supervisor: Prof. Dr. M. Shahidur Rahman Department of Computer Science And Engineering Shahjalal University of Science and Technology Wednesday, April 15, 2015 Driving research for better breast cancer treatment “The best protection is early detection”
Transcript
Microcalcification identificationin digital mammogram for earlydetection of breast cancerMasters -2 Presentation
Shahjalal University of Science and TechnologyWednesday, April 15, 2015
Driving research for better breast cancer treatment “The best protection is early detection”
Introduction
Breast cancer:The most devastating and deadly diseases for women.
o Computer aided detection (CADe) o Computer aided diagnosis (CADx) systems
Computerize Breast cancer Detection System:
Steps to control breast cancer:1) Prevention2) Detection3) Diagnosis4) Treatment
We will emphasis on :1) Detection2) Diagnosis
Background Interest
Ultrasound/ Sonogram MRI
Background Interest
Interest comes from two primary backgrounds
Improvement of pictorial information for humanperception
How can an image/video be made more aesthetically pleasingHow can an image/video be enhanced to facilitateextraction of useful information
Processing of data for autonomous machineperception- Machine Vision
Mam
mo
gram(2
D)
Tom
ogram
(3D
)
Micro-calcification
Mammography
Mammogram
Background knowledge
Micro-calcification
Background knowledge
Micro-calcification
Micro-calcifications :- Tiny deposits of calcium- May be benign or malignant- A first cue of cancer.
Position:1. Can be scattered throughout the mammary gland, or 2. Occur in clusters.(diameters from some µm up to approximately 200 µm.)3. Considered regions of high frequency.
Micro-calcification
They are caused by a number of reasons:
1. Aging –The majority of diagnoses are made in women over 50
2. Genetic –Involving the BRCA1 (breast cancer 1, early onset) and
BRCA2 (breast cancer 2, early onset) genes
Micro-calcifications Pattern Determines :The future course of the action-
I. Whether it be further investigatory techniques (as part of the triple assessment), or
II. More regular screening
Mammography
Background knowledge
Mammography Machine
Mammography
USE:I. Viewing x-ray imageII. Manipulate X-ray image on a computer screen
Mammography :
Process of using low-energyx-rays to examine the human breast
Used as a diagnostic and a screening tool.
The goal of mammography :The early detection of breast cancer
Mammography Machine
Mammogram
Background knowledge
mdb226.jpg
Mammogram
Mammogram:An x-ray picture of the breast
Use:To look for changes that are not normal.
Result Archive:The results are recorded:
1. On x-ray film or 2.Directly into a computer
mdb226.jpg
LITERATURE REVIEW
Wang et.al.(1989):The mammograms are:
-Decomposed into different frequency subbands.
The low-frequency subband discarded.
Literature Review
Literature Review
Daubechies I.(1992): Wavelets are mainly used :
-Because of their dilation and translation properties-Suitable for non stationary signals.
Strickland et.at (1996) :
Used biorthogonal filter bank-To compute four dyadic and -Two cinterpolation scales.
Applied binary threshold-operator -In six scales.
Literature Review
Heinlein et.al(2003):Goal: Enhancement of mammograms:
Derived The integrated wavelets:- From a model of microcalcifications
Literature Review
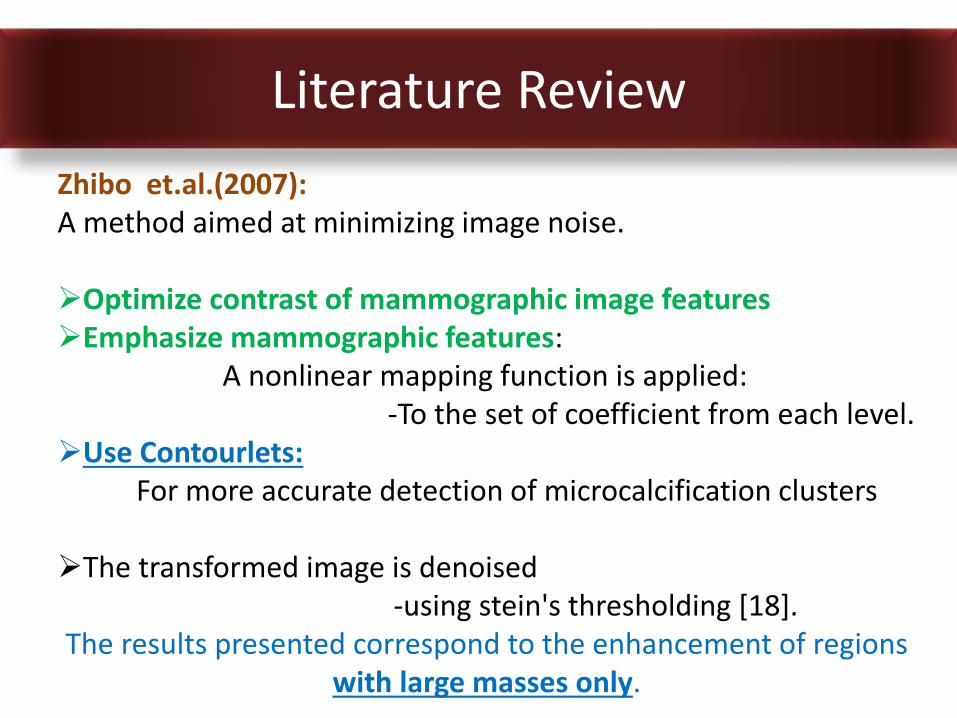
Zhibo et.al.(2007):A method aimed at minimizing image noise.
Optimize contrast of mammographic image featuresEmphasize mammographic features:
A nonlinear mapping function is applied:-To the set of coefficient from each level.
Use Contourlets:For more accurate detection of microcalcification clusters
The transformed image is denoised-using stein's thresholding [18].
The results presented correspond to the enhancement of regions with large masses only.
Literature Review
Fatemeh et.al.(2007) :
Focus on:
-Analysis of large masses instead of microcalcifications.
- Detecting subtle mass lesions in Digital breast tomosynthesis (DBT)
- Noise regularization in DBT reconstruction
Literature Review
Leeuw et.al.(2014) :
Use:
- Phase derivative to detect microcalcifications - A template matching algorithm was designed
Focus on:
- Detect microcalcifications in breast specimens using MRI
- Noise regularization in image reconstruction
Literature Review
Shankla et.al.(2014) :
Automatic insertion of simulated microcalcification clusters-in a software breast phantom
Focus on:
-Algorithm developed as part of a virtual clinical trial (VCT) :-Includes the simulation of breast anatomy, - Mechanical compression- Image acquisition- Image processing, displaying and interpretation.
Problem Statement
Reason behind the problem( In real life):Burdensome Task Of Radiologist :
Eye fatigue:-Huge volume of images-Detection accuracy rate tends to decrease
Non-systematic search patterns of humansPerformance gap between :
Specialized breast imagers andgeneral radiologists
Interpretational Errors:Similar characteristics:
Abnormal and normal microcalcification
Problem Statement
The signs of breast cancer are:
Masses CalcificationsTumorLesionLump
Individual Research Areas
Problem Statement
Motivation to the Research
Motivation to the Research: Goal
Better Cancer Survival Rates(Facilitate Early Detection ).
Provide “second opinion” : Computerized decisionsupport systems
Fast,Reliable, andCost-effective
QUICKLY AND ACCURATELY :Overcome the development of breast cancer
Challenges
Develop a logistic model:
Early detection of Breast Cancer.
-Micro-calcification Enhancement
-To determine the likelihood of CANCEROUS AREA from the image values of mammograms.
Challenge:Occur in clusters
The clusters may vary in size from 0.05mm to 1mm in diameter.
Variation in signal intensity and contrast.May located in dense tissue
Difficult to detect.
Challenges
Plan of Action
Gantt Chart
Chart 01: Gantt Chart of this M.Sc thesis showing the duration of task against the progression of time
Vertical directions are represented by sub-bands 4-7
(5) sub-band 4
(6) sub-band 5
(7) sub-band 6
(8) sub-band 7
Why Contourlet?
Why Contourlet?
•Decompose the mammographic image:
-Into directional components:
To easily capture the geometry of the image features.
Details in upcoming slides
Target
Details in upcoming slides
• This decomposition offers:
-Multiscale localization(Laplacian Pyramid) and -A high degree of directionality and anisotropy.
Why Contourlet? Usefulness of Contourlet
Directionality:Having basis elements Defined in variety of directions
Anistrophy:Basis Elements having Different aspect ration
Contourlet Transform Concept
(a)Wavelet(Require a lot of dot for fine resolution)
(b)Contourlet(Requires few different elongated shapes
in a variety of direction following the counter)
3 Different Size of Square Shape brush stroke(Smallest, Medium, Largest) to provide Multiresolution Image
Example: Painter Scenario
Why Contourlet?
2-D Contourlet Transform (2D-CT) Discrete WT
Handles singularities such as edges in a more powerful way
Has basis functions at many orientations has basis functions at three orientations
Basis functions appear a several aspectratios
the aspect ratio of DWT is 1
CT similar as DWT can beimplemented using iterative filter banks.
Advantage of using 2D-CT over DWT:
Details in upcoming slides
Input image
Bandpass
Directional
subbands
Bandpass
Directional
subbands
Plan-of-Action
For microcalcifications enhancement :
We use-The Contourlet Transform(CT) [12]
The Prewitt Filter.
12. Da Cunha A. L., Zhou J. and Do M. N,: The Nonsubsampled Contourlet Transform: Theory, Design, and
Applications, IEEE Transactions on Image Processing,vol. 15, (2006) pp. 3089-3101
Art-of-Action
An edge Prewitt
filter to enhance the
directional structures
in the image.
Contourlet transform allows
decomposing the image in
multidirectional
and multiscale subbands[6].
6. Laine A.F., Schuler S., Fan J., Huda W.: Mammographic feature enhancement by multiscale
analysis, IEEE Transactions on Medical Imaging, 1994, vol. 13, no. 4,(1994) pp. 7250-7260
This allows finding • A better set of edges,• Recovering an enhanced mammogram with better visual characteristics.
Microcalcifications have a very small size a denoising stage is not implemented
in order to preserve the integrity of the injuries.
Decompose the
digital mammogram
Using
Contourlet transform
(b) Enhanced image(mdb238.jpg)
(a) Original image (mdb238.jpg)
Method
CT is implemented in two stages:
1. Subband decomposition stage
2. Directional decomposition stages.
Details in upcoming slides
Method
1. Subband decomposition stage
For the subband decomposition:- The Laplacian pyramid is used [13]
Decomposition at each step:-Generates a sampled low pass version of the original-The difference between :
The original image and the prediction.
13. Park S.-I., Smith M. J. T., and Mersereau R. M.: A new directional Filter bank for image analysis and classification,Proceedings of IEEE International Conference on Acoustics, Speech, and Signal Processing (ICASSP '99), vol. 3, (1999) pp.1417-1420
Details ……..
Method
1. Subband decomposition stage
Details ……..
1. The input image is first low pass filtered
2. Filtered image is then decimated to get a coarse(rough) approximation.
3. The resulting image is interpolated and passed through Synthesis
filter.
4. The obtained image is subtracted from the original image :
To get a bandpass image.
5. The process is then iterated on the coarser version (high resolution)of the image.
Plan of Action
Method
2.Directional Filter Bank (DFB)
Details ……..
Implemented by using an L-level binary tree decomposition :
resulting in 2L subbands
The desired frequency partitioning is obtained by :
Following a tree expanding rule
- For finer directional subbands [13].
13. Park S.-I., Smith M. J. T., and Mersereau R. M.: A new directional Filter bank for image analysis and classification,Proceedings of IEEE International Conference on Acoustics, Speech, and Signal Processing (ICASSP '99), vol. 3, (1999) pp.1417-1420
The Contourlet Transform
The CT is implemented by:Laplacian pyramid followed by directional filter banks (Fig-01)
Input image
Bandpass
Directional
subbands
Bandpass
Directional
subbands
Figure 01: Structure of the Laplacian pyramid together with the directional filter bank
The concept of wavelet:University of Heidelburg
The CASCADE STRUCTURE allows:- The multiscale and
directional decomposition to be independent
- Makes possible to:Decompose each scale into
any arbitrary power of two's number of directions(4,8,16…)
Figure 01
Details ………….
Decomposes The Image Into Several Directional Subbands And Multiple Scales
Figure 02: (a)Structure of the Laplacian pyramid together with the directional filter bank(b) frequency partitioning by the contourlet transform(c) Decomposition levels and directions.
(a) (b)
Input
image
Bandpass
Directional
subbands
Bandpass
Directional
subbands
Details….
(c)
DenoteEach subband by yi,j
Wherei =decomposition level and J=direction
The Contourlet Transform
Decomposes The Image Into Several Directional Subbands And Multiple Scales
The processing of an image consists on:-Applying a function to enhance the regions of
interest.
In multiscale analysis:
Calculating function f for each subband :
-To emphasize the features of interest
-In order to get a new set y' of enhanced subbands:
Each of the resulting enhanced subbands can be
expressed using equation 1.
)(', , jiyfjiy ………………..(1)
-After the enhanced subbands are obtained, the inverse
transform is performed to obtain an enhanced image.
Enhancement of the Directional Subbands
The Contourlet Transform
Denote
Each subband by yi,jWherei =decomposition level and J=direction Details….
Enhancement of the Directional Subbands
The Contourlet Transform
Details….
The directional subbands are enhanced using equation 2.
)( , jiyf)2,1(
,1 nnWjiy
)2,1(,2 nnWjiy
If bi,j(n1,n2)=0
If bi,j(n1,n2)=1………..(2)
Denote
Each subband by yi,jWherei =decomposition level and J=direction
W1= weight factors for detecting the surrounding tissueW2= weight factors for detecting microcalcifications
(n1,n2) are the spatial coordinates.
bi;j = a binary image containing the edges of the subband
Weight and threshold selection techniques are presented on upcoming slides
Enhancement of the Directional Subbands
The Contourlet Transform
The directional subbands are enhanced using equation 2.
)( , jiyf)2,1(
,1 nnWjiy
)2,1(,2 nnWjiy
If bi,j(n1,n2)=0
If bi,j(n1,n2)=1………..(2)
Binary edge image bi,j is obtained :-by applying an operator (prewitt edge detector)
-to detect edges on each directional subband.
In order to obtain a binary image:A threshold Ti,j for each subband is calculated.
Details….
Weight and threshold selection techniques are presented on upcoming slides
Threshold Selection
The Contourlet Transform
Details….
The microcalcifications appear :
On each subband Over a very
homogeneous background.
Most of the transform coefficients:
-The coefficients corresponding to theinjuries are far from background value.
A conservative threshold of 3σi;j is selected:where σi;j is the standard deviation of the corresponding subband y I,j .
Weight Selection
The Contourlet Transform
Exhaustive tests:-Consist on evaluating subjectively a set of 322 different mammograms
-With Different combinations of values,
The weights W1, and W2 are determined:-Selected as W1 = 3 σi;j and W2 = 4 σi;j
These weights are chosen to:keep the relationship W1 < W2:
-Because the W factor is a gain -More gain at the edges are wanted.
Experimental Results
Applying Contourlet Transformation Benign
Original image Enhanced image
Goal: Microcalcification Enhancement
mdb222.jpg
mdb223.jpg
Original image Enhanced image
mdb248.jpg
mdb252.jpg
Applying Contourlet Transformation Benign
Original image Enhanced image
mdb226.jpg
mdb227.jpg
Original image Enhanced image
mdb236.jpg
mdb240.jpg
Goal: Microcalcification Enhancement
Applying Contourlet Transformation Benign
Original image Enhanced image Original image Enhanced image
Original image(with diagonal details areas indicated)
Diagonal Details
Use Separable Transform
2D Wavelet Transform
Vertical Details
Decomposition at Label 4
Original image(with Vertical details areas indicated)
Experimental Results
Experimental Results
DWT
1.Original Image(Malignent_mdb238) 2.Decomposition at Label 4
2.Decomposition at Label 1 3.Decomposition at Label 2 3.Decomposition at Label 3
Experimental Results
DWT
1.Original Image(Malignent_mdb238) 2.Decomposition at Label 4
Experimental Results
1.Original Image(Benign_mdb252)
2.Decomposition at Label 4
2.Decomposition at Label 1 3.Decomposition at Label 2 3.Decomposition at Label 3
DWT
Experimental Results
1.Original Image(Malignent_mdb253.jpg) 2.Decomposition at Label 4
2.Decomposition at Label 1 3.Decomposition at Label 2 3.Decomposition at Label 3
Metrics: Quantitive Measurement
Metrics
To compare the ability of :
Enhancement achieved by the proposed method.
Why?
1. Measurement of distributed separation (MDS)
2. Contrast enhancement of background against target (CEBT) and
3. Entropy-based contrast enhancement of background against target (ECEBT) [14].
Measures used to compare:
14. Sameer S. and Keit B.: An Evaluation on Contrast Enhancement Techniques for Mammographic Breast Masses, IEEETransactions on Information Technology in Biomedicine, vol. 9, (2005) pp. 109-119
Metrics
1. Measurement of Distributed Separation
(MDS)
Measures used to compare:
The MDS represents :How separated are the distributions of each mammogram
µucalcE = Mean of the microcalcification region of the enhanced imageµucalc0 = Mean of the microcalcification region of the original image
µtissueE = Mean of the surrounding tissue of the enhanced imageµtissue0 = Mean of the surrounding tissue of the enhanced image
Defined by:
Where:
Metrics
2. Contrast enhancement of background against
target (CEBT) Measures used to compare:
The CEBT Quantifies :The improvement in difference between the background and the target(MC).
…………………………(4)
0µucalc
Eµucalc0µtissue
0µucalc
Eµtissue
Eµucalc
CEBT
Defined by:
Where:
Eµucalc
0µucalc
= Standard deviations of the microcalcifications region in the enhanced image
= Standard deviations of the microcalcifications region in the original image
Metrics
3. Entropy-based contrast enhancement of
background against target (ECEBT)Measures used to compare:
The ECEBT Measures :- An extension of the TBC metric- Based on the entropy of the regions rather
than in the standard deviations
Defined by:
Where:
…………………………(5)
0µucalc
Eµucalc0µtissue
0µucalc
Eµtissue
Eµucalc
ECEBT
= Entropy of the microcalcifications region in the enhanced image
= Entropy of the microcalcifications region in the original image
Eµucalc
0µucalc
Experimental Results
MDS, CEBT and ECEBT metrics on the enhanced mammograms
Experimental Results
CT Method DWT Method
MDS CEBT ECEBT MDS CEBT ECEBT
0.853 0.477 0.852 0.153 0.078 0.555
0.818 0.330 0.810 0.094 0.052 0.382
1.000 1.000 1.000 0.210 0.092 0.512
0.905 0.322 0.920 1.000 0.077 1.000
0.936 0.380 0.935 0.038 0.074 0.473
0.948 0.293 0.947 0.469 0.075 0.847
0.665 0.410 0.639 0.369 0.082 0.823
0.740 0.352 0.730 0.340 0.074 0.726
0.944 0.469 0.494 0.479 0.095 0.834
0.931 0.691 0.936 0.479 0.000 0.000
0.693 0.500 0.718 0.258 0.081 0.682
0.916 0.395 0.914 0.796 0.079 0.900
Table 1. Decomposition levels and directions.
0
0.2
0.4
0.6
0.8
1
1.2
TBC
Mammogram
MDS Matrix
CT DWT
The proposed method gives higher results than the wavelet-based method.
MDS, CEBT and ECEBT metrics on the enhanced mammograms
Experimental Results Analysis
0
0.2
0.4
0.6
0.8
1
1.2
TBC
E
Mammogram
CEBT Matrix
CT DWT
The proposed method gives higher results than the wavelet-based method.
MDS, CEBT and ECEBT metrics on the enhanced mammograms
Experimental Results Analysis
0
0.2
0.4
0.6
0.8
1
1.2
DSM
Mammogram
ECEBT Matrix
CT DWT
The proposed method gives higher results than the wavelet-based method.
MDS, CEBT and ECEBT metrics on the enhanced mammograms
Experimental Results Analysis
Experimental Results AnalysisMesh plot of a ROI containing microcalcifications
(a)The original mammogram
(mdb252.bmp)
(b) The enhanced mammogram
using CT
Experimental Results Analysis
(a)The original mammogram
(mdb238.bmp)
(b) The enhanced mammogram
using CT
Experimental Results Analysis
(a)The original mammogram
(mdb253.bmp)
(b) The enhanced mammogram
using CT
More peaks corresponding to microcalcifications are enhanced
The background has a less magnitude with respect to the peaks:-The microcalcifications are more visible.
Observation:
Experimental Results Analysis
Experimental Results
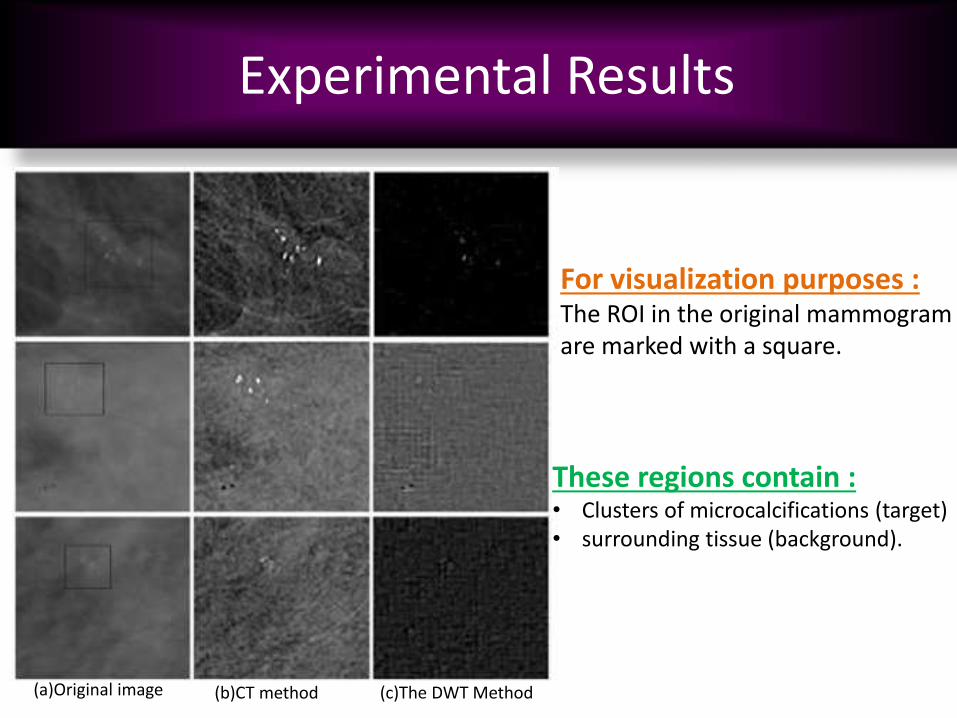
(a)Original image (b)CT method (c)The DWT Method
These regions contain :• Clusters of microcalcifications (target)• surrounding tissue (background).
For visualization purposes :The ROI in the original mammogram are marked with a square.
Plan of action as follows:
1. Segment the microcalcification(MC) from the enhanced image.
2. Find an attribute based on which I can train the machine
2. Based on feature(size/shape), will move on to classification( benign or malignant)
Reference
1. Alqdah M.; Rahmanramli A. and Mahmud R.: A System of MicrocalcificationsDetection and Evaluation of the Radiologist: Comparative Study of the Three MainRaces in Malaysia, Computers in Biology and Medicine, vol. 35, (2005) pp. 905- 914
2. Strickland R.N. and Hahn H.: Wavelet transforms for detecting microcalci¯cationsin mammograms, IEEE Transactions on Medical Imaging, vol. 15, (1996) pp. 218-229
3. Laine A.F., Schuler S., Fan J., Huda W.: Mammographic feature enhancement bymultiscale analysis, IEEE Transactions on Medical Imaging, 1994, vol. 13, no. 4,(1994) pp. 7250-7260
4. Wang T. C and Karayiannis N. B.: Detection of Microcalci¯cations in Digital Mam-mograms Using Wavelets, IEEE Transaction on Medical Imaging, vol. 17, no. 4,(1989) pp. 498-509
5. Nakayama R., Uchiyama Y., Watanabe R., Katsuragawa S., Namba K. and DoiK.: Computer-Aided Diagnosis Scheme for Histological Classi¯cation of ClusteredMicrocalci¯cations on Magni¯cation Mammograms, Medical Physics, vol. 31, no. 4,(2004) 786 – 799
6. Heinlein P., Drexl J. and Schneider Wilfried: Integrated Wavelets for Enhance-ment of Microcalci¯cations in Digital Mammography, IEEE Transactions on Medi-cal Imaging, Vol. 22, (2003) pp. 402-413
7. Daubechies I.: Ten Lectures on Wavelets, Philadelphia, PA, SIAM, (1992)
8. Zhibo Lu, Tianzi Jiang, Guoen Hu, Xin Wang: Contourlet based mammographicimage enhancement, Proc. of SPIE, vol. 6534, (2007) pp. 65340M-1 - 65340M-8
9. Fatemeh Moayedi, Zohreh Azimifar, Reza Boostani, and Serajodin Katebi:Contourlet-based mammography mass classi¯cation, ICIAR 2007, LNCS 4633,(2007) pp. 923-934
Reference
10. Do M. N. and Vetterli M.: The Contourlet Transform: An efficient DirectionalMultiresolution Image Representation, IEEE Transactions on Image Processing, vol.14, (2001) pp. 2091-2106
11. Da Cunha A. L., Zhou J. and Do M. N,: The Nonsubsampled Contourlet Trans-form: Theory, Design, and Applications, IEEE Transactions on Image Processing,vol. 15, (2006) pp. 3089-3101
12. Burt P. J. and Adelson E. H.: The Laplacian pyramid as a compact image code,IEEE Transactions on Communications, vol. 31, no. 4, (1983) pp. 532-540
13. Park S.-I., Smith M. J. T., and Mersereau R. M.: A new directional Filter bank forimage analysis and classification, Proceedings of IEEE International Conference onAcoustics, Speech, and Signal Processing (ICASSP '99), vol. 3, (1999) pp. 1417-1420
14. Sameer S. and Keit B.: An Evaluation on Contrast Enhancement Techniques forMammographic Breast Masses, IEEE Transactions on Information Technology inBiomedicine, vol. 9, (2005) pp. 109-119