40
THE ETHIOPIA MACROECONOMIC HANDBOOK 2010 www.accesscapitalsc.com
THE ETHIOPIA MACROECONOMIC
HANDBOOK 2 0 1 0
w w w. a c c e s s c a p i t a l s c . c o m

The Ethiopia Macroeconomic Handbook: 2010
www.accesscapitalsc.com
March 30, 2010
The 2010 Macroeconomic Handbook is the second such annual report prepared by Access Capital. In keeping with the approach adopted in our inaugural issue, we organize the report around ten major economic and business themes. For this year, we hazard to make ten predictions regarding the 2010 Ethiopian macroeconomic and business outlook based on our on-going analysis of domestic and external economic conditions.
THE ETHIOPIA MACROECONOMIC
HANDBOOK 2 0 1 0

The Ethiopia Macroeconomic Handbook: 2010
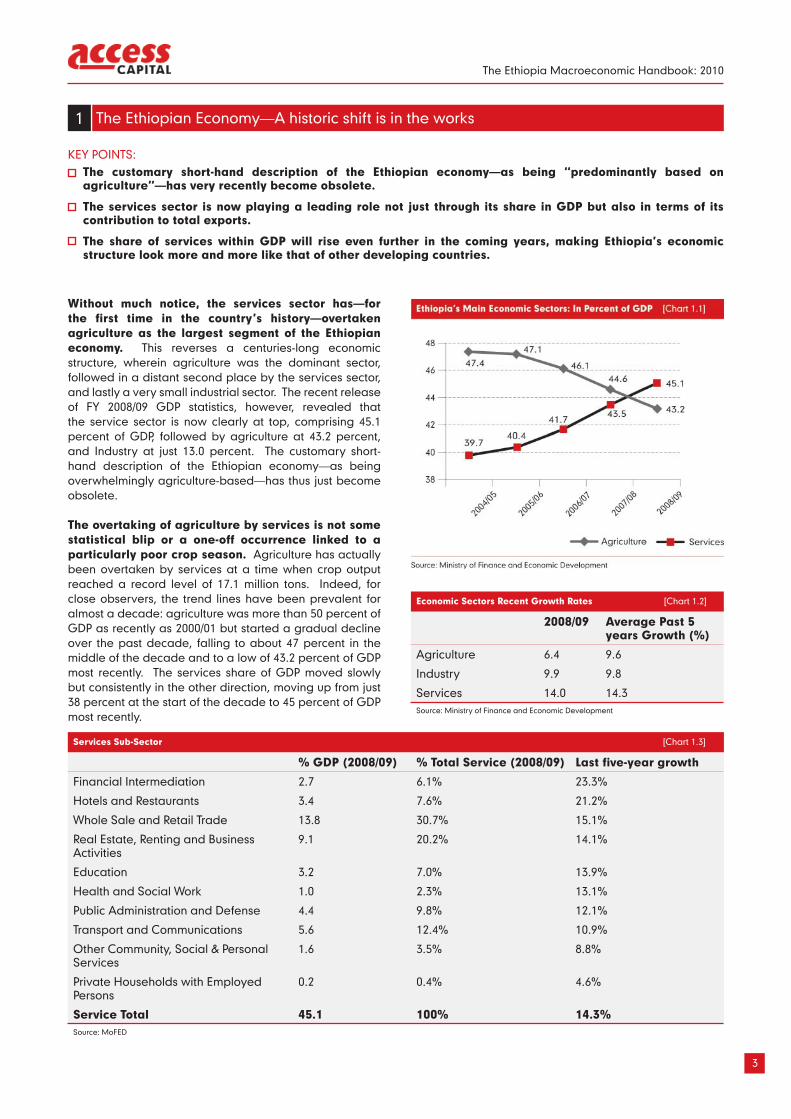
1. The Ethiopian Economy—a historic shift is in the works. Without much notice, agriculture recently ceased to be the largest sector in the economy for the first time in Ethiopia’s history. This heralds a major structural transformation of the economy and we forecast that the services sector—which covers real estate, hotels, transportation, communication, banking, health and education—will make up more than half of Ethiopia’s GDP in just two years time, a development with many implications and opportunities for Ethiopian business.
2. Economic policies are set to be relaxed. Somewhat equally unnoticed, policy changes have accelerated recently in a number of economic spheres, and we forecast this trend to gain further momentum in the next year or two. The positive trends seen of late include a pick-up of privatization, an openness to introduce modern commodity and capital markets, a passive acceptance of private share issuance, reforms (albeit marginal) in the telecom sector, a renewed policy drive to revitalize the industrial sector and, perhaps most meaningful, a rebalancing of the policy focus within agriculture from peasant-based to commercial farms. There remain of course many areas where policy reform is still—in our view—far too gradual and far too controlled.
3. At long last, commercial agriculture will truly be taking off. Agriculture as a whole will continue to show a diminishing role in the economy, but what is currently just a tiny subset of this sector, namely commercial agriculture, is on the verge of a major growth spurt. We project a five-fold increase in land devoted to commercial agricultural farms will occur in the next few years.
4. Special incentives to businesses will no longer target only exporters. The previous policy fixation on providing incentives mainly for exporters will, quite appropriately, now switch to giving similar support to import-substituting industries. This will help multiple sectors, most notably those in steel and metal processing, cement, glass, chemicals, several fast-moving consumer goods, and pharmaceuticals.
5. Though inflation has fallen sharply, near-term monetary policy will remain unnecessarily tight. Inflation has ceased to be a serious macroeconomic policy issue for quite some time. While this is welcome, the central bank’s view towards inflation appears to have taken a sharp turn from a period benign neglect (2007/08) to what now appears to be an unusually strong anti-inflationary stance. The costs to the private sector of the latter approach have been unduly high in our view, as businesses were starved of much-needed credit when the source of Ethiopia’s inflation problem was more closely linked—as we see it—to excessive public sector activity. Some relief is likely, however, in the second half of the 2010.
6. We expect private banks to be relieved from credit caps by July 2010, a welcome end to what has been a very blunt means of inflation control. The banking industry, long accustomed to open-ended credit growth, recently entered an era of tight, bank-by-bank credit ceilings. However, with the increasing recognition that the current monetary stance is unduly tight and the need to develop a much more market-based monetary policy framework, we believe that bank-by-bank credit ceilings will be removed in the second half of 2010. The recent credit caps are unlikely to hurt the profitability of banks by much this year; in any case, the expected relaxation of the caps should bring a return of the historically high returns on equity to which banks have become accustomed.
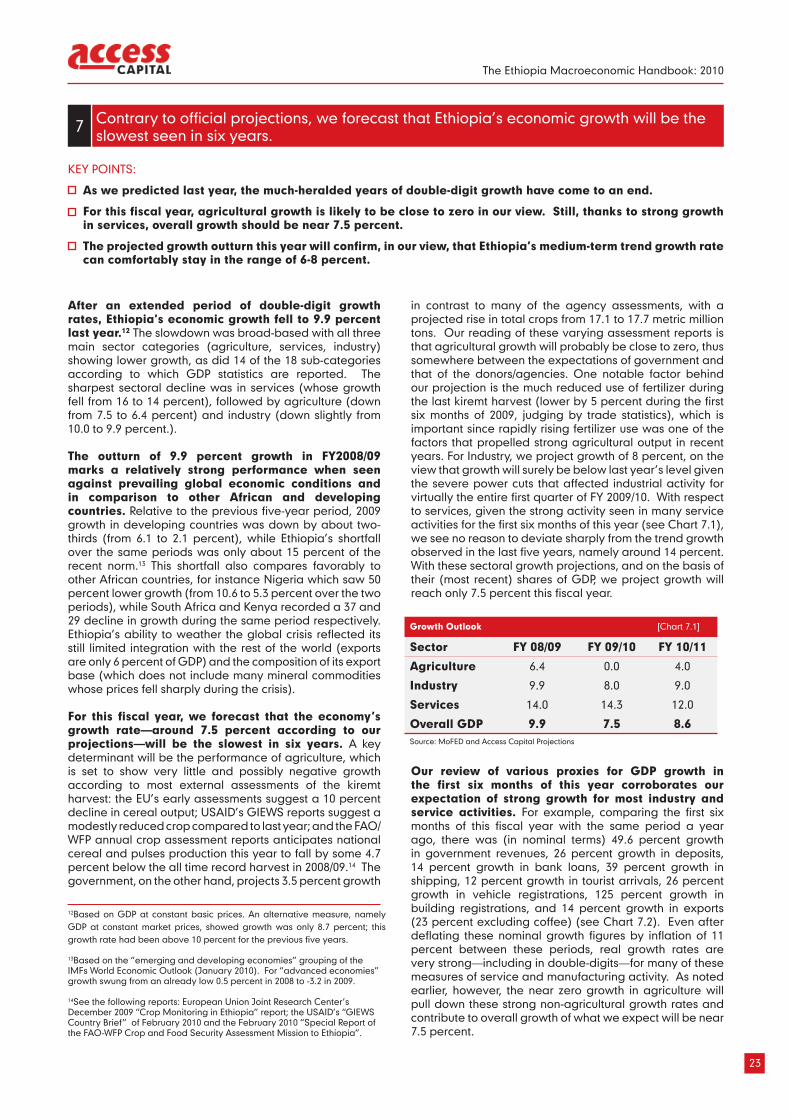
7. Contrary to official projections, we forecast that Ethiopia’s economic growth will be the slowest in six years. This projection is due mainly to what now increasingly appears to have been a poor kiremt harvest: agricultural growth is likely to be close to zero in our view. We reiterate our view—highlighted in last year’s Macroeconomic Handbook—that Ethiopia’s medium-term growth can comfortably stay in the 6-8 percent range given several positive trend breaks seen in recent years.
8. A correct exchange rate policy is finally here to stay—businesses should thus expect the Birr to reach 14 Birr/USD (but not much more) as early as July 2010 and move close to 15 Birr/USD by mid-2011. We think the current exchange rate level is finally close to what it should be, and also believe this is a policy stance that is here to stay. For the coming year, businesses should expect gradual monthly depreciations—averaging 4 cents per month according to our forecasts—plus a step devaluation of about five percent, which is roughly the gap being recorded between inflation in Ethiopia and its trading partners.
9. Foreign borrowing is ballooning and will increasingly come from private, not governmental, sources. Loans from sources such as commercial banks and suppliers credits surpassed loans from governmental sources for the first time last year and we see this as a trend that is likely to continue. The government and parastatals remain the near-exclusive beneficiaries of external loans, but we expect this to change gradually, opening up opportunities for local businesses and banks as well as for foreign providers of external finance.
10. A Shift from West to East—the “MICs” will soon become Ethiopia’s biggest economic partners. While much of the world is fixated with the rising economic power of the BRICs (Brazil, Russia, India, and China), Ethiopia’s business and economic fortunes are increasingly being tied with the “MICs” (Middle East, India, and China). According to our projections, export, import, and foreign direct investment flows between Ethiopia and the “MICs” will in all three cases exceed the comparable figures with the West within just three years.
3
7
9
13
15
19
23
S U M M A R Y
25
31
29

The Ethiopia Macroeconomic Handbook: 2010
3
Without much notice, the services sector has—for the first time in the country’s history—overtaken agriculture as the largest segment of the Ethiopian economy. This reverses a centuries-long economic structure, wherein agriculture was the dominant sector, followed in a distant second place by the services sector, and lastly a very small industrial sector. The recent release of FY 2008/09 GDP statistics, however, revealed that the service sector is now clearly at top, comprising 45.1 percent of GDP, followed by agriculture at 43.2 percent, and Industry at just 13.0 percent. The customary short-hand description of the Ethiopian economy—as being overwhelmingly agriculture-based—has thus just become obsolete.
The overtaking of agriculture by services is not some statistical blip or a one-off occurrence linked to a particularly poor crop season. Agriculture has actually been overtaken by services at a time when crop output reached a record level of 17.1 million tons. Indeed, for close observers, the trend lines have been prevalent for almost a decade: agriculture was more than 50 percent of GDP as recently as 2000/01 but started a gradual decline over the past decade, falling to about 47 percent in the middle of the decade and to a low of 43.2 percent of GDP most recently. The services share of GDP moved slowly but consistently in the other direction, moving up from just 38 percent at the start of the decade to 45 percent of GDP most recently.
KEY POINTS:The customary short-hand description of the Ethiopian economy—as being “predominantly based on agriculture”—has very recently become obsolete.
The services sector is now playing a leading role not just through its share in GDP but also in terms of its contribution to total exports.
The share of services within GDP will rise even further in the coming years, making Ethiopia’s economic structure look more and more like that of other developing countries.
The Ethiopian Economy—A historic shift is in the works1
Services Sub-Sector [Chart 1.3]
% GDP (2008/09) % Total Service (2008/09) Last five-year growth
Financial Intermediation 2.7 6.1% 23.3%
Hotels and Restaurants 3.4 7.6% 21.2%
Whole Sale and Retail Trade 13.8 30.7% 15.1%
Real Estate, Renting and Business Activities
9.1 20.2% 14.1%
Education 3.2 7.0% 13.9%
Health and Social Work 1.0 2.3% 13.1%
Public Administration and Defense 4.4 9.8% 12.1%
Transport and Communications 5.6 12.4% 10.9%
Other Community, Social & Personal Services
1.6 3.5% 8.8%
Private Households with Employed Persons
0.2 0.4% 4.6%
Service Total 45.1 100% 14.3%Source: MoFED
Economic Sectors Recent Growth Rates [Chart 1.2]
2008/09 Average Past 5 years Growth (%)
Agriculture 6.4 9.6
Industry 9.9 9.8
Services 14.0 14.3Source: Ministry of Finance and Economic Development
The Ethiopia Macroeconomic Handbook: 2010
4
The rise of services reflects several parallel trends. Most notable among these is the rise of government, much of whose activities (ranging from education, health, and public administration and defense) fall within the services sector. Also important has been the rise in “real estate, renting and related business activities,” the services sub-category that accounts for the largest part of the jump in services in recent years. Other key growth areas in services have included wholesale and retail trade (basically distributors and shopping outlets), hotels and restaurants, and banking (see Chart 1.4).1
The growing importance of services is also reflected in the sharp rise in the share of services within total exports. Although Ethiopia’s goods exports had for long exceeded the value of its service exports, this has ceased to be the case in recent years. Last year, for example, foreign exchange income earned from service providers such as Ethiopian Airlines and Ethiopian Shipping Lines as well as from varied service sub-sectors such as tourism, communication, insurance and financial services collectively reached nearly $2 billion compared to goods exports of just $1.5 billion. Despite this, the customary attention to export performance has tended to focus on commodities (such as coffee, sesame, and flowers) rather than on services. Indeed, it is noteworthy that rather than assigning coffee the pride of place as Ethiopia’s “top export,” the exporter that more accurately deserves this label is actually a fast-growing (government-owned) service sector provider, namely Ethiopian Airlines.
The rising role of services does not, of course, mean that this portion of the economy is becoming dominant across all measures of economic significance. When it comes to other important metrics—such as employment—agriculture retains its primary role and accounts for most of the country’s labor force (85 percent according to the latest estimates). However, what the higher share of services in GDP reveals is that the collective economic contribution of the large labor pool in agriculture has now fallen short of the combined value-added of a much smaller group of employees engaged in services and industry.
With respect to Industry, its role in the Ethiopian economy is notable for its near-static share over the last decade. The share of industry has been close to 13 percent (plus or minus one percentage point) for the past decade. Contrary from what would seem to be the case from the rapid period of fast growth, the share of Industry has show a consistent trend decline in the past five years, falling from 14.0 percent of GDP in FY 2003/04 to 13.0 percent of GDP in FY 2008/09. Within industry, this mainly reflects a drop in the role of small scale and cottage industries, electricity & water, and construction (each down by 3 percentage points during this period), which more than fully offset small gains seen in large and medium scale manufacturing and mining & quarrying activities (both of whose shares in GDP rose modestly).
The apparent stagnation in the industrial sector—at least as measured by its share in GDP—reflects a confluence of factors. According to the most recently Quarterly Manufacturing Industry Business Survey (Fourth Quarter 2008/09), foremost among the challenges faced by manufacturers were: shortage of water and electricity (80.5%), shortage of raw materials (5.3%), shortage of working capital (4.5%), and lack of market demand (2%). Judging by the latest quarterly capacity utilization rates, the industries with relatively better conditions included manufacturing of wood and wood products, manufacture of motor vehicles, trailers and semi-trailers, and manufacture of paper and paper products (all with rates of above 65%), and those with the most apparent difficulties were those engaged in furniture manufacturing (34%) textile manufacturing (35%), manufacture of non-metallic products (37%), and manufacture of fabricated metal products except machinery and equipments (40%). Overall, one observes that the most prominent challenges to industry include a mix of both infrastructural and macroeconomic factors. This is, in some ways, encouraging to the extent that the obstacles are either being addressed by on-going initiatives (through large-scale public investment to address infrastructural bottlenecks) or are amenable to change via policy measures that would adjust monetary and fiscal policies.
Looking forward, we forecast that the services sector will make up more than half of Ethiopian GDP in just two years time (FY 2011/12). At that juncture, services will no longer just be the economy’s single largest sector but also its majority sector making up more than 50 percent of total output. Our projections that services will exceed 50 percent of GDP in just two years time is based on this year’s low agriculture growth and the expectation—in line with recent years—that services growth will on average be roughly one-and-a-half times the growth rate of agriculture (see Section 7 for more on our growth outlook).
Growth in GDP Share of Services (FY 00/01 to FY 08/09) [Chart 1.4]
Real Estate, Renting and Business Activities 2.7
Whole Sale and Retail Trade 2.1
Hotels and Restaurants 1.3
Financial Intermediation 0.9
Education 0.8
Transport and Communications 0.6
Health and Social Work 0.1
Private Households with Employed Persons -0.1
Other Community, Social & Personal Services -0.2
Public Administration and Defense -1.1
Services Total 7.1Source: MoFED
Industry Share of GDP [Chart 1.5]
2000/01 2003/04 2008/09
Industry 8,091 10,419 16,636
GDP 66,921 74,397 127,738
Share 12.1 14.0 13.0Source: MoFED
1An important qualifier is in order regarding Ethiopia’s sector-by-sector and overall GDP data, which have long been identified as in need of various technical improvements (see most recently IMF’s “Statement at the Conclusion of a Mission to Ethiopia”, March 24, 2010.) Our review essentially takes the sector GDP data as reported on the assumption that any under- or over-reporting issues are no better or worse in one sector compared to others.
The Ethiopia Macroeconomic Handbook: 2010
5
The rise of the services sector would appear to confirm—to some observers—the view that the Ethiopian economy is being dominated by traders/middlemen who only distribute or sell goods, rather than ‘real’ businesses that actually produce industrial or agricultural commodities. Such an interpretation would be misguided, however. “Wholesale and retail traders” (or negades, to use the sometimes pejoratively used Amharic name) have to exist in any economy simply to collect, distribute, and retail the entire range of agricultural and industrial produced or imported in an economy. At around 13 percent of GDP, the share of “wholesale and retail traders” in the economy does not appear to be particularly inflated in Ethiopia (the shares for similar activities are 13 percent in Kenya and 15 percent in South Africa). In addition, what really ought to be of concern is not that such “wholesale and retail traders” are expanding (that is to be expected in a growing economy) but whether they are appropriating an unusually high share of the margins between what consumers pay and what producers earn. In this regard, while there are some obvious cases of ‘excessive rents’ being earned in some areas these are being gradually eroded in our view through a combination of new entrants, an increasingly widening base of consumer information, and stronger regulatory oversight. Moreover, where such excessive rents do exist, they could be reduced via the relaxation or removal of certain government policies, such as in the heavily regulated domestic distribution regime for some staple commodities (sugar), the quantitative import restrictions on certain raw materials (cement), and in the still regulated regime for trading foreign exchange.
With the rising role of services, Ethiopia is becoming more and more like other African and developing countries. Indeed, as of 2008, less than a handful of countries worldwide had agricultural sectors with a more than 50-percent share in GDP and Ethiopia is no longer among this sub-group. The dominance of services activity is a natural feature of countries in middle and higher income status: virtually all ‘industrial countries’ actually have economic structures dominated by the services sector rather than industry (services shares are as high as 78 percent in countries like the US and UK versus industry shares of just 20 to 23 percent). Even for developing countries, the services sector averages close to 55 percent of GDP compared to an industrial share of 45 percent; China is consistent with this pattern with a services share of 40 percent, but a somewhat unusually high industry
share of 49 percent of GDP reflecting its unique status as the world’s ‘manufacturing workshop.’ For Sub-Saharan African countries, the services to GDP ratio averages 50 percent, with several of the higher income countries within the continent showing higher ratios, such as in Kenya (62 percent) and South Africa (66 percent). (See Chart 1.7)
Projected Composition of Ethiopian GDP [Chart 1.6]
Services Industry Agriculture
FY 2008/09 GDP Share 45.1 13.0 43.2
FY 2009/10 GDP Share 48.0 13.1 40.2
FY 2010/11 GDP Share 49.6 13.2 38.6
FY 2011/12 GDP Share 50.9 13.2 37.5Source: MoFED and Access Capital Projections; figures do not add up to 100 percent due to a technical adjustment for financial intermediation services in GDP data.
GDP Composition Across Countries [Chart 1.7]
Country Services Industry Agriculture
Ethiopia 45 13 43
Nigeria 30 46 25
Kenya 62 15 22
South Africa 66 31 3
Tanzania 44 20 36
Sudan 38 33 30
SSA Average 50 30 20
Land Locked Develop-ing Countries
41 26 33
o/w African Countries Landlocked
42 26 32
East Asia & Pacific 49 41 10
South Asia 54 28 18
Developed (OECD Countries)
70 28 2
Middle East & North Africa
48 43 9
World 67 30 4Source: World Development Report, 2010 ADB-AEO and IMF WEO
Service Sector Opportunities [Chart 1.8]
Fastest Growing (past 5 years)
Largest Size (2008/09) Combination of Growth & Size
Service Sector Decomposition Rank Rank Rank
Financial Intermediation 1 7 4
Hotels and Restaurants 2 5 3
Whole Sale and Retail Trade 3 1 1
Real Estate, Renting and Business Activities
4 2 2
Education 5 6 7
Health and Social Work 6 9 9
Public Administration and Defense
7 4 6
Transport and Communications 8 3 5
Other Community, Social & Personal Services
9 8 8
Private Households with Employed Persons
10 10 10
Source: MoFED
The Ethiopia Macroeconomic Handbook: 2010
6
The rise of the services sector brings many implications and opportunities for business in Ethiopia. With a view to assessing some of the business prospects in this area, we looked at various metrics for judging growth in the next five years, including an extrapolation of recent growth trends, a comparison of both the relative size and recent growth of various sub-sectors, the new investment taking place in various sub-sectors, and the policy and regulatory environment (Chart 1.8). • Growth prospects: Based solely on an extrapolation
of recent growth to the medium term, the strongest prospects within the services sector would appear to lie in financial intermediation (banking & insurance), hotels and restaurants, real estate, renting & business activities, and whole sale and retail trade. However, this is of course assuming recent growth outturns will continue into the near future; indeed high recent growth may indicate the prospect of market saturation and an imminent decline of new opportunities. Nevertheless, our reading of the fastest growing service sub-sectors over the past five years is that there are few reasons to see a reversal of the rapid growth of these sub-sectors: financial intermediation still has much scope for growth given the considerable size of the unbanked and under-banked populated; hotels and restaurants sector growth can be sustained for many years to come given fast-rising tourism inflows and what was a very inadequate base to begin; and wholesale and retail trade will generally tend to grow at least as fast as the overall increase in nominal economic activity (or even faster as modern retailing methods become more common over time).
• Size-based prospects: Based on a combined look at the size and growth prospects, the most attractive service sub-sectors appear to lie (once again) in whole sale and retail trade, real estate, renting & business activities, hotels and restaurants and financial intermediation.One added area is transport and communication, whose growth has not been among the fastest in recent years but whose relative size in total GDP is relatively large.
• Investment-trends: Recent investment trends can also point to emerging opportunities in various sub-sectors. Our analysis in this area shows that based on investments in the past two years, real estate, renting & business activities, hotels & restaurants, education, whole sale & retail trade and transport & communications are seen by investors as the most promising service areas. Extending the time frame somewhat further back shows many of these same sub-sectors as the top choice of new investors, though with the addition of others such as health & social works and other community, social & personal service activities.
• Policy-based opportunities: With respect to policy-based prospects, we think the policy environment will become more favorable for sectors such as hotels and restaurants, transport, banking, private education and private health care. On the other hand, we think the policy environment may become more challenging for those engaged in real estate (tightening rules on usage of leased land) and whole sale and retail trade (in line with growing regulatory oversight and consumer rights groups).
The Ethiopia Macroeconomic Handbook: 2010
7
Several government initiatives observed in the past year seem to be heralding a growing momentum towards economic policy reform. Most notable among these are:
• The recent pick-up of privatization: After many years of relative inactivity, the Ethiopian Privatization Agency has recently stepped up its sale of public-owned industries, hotels, and other properties. In the past three years alone, 31 public enterprises have been put up for sale, the proceeds of which were roughly triple the average norm seen in the previous four years of privatizations registered from FY 2000 -2003 (indicating a progressive rise in the size of privatized public enterprises). Recent enterprises put up for sale include some large entities such as the Ethiopia Hotels Enterprise, National Tour Operations (NTO), Dire Dawa Textile Factory, Addis Ababa Bottle and Glass Share Company, Addis Ababa Foam and Plastic Factory, Nefas Silk Paints Factory, and Kality Food Share Company (See Chart 2.1 below). Some 12 enterprises, including most notably the Agricultural Mechanization and Technical Service Share Company (171 million birr offered so far) and the Dire Dawa Food Complex Share Company (offered bid close to 112 million Birr) are in the pipeline for sale following bids put recently.
• Reforms (albeit very partial) in the telecom industry: Rather unexpectedly, the Ethiopian Telecommunications Corporation, one of the giants of Ethiopia’s many state-owned companies recently took the initiative of foreign management of its operations. According to several press reports, France Telecom will take part in the management of the ETC, promising to bring improved services, quality, and technologies in the coming years. As part of the deal, France Telecom will reportedly reform the Ethiopian company’s core operations, including service provision and infrastructural maintenance, and will seek to raise revenues by creating new markets.
While this is a far cry from a full opening up of the sector, and still does nothing to get rid of a monopolistic position occupied by the ETC (in contrast to the norm in virtually every other African country), this tentative step towards an opening of the sector is welcome. It might even be a first step in a process of eventually dismantling a state-controlled telecommunications system if it follows a common liberalization approach of first transferring management to a foreign entity, then allowing some partial equity ownership, then allowing new companies to join the field as entrants in specialized areas, and finally selling the state’s stakes in what would be one of many players in the sector.
• The openness to introduce modern markets: The launch of the Ethiopian Commodity Exchange in 2007 marked an openness to allow agricultural commodities to be traded in a system where certified buyers and sellers complete their transactions in a centralized and organized market. Since its inception, the Ethiopian Commodity Exchange (ECX) has progressively developed and strengthened its trading systems to improve logistical capacity, to enhance information exchange, to address niche markets (the Direct Specialty Trade platform), and to expand the number of market participants. With the launch and acceptance of a modern, organized market for one set of goods (i.e. coffee or sesame), there is in principle no reason why such an organized market should be prohibited for another type of commodity (i.e., company shares). The opening of the ECX may thus be seen as a stepping stone to the eventual opening of modern, organized markets for company shares (a stock market) as well as for company debt (a bond market).
• Laying the ground-work for capital markets: Within
the past year, extensive (donor-supported) technical studies and preparations have been underway to consider the establishment of a capital market in
KEY POINTS:
Policy changes have accelerated recently in a number of important economic policy spheres.
We forecast that this trend towards greater reform will gain further momentum in the near future; the preoccupation of policymakers in the past two years has been macroeconomic fire-fighting (inflation control, building reserves, and responding to the global crisis) but greater attention to the key structural obstacles facing the Ethiopian economy is now possible and likely.
Despite the growing momentum for reform, there remain many areas where policy reform is still—in our view—far too gradual and far too controlled.
Economic policies are set to be relaxed. 2
A Faster Pace of Privatization [Chart 2.1]
Year No. of privatizations Sale Price (in millions of Birr)
FY 2009/10* 17* 1,100
o/w sold 5 323
o/w pending 12 777
FY 2008/09 7 252
FY 2007/08 12 544
FY 2006/07 12 270
Average per year (2007-2009) 10 355
Average per year (2000-2003) 8 110*Actual sales prices for 5 of 17 enterprises have been disclosed at a total birr of 323 million. Access Capital extrapolation of the expected sales prices for the other 12 enterprises is birr 777 million.Source: The Privatization and Public Enterprises Supervising Agency and World Bank
The Ethiopia Macroeconomic Handbook: 2010
8
Ethiopia. Most notably, recent World Bank supported work on ‘Capital Market Infrastructure Development’ in collaboration with the NBE, is developing strategies and action plans for the development of the government and corporate Bond Markets. If and when fully pursued, the initiatives in this area could see the development of an active capital market in which the government, state enterprises and private businesses are able to fulfill at least part of their funding needs by selling bonds directly to interested buyers (individuals, banks, and insurance companies). The initial start of such a market is likely to be by debt issuance for state-owned companies and regions/municipalities; indeed, recent press reports and official pronouncements indicate that some public enterprises will soon start offering bonds (of as much as Birr 100 million) with yields above the minimum deposit rate, while some 20 towns across the country are reportedly building their capacity to issue bonds, as is already done by the Addis Ababa City Administration. Once established for parastatals as well as regions and municipalities, the extension of such bond issuance by private companies is inevitable.
• Passive acceptable of an active private share issuance market: Over 20 prospective companies—in sectors as varied as beer, cement, transportation, education, and agribusiness—are currently in the process of making public share offers as a means of starting their operations. This recent wave of share offers has been met with passive acceptance by policymakers, which is actually welcome to the extent that there have not been obstacles placed on the fund-raising of potentially novel and dynamic businesses. However, this laissez-faire policy is likely to change shortly according to emerging statements from policy circles. What will follow, in our view, is not any effort to eliminate such share issuances but rather an effort to establish basic standards and codes (including regulatory oversight) to accompany the development of this type of financing. This will be a positive development for all involved and will serve to protect both the investors as well as the start-up companies.
• A rebalancing of the policy focus from peasant to commercial agriculture: From a near-exclusive focus on the large peasant agricultural sector, the government has in just the past year adopted a policy framework to accord high priority to the development of commercial farming (see Section 3 for more details). This is a marked policy shift and appears to show a recognition that some of the biggest improvements urgently needed in agriculture (a rise in yields, increased fertilizer use, modern farming methods, and large-scale irrigation) can take place much faster within a system that is open to and supplemented by large-scale commercial farms. Peasant agriculture is not, of course, neglected under such a policy re-orientation, but the more balanced approach will give much greater space for a major expansion in commercial farming.
• A renewed policy drive to revive the industrial sector: As is the case in the area of capital market development, technical and academic studies have been underway within the past year to re-design industrial policy and (in so doing) to help revitalize Ethiopian industry. This analytical work and policy re-orientation will broaden the government’s focus from one that is at present heavily centered around target-setting for exporters (see Section 4).
• A relaxation of administrative measures on land leases. The City Administration of Addis Ababa (site of the largest concentration of investments in the country) has recently issued successive directives aimed at streamlining the process of land allocation, widely seen as one of the most significant constraints to investment.
The latest reforms include the following:
• Use of negotiations—rather than just auctions—in the allocation of land leases: The use of negotiations are to be restarted according to a recent directive, which will allow investors in selected sectors to engage in direct discussions with the City for given plots of land and receive leases that will not exceed more than 4,500 Br per square meter. The qualifying sectors are expected to be those that are export-oriented, substitute imports, add value, are labor intensive, and involve technology transfers. Land in industry zones will be given through negotiation only if the investment falls within government priority areas. Other activities that could be given land through negotiation are universities, institutions that provide new types of training, higher hospitals, health research institutions, and those that employ new technologies. Four-star hotels, developers that wish to redevelop an existing holding and real estate firms/industries that wish to construct on reconstruction sites will also be allowed to negotiate.
• Foreign investor participation in land-lease negotiations will be permitted according to the new directive. Many of the same criteria applicable for domestic investors will apply. Foreign investors seeking negotiated land lease allocations will be expected to present bank documents indicating that they have deposited at least half of their investment capital before signing for their alloted plots.
• Land Tenure Directive: A six-month-old restriction that prohibited the transfer of land before 100 percent of the construction was completed has been lifted in February 2010. This now allows the transfer of plots with unfinished construction and also enables builders to receive building plans for plots they already have so they can sell or exchange them.
Will such policy reforms intensify? We believe so, because while the preoccupation of policymakers in the past two years has been macroeconomic fire-fighting (inflation control, building reserves, and responding to the global economic crisis), greater attention is now likely to be placed on important structural obstacles facing the Ethiopian economy. In particular, at the start of 2010 inflation is no longer a serious macroeconomic issue, reserves have been rebuilt to more comfortable levels, and the global economic crisis is gradually receding. Much more so than before, economic policymakers’ attention can (and will, in our view) shift towards longer-term structural challenges to Ethiopia’s growth. And foremost among these, we think, is work on expanding access to finance, on re-orienting the role of the state towards what is more appropriate for a market economy, and on rebalancing the economic policy focus in two critical ways: (i) away from agriculture and towards the services and industrial sectors; and (ii) within agriculture, a move away from a near-exclusive focus on peasant agriculture towards an appreciation of the role of commercial agriculture.
Not all policy areas are, of course, likely to see a policy relaxation. In the telecom sector, despite the openness to external management, the prospect of allowing foreign entrants is not likely in the near-term, even in particular sub-sectors such cellular or data services. Similarly, in areas such as banking, Ethiopia will continue to stand out for being one of the few countries worldwide that restrict foreign participation, even via minority equity shares in existing local banks. Also conspicuous within the financial sector will be a heavily state-dominated structure wherein state banks continue to enjoy special benefits, the most egregious of which is the monopoly to finance all of Ethiopia’s export trade with China (now the largest market for Ethiopian exports).
The Ethiopia Macroeconomic Handbook: 2010
9
Multiple policy initiatives are laying the ground for a take-off in commercial agriculture. The need to encourage the commercialization of agriculture has long been noted in the authorities policy documents, including the first Ethiopian PASDEP (2005-2010). In practice, though, the focus of policy attention with-in agriculture has until very recently still largely revolved around the promotion of peasant-based agriculture, including efforts such as the expansion of rural roads and farm extension delivery.
Since early 2009, however, the commitment to commercial agriculture has increasingly translated into concrete actions and initiatives. Most notable among these are the following developments.
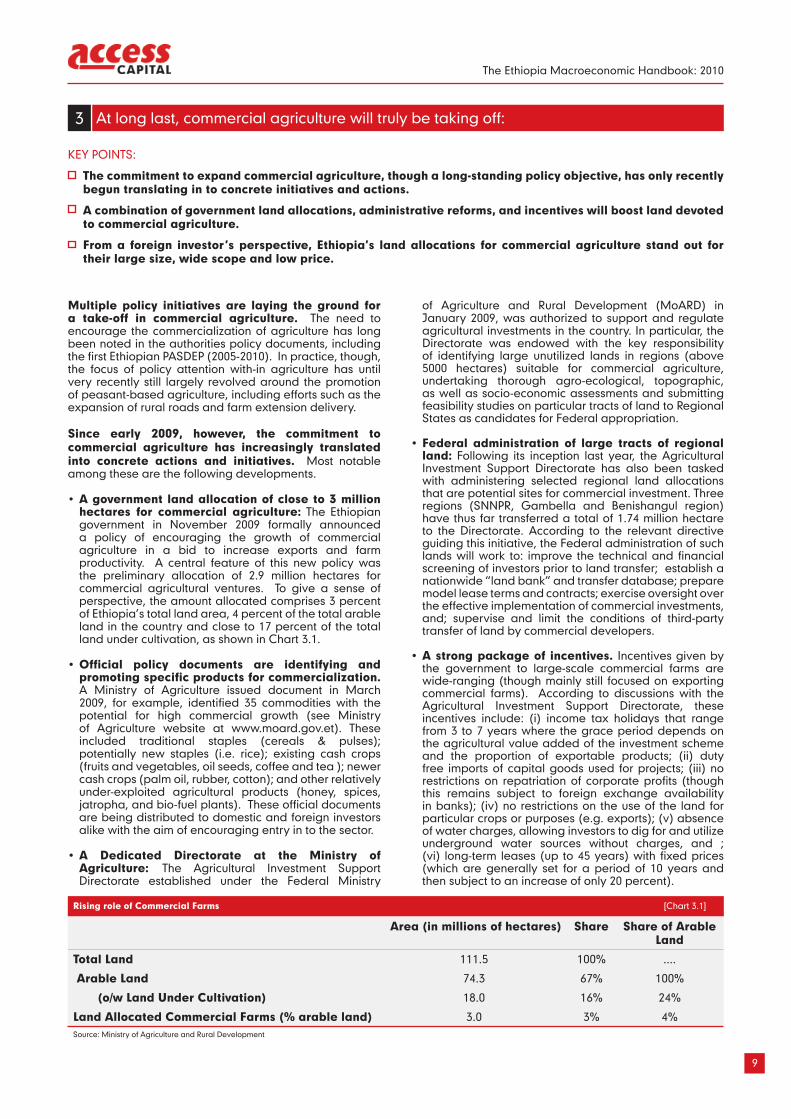
• A government land allocation of close to 3 million hectares for commercial agriculture: The Ethiopian government in November 2009 formally announced a policy of encouraging the growth of commercial agriculture in a bid to increase exports and farm productivity. A central feature of this new policy was the preliminary allocation of 2.9 million hectares for commercial agricultural ventures. To give a sense of perspective, the amount allocated comprises 3 percent of Ethiopia’s total land area, 4 percent of the total arable land in the country and close to 17 percent of the total land under cultivation, as shown in Chart 3.1.
• Official policy documents are identifying and promoting specific products for commercialization. A Ministry of Agriculture issued document in March 2009, for example, identified 35 commodities with the potential for high commercial growth (see Ministry of Agriculture website at www.moard.gov.et). These included traditional staples (cereals & pulses); potentially new staples (i.e. rice); existing cash crops (fruits and vegetables, oil seeds, coffee and tea ); newer cash crops (palm oil, rubber, cotton); and other relatively under-exploited agricultural products (honey, spices, jatropha, and bio-fuel plants). These official documents are being distributed to domestic and foreign investors alike with the aim of encouraging entry in to the sector.
• A Dedicated Directorate at the Ministry of Agriculture: The Agricultural Investment Support Directorate established under the Federal Ministry
of Agriculture and Rural Development (MoARD) in January 2009, was authorized to support and regulate agricultural investments in the country. In particular, the Directorate was endowed with the key responsibility of identifying large unutilized lands in regions (above 5000 hectares) suitable for commercial agriculture, undertaking thorough agro-ecological, topographic, as well as socio-economic assessments and submitting feasibility studies on particular tracts of land to Regional States as candidates for Federal appropriation.
• Federal administration of large tracts of regional land: Following its inception last year, the Agricultural Investment Support Directorate has also been tasked with administering selected regional land allocations that are potential sites for commercial investment. Three regions (SNNPR, Gambella and Benishangul region) have thus far transferred a total of 1.74 million hectare to the Directorate. According to the relevant directive guiding this initiative, the Federal administration of such lands will work to: improve the technical and financial screening of investors prior to land transfer; establish a nationwide “land bank” and transfer database; prepare model lease terms and contracts; exercise oversight over the effective implementation of commercial investments, and; supervise and limit the conditions of third-party transfer of land by commercial developers.
• A strong package of incentives. Incentives given by the government to large-scale commercial farms are wide-ranging (though mainly still focused on exporting commercial farms). According to discussions with the Agricultural Investment Support Directorate, these incentives include: (i) income tax holidays that range from 3 to 7 years where the grace period depends on the agricultural value added of the investment scheme and the proportion of exportable products; (ii) duty free imports of capital goods used for projects; (iii) no restrictions on repatriation of corporate profits (though this remains subject to foreign exchange availability in banks); (iv) no restrictions on the use of the land for particular crops or purposes (e.g. exports); (v) absence of water charges, allowing investors to dig for and utilize underground water sources without charges, and ; (vi) long-term leases (up to 45 years) with fixed prices (which are generally set for a period of 10 years and then subject to an increase of only 20 percent).
KEY POINTS:
The commitment to expand commercial agriculture, though a long-standing policy objective, has only recently begun translating in to concrete initiatives and actions.
A combination of government land allocations, administrative reforms, and incentives will boost land devoted to commercial agriculture.
From a foreign investor’s perspective, Ethiopia’s land allocations for commercial agriculture stand out for their large size, wide scope and low price.
At long last, commercial agriculture will truly be taking off:3
Rising role of Commercial Farms [Chart 3.1]
Area (in millions of hectares) Share Share of Arable Land
Total Land 111.5 100% ....
Arable Land 74.3 67% 100%
(o/w Land Under Cultivation) 18.0 16% 24%
Land Allocated Commercial Farms (% arable land) 3.0 3% 4%Source: Ministry of Agriculture and Rural Development
The Ethiopia Macroeconomic Handbook: 2010
10
The new attention to commercial agriculture was long overdue—and marks a promising opportunity to see revolutionary improvements in yields, fertilizer use, irrigation, and farming methods. Yields at commercial farms are traditionally two to three times those of traditional, peasant farming methods, implying improvements in agriculture performance that may match those seen during the Asian Green Revolution. For example, if the recent lands allocated to commercial farms show yields that are double those of traditional farmers, then agricultural outputs in five years time will be about 15 percent higher than what it would be otherwise. This may be a conservative projection to the extent that some of the most successful commercial farms in other African countries, such as in Kenya and South Africa, have yields that are three times those of conventional peasant farms (in which case total agricultural output will be about 30 percent higher than would be otherwise).
On the basis of different information sources, some indication of the size and scope of land allocations for commercial farms can be seen from the following:
• Ethiopian Investment Authority data show approximately 1,100 foreign agricultural investors have registered since 2005, though only around 6 percent (64 in number) are reported to be operational so far. Within this group, foreign agricultural investments that are above 5,000 hectares amounted to a total of 72 investment projects, requesting a total land allocation of 2.9 million hectares and registering a total capital of Birr 36.5 billion.
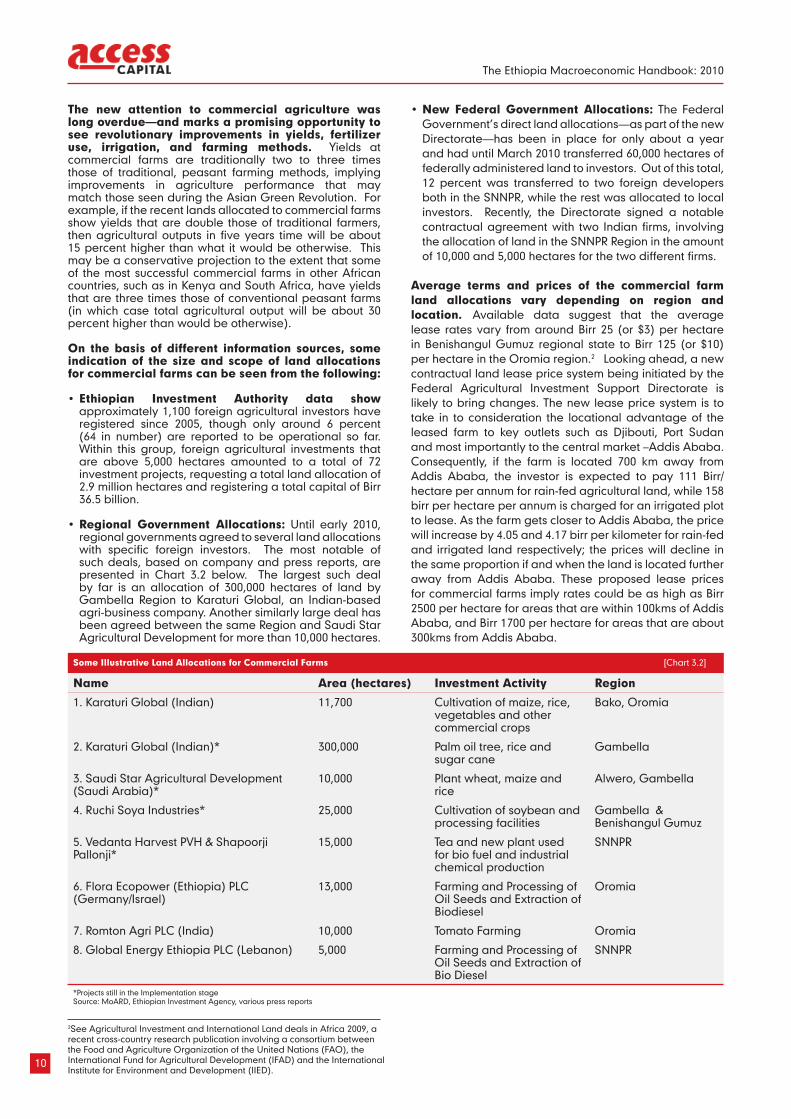
• Regional Government Allocations: Until early 2010, regional governments agreed to several land allocations with specific foreign investors. The most notable of such deals, based on company and press reports, are presented in Chart 3.2 below. The largest such deal by far is an allocation of 300,000 hectares of land by Gambella Region to Karaturi Global, an Indian-based agri-business company. Another similarly large deal has been agreed between the same Region and Saudi Star Agricultural Development for more than 10,000 hectares.
• New Federal Government Allocations: The Federal Government’s direct land allocations—as part of the new Directorate—has been in place for only about a year and had until March 2010 transferred 60,000 hectares of federally administered land to investors. Out of this total, 12 percent was transferred to two foreign developers both in the SNNPR, while the rest was allocated to local investors. Recently, the Directorate signed a notable contractual agreement with two Indian firms, involving the allocation of land in the SNNPR Region in the amount of 10,000 and 5,000 hectares for the two different firms.
Average terms and prices of the commercial farm land allocations vary depending on region and location. Available data suggest that the average lease rates vary from around Birr 25 (or $3) per hectare in Benishangul Gumuz regional state to Birr 125 (or $10) per hectare in the Oromia region.2 Looking ahead, a new contractual land lease price system being initiated by the Federal Agricultural Investment Support Directorate is likely to bring changes. The new lease price system is to take in to consideration the locational advantage of the leased farm to key outlets such as Djibouti, Port Sudan and most importantly to the central market –Addis Ababa. Consequently, if the farm is located 700 km away from Addis Ababa, the investor is expected to pay 111 Birr/hectare per annum for rain-fed agricultural land, while 158 birr per hectare per annum is charged for an irrigated plot to lease. As the farm gets closer to Addis Ababa, the price will increase by 4.05 and 4.17 birr per kilometer for rain-fed and irrigated land respectively; the prices will decline in the same proportion if and when the land is located further away from Addis Ababa. These proposed lease prices for commercial farms imply rates could be as high as Birr 2500 per hectare for areas that are within 100kms of Addis Ababa, and Birr 1700 per hectare for areas that are about 300kms from Addis Ababa.
2See Agricultural Investment and International Land deals in Africa 2009, a recent cross-country research publication involving a consortium between the Food and Agriculture Organization of the United Nations (FAO), the International Fund for Agricultural Development (IFAD) and the International Institute for Environment and Development (IIED).
Some Illustrative Land Allocations for Commercial Farms [Chart 3.2]
Name Area (hectares) Investment Activity Region
1. Karaturi Global (Indian) 11,700 Cultivation of maize, rice, vegetables and other commercial crops
Bako, Oromia
2. Karaturi Global (Indian)* 300,000 Palm oil tree, rice and sugar cane
Gambella
3. Saudi Star Agricultural Development (Saudi Arabia)*
10,000 Plant wheat, maize and rice
Alwero, Gambella
4. Ruchi Soya Industries* 25,000 Cultivation of soybean and processing facilities
Gambella & Benishangul Gumuz
5. Vedanta Harvest PVH & Shapoorji Pallonji*
15,000 Tea and new plant used for bio fuel and industrial chemical production
SNNPR
6. Flora Ecopower (Ethiopia) PLC (Germany/Israel)
13,000 Farming and Processing of Oil Seeds and Extraction of Biodiesel
Oromia
7. Romton Agri PLC (India) 10,000 Tomato Farming Oromia
8. Global Energy Ethiopia PLC (Lebanon) 5,000 Farming and Processing of Oil Seeds and Extraction of Bio Diesel
SNNPR
*Projects still in the Implementation stageSource: MoARD, Ethiopian Investment Agency, various press reports
The Ethiopia Macroeconomic Handbook: 2010
11
The allocation of large tracts of land for commercial agriculture parallels similar initiatives by other African countries following the surge in global food prices in 2008; Ethiopia’s approach when compared to those of other African countries is notable in several respects:
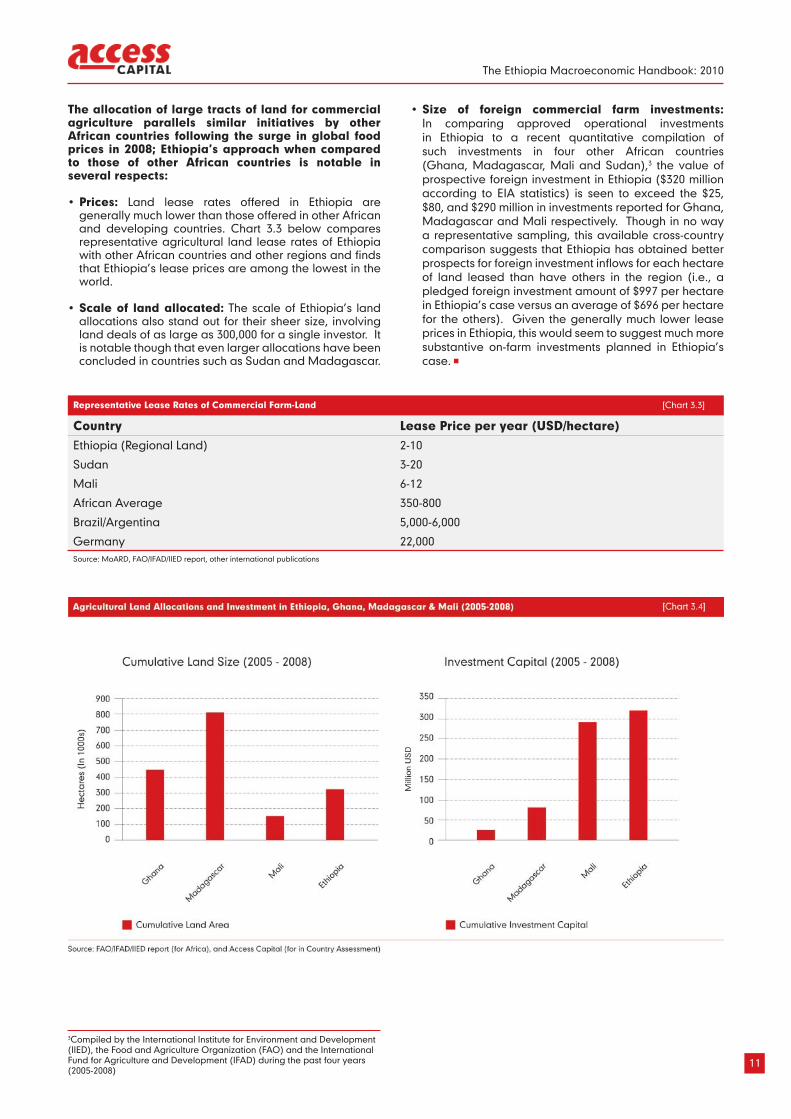
• Prices: Land lease rates offered in Ethiopia are generally much lower than those offered in other African and developing countries. Chart 3.3 below compares representative agricultural land lease rates of Ethiopia with other African countries and other regions and finds that Ethiopia’s lease prices are among the lowest in the world.
• Scale of land allocated: The scale of Ethiopia’s land allocations also stand out for their sheer size, involving land deals of as large as 300,000 for a single investor. It is notable though that even larger allocations have been concluded in countries such as Sudan and Madagascar.
• Size of foreign commercial farm investments: In comparing approved operational investments in Ethiopia to a recent quantitative compilation of such investments in four other African countries (Ghana, Madagascar, Mali and Sudan),3 the value of prospective foreign investment in Ethiopia ($320 million according to EIA statistics) is seen to exceed the $25, $80, and $290 million in investments reported for Ghana, Madagascar and Mali respectively. Though in no way a representative sampling, this available cross-country comparison suggests that Ethiopia has obtained better prospects for foreign investment inflows for each hectare of land leased than have others in the region (i.e., a pledged foreign investment amount of $997 per hectare in Ethiopia’s case versus an average of $696 per hectare for the others). Given the generally much lower lease prices in Ethiopia, this would seem to suggest much more substantive on-farm investments planned in Ethiopia’s case.
3Compiled by the International Institute for Environment and Development (IIED), the Food and Agriculture Organization (FAO) and the International Fund for Agriculture and Development (IFAD) during the past four years (2005-2008)
Representative Lease Rates of Commercial Farm-Land [Chart 3.3]
Country Lease Price per year (USD/hectare)Ethiopia (Regional Land) 2-10
Sudan 3-20
Mali 6-12
African Average 350-800
Brazil/Argentina 5,000-6,000
Germany 22,000Source: MoARD, FAO/IFAD/IIED report, other international publications

The Ethiopia Macroeconomic Handbook: 2010
13
KEY POINTS:
The relatively narrow approach of providing incentives mainly to businesses engaged in exports will be revamped in the coming years to include import-substituting industries.
A recasting of the country’s industrial policy will also be part of the reform in the country’s incentives schemes.
The biggest beneficiaries of these changes will be producers of goods that are imported in large quantities and businesses starting novel industrial ventures with large growth potential.
Special incentives to businesses will no longer target only exporters4
Tax and investment incentives for businesses in Ethiopia have so far concentrated on exporters, but this relatively narrow approach will be changing significantly in the coming years. In an effort to encourage the growth of exports, government policies have in recent years provided special privileges to this sub-sector, including: full exemption from duties and taxes on imported inputs; exemption from sales excise taxes; income tax holidays ranging from 2 to 7 years; and generous carry-forward provisions for losses. While exporters were clearly beneficiaries, an obvious omission from such incentives packages have been businesses and industries engaged in producing goods that displace imports and thus help the country’s balance of payments in exactly the same way as does an exporter. This has now been recognized clearly by policymakers and a policy to redress this imbalance is now in the works.
The reconsideration of the country’s incentive schemes is taking place as part of a broader revisiting of the country’s “industrial policy”. To this end, several academics, international organizations and bilateral agencies have been involved in offering inputs and advice on different elements of how a modified ‘industrial policy’ might work. Our discussions with some these individuals and groups points to some common themes and suggestions on the ways to recast the country’s industrial and incentives policies, including the need to: broaden the incentive scheme away from exporters alone; focus on innovation and new products; improve policy capability to avoid identified technical and market risks in advance, and; initiate the construction of industrial zones as well as growth corridors as part of an overall development strategy which encompasses agriculture, agro-processing, water management, tourism, and related manufacturing and services.4
An important element of the reconsideration of the government’s incentive schemes is likely to focus on import-substituting industries. Indeed, the intention to offer a package of incentives to ‘import-substituting’ industries has been publicly announced by senior MoTI officials at public venues in recent months. Based on information obtained from knowledgeable experts in this area, the rough outlines of the planned incentives appear to include the following:
• Tax exemptions on imports of raw materials and inputs.• Subsidies targeted to secure markets and state-led
procurement of products for selected industries (for example the advance purchase of essential drugs by Pharmaceutical Funding Agency from domestic pharmaceutical industries).
• Enforcement of quota systems against similar imports in the domestic market for prioritized import substitutes.
• Development of technical and institutional support in the form of business development capacity, public-private partnership dialogue, and promotion of targeted small and medium scale enterprises (SMEs).
The biggest beneficiaries of any incentive schemes for ‘import-substituting’ industries will be businesses involved in the production of Ethiopia’s largest non-oil imports.5 In a concerted effort to clearly state the new and continuing priority sectors for the next five years, the trade and industry chapter of the upcoming PASDEP II is expected to include a number of import substitution industries which have high domestic demand (and therefore high impact on reducing balance of payments pressures) and whose technologies are relatively easy to learn. On this basis, recent advisory documents in this area have suggested that the government target the following industries: textile and garments; leather and leather products; agro-processing; steel and metal processing, cement, glass, chemicals (consumer soap & detergents) and pharmaceuticals (particularly ‘popular medicines’).6
In addition, business starting novel industrial ventures with large growth potential will be obvious beneficiaries of a government strategy to encourage ‘smart industrial policy’. In this context, a representative initiative in this area is the passenger car assembly operation pioneered in Ethiopia by Holland Car, which entered a sector with high demand growth, large import volumes, and high entry barriers (customs and excise duties on cars) that all work to the benefit of a local producer. Many other industrial ventures, as we see it, can take advantage of precisely the same set of factors that favor car assembly operations in Ethiopia (namely high domestic demand, large imports, and very protective tariff/excise barriers). These include, for example: the production or assembly of other transport equipments and vehicles (bikes, scooters, three-wheelers, trailers and semi-trailers); the production or assembly of basic household and office equipment; the assembly or manufacture of common household goods (refrigerators, ovens, stoves); basic metals and engineering industries (i.e. production of primary metal products from ore; manufacture of cutlery, hand tools and metal reservoirs and containers); and the production of fertilizer, one of Ethiopia’s largest imports despite the large local presence of key raw materials such as potash.
4 One representative and publicly available study in this area is, “Cross-Cutting Issues in Industrialization: In the Context of Broadening the Policy Scope in Ethiopia”, GRIPS Policy Dialogue between Japan and Ethiopia, September 2009
5For very large-scale investors, the establishment of industries that can displace oil imports also represents a promising area, such as the production of sugarcane-based ethanol or other plant-based oils; the former has already begun in Ethiopia on a moderate scale by state owned sugar companies.
6See “Industrial Policy Direction of Ethiopia: Suggestions for the Next Five Years, GRIPS Development Forum,” November 2009. The first three of these sectors were already targeted under the government’s PASDEP economic program.

The Ethiopia Macroeconomic Handbook: 2010
15
Overall inflation has shown a dramatic decline in recent months, much faster than both we and others (such as the IMF) have anticipated. At end February 2010, inflation measured on a year over year basis (namely February 2010 versus February 2009) amounted to only 8.1 percent. The inflation reading is even lower at just 5.0 percent on a different metric which compares the price level in the last 12 months to that in the previous 12 months. This measure of inflation has not been so low for more than 4½ years. Month-on-month inflation trends have also been very favorable recently, with the average month-on-month inflation reading at just 0.5 percent during the past six months—a rate which translates into inflation of around 6 percent on an annualized basis (Chart 5.1).
The inflation reduction largely reflects a sharp fall in prices for food, which are up only 1.3 percent on a year-on-year basis and have been essentially flat in the eight months since the start of the fiscal year in July 2009 (see Chart 5.2). Nearly all food sub-categories are showing close to zero inflation for the past year, including most notably for cereals, spices and bread (and other prepared foods). The subdued price pressures for food items are in marked contrast to the high inflation levels still being registered for non-food prices: such items showed year-on-year increases of near 20 percent in February 2010 and are exhibiting month-on-month increases of around 1.5 percent in recent months, equivalent to a annualized rate of almost 20 percent if this continues at this pace for the year ahead.
KEY POINTS:
Inflation has fallen much faster than expected, thanks to the behavior of food prices.
Ethiopia’s inflation rate is now near the norm seen in other African and developing countries.
Monetary policy is far too tight in our view given both the inflation record of the past year as well the outlook for the period ahead.
Though inflation has declined sharply, monetary policy will remain unduly tight in our view for at least another few months. 5
Consumer Price Index-General [Chart 5.1]
Month Price Index Month-on-Month Inflation Year-on-Year Inflation Year-Average Inflation
Jun-09 171.2 1.4 2.7 36.4
Jul-09 173.3 1.2 -3.7 30.0
Aug-09 175.1 1.0 -3.9 24.1
Sep-09 176.6 0.9 -4.1 18.7
Oct-09 175.3 -0.7 -3.7 14.1
Nov-09 176.1 0.5 0.6 10.6
Dec-09 176.7 0.3 7.1 8.5
Jan-10 178.2 0.8 7.6 6.6
Feb-10 180.6 1.3 8.1 5.0
Mar-10 182.5 1.0 9.1 4.1
Apr-10 184.4 1.1 9.0 3.3
May-10 185.3 0.5 9.8 3.0
Jun-10 187.9 1.4 9.8 3.6
Jul-10 190.2 1.2 9.8 4.7
Aug-10 192.1 1.0 9.7 5.9
Sep-10 193.1 0.5 9.3 7.1
Oct-10 191.5 -0.9 9.2 8.2
Nov-10 189.6 -1.0 7.6 8.9
Dec-10 186.9 -1.4 5.8 8.7Source: CSA for historical data; Access Capital projections in bold
Food Vs. Non-Food Inflation [Chart 5.2]
Food Non-Food Overall
Feb 2010 year-on-year inflation 1.34 19.82 8.08
Inflation since start of fiscal year (July 2009) 0.0 14.8 5.5
Past Six months Average month-on-month inflation -0.15 1.56 0.52
Annualized rate of average of past Six month -on-month inflation -1.84 18.77 6.22Source: CSA
The Ethiopia Macroeconomic Handbook: 2010
16
Notable in the recent pattern of non-food inflation are the price spikes that appear to coincide closely with the timing of the Birr depreciation, for example in February 2009 and in July 2009. Still, even with these high non-food price increases, the dominance of food products in the average consumption basket of Ethiopia’s consumers will keep inflation restrained as long as the food component does not jump sharply in the coming months.
The recent moderation in price increases brings Ethiopia’s inflation rate much closer to the African average, in contrast to conditions about a year ago when inflation in Ethiopia was more than triple the African norm. Sub-Saharan Africa’s year-average inflation is near 7.2 percent for 2010, according to the IMF, which is actually above the similar inflation measure of just 5.1 percent recently recorded in Ethiopia. Moreover, Ethiopia’s inflation rate has now fallen to levels that are near identical to that of “emerging and developing countries” (as defined by the IMF), where the inflation rate is now at around 6.2 percent according to the IMF’s latest update of the World Economic Outlook. The exceptionally high inflation record that Ethiopia had been showing in 2008-09 is thus now clearly a thing of the past though monetary policy (see below) has been slow to adjust to this markedly different set of domestic price conditions (see Chart 5.3).
The much better inflation figures being reported in recent months are surprising to many public observers, who view them as being implausibly low, but this is simply because inflation is—by definition—a measure of the change in average price levels compared to a year ago. As prices had risen to unusually high levels last year, any comparison of current prices to those of twelve months ago shows very little additional price increases. However, perhaps what is most acutely felt by consumers and the public at large is that prices are substantially
higher than two or even three years ago, and indeed by that metric overall prices are up 44 percent over two years, while food prices in particular are up by nearly 70 percent over the past three years.
Looking ahead, the outlook for inflation is quite positive, based on a number of approaches. Extrapolating from the latest month-on-month inflation figures (0.5 percent on average for the past six months) suggests that inflation will be roughly around 6 percent on an annual basis. From another perspective, for inflation to remain in single-digits by June 2010, month-on-month inflation can be as high as 1.02 percent for each of the next four months. We think monthly inflation will be close to, but somewhat below, this month-on-month rate allowing for inflation to remain just below 10 percent by June 2010 (the seasonality of Ethiopia’s inflation, driven largely by the crop cycle, is such that month-on-month inflation readings average 1 percent during January-June, compared to just 0.1 percent in the July-December period). For December 2010, we project a deceleration in month-on-month inflation to its normal seasonal pattern (assuming a normal crop season) and project a moderation in inflation to about 6 percent on year-on-year basis.
Although the outlook for inflation is quite favorable, and has been so for quite some time, policy-makers’ views on inflation appear to have swung from a period of benign neglect (2007/08) to what now appears to be an unusually strong anti-inflationary stance. In particular, the start of this fiscal year (July 2009) saw the imposition of unusually tight credit policies by the central bank, justified by the need to reduce inflation. However, from our perspective, the need for imposing very restrictive credit ceilings at that time was not at all apparent: inflation by July 2009 was on a firmly downward trend, havng declined for twelve months in a row, and already collapsed to a level of just 3 percent from a peak of 66 percent a year earlier. Moreover, once the new fiscal year started in July 2009, year-on-year inflation subsequently turned negative for the next four consecutive months but even this turn of events had no impact on the central bank’s credit stance, which remained in place as originally designed. Only in February 2010, eight months after the start of the fiscal year and 21 months after inflation had peaked, did the central bank allow for a modest relaxation of the credit ceilings—a monetary policy reaction that was, in our view, far too slow to adopt to changing economic conditions. The cost of such a delayed policy reaction has been a continued decline in the ratio of private sector credit-to-GDP, which (already low to begin with) is now down to a five-year low—a notably disappointing record against the broadly positive macroeconomic trends otherwise observed in Ethiopia (See Chart 5.4)
The Ethiopia Macroeconomic Handbook: 2010
17
Will monetary policy be relaxed soon? Not until the end of the fiscal year (June 2010) in our view. We think that the tight credit policy imposed on private banks will remain to the end of the fiscal year, largely because the government remains keen to meet the monetary target under its FY2009/10 economic program (as supported by the IMF). Accordingly, while targets are likely to be relaxed next year the outlook till the remainder of this fiscal year is still for a tight monetary stance.

The Ethiopia Macroeconomic Handbook: 2010
19
After years of lending to their clients without any restrictions, Ethiopia’s private banks got a rude awakening in 2009 following central bank instructions to lend only on the basis of strict quotas given to each bank. Based on information from several bank officials and industry sources, we find that each private bank was allowed to provide on average around Birr 290 million in extra loans for the FY 2009/10 fiscal year. The extra amount of lending allowed for each bank appears to vary from a minimum of Birr 130 million to a maximum of Birr 630 million. The setting of the lending cap was particularly restrictive as banks were instructed not to exceed their ceiling on any single day during the fiscal year.7 Relative to their stock of loans at end June 2009, about 17 percent extra lending growth appears to have been allowed for all private banks as a whole. Not by coincidence, this rate of growth is nearly identical to the monetary growth target that has been set in the IMF program for FY 2009-10.8
In our view, the central bank’s chosen instrument of controlling credit via bank-by-bank credit ceilings is inappropriate even if one agreed on the need for a sharp cut in credit growth: bank credit caps can involve arbitrary allocations, can discourage competition among banks, and can prevent the development of market-based systems of monetary management. Various criteria can in principle be used to allocate the distribution of credit among banks, but it is not clear what metric is particularly better suited than another. Thus, depending on the criteria used (say deposits, assets, pre-existing loan stocks, etc.), some banks can receive arbitrarily higher or lower allocations than their peers (the specific criteria used has not been transparently disclosed). Moreover, the use of such ceilings has the effect of freezing market shares at their pre-existing levels and thus works against the normal movement of borrowers among banks for better service, lower prices, or other reasons. Such reduced competition is to the detriment of depositors and borrowers. Finally, from a monetary management perspective, the use of credit caps on banks is a very outdated tool that has been abandoned in all countries with modern monetary policy regimes. Indeed this approach is a relic of the 1970s and
1980s, and central banks nowadays rely on tools such as reserve requirements and the use of government or central bank bills to reduce/increase money supply circulating within the economy. In this regard, a review of the IMF’s classification of monetary management regimes shows that, as of 2009, virtually no African country had resorted to “direct credit allocations”—the approach adopted in Ethiopia this fiscal year.
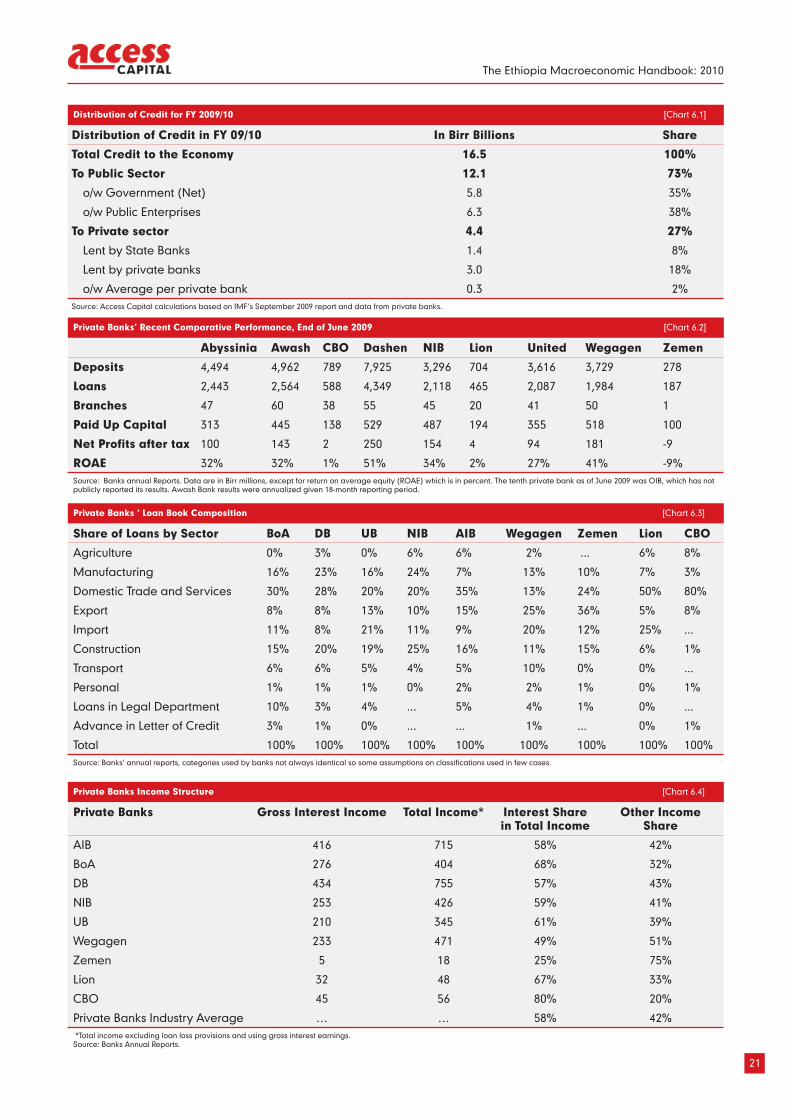
Besides the many shortcomings of bank-by-bank credit ceilings, a closely related problem with the current stance of monetary policy is the much distorted distribution of credit within the economy. This has been the case not just for the current fiscal year but for the past two years as well.
• For 2007/08, the year when inflation peaked at 55 percent, it is noteworthy that around four-fifths of total credit that year went to the government and parastatals, with only about a fifth directed to the private sector.9 This is perhaps the strongest indication that the link between inflation and private sector credit is not at all well established in Ethiopia, though the central bank has taken this perspective.10
• For this fiscal year (2009/10), total credit to the economy is programmed to increase by 17.1 percent or Birr 16.4 billion (Chart 6.1).11 Once again, the lion’s share of total credit (Birr 12 billion) is being allocated to the government and state enterprises, with each getting roughly 6 billion to cover their deficit financing needs. The remaining Birr 4.4 billion is allocated to private sector borrowers, only part of which however is lent out by private banks (since the three state banks are also lenders to the private sector). From our estimates of the credit allowances given to the private banks, we calculate that about Birr 1.4 billion out of the 4.4 billion in credit to the private sector is provided by the state banks. Thus, only about 3 out of the 16 billion Birr in this year’s total credit was allocated for lending by private banks, equivalent to an average Birr 300 million in extra lending allowed to each of the ten private banks (as of July 2009). Such a heavily biased ratio is hard to justify under a private sector-driven economic system.
The central bank’s recent relaxation of the lending caps (in February 2010) is very welcome and appears to show a belated recognition that the monetary policy stance was unduly tight. According to discussions with several private bank officials, the central bank relaxed the credit ceilings by an average of Birr 35-55 million per bank. This amounted to about an extra 10-15 percent on the Birr 300 million average extra lending allowed for each private bank. Given the still unchanged IMF target for overall credit growth, this extra Birr 350-500 million in credit allowed for private banks means that a similar reduction has been made in credit to the government and/or to state
KEY POINTS:
Rather than using market-based means of monetary control, the central bank opted for the use of bank-by-bank ceilings this past year.
In our view, bank-by-bank credit ceilings have no place in a market-based framework for monetary management and should thus be scrapped as early as possible. We think their removal is likely by July 2010, though there is unfortunately a small chance that the credit caps may continue into the next fiscal year.
The credit caps will dent the profitability of some banks this year, but not by much.
We expect banks to be relieved from credit controls by the start of the new fiscal year (July 2010), a welcome end to what has been a very blunt means of inflation control.6
7Such a ceiling is, incidentally, different from the credit ceilings that the NBE itself faces under the IMF program, which offers flexibility to rise above the ceiling sometimes during the year while reducing it to the required ceiling by year-end.
8See IMF report of September 2009, “FDRE: Request for 14-month Arrangement Under the Exogenous Shocks Facilty,” available at www.imf.org.
9To put the figures in nominal Birr terms, in FY 2007/08 credit to the government and parastatals rose by 11 billion while credit to the private sector rose by 4.4 billion.
10Indeed, it is worth recalling that Ethiopia has historically had low inflation rates for long periods of time without the use of any sort of caps on the lending activities of private banks; such ceilings are thus clearly not necessary for ensuring low inflation.
11See page 22 (Monetary Survey) of the IMF’s September 2009 report.
The Ethiopia Macroeconomic Handbook: 2010
20
enterprises. This is indeed consistent with indications of very strong tax collections in the first half of the year (thus the lower need for government deficit financing) and the equally strong financial performance reported by major parastatals such as Ethiopian Airlines, Ethiopian Shipping Lines, and ETC during the same period.
Looking ahead, we think that there is a high probability (though not a certainty) that credit controls on private banks will be removed in July 2010. We base our expectation on several factors. First, the inflation outlook is now being seen by policymakers as less threatening given the just-noted credit relaxation of February 2010. Second, the much improved balance of payments position (see Section 8) now gives greater scope for a more accommodative monetary policy stance. Third, some recent policy initiatives and commitments are heralding a move towards more market-based monetary and financial sector policies. In particular, we note that policy makers have recently signaled a readiness to establish bond markets involving the sale of government and state enterprise bonds at rates that are closer to the minimum deposit rates (of 4 percent) and thus more reflective of market conditions. Moreover, financial sector reform programs with both the IMF and World Bank are recently signaling strong commitments to liberalize policies and practices in the areas of the monetary management and capital market development respectively. Reflecting all these factors, we see no compelling economic reason not to return to the more normal patterns of banking operations whereby banks are allowed to lend according to the demand conditions of borrowers and their ability to mobilize deposits, while economy-wide credit control is attained through a more balanced use of fiscal policy and indirect means of monetary control (i.e. such as the sales of central bank bills dedicated for the purpose of liquidity management).
The expected relaxation of the credit caps in the new fiscal year should restore the historically high returns on equity seen at Ethiopia’s banks; for this year, the adverse impact of the credit caps on bank profits is likely to be modest. As has been the norm for quite some time, Ethiopia’s private banks reported strong profits for the year ending July 2009, with the average return on equity amounting to 26 percent (Charts 6.2 to 6.3). With year-average inflation around 36 percent during the same period, this meant real returns were negative for the industry as a whole; this was a rare occurrence, however, in what has otherwise been a decade of large and positive real returns to shareholders. For this year, the impact on profits from the credit caps need not be significant since the loan books of all banks are still expanding (just not by as much as they would like) and given that banks’ have several other income sources besides interest earnings on loans (e.g., fees and commissions on international trade, various banking service charges, and revaluation gains on foreign exchange holdings; see Chart 6.4). The latter source of income will be boosted this year given the two large depreciations that took place in July 2009 and January 2010. Reflecting all these factors, we expect that private banks’ returns on equity should remain within the 25-30 percent norm seen in recent years. Given sharply reduced inflation, this should translate in to real returns of 20-25 percent for most shareholders of Ethiopian banks.
The Ethiopia Macroeconomic Handbook: 2010
21
Distribution of Credit for FY 2009/10 [Chart 6.1]
Distribution of Credit in FY 09/10 In Birr Billions Share
Total Credit to the Economy 16.5 100%
To Public Sector 12.1 73%
o/w Government (Net) 5.8 35%
o/w Public Enterprises 6.3 38%
To Private sector 4.4 27%
Lent by State Banks 1.4 8%
Lent by private banks 3.0 18%
o/w Average per private bank 0.3 2%Source: Access Capital calculations based on IMF’s September 2009 report and data from private banks.
Private Banks Income Structure [Chart 6.4]
Private Banks Gross Interest Income Total Income* Interest Share in Total Income
Other Income Share
AIB 416 715 58% 42%
BoA 276 404 68% 32%
DB 434 755 57% 43%
NIB 253 426 59% 41%
UB 210 345 61% 39%
Wegagen 233 471 49% 51%
Zemen 5 18 25% 75%
Lion 32 48 67% 33%
CBO 45 56 80% 20%
Private Banks Industry Average … … 58% 42% *Total income excluding loan loss provisions and using gross interest earnings.Source: Banks Annual Reports.
Private Banks’ Recent Comparative Performance, End of June 2009 [Chart 6.2]
Abyssinia Awash CBO Dashen NIB Lion United Wegagen Zemen
Deposits 4,494 4,962 789 7,925 3,296 704 3,616 3,729 278
Loans 2,443 2,564 588 4,349 2,118 465 2,087 1,984 187
Branches 47 60 38 55 45 20 41 50 1
Paid Up Capital 313 445 138 529 487 194 355 518 100
Net Profits after tax 100 143 2 250 154 4 94 181 -9
ROAE 32% 32% 1% 51% 34% 2% 27% 41% -9%Source: Banks annual Reports. Data are in Birr millions, except for return on average equity (ROAE) which is in percent. The tenth private bank as of June 2009 was OIB, which has not publicly reported its results. Awash Bank results were annualized given 18-month reporting period.
Private Banks ‘ Loan Book Composition [Chart 6.3]
Share of Loans by Sector BoA DB UB NIB AIB Wegagen Zemen Lion CBO
Agriculture 0% 3% 0% 6% 6% 2% ... 6% 8%
Manufacturing 16% 23% 16% 24% 7% 13% 10% 7% 3%
Domestic Trade and Services 30% 28% 20% 20% 35% 13% 24% 50% 80%
Export 8% 8% 13% 10% 15% 25% 36% 5% 8%
Import 11% 8% 21% 11% 9% 20% 12% 25% ...
Construction 15% 20% 19% 25% 16% 11% 15% 6% 1%
Transport 6% 6% 5% 4% 5% 10% 0% 0% ...
Personal 1% 1% 1% 0% 2% 2% 1% 0% 1%
Loans in Legal Department 10% 3% 4% ... 5% 4% 1% 0% ...
Advance in Letter of Credit 3% 1% 0% ... ... 1% ... 0% 1%
Total 100% 100% 100% 100% 100% 100% 100% 100% 100%Source: Banks’ annual reports, categories used by banks not always identical so some assumptions on classifications used in few cases.

The Ethiopia Macroeconomic Handbook: 2010
23
After an extended period of double-digit growth rates, Ethiopia’s economic growth fell to 9.9 percent last year.12 The slowdown was broad-based with all three main sector categories (agriculture, services, industry) showing lower growth, as did 14 of the 18 sub-categories according to which GDP statistics are reported. The sharpest sectoral decline was in services (whose growth fell from 16 to 14 percent), followed by agriculture (down from 7.5 to 6.4 percent) and industry (down slightly from 10.0 to 9.9 percent.).
The outturn of 9.9 percent growth in FY2008/09 marks a relatively strong performance when seen against prevailing global economic conditions and in comparison to other African and developing countries. Relative to the previous five-year period, 2009 growth in developing countries was down by about two-thirds (from 6.1 to 2.1 percent), while Ethiopia’s shortfall over the same periods was only about 15 percent of the recent norm.13 This shortfall also compares favorably to other African countries, for instance Nigeria which saw 50 percent lower growth (from 10.6 to 5.3 percent over the two periods), while South Africa and Kenya recorded a 37 and 29 decline in growth during the same period respectively. Ethiopia’s ability to weather the global crisis reflected its still limited integration with the rest of the world (exports are only 6 percent of GDP) and the composition of its export base (which does not include many mineral commodities whose prices fell sharply during the crisis).
For this fiscal year, we forecast that the economy’s growth rate—around 7.5 percent according to our projections—will be the slowest in six years. A key determinant will be the performance of agriculture, which is set to show very little and possibly negative growth according to most external assessments of the kiremt harvest: the EU’s early assessments suggest a 10 percent decline in cereal output; USAID’s GIEWS reports suggest a modestly reduced crop compared to last year; and the FAO/WFP annual crop assessment reports anticipates national cereal and pulses production this year to fall by some 4.7 percent below the all time record harvest in 2008/09.14 The government, on the other hand, projects 3.5 percent growth
in contrast to many of the agency assessments, with a projected rise in total crops from 17.1 to 17.7 metric million tons. Our reading of these varying assessment reports is that agricultural growth will probably be close to zero, thus somewhere between the expectations of government and that of the donors/agencies. One notable factor behind our projection is the much reduced use of fertilizer during the last kiremt harvest (lower by 5 percent during the first six months of 2009, judging by trade statistics), which is important since rapidly rising fertilizer use was one of the factors that propelled strong agricultural output in recent years. For Industry, we project growth of 8 percent, on the view that growth will surely be below last year’s level given the severe power cuts that affected industrial activity for virtually the entire first quarter of FY 2009/10. With respect to services, given the strong activity seen in many service activities for the first six months of this year (see Chart 7.1), we see no reason to deviate sharply from the trend growth observed in the last five years, namely around 14 percent. With these sectoral growth projections, and on the basis of their (most recent) shares of GDP, we project growth will reach only 7.5 percent this fiscal year.
Our review of various proxies for GDP growth in the first six months of this year corroborates our expectation of strong growth for most industry and service activities. For example, comparing the first six months of this fiscal year with the same period a year ago, there was (in nominal terms) 49.6 percent growth in government revenues, 26 percent growth in deposits, 14 percent growth in bank loans, 39 percent growth in shipping, 12 percent growth in tourist arrivals, 26 percent growth in vehicle registrations, 125 percent growth in building registrations, and 14 percent growth in exports (23 percent excluding coffee) (see Chart 7.2). Even after deflating these nominal growth figures by inflation of 11 percent between these periods, real growth rates are very strong—including in double-digits—for many of these measures of service and manufacturing activity. As noted earlier, however, the near zero growth in agriculture will pull down these strong non-agricultural growth rates and contribute to overall growth of what we expect will be near 7.5 percent.
KEY POINTS:
As we predicted last year, the much-heralded years of double-digit growth have come to an end.
For this fiscal year, agricultural growth is likely to be close to zero in our view. Still, thanks to strong growth in services, overall growth should be near 7.5 percent.
The projected growth outturn this year will confirm, in our view, that Ethiopia’s medium-term trend growth rate can comfortably stay in the range of 6-8 percent.
Contrary to official projections, we forecast that Ethiopia’s economic growth will be the slowest seen in six years. 7
12Based on GDP at constant basic prices. An alternative measure, namely GDP at constant market prices, showed growth was only 8.7 percent; this growth rate had been above 10 percent for the previous five years.
13Based on the “emerging and developing economies” grouping of the IMFs World Economic Outlook (January 2010). For “advanced economies” growth swung from an already low 0.5 percent in 2008 to -3.2 in 2009.
14See the following reports: European Union Joint Research Center’s December 2009 “Crop Monitoring in Ethiopia” report; the USAID’s “GIEWS Country Brief” of February 2010 and the February 2010 “Special Report of the FAO-WFP Crop and Food Security Assessment Mission to Ethiopia”.
Growth Outlook [Chart 7.1]
Sector FY 08/09 FY 09/10 FY 10/11
Agriculture 6.4 0.0 4.0
Industry 9.9 8.0 9.0
Services 14.0 14.3 12.0
Overall GDP 9.9 7.5 8.6Source: MoFED and Access Capital Projections

The Ethiopia Macroeconomic Handbook: 2010
24
Our growth projections are lower than those of the government but somewhat more optimistic than those of several external forecasters. Growth projections by external forecasters are about 5 to 7 percent for this year, and our expectations are thus at the high end of the range (Chart 7.3). As was the case last year, the external forecasters more pessimistic view appears to be linked to a harsher assessment of the impact of the global economic slowdown on Ethiopia and, perhaps also for this year, their more negative assessment on the agricultural growth outlook.
Although there is a slowdown in growth this year, we think that the very positive trend breaks seen in the Ethiopian economy in recent years can continue to support medium-term growth in the 6-8 percent range. In particular, the six main factors that we identified in the 2009 Macroeconomic Handbook as driving Ethiopia’s medium-term growth potential remain very much in place: (i) a low initial starting base; (ii) growing links with three large and dynamic world regions; (iii) potential neighborhood recovery effects; (iv) payoffs from public investment; (v) rising fertilizer use and commercialization in agriculture and; (vi) growing use of preferential trade deals with the US (AGOA) and EU (EBA). Within the past year, these elements have largely been strengthened in our view thanks to: continued strong increases in public investment (up 22 percent in this year’s budget); an even further deepening of links with fast-growing world regions (see Section 10); improved prospects for commercialization of agriculture (see Section 3); and still rising trade ties with the US and Europe on the back of their preferential trade deals.
Measures of Economic Activity in the First Six Months of 2009/10 [Chart 7.2]
Indicator Six Month Average Growth PeriodTax Receipts nominal growth 49.6 FY 08/09-09/10
Electricity usage (sales) growth -6.0 FY 08/09-09/10
Tourist Arrivals 12.6 FY 08/09-09/10
Export Growth 14.4 FY 08/09-09/10
Import Growth -2.2 FY 08/09-09/10
Ports traffic growth 39.4 FY 08/09-09/10
Ethiopian Airlines Profit growth 133.0 FY 08/09-09/10
Building Permits 125.9 FY 08/09-09/10
Petroleum imports volume growth 7.3 FY 08/09-09/10
Vehicle Registration 26.7 FY 08/09-09/10
Bank Deposits 26.7 FY 08/09-09/10
Bank Loans 14.5 FY 08/09-09/10Source: ERCA, EEPCO, Ministry of Culture & Tourism, IMF, ESL, EAL, A.A. City Administration, Ethiopian Transport Authority, NBE, EPE
Growth projections for Ethiopia FY 2009/10 [Chart 7.3]
Organization Growth Projection (%)
Economist Intelligence Unit 7.0
Global Insight 5.0
International Monetary Fund 7.0
United Nations(ECA) 5.5
African Development Bank 7.0
OECD African Economic Outlook 7.0
Ethiopian Government (MoFED) 10.1
Access Capital 7.5Source: Publications of organizations listed above
The Ethiopia Macroeconomic Handbook: 2010
25
Regular monthly depreciations of the exchange rate, coupled with three step devaluations since January 2009, have brought Ethiopia’s exchange rate to a level of Birr 13.4 per USD from 9.95 Birr/USD a little more than a year ago (Chart 8.1). The sharp depreciations of the past year and a half have been necessitated by the near crisis conditions that engulfed Ethiopia towards the end of 2008, when reserves fell to just $800 million (less than one month import cover) and severe foreign exchange shortages arose following the sharp spike in global food and fuel prices. Excessive domestic growth had also contributed to this state of affairs, as fast growth in both the private sector and in public investment boosted import demand well beyond the economy’s ability to generate higher foreign exchange earnings via exports and other foreign exchange sources.
The trend depreciation of the past year has reduced the gap between the official and parallel market rate to below 5 percent as of early 2010, down from a peak gap of more than 20 percent back in early 2009.15 Since we think that the parallel market is the best indicator of what the ‘correct’ exchange rate level should be, the closeness of the official rate to the parallel rate represents (in our judgment) a very positive development.16 It is notable of course that, although exchange rate levels are now quite close to market rates, the exchange rate regime itself is still unfortunately far-from operating on market norms.
The exchange rate adjustments of the past year are doing precisely what they should be doing, namely encouraging exports, discouraging imports, boosting foreign exchange reserves, and reducing wait-times for accessing foreign exchange:
• Encouraging exports: Export growth has been strong in the last six months, a period that follows the sizeable exchange rate adjustments of January and July 2009. Export growth was 14 percent for the first half of this fiscal year (compared to the same period last year) and an even higher 23 percent if coffee is excluded.17
By contrast, export growth was near zero in FY 2008/09. The exchange rate adjustment has helped in several respects: by raising incentive for exporters (they now get 30 percent more income, all else equal, than they did in December 2008 when the rate was 9.9 Birr/USD); by correcting some obvious signs of overvaluation that
had emerged in 2008 (local coffee prices exceeding international coffee prices due to an unfavorable exchange rate), and; by encouraging a greater share of production to be sent abroad for many products that have large domestic demand (e.g. coffee, chat).
KEY POINTS:
The Birr has fallen by more than 30 percent in a period of a little more than a year.
The sizeable depreciation is very welcome and is working precisely as intended.
Looking ahead, we expect steady on-going depreciations to continue but at much slower pace this time than was the case last year.
A correct exchange rate policy is finally here to stay—businesses should thus expect the rate to reach 14 Birr/USD (but not much more) as early as July 2010 and to move close to 15/USD by mid-2011.
8
15See NBE’s “Monthly Macroeconomic Indicators” October 2009 available at www.nbe.gov.et for data on the historical parallel market premium. With the parallel rate around Birr 13.8-14.0 per USD in early 2010, the gap from the official rate is now between 3-5 percent.
16The case for treating the parallel rate as the most revealing indicator of the Birr’s ‘correct’ exchange rate is based on the fact that the rate in that market can respond freely to prevailing supply and demand conditions. The parallel rate is ‘market-clearing’ in that it moves to whatever level is required to fully allocate the available supply of (parallel market) dollars; a parallel equilibrating mechanism does not exist among banks, who cannot adjust rates as freely as the parallel market.
17Preliminary data for the first eight months suggest 21 percent growth in total exports compared to the same period last year.
Export Performance by Commodity (first six month FY 2009/10 vs first six month FY 2008/09) [Chart 8.2]
Export Commodities Growth Rate
Overall Exports 14.4
Coffee -6.9
Non-Coffee 22.8
Of which
Gold 81.1
Chat 45.4
Pulses 40.0
Flower 32.1
Oil Seeds 23.8
Live Animals 22.5
Fruits & Vegetables 10.6
Meat & Meat Prod. -6.4
Leather and Leather products -55.8
Others 16.0 Source: Ethiopian Revenue and Customs Authority
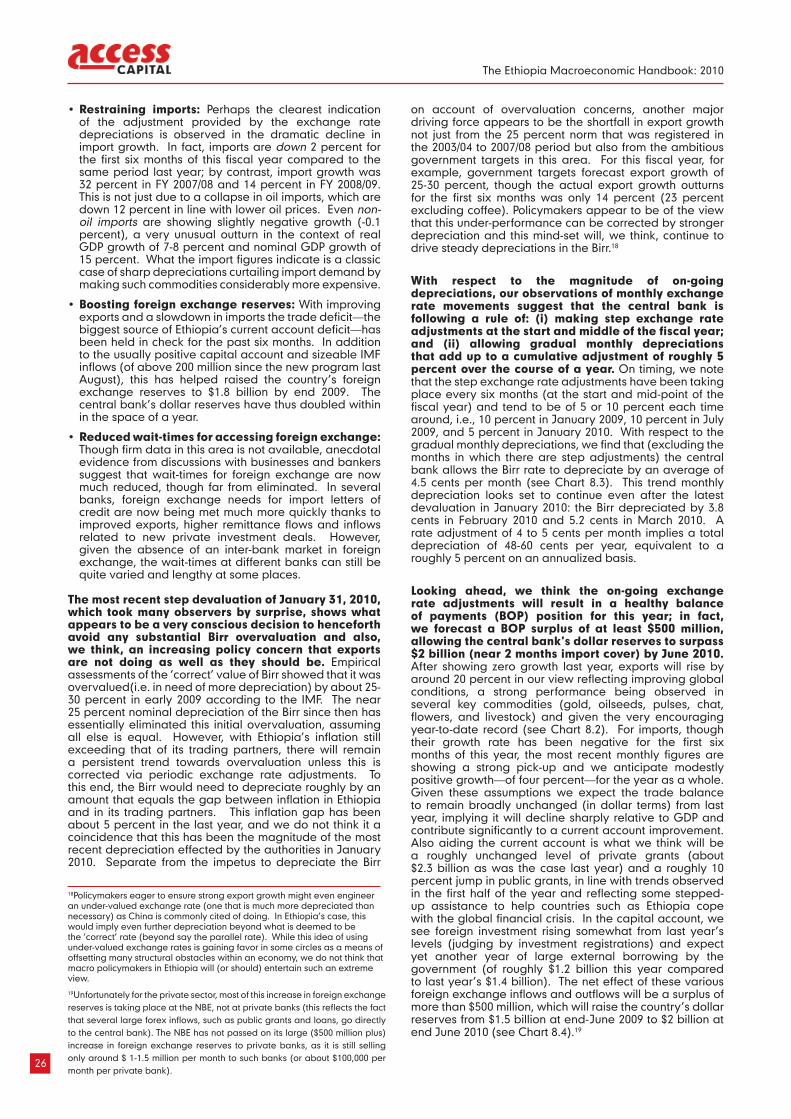
The Ethiopia Macroeconomic Handbook: 2010
26
• Restraining imports: Perhaps the clearest indication of the adjustment provided by the exchange rate depreciations is observed in the dramatic decline in import growth. In fact, imports are down 2 percent for the first six months of this fiscal year compared to the same period last year; by contrast, import growth was 32 percent in FY 2007/08 and 14 percent in FY 2008/09. This is not just due to a collapse in oil imports, which are down 12 percent in line with lower oil prices. Even non-oil imports are showing slightly negative growth (-0.1 percent), a very unusual outturn in the context of real GDP growth of 7-8 percent and nominal GDP growth of 15 percent. What the import figures indicate is a classic case of sharp depreciations curtailing import demand by making such commodities considerably more expensive.
• Boosting foreign exchange reserves: With improving exports and a slowdown in imports the trade deficit—the biggest source of Ethiopia’s current account deficit—has been held in check for the past six months. In addition to the usually positive capital account and sizeable IMF inflows (of above 200 million since the new program last August), this has helped raised the country’s foreign exchange reserves to $1.8 billion by end 2009. The central bank’s dollar reserves have thus doubled within in the space of a year.
• Reduced wait-times for accessing foreign exchange: Though firm data in this area is not available, anecdotal evidence from discussions with businesses and bankers suggest that wait-times for foreign exchange are now much reduced, though far from eliminated. In several banks, foreign exchange needs for import letters of credit are now being met much more quickly thanks to improved exports, higher remittance flows and inflows related to new private investment deals. However, given the absence of an inter-bank market in foreign exchange, the wait-times at different banks can still be quite varied and lengthy at some places.
The most recent step devaluation of January 31, 2010, which took many observers by surprise, shows what appears to be a very conscious decision to henceforth avoid any substantial Birr overvaluation and also, we think, an increasing policy concern that exports are not doing as well as they should be. Empirical assessments of the ‘correct’ value of Birr showed that it was overvalued(i.e. in need of more depreciation) by about 25-30 percent in early 2009 according to the IMF. The near 25 percent nominal depreciation of the Birr since then has essentially eliminated this initial overvaluation, assuming all else is equal. However, with Ethiopia’s inflation still exceeding that of its trading partners, there will remain a persistent trend towards overvaluation unless this is corrected via periodic exchange rate adjustments. To this end, the Birr would need to depreciate roughly by an amount that equals the gap between inflation in Ethiopia and in its trading partners. This inflation gap has been about 5 percent in the last year, and we do not think it a coincidence that this has been the magnitude of the most recent depreciation effected by the authorities in January 2010. Separate from the impetus to depreciate the Birr
on account of overvaluation concerns, another major driving force appears to be the shortfall in export growth not just from the 25 percent norm that was registered in the 2003/04 to 2007/08 period but also from the ambitious government targets in this area. For this fiscal year, for example, government targets forecast export growth of 25-30 percent, though the actual export growth outturns for the first six months was only 14 percent (23 percent excluding coffee). Policymakers appear to be of the view that this under-performance can be corrected by stronger depreciation and this mind-set will, we think, continue to drive steady depreciations in the Birr.18
With respect to the magnitude of on-going depreciations, our observations of monthly exchange rate movements suggest that the central bank is following a rule of: (i) making step exchange rate adjustments at the start and middle of the fiscal year; and (ii) allowing gradual monthly depreciations that add up to a cumulative adjustment of roughly 5 percent over the course of a year. On timing, we note that the step exchange rate adjustments have been taking place every six months (at the start and mid-point of the fiscal year) and tend to be of 5 or 10 percent each time around, i.e., 10 percent in January 2009, 10 percent in July 2009, and 5 percent in January 2010. With respect to the gradual monthly depreciations, we find that (excluding the months in which there are step adjustments) the central bank allows the Birr rate to depreciate by an average of 4.5 cents per month (see Chart 8.3). This trend monthly depreciation looks set to continue even after the latest devaluation in January 2010: the Birr depreciated by 3.8 cents in February 2010 and 5.2 cents in March 2010. A rate adjustment of 4 to 5 cents per month implies a total depreciation of 48-60 cents per year, equivalent to a roughly 5 percent on an annualized basis.
Looking ahead, we think the on-going exchange rate adjustments will result in a healthy balance of payments (BOP) position for this year; in fact, we forecast a BOP surplus of at least $500 million, allowing the central bank’s dollar reserves to surpass $2 billion (near 2 months import cover) by June 2010. After showing zero growth last year, exports will rise by around 20 percent in our view reflecting improving global conditions, a strong performance being observed in several key commodities (gold, oilseeds, pulses, chat, flowers, and livestock) and given the very encouraging year-to-date record (see Chart 8.2). For imports, though their growth rate has been negative for the first six months of this year, the most recent monthly figures are showing a strong pick-up and we anticipate modestly positive growth—of four percent—for the year as a whole. Given these assumptions we expect the trade balance to remain broadly unchanged (in dollar terms) from last year, implying it will decline sharply relative to GDP and contribute significantly to a current account improvement. Also aiding the current account is what we think will be a roughly unchanged level of private grants (about $2.3 billion as was the case last year) and a roughly 10 percent jump in public grants, in line with trends observed in the first half of the year and reflecting some stepped-up assistance to help countries such as Ethiopia cope with the global financial crisis. In the capital account, we see foreign investment rising somewhat from last year’s levels (judging by investment registrations) and expect yet another year of large external borrowing by the government (of roughly $1.2 billion this year compared to last year’s $1.4 billion). The net effect of these various foreign exchange inflows and outflows will be a surplus of more than $500 million, which will raise the country’s dollar reserves from $1.5 billion at end-June 2009 to $2 billion at end June 2010 (see Chart 8.4).19
18Policymakers eager to ensure strong export growth might even engineer an under-valued exchange rate (one that is much more depreciated than necessary) as China is commonly cited of doing. In Ethiopia’s case, this would imply even further depreciation beyond what is deemed to be the ‘correct’ rate (beyond say the parallel rate). While this idea of using under-valued exchange rates is gaining favor in some circles as a means of offsetting many structural obstacles within an economy, we do not think that macro policymakers in Ethiopia will (or should) entertain such an extreme view. 19Unfortunately for the private sector, most of this increase in foreign exchange reserves is taking place at the NBE, not at private banks (this reflects the fact that several large forex inflows, such as public grants and loans, go directly to the central bank). The NBE has not passed on its large ($500 million plus) increase in foreign exchange reserves to private banks, as it is still selling only around $ 1-1.5 million per month to such banks (or about $100,000 per month per private bank).
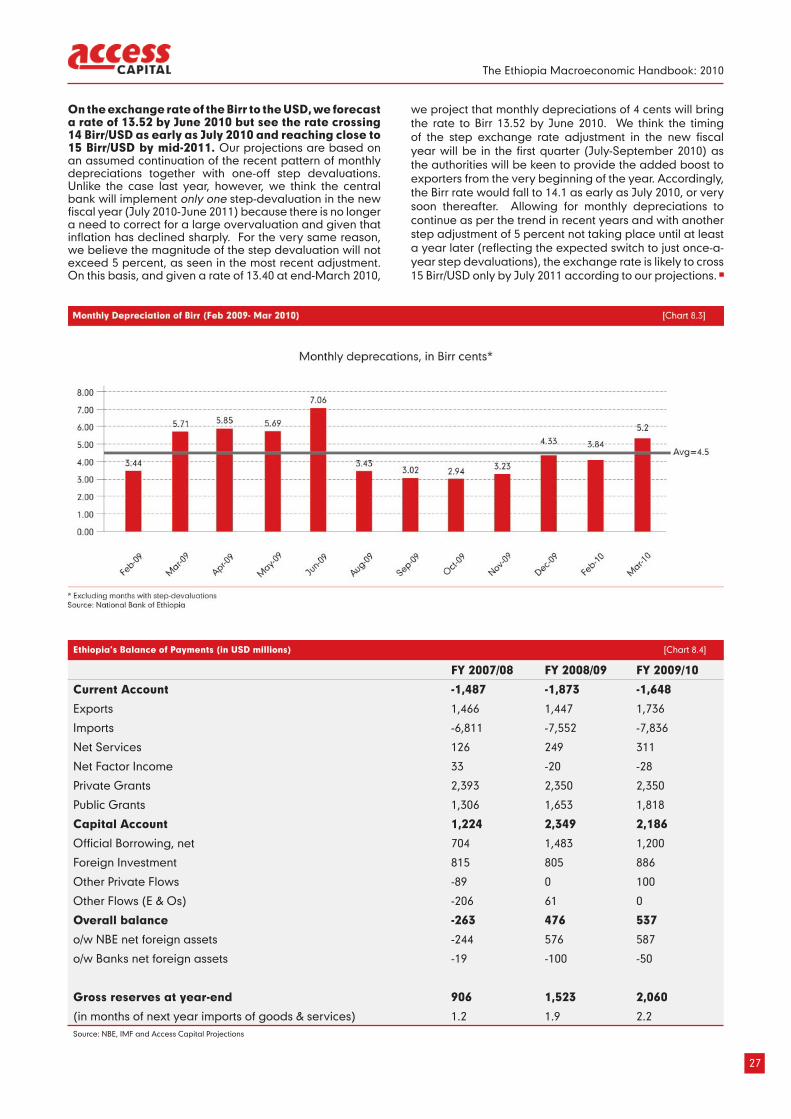
The Ethiopia Macroeconomic Handbook: 2010
27
On the exchange rate of the Birr to the USD, we forecast a rate of 13.52 by June 2010 but see the rate crossing 14 Birr/USD as early as July 2010 and reaching close to 15 Birr/USD by mid-2011. Our projections are based on an assumed continuation of the recent pattern of monthly depreciations together with one-off step devaluations. Unlike the case last year, however, we think the central bank will implement only one step-devaluation in the new fiscal year (July 2010-June 2011) because there is no longer a need to correct for a large overvaluation and given that inflation has declined sharply. For the very same reason, we believe the magnitude of the step devaluation will not exceed 5 percent, as seen in the most recent adjustment. On this basis, and given a rate of 13.40 at end-March 2010,
we project that monthly depreciations of 4 cents will bring the rate to Birr 13.52 by June 2010. We think the timing of the step exchange rate adjustment in the new fiscal year will be in the first quarter (July-September 2010) as the authorities will be keen to provide the added boost to exporters from the very beginning of the year. Accordingly, the Birr rate would fall to 14.1 as early as July 2010, or very soon thereafter. Allowing for monthly depreciations to continue as per the trend in recent years and with another step adjustment of 5 percent not taking place until at least a year later (reflecting the expected switch to just once-a-year step devaluations), the exchange rate is likely to cross 15 Birr/USD only by July 2011 according to our projections.
Ethiopia’s Balance of Payments (in USD millions) [Chart 8.4]
FY 2007/08 FY 2008/09 FY 2009/10
Current Account -1,487 -1,873 -1,648
Exports 1,466 1,447 1,736
Imports -6,811 -7,552 -7,836
Net Services 126 249 311
Net Factor Income 33 -20 -28
Private Grants 2,393 2,350 2,350
Public Grants 1,306 1,653 1,818
Capital Account 1,224 2,349 2,186
Official Borrowing, net 704 1,483 1,200
Foreign Investment 815 805 886
Other Private Flows -89 0 100
Other Flows (E & Os) -206 61 0
Overall balance -263 476 537
o/w NBE net foreign assets -244 576 587
o/w Banks net foreign assets -19 -100 -50
Gross reserves at year-end 906 1,523 2,060
(in months of next year imports of goods & services) 1.2 1.9 2.2Source: NBE, IMF and Access Capital Projections

The Ethiopia Macroeconomic Handbook: 2010
29
External borrowing is becoming one of the biggest sources of Ethiopia’s foreign exchange inflows, and the amounts involved last year were roughly four times the usual norms. According to Ministry of Finance statistics, external borrowing last year reached $1.6 billion, compared to an average of $300-500 million borrowed in the previous 4 years. To put this in perspective, the $1.6 billion in foreign exchange from new loans last year exceeded what Ethiopia received from exports ($1.4 billion) and what flowed in as foreign investment ($0.8 billion).
What is striking about last year’s external borrowing is not just its size, but also its form. In what appears to be a historic first, borrowing from private sources (including Suppliers Credits) exceeded borrowing from official sources. External borrowing in 2004/05 was close to $500 million, out of which roughly 25 percent was accounted by commercial banks and suppliers credits. The following year, private creditors/suppliers credits had fallen to 10 percent of the total external borrowing (all accounted for by foreign commercial banks), while subsequently falling to near zero levels in the next two years. Last year however, as external borrowing reached a record high of $1.6 billion, the major leap was not due to official loans (the traditional financing source) but an inflow of some $850 million (3 percent of GDP) in suppliers’ credit.
The suppliers credits reflect loan financing being provided by banks/enterprises in China and India for the purpose of financing large Ethiopian government imports for telecom, electricity and road-building projects. Based on a compilation of news reports and information from the websites of the credit suppliers, some of the notable credit lines being offered include: a $700 million loan from EXIM Bank of India to finance the state-owned sugar companies; $ 100 in smaller suppliers credits offered by Indian commercial banks that are supported by the Export Credit Guarantee Corporation of India (ECGC); a US$140 million loan from the China National Machinery and Equipment Import and Export Corporation to help Ethiopia’s state-owned electricity company (EEPCO) expand the national grid; a $349 million financing from China Exim Bank to finance the work of China Communication Construction Company (CCCC) in
the building, on behalf of the Ethiopian Roads Authority,of the Addis Abeba-Nazereth highway; and a $1.5 billion in financing from one of China’s largest telecom companies, ZTE, to the state-owned Ethiopian Telecommunications Corporation.20
The growth in suppliers credits is beneficial in some respects but also raises a number of potential concerns. In general, official creditors such as the World Bank or African Development Bank charge lower interest rates, offer better grace periods, and much longer maturities. This is indeed confirmed in Ethiopia’s debt statistics. Looking at the external loan commitments by the Ethiopian government for the year 2008/09, interest rates on loans from private sources are roughly four times those from official sources. In the one case where there is information on the terms of suppliers credits, the ZTE loan to the Ethiopian Telecommunications Corporation, this has reportedly been offered at a market rate. With respect to the grace period on loans, official creditors offer a relatively lengthy period of time (close to 10 years on average) than private sources with an average grace period of 2 years. Likewise, maturity date of loans from private creditors are short and observed to fall between 12-15 years while loans from official sources mature much longer, with an average 30 years maturity period (See Chart 9.3). Moreover, by their very nature, suppliers credits are linked to conditions that tie the borrower to purchase particular commodities solely from the supplying companies and/or its agents. If the experience of other countries is any guide, the usual danger of an excessive reliance on such credits is that borrowers are locked in to (potentially inferior) products and services that may not be in the best long-term interests of the borrower.
While government is borrowing extensively from abroad the same privilege is not being accorded to the private sector. The scope for the local private sector—be it banks, companies, or other institutions—to borrow from abroad is still highly restrictive. This is a policy that significantly holds back growth of the private sector and would, if liberalized, provide considerable new financing opportunities that could raise investment and accelerate growth. Although there are justifiable fears of excessive borrowing by private firms or banks, this can
KEY POINTS:
Borrowing from abroad has become one of the Ethiopia’s largest sources of foreign exchange.
The type of external borrowing is changing rapidly: historically large lenders such as the multilateral development banks are being replaced by private lenders and suppliers credits.
Although the private sector deserves the same privileges to borrow from abroad as do the government and parastatals, this has not—in practice—been the case so far. We think this will change gradually, however, given the considerable benefits involved.
Foreign borrowing is ballooning—and increasingly coming from private, not governmental, sources.9
The New Role of Foreign Borrowing [Chart 9.1]
FY04/05 FY05/06 FY06/07 FY07/08 FY08/09
Foreign Borrowing by Government (millions USD) 498.0 423.2 357.8 395.1 1,549.3
Government Debt Outstanding 5,917.0 5,998.5 2,314.6 2,767.1 4,154.8
Foreign Borrowing to GDP (%) 4.0% 2.8% 1.8% 1.5% 5.0%Source: MoFED “Public Sector External Debt” Statistical Bulletin (2004/05-2008/09)
20See”Scoping Study on the Chinese Relation with Sub Saharan Africa: The Case of Ethiopia, AERC Scoping Study, 2008.” The credits will not all disburse in one year and hence the difference between the totals and the 2008/09 disbursements.
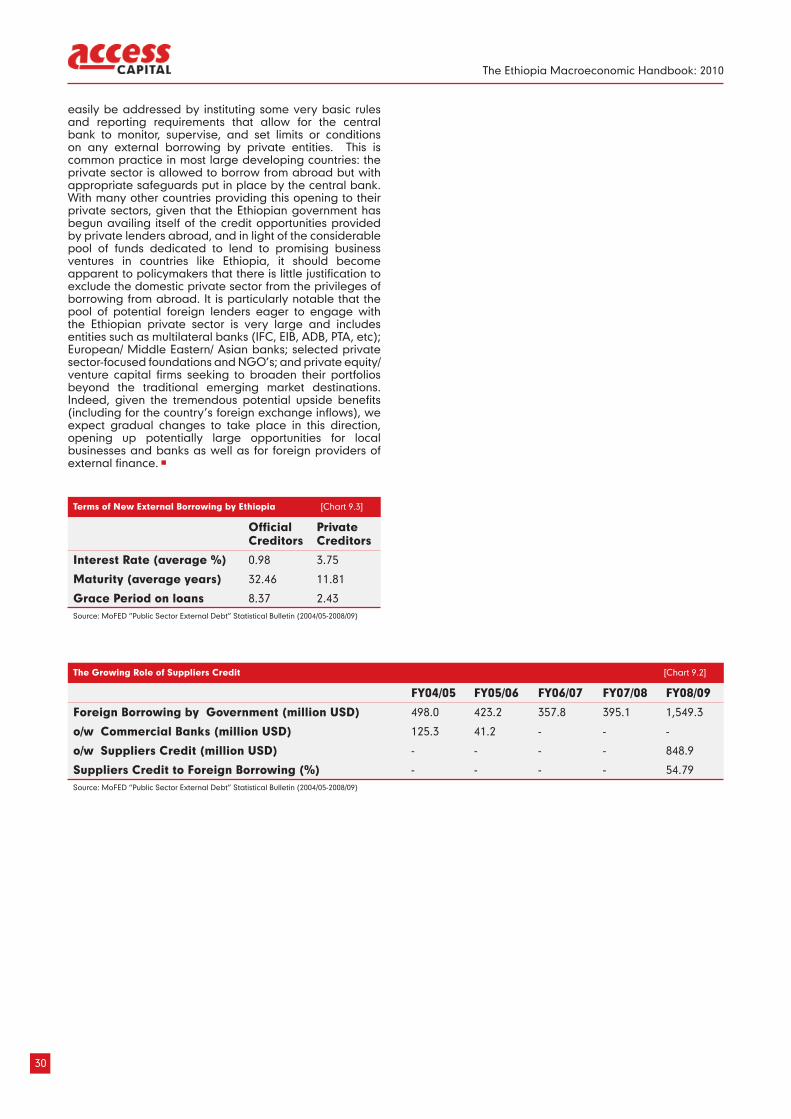
The Ethiopia Macroeconomic Handbook: 2010
30
easily be addressed by instituting some very basic rules and reporting requirements that allow for the central bank to monitor, supervise, and set limits or conditions on any external borrowing by private entities. This is common practice in most large developing countries: the private sector is allowed to borrow from abroad but with appropriate safeguards put in place by the central bank. With many other countries providing this opening to their private sectors, given that the Ethiopian government has begun availing itself of the credit opportunities provided by private lenders abroad, and in light of the considerable pool of funds dedicated to lend to promising business ventures in countries like Ethiopia, it should become apparent to policymakers that there is little justification to exclude the domestic private sector from the privileges of borrowing from abroad. It is particularly notable that the pool of potential foreign lenders eager to engage with the Ethiopian private sector is very large and includes entities such as multilateral banks (IFC, EIB, ADB, PTA, etc); European/ Middle Eastern/ Asian banks; selected private sector-focused foundations and NGO’s; and private equity/ venture capital firms seeking to broaden their portfolios beyond the traditional emerging market destinations. Indeed, given the tremendous potential upside benefits (including for the country’s foreign exchange inflows), we expect gradual changes to take place in this direction, opening up potentially large opportunities for local businesses and banks as well as for foreign providers of external finance.
The Growing Role of Suppliers Credit [Chart 9.2]
FY04/05 FY05/06 FY06/07 FY07/08 FY08/09
Foreign Borrowing by Government (million USD) 498.0 423.2 357.8 395.1 1,549.3
o/w Commercial Banks (million USD) 125.3 41.2 - - -
o/w Suppliers Credit (million USD) - - - - 848.9
Suppliers Credit to Foreign Borrowing (%) - - - - 54.79Source: MoFED “Public Sector External Debt” Statistical Bulletin (2004/05-2008/09)
Terms of New External Borrowing by Ethiopia [Chart 9.3]
Official Creditors
Private Creditors
Interest Rate (average %) 0.98 3.75
Maturity (average years) 32.46 11.81
Grace Period on loans 8.37 2.43Source: MoFED “Public Sector External Debt” Statistical Bulletin (2004/05-2008/09)
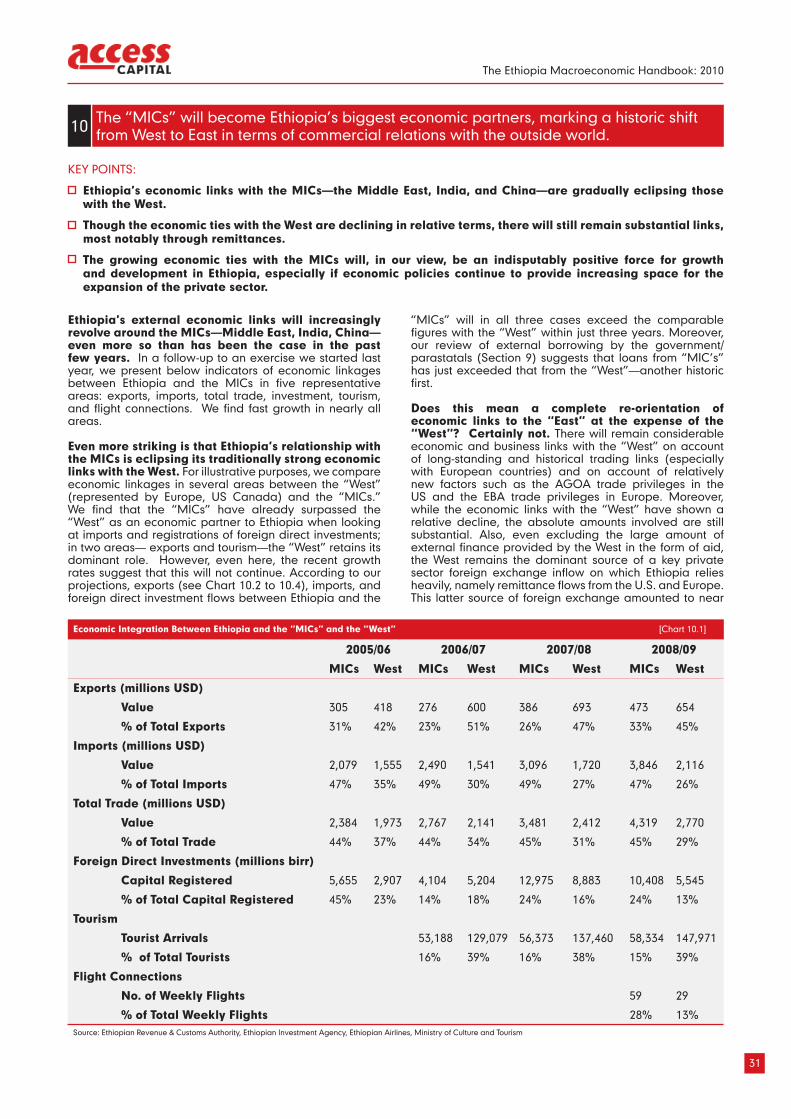
The Ethiopia Macroeconomic Handbook: 2010
31
Ethiopia’s external economic links will increasingly revolve around the MICs—Middle East, India, China—even more so than has been the case in the past few years. In a follow-up to an exercise we started last year, we present below indicators of economic linkages between Ethiopia and the MICs in five representative areas: exports, imports, total trade, investment, tourism, and flight connections. We find fast growth in nearly all areas.
Even more striking is that Ethiopia’s relationship with the MICs is eclipsing its traditionally strong economic links with the West. For illustrative purposes, we compare economic linkages in several areas between the “West” (represented by Europe, US Canada) and the “MICs.” We find that the “MICs” have already surpassed the “West” as an economic partner to Ethiopia when looking at imports and registrations of foreign direct investments; in two areas— exports and tourism—the “West” retains its dominant role. However, even here, the recent growth rates suggest that this will not continue. According to our projections, exports (see Chart 10.2 to 10.4), imports, and foreign direct investment flows between Ethiopia and the
“MICs” will in all three cases exceed the comparable figures with the “West” within just three years. Moreover, our review of external borrowing by the government/parastatals (Section 9) suggests that loans from “MIC’s” has just exceeded that from the “West”—another historic first.
Does this mean a complete re-orientation of economic links to the “East” at the expense of the “West”? Certainly not. There will remain considerable economic and business links with the “West” on account of long-standing and historical trading links (especially with European countries) and on account of relatively new factors such as the AGOA trade privileges in the US and the EBA trade privileges in Europe. Moreover, while the economic links with the “West” have shown a relative decline, the absolute amounts involved are still substantial. Also, even excluding the large amount of external finance provided by the West in the form of aid, the West remains the dominant source of a key private sector foreign exchange inflow on which Ethiopia relies heavily, namely remittance flows from the U.S. and Europe. This latter source of foreign exchange amounted to near
KEY POINTS:
Ethiopia’s economic links with the MICs—the Middle East, India, and China—are gradually eclipsing those with the West.
Though the economic ties with the West are declining in relative terms, there will still remain substantial links, most notably through remittances.
The growing economic ties with the MICs will, in our view, be an indisputably positive force for growth and development in Ethiopia, especially if economic policies continue to provide increasing space for the expansion of the private sector.
The “MICs” will become Ethiopia’s biggest economic partners, marking a historic shift from West to East in terms of commercial relations with the outside world. 10
Economic Integration Between Ethiopia and the “MICs” and the “West” [Chart 10.1]
2005/06 2006/07 2007/08 2008/09
MICs West MICs West MICs West MICs West
Exports (millions USD)
Value 305 418 276 600 386 693 473 654
% of Total Exports 31% 42% 23% 51% 26% 47% 33% 45%
Imports (millions USD)
Value 2,079 1,555 2,490 1,541 3,096 1,720 3,846 2,116
% of Total Imports 47% 35% 49% 30% 49% 27% 47% 26%
Total Trade (millions USD)
Value 2,384 1,973 2,767 2,141 3,481 2,412 4,319 2,770
% of Total Trade 44% 37% 44% 34% 45% 31% 45% 29%
Foreign Direct Investments (millions birr)
Capital Registered 5,655 2,907 4,104 5,204 12,975 8,883 10,408 5,545
% of Total Capital Registered 45% 23% 14% 18% 24% 16% 24% 13%
Tourism
Tourist Arrivals 53,188 129,079 56,373 137,460 58,334 147,971
% of Total Tourists 16% 39% 16% 38% 15% 39%
Flight Connections
No. of Weekly Flights 59 29
% of Total Weekly Flights 28% 13%Source: Ethiopian Revenue & Customs Authority, Ethiopian Investment Agency, Ethiopian Airlines, Ministry of Culture and Tourism
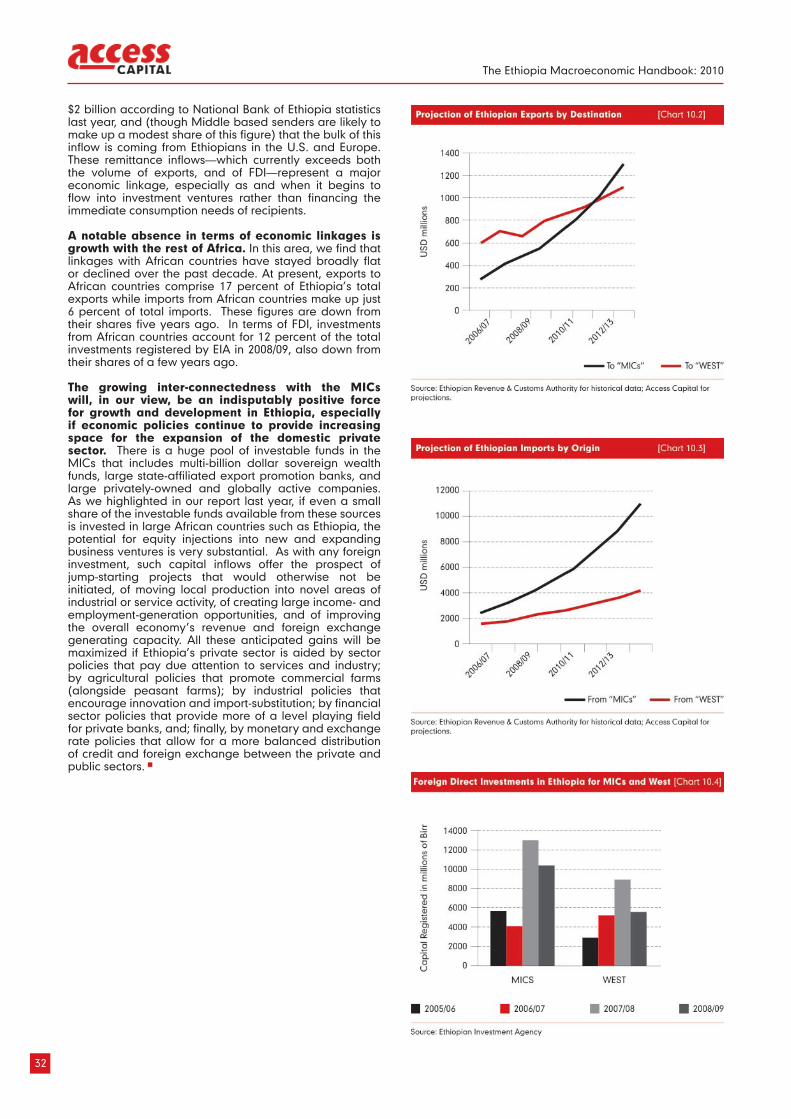
The Ethiopia Macroeconomic Handbook: 2010
32
$2 billion according to National Bank of Ethiopia statistics last year, and (though Middle based senders are likely to make up a modest share of this figure) that the bulk of this inflow is coming from Ethiopians in the U.S. and Europe. These remittance inflows—which currently exceeds both the volume of exports, and of FDI—represent a major economic linkage, especially as and when it begins to flow into investment ventures rather than financing the immediate consumption needs of recipients.
A notable absence in terms of economic linkages is growth with the rest of Africa. In this area, we find that linkages with African countries have stayed broadly flat or declined over the past decade. At present, exports to African countries comprise 17 percent of Ethiopia’s total exports while imports from African countries make up just 6 percent of total imports. These figures are down from their shares five years ago. In terms of FDI, investments from African countries account for 12 percent of the total investments registered by EIA in 2008/09, also down from their shares of a few years ago.
The growing inter-connectedness with the MICs will, in our view, be an indisputably positive force for growth and development in Ethiopia, especially if economic policies continue to provide increasing space for the expansion of the domestic private sector. There is a huge pool of investable funds in the MICs that includes multi-billion dollar sovereign wealth funds, large state-affiliated export promotion banks, and large privately-owned and globally active companies. As we highlighted in our report last year, if even a small share of the investable funds available from these sources is invested in large African countries such as Ethiopia, the potential for equity injections into new and expanding business ventures is very substantial. As with any foreign investment, such capital inflows offer the prospect of jump-starting projects that would otherwise not be initiated, of moving local production into novel areas of industrial or service activity, of creating large income- and employment-generation opportunities, and of improving the overall economy’s revenue and foreign exchange generating capacity. All these anticipated gains will be maximized if Ethiopia’s private sector is aided by sector policies that pay due attention to services and industry; by agricultural policies that promote commercial farms (alongside peasant farms); by industrial policies that encourage innovation and import-substitution; by financial sector policies that provide more of a level playing field for private banks, and; finally, by monetary and exchange rate policies that allow for a more balanced distribution of credit and foreign exchange between the private and public sectors.
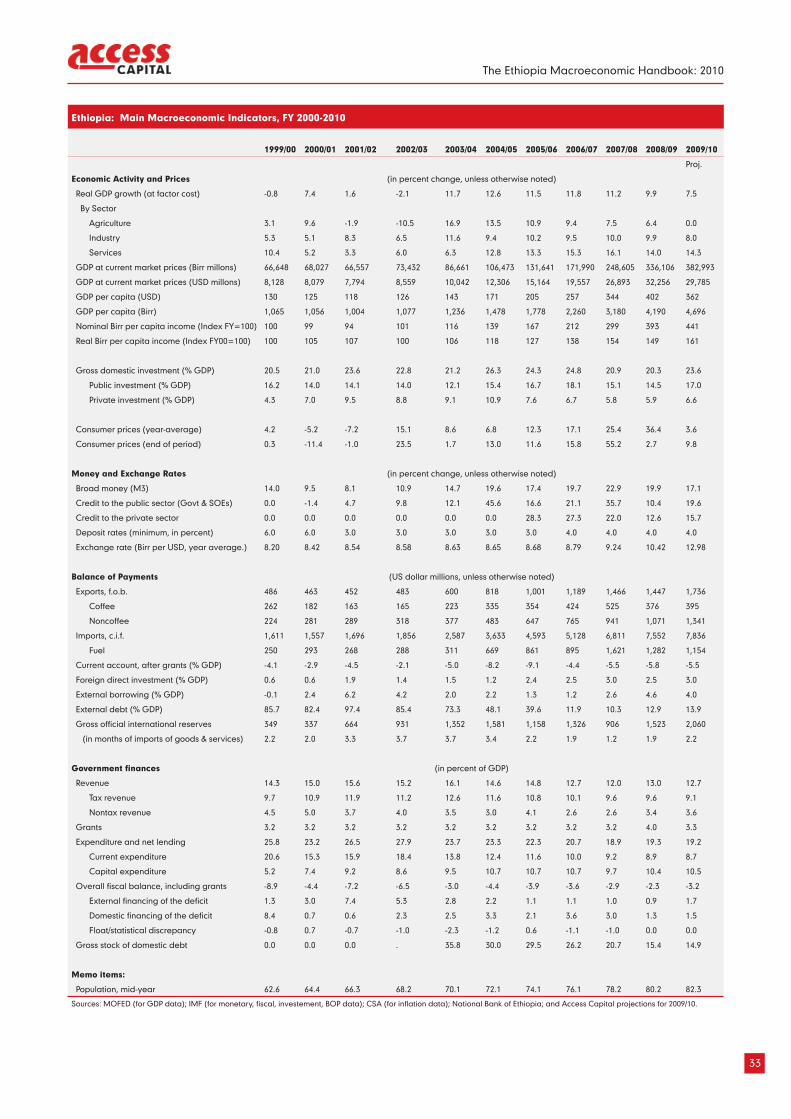
The Ethiopia Macroeconomic Handbook: 2010
33
Ethiopia: Main Macroeconomic Indicators, FY 2000-2010
1999/00 2000/01 2001/02 2002/03 2003/04 2004/05 2005/06 2006/07 2007/08 2008/09 2009/10
Proj.
Economic Activity and Prices (in percent change, unless otherwise noted)
Real GDP growth (at factor cost) -0.8 7.4 1.6 -2.1 11.7 12.6 11.5 11.8 11.2 9.9 7.5
By Sector
Agriculture 3.1 9.6 -1.9 -10.5 16.9 13.5 10.9 9.4 7.5 6.4 0.0
Industry 5.3 5.1 8.3 6.5 11.6 9.4 10.2 9.5 10.0 9.9 8.0
Services 10.4 5.2 3.3 6.0 6.3 12.8 13.3 15.3 16.1 14.0 14.3
GDP at current market prices (Birr millons) 66,648 68,027 66,557 73,432 86,661 106,473 131,641 171,990 248,605 336,106 382,993
GDP at current market prices (USD millons) 8,128 8,079 7,794 8,559 10,042 12,306 15,164 19,557 26,893 32,256 29,785
GDP per capita (USD) 130 125 118 126 143 171 205 257 344 402 362
GDP per capita (Birr) 1,065 1,056 1,004 1,077 1,236 1,478 1,778 2,260 3,180 4,190 4,696
Nominal Birr per capita income (Index FY=100) 100 99 94 101 116 139 167 212 299 393 441
Real Birr per capita income (Index FY00=100) 100 105 107 100 106 118 127 138 154 149 161
Gross domestic investment (% GDP) 20.5 21.0 23.6 22.8 21.2 26.3 24.3 24.8 20.9 20.3 23.6
Public investment (% GDP) 16.2 14.0 14.1 14.0 12.1 15.4 16.7 18.1 15.1 14.5 17.0
Private investment (% GDP) 4.3 7.0 9.5 8.8 9.1 10.9 7.6 6.7 5.8 5.9 6.6
Consumer prices (year-average) 4.2 -5.2 -7.2 15.1 8.6 6.8 12.3 17.1 25.4 36.4 3.6
Consumer prices (end of period) 0.3 -11.4 -1.0 23.5 1.7 13.0 11.6 15.8 55.2 2.7 9.8
Money and Exchange Rates (in percent change, unless otherwise noted)
Broad money (M3) 14.0 9.5 8.1 10.9 14.7 19.6 17.4 19.7 22.9 19.9 17.1
Credit to the public sector (Govt & SOEs) 0.0 -1.4 4.7 9.8 12.1 45.6 16.6 21.1 35.7 10.4 19.6
Credit to the private sector 0.0 0.0 0.0 0.0 0.0 0.0 28.3 27.3 22.0 12.6 15.7
Deposit rates (minimum, in percent) 6.0 6.0 3.0 3.0 3.0 3.0 3.0 4.0 4.0 4.0 4.0
Exchange rate (Birr per USD, year average.) 8.20 8.42 8.54 8.58 8.63 8.65 8.68 8.79 9.24 10.42 12.98
Balance of Payments (US dollar millions, unless otherwise noted)
Exports, f.o.b. 486 463 452 483 600 818 1,001 1,189 1,466 1,447 1,736
Coffee 262 182 163 165 223 335 354 424 525 376 395
Noncoffee 224 281 289 318 377 483 647 765 941 1,071 1,341
Imports, c.i.f. 1,611 1,557 1,696 1,856 2,587 3,633 4,593 5,128 6,811 7,552 7,836
Fuel 250 293 268 288 311 669 861 895 1,621 1,282 1,154
Current account, after grants (% GDP) -4.1 -2.9 -4.5 -2.1 -5.0 -8.2 -9.1 -4.4 -5.5 -5.8 -5.5
Foreign direct investment (% GDP) 0.6 0.6 1.9 1.4 1.5 1.2 2.4 2.5 3.0 2.5 3.0
External borrowing (% GDP) -0.1 2.4 6.2 4.2 2.0 2.2 1.3 1.2 2.6 4.6 4.0
External debt (% GDP) 85.7 82.4 97.4 85.4 73.3 48.1 39.6 11.9 10.3 12.9 13.9
Gross official international reserves 349 337 664 931 1,352 1,581 1,158 1,326 906 1,523 2,060
(in months of imports of goods & services) 2.2 2.0 3.3 3.7 3.7 3.4 2.2 1.9 1.2 1.9 2.2
Government finances (in percent of GDP)
Revenue 14.3 15.0 15.6 15.2 16.1 14.6 14.8 12.7 12.0 13.0 12.7
Tax revenue 9.7 10.9 11.9 11.2 12.6 11.6 10.8 10.1 9.6 9.6 9.1
Nontax revenue 4.5 5.0 3.7 4.0 3.5 3.0 4.1 2.6 2.6 3.4 3.6
Grants 3.2 3.2 3.2 3.2 3.2 3.2 3.2 3.2 3.2 4.0 3.3
Expenditure and net lending 25.8 23.2 26.5 27.9 23.7 23.3 22.3 20.7 18.9 19.3 19.2
Current expenditure 20.6 15.3 15.9 18.4 13.8 12.4 11.6 10.0 9.2 8.9 8.7
Capital expenditure 5.2 7.4 9.2 8.6 9.5 10.7 10.7 10.7 9.7 10.4 10.5
Overall fiscal balance, including grants -8.9 -4.4 -7.2 -6.5 -3.0 -4.4 -3.9 -3.6 -2.9 -2.3 -3.2
External financing of the deficit 1.3 3.0 7.4 5.3 2.8 2.2 1.1 1.1 1.0 0.9 1.7
Domestic financing of the deficit 8.4 0.7 0.6 2.3 2.5 3.3 2.1 3.6 3.0 1.3 1.5
Float/statistical discrepancy -0.8 0.7 -0.7 -1.0 -2.3 -1.2 0.6 -1.1 -1.0 0.0 0.0
Gross stock of domestic debt 0.0 0.0 0.0 . 35.8 30.0 29.5 26.2 20.7 15.4 14.9
Memo items:
Population, mid-year 62.6 64.4 66.3 68.2 70.1 72.1 74.1 76.1 78.2 80.2 82.3
Sources: MOFED (for GDP data); IMF (for monetary, fiscal, investement, BOP data); CSA (for inflation data); National Bank of Ethiopia; and Access Capital projections for 2009/10.
The Ethiopia Macroeconomic Handbook: 2010
34
Access Capital Research
Access Capital Research aims to provide comprehensive and insightful analyses of macroeconomic, sector-specific, and private sector developments and prospects in Ethiopia. Our research products are based on information and data compiled from multiple sources, including domestic economic agencies and statistics providers (the National Bank of Ethiopia, Ministry of Finance and Economic Development, Central Statistical Agency, Ethiopian Investment Agency), multilateral institutions, bilateral donors, private sector companies, industry associations, and international providers of business and economic news.
Any opinions or statements made by Access Capital Research are solely those of the research unit and its authors, and do not necessarily represent the views of the Management or Board of Access Capital. While every effort has been made to ensure the use of reliable data and information, and to qualify the reliability of particular sources when appropriate, Access Capital is not responsible for any errors of data, analysis, or interpretation.
Contacts:For additional information, please access the following website: www.accesscapitalsc.comFor Email correspondence: [email protected]: 011- 251-11-5539769Fax: 011-251-11-5539758Mail: P.O. Box 28119, Code 1000 Addis Ababa, Ethiopia


w w w. a c c e s s c a p i t a l s c . c o m
Contacts:For additional information, please access the following website:
www.accesscapitalsc.comFor Email correspondence: [email protected]
Tel: 011- 251-11-5539769Fax: 011-251-11-5539758
Mail: P.O. Box 28119, Code 1000 Addis Ababa, Ethiopia


