37
| Date post: | 19-Dec-2015 |
| Category: |
Documents |
| View: | 240 times |
| Download: | 5 times |


Macroeconomic Policy
• Recent U.S. macroeconomic history• Macroeconomic policy goals• Alternative growth paths

Recent U.S. macroeconomic history
• Growth, but with fluctuations• Concerns over growth rate• Reduced fluctuations—until 2008

Copyright© 2006 South-Western/Thomson Learning. All rights reserved.
The Growth Rate of U.S. Real Gross Domestic Product since 1870

The Great Depression
• A worldwide event (1929-1933)• Caused a revolution in macroeconomic
thinking• Until then, the prevailing theory held that
no government intervention was necessary; capitalist economies were self-correcting

John Maynard Keynes (1883-1946)
The General Theory of
Employment, Interest, and
Money (1936)

Keynesian Economics
• economies do not naturally gravitate to smooth growth and low unemployment
• pessimistic outlooks can lead to drops in AD and thus a lasting contraction
• thus there is a role for government intervention to hasten expansion through increasing government spending and thus increasing AD

Postwar expansion and stagflation
• up to 1973, the economy grew with mild business cycles
• 1973-1980 inflation was rising; unemployment was rising as well (both rising = stagflation)
• renewed interest in AS and supply-side shocks

Copyright© 2006 South-Western/Thomson Learning. All rights reserved.
The Inflation Rate in the United States since 1870

Reaganomics
• short recession in early 1980s• expansion with low inflation for rest of
the decade• recession in early 1990s• interest in manipulating tax code so as
to stimulate AS increases• Alan Greenspan begins reign as Fed
chair in 1987

Clintonomics
• strong growth through late 1990s• low inflation, low unemployment• focus on government deficit reduction• Greenspan continues his reign

Bushonomics• 2001 recession: first recession in 10 years;
only eight months long• focus on tax cuts in 2001-2003 to stimulate
AD increases• Wars in Iraq and Afghanistan increased
government spending• Greenspan continues his reign until 2006;
then Bernanke appointed as Fed Chair• 2008 financial crisis and recession

Obamanomics
• Ongoing recession• Economic stimulus program• Quantitative easing• Moving out of the recession: What’s next?

Macroeconomic Policy Goals
• High and steady economic growth• Low unemployment• Low inflation

Actual vs. Potential GDP
• potential GDP = real GDP that would be produced if all resources (including the labor force) are fully employed
• thus it is a measurement of productive capacity, while actual GDP is based on utilized capacity
• growth of potential GDP depends on:– growth rate of labor force– growth rate of capital stock– rate of technological progress

Copyright© 2006 South-Western/Thomson Learning. All
rights reserved.
Actual and Potential GDP

Unemployment (and Employment)
• Unemployment’s costs• Types of unemployment• What is full employment?
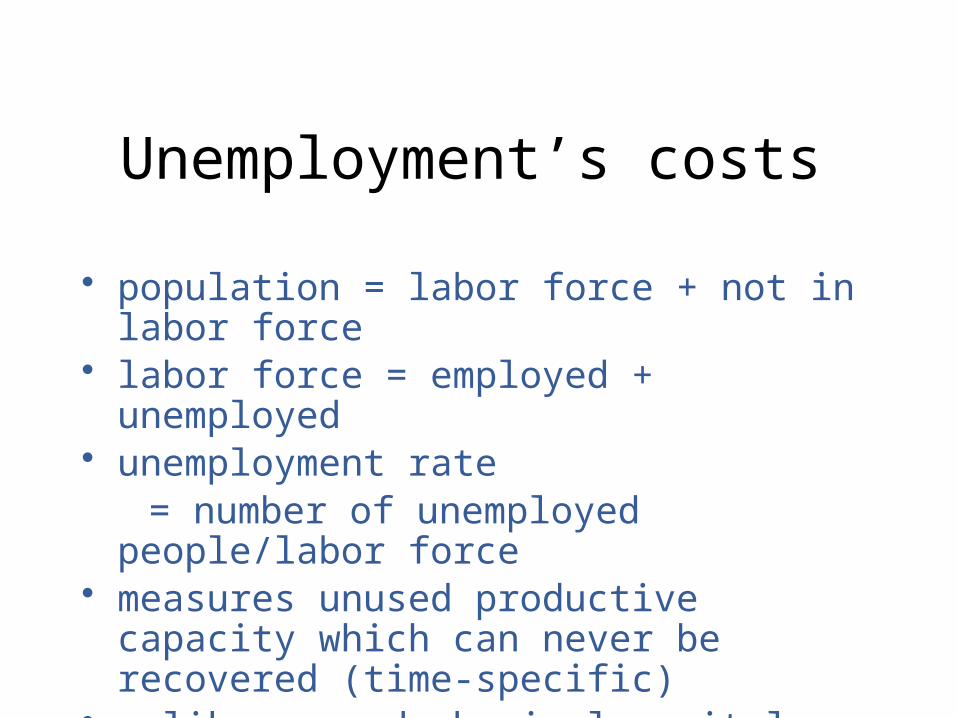
Unemployment’s costs
• population = labor force + not in labor force• labor force = employed + unemployed• unemployment rate = number of unemployed people/labor force• measures unused productive capacity which
can never be recovered (time-specific)• unlike unused physical capital, disuse
probably increases depreciation of human capital

Unemployment’s costs (cont.)
• unemployment costs are not fully shared• serious personal problem for the unemployed
– forgone income (UI programs help)– psychological distress– loss of skills
• other groups of people besides the unemployed are also not fully utilized:– discouraged workers– underemployed– those employed, but not utilizing their training

Types of Unemployment
• frictional• structural• cyclical

What is full employment?
• the economy is said to be at full employment when the only unemployment is frictional
• this is also often characterized as the employment level where there is no pressure on wages to rise or fall
• probably in the 3-4% range for the unemployment rate

Inflation (vs. Deflation;
vs. Stable Prices)
• redistributive impacts• measurement distortion• transactions and uncertainty costs• hyperinflation

Redistributive impacts• pure anticipated inflation has no effect• unanticipated inflation affects people
differently– borrowers win, lenders lose– flexible contracts neutral, fixed contracts lose
• relative price changes affect people differently– services, health care, and energy prices are rising
more– food, manufactured goods prices are rising less– overall, wages have risen by more than the cost of
living

Measurement distortion• inflation requires us to differentiate between
real and nominal values– real vs. nominal GDP– real vs. nominal factor payments
• wages• interest rates• rent
• e.g. the real interest rate = the nominal interest rate - the inflation rate• this makes it difficult to compare amounts over
time and space

Transactions and uncertainty costs
• “menu costs” of having to adjust prices• flexible vs. fixed contracts; affects which side
of the contract bears the uncertainty• may reduce willingness to enter into long-term
contracts• thus pure, anticipated, steady, low inflation
imposes fewer costs than unbalanced, unanticipated, variable, high inflation

Hyperinflation• no precise definition• useful guideline: monthly inflation rate of over 50%• may be caused by government printing too much
money; also forces the government to print more (higher denomination) money
• raises transactions costs, including menu costs, enormously

Hyperinflation (cont.)
• famous historical cases (and maximum daily inflation rates):-Germany (1920-23): 21 %-Hungary (1945-46): 207%-many Latin American countries in the 1980s (spurred calls for dollarization in some cases)-Zimbabwe (2006-09): 98%

Hyperinflation (cont.)
• Here is a Yugoslavian 500 billion dinar note, circa 1993, the final result of the Yugoslavian hyperinflation
• Countries experiencing hyperinflation often revalue their currencies; e.g. in Argentina in 1992, 1 new peso = 100 billion old (pre-1983) pesos
• Zimbabwe actually gave up their currency

Alternative Growth Paths
• Shifts of the Aggregate Supply curve• Adjusting recessionary gaps• Adjusting inflationary gaps• Stagflation (next lecture)• A growing economy (next lecture)• A role for stabilization policy (next lecture)

Shifts of the AS curve
• Along the AS curve, costs of production are constant• Changes in production shift AS
– the wage rate– the interest rate– prices of other inputs (materials, energy)– technology and productivity– available supplies of labor and capital
• The last two changes shift potential GDP as well

Shifts of the AS curve (cont.)
• In the long run (however long that takes), shifts in SRAS will move the economy to its long-run equilibrium (potential GDP)
• We can think of potential GDP as the long-run AS curve (LRAS curve)

Adjusting recessionary gaps
• When (cyclical) unemployment exists, if wages fall, SRAS will shift outward towards LRAS
• Once full employment is attained, this process will stop
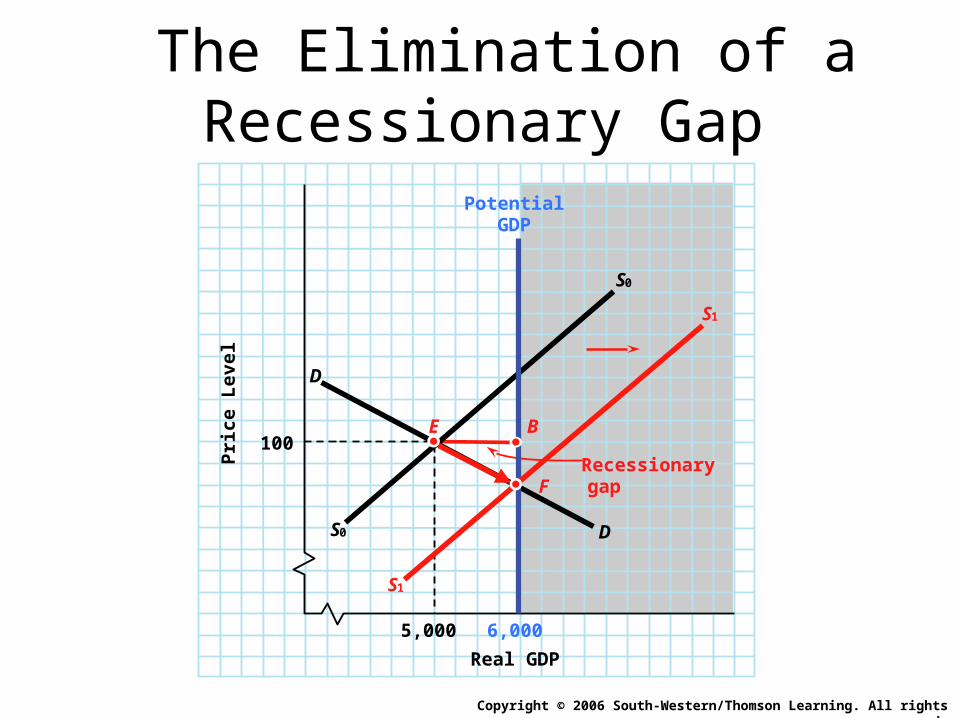
The Elimination of a Recessionary Gap
Copyright © 2006 South-Western/Thomson Learning. All rights reserved.
100
5,000
Recessionary gap
S0
S0
D
D
Potential GDP
Pri
ce L
evel
6,000
Real GDP
E
S1
S1
F
B

Adjusting recessionary gaps (cont.)
• But wages don’t always fall, or fall only slowly• Why are they so “sticky” downwards?
– institutional rigidities– psychological resistance
• How long are we willing to wait for the adjustment to occur?

Adjusting inflationary gaps
• When actual GDP > potential GDP, labor is in short supply and wages rise
• If wages rise, SRAS will shift inward towards LRAS
• Employment falls back to the full employment level, at which point the process will stop
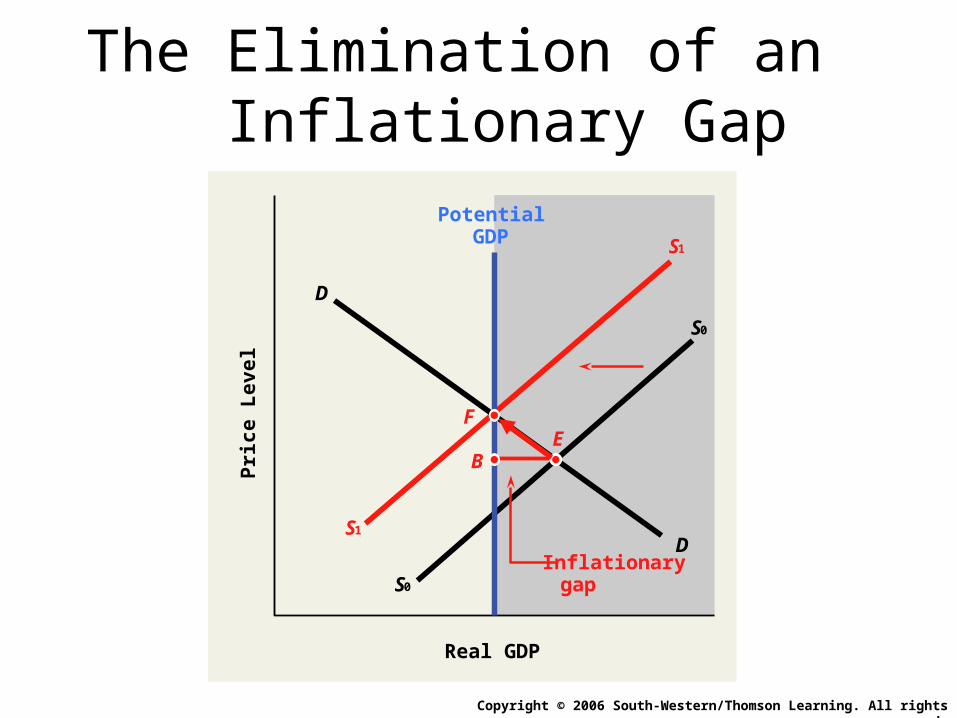
The Elimination of an Inflationary Gap
Copyright © 2006 South-Western/Thomson Learning. All rights reserved.
S1
S1
S0
S0
D
D
Real GDP
Pri
ce
Le
ve
l
E
Inflationary gap
Potential GDP
F
B

Adjusting inflationary gaps (cont.)
• During the adjustment period, both prices and unemployment are increasing
• This may be considered unacceptable politically


