124
More adults 18-29 read magazines (95%) than use Facebook (81%). — page 45 Better. Believe It. MAGAZINE MEDIA FACTBOOK
More adults 18-29 read magazines (95%)than use Facebook (81%). — page 45Better.
Believe It.
MAGAZINEMEDIA FACTBOOK


Here at your fingertips are more than 100 pages of audited, accredited and validated facts about the power of magazine media for you to reference and incorporate into your daily conversations. The annual MPA Factbook is one of the most widely sourced and relied upon tools in our industry. We receive and fulfill thousands of requests for the book, and its prevalence increased last year when every page became available online as a downloadable PowerPoint slide. The ready-to-go slides have been a fantastic addition, but most of our audience still prefer a printed copy to inspire them and introduce them to the full panoply of information. It is not unusual to see recipients hug the book to their chest when we hand them out, a reaction that mimics the personal connection consumers have to their printed magazines. Why, after nearly 40 years, has the Factbook stayed in such high demand? Because magazine brands continue to be long-standing, recognizable and trusted by consumers and advertisers. Readers know that the content in magazines is credible. Marketers know that magazine media builds brands and sells product in a safe and transparent environment. You will find some of your favorite slides refreshed and updated. You will also discover new research from GfK MRI, AAM, YouGov, Ipsos, Simmons and Kantar. You’ll learn why time spent does not correlate to advertising business results. And how neuroscience proves that print delivers a more immersive user experience. This year’s Factbook adds results from member case studies as well as MPA’s Magazine Media 360° Social Media Engagement Factor, which shows how magazine brands are more engaging on social media than non-magazine brands. Overall, our aim is to provide a breadth of research from third-party sources that will serve as a resource for MPA members, marketers, agencies, students and anyone interested in the magazine media industry. On behalf of everyone who contributed to the information in the Factbook, and with special thanks to our printer Freeport Press, we hope you find the information in these pages useful. Be sure to visit magazine.org to download slides and discover additional research.
— Linda Thomas Brooks — President and Chief Executive Officer, MPA–The Association of Magazine Media

75% of us fall for fake headlines.We all deserve better. Fact is,people believe magazine mediamore than any other. Whether inprint, online, on mobile or video,it provides expertly researched,written and relevant content ina safe environment.
Content that is worthy of yourtrust. That’s keeping it real.
#BelieveMagMedia | BelieveMagMedia.com
Sour
ce: I
psos
Pub
lic A
ffairs
surv
ey, 2
017,
Sim
mon
s Res
earc
h M
ilti-M
edia
Eng
agem
ent S
tudy
, 201
7.
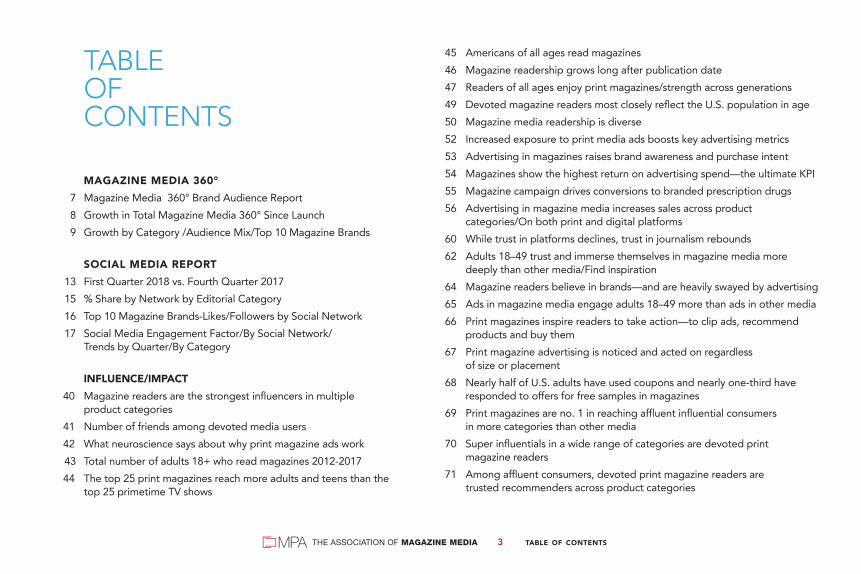
45 Americans of all ages read magazines 46 Magazine readership grows long after publication date 47 Readers of all ages enjoy print magazines/strength across generations 49 Devoted magazine readers most closely reflect the U.S. population in age 50 Magazine media readership is diverse 52 Increased exposure to print media ads boosts key advertising metrics 53 Advertising in magazines raises brand awareness and purchase intent 54 Magazines show the highest return on advertising spend—the ultimate KPI 55 Magazine campaign drives conversions to branded prescription drugs 56 Advertising in magazine media increases sales across product categories/On both print and digital platforms 60 While trust in platforms declines, trust in journalism rebounds 62 Adults 18–49 trust and immerse themselves in magazine media more deeply than other media/Find inspiration 64 Magazine readers believe in brands—and are heavily swayed by advertising 65 Ads in magazine media engage adults 18–49 more than ads in other media 66 Print magazines inspire readers to take action—to clip ads, recommend products and buy them 67 Print magazine advertising is noticed and acted on regardless of size or placement 68 Nearly half of U.S. adults have used coupons and nearly one-third have responded to offers for free samples in magazines 69 Print magazines are no. 1 in reaching affluent influential consumers in more categories than other media 70 Super influentials in a wide range of categories are devoted print magazine readers 71 Among affluent consumers, devoted print magazine readers are trusted recommenders across product categories
MAGAZINE MEDIA 360° 7 Magazine Media 360° Brand Audience Report 8 Growth in Total Magazine Media 360° Since Launch 9 Growth by Category /Audience Mix/Top 10 Magazine Brands
SOCIAL MEDIA REPORT 13 First Quarter 2018 vs. Fourth Quarter 2017 15 % Share by Network by Editorial Category 16 Top 10 Magazine Brands-Likes/Followers by Social Network 17 Social Media Engagement Factor/By Social Network/ Trends by Quarter/By Category
INFLUENCE/IMPACT 40 Magazine readers are the strongest influencers in multiple product categories 41 Number of friends among devoted media users 42 What neuroscience says about why print magazine ads work 43 Total number of adults 18+ who read magazines 2012-2017 44 The top 25 print magazines reach more adults and teens than the top 25 primetime TV shows
TABLE OF CONTENTS
TABLE OF CONTENTS03THE ASSOCIATION OF MAGAZINE MEDIA

Magazine media reaches eyeballs, minds and wallets
Brand EdifyingContextually Relevant
— page 64, 65
Third-Party Audited andAccredited Measurement
— MPA Factbook
BetterViewability
— page 66, 67
ImmersiveUser Experience
— page 42, 62
Highest Return onAdvertising Spend
— page 54, 58
Download these pages and more for your presentations at magazine.org/factbook.
in a safe, validated environment.

72 Print magazines deliver consumers with strong auto purchase intent/ Among new vehicle buyers, devoted magazine readers are more affluent 74 Affluent luxury goods category influencers are devoted print magazine readers 75 Consumers, especially affluent ones, use print magazines to keep up with the latest styles 76 Magazine media readers lead in spending on beauty and skin care products/Are fashion conscious and believers in beauty products 79 Print magazines excel in reaching super influentials in healthcare 80 Devoted readers, the most informed, engaged healthcare, pharma users 81 Magazine media advertising drives consumer healthcare actions more than advertising anywhere else 82 Magmedia readers are the most health-conscious consumers/ Take action to maintain their health 84 Households with income of $250K+ are drawn to magazines 85 Households with the greatest financial assets favor magazine media 86 Affluent magazine readers charge more to their credit cards 87 Magazine media: Where to find active affluent investors 88 Magazine media: Where to find affluent users of financial services 89 Luxury category influencers are devoted print magazine readers 90 Affluent devoted magazine readers very likely to remodel 91 Affluent magazine readers spend big on home remodeling/Lead in home improvement/Heavy on luxury goods 94 Affluent magazine readers are the most frequent travelers/Spend more on travel/Most likely to spend heavily on vacations 97 Print magazines are the top destination for overseas travelers 99 Affluent food influencers consume print magazines 100 Affluent magazine media readers excel at gourmet cooking
101 Affluent print magazine readers enjoy their free time/Lead the most active lives, enriching mind and body 103 Print magazine readers are entertainment enthusiasts/Magazine readers seek knowledge and new experiences 105 Adults 18–49 rely on magazine media to provide them with valued information, conversation, and purchase inspiration
MAGAZINE BRAND VITALITY106 Editorial category page total percentages 2017 107 U.S. print magazine launches by category in 2017 108 Average time spent per issue: print and digital editions/Readership is steady all year long 110 Magazine brands endure: More than 180 print magazines have thrived for more than 50 years/Total number of U.S. consumer print magazines 112 Circulation Mix: Print and digital, subscriptions and single copy 113 The top 50 print magazine marketers in 2017 115 About MPA 119 Research Contributions
TABLE OF CONTENTS05THE ASSOCIATION OF MAGAZINE MEDIA

MAGAZINE MEDIA USP6THE ASSOCIATION OF MAGAZINE MEDIA
Magazine Media USP
Magazine media delivers powerful relationships that
influence, inspire and endure. The magazine media brand
experience is based on trusted editorial, complemented
by relevant advertising. This dual immersion in edit and
ads satisfies the interests and passions of millions of
readers—when, where and how they choose. The readers’
commitment to this unique brand experience results in
extraordinary consumer engagement with magazine media
on all platforms and formats.
How much has#magmedia grown?The #MM360 Brand
Audience Reportshows +23% growth
since launchDownload
these pages andmore for yourpresentations
at magazine.org

Now in its fourth year, Magazine Media 360° measures audiences across multiple platforms and formats.
Captured in the Brand Audience and the Social Media Reports, platforms and formats covered include:• print+digital magazine editions• web (desktop and laptop)• mobile web• video• social media (reported separately)
Magazine Media 360° uses data from leading third-party providers and covers approximately 120 magazine media brands from 27 companies, representing 95% of the reader universe.
The MPA Magazine Media 360° Brand Audience Report is published monthly and the MPA Magazine Media 360° Social Media Reportis published quarterly. Both reports contain audience metrics by magazine brand and are available at www.magazine.org.
MAGAZINE MEDIA 360º07THE ASSOCIATION OF MAGAZINE MEDIA
The #MM360 BrandAudience Report
provides a comprehensivesnapshot of consumerdemand for magazine
media brands

MAGAZINE MEDIA 360º08THE ASSOCIATION OF MAGAZINE MEDIA
Magazine Brand Cross-Platform Audiences
Continue to RiseOver Time
2.0 billion+23% since launch
Audience (billions)
Sources: Print + Digital: GfK MRI and Ipsos. Online: comScore.
SEPT. 2014 SEPT. 2015 SEPT. 2016 SEPT. 2017 MAR. 2018 SEPT. 2018
1.69
1.85
1.961.94
% Growth in Total Magazine Media 360° Audience vs. Same Month Year Ago
Magazine Media 360ºPercent Growth in Total Magazine Media 360º Since Launch

MAGAZINE MEDIA 360º09THE ASSOCIATION OF MAGAZINE MEDIA
1 science and technology 2 regional 3 travel 4 fishing and hunting 5 current events and political commentary 6 participatory sports 7 business and finance 8 shelter 9 thought leader 10 news and information 11 automotive 12 sports spectator 13 health and fitness 14 women’s fashion and beauty
15 women’s service and lifestyle 16 epicurean 17 men’s fashion, grooming and lifestyle 18 popular culture and entertainment
1 2 3 4 5 6 7 8 9 10 11 12 13 14
15 16 17 18
All Magazine BrandsAverage Growth
+1.4%
9%
8%
7% 7%
6% 6%
4% 4% 4%
5%
3%
1% 1% 1%
-1%
-2%
-3%
-4%
Sources: Print + Digital: GfK MRI and Ipsos. Online: comScore.
Magazine Media 360º% Growth by Category — Full Year 2017 vs. 2016

MAGAZINE MEDIA 360º10THE ASSOCIATION OF MAGAZINE MEDIA
Sources: Print+Digital Editions–GfK MRI Survey of the American Consumer®, GfK MRI Accessed Prototype, OR Ipsos Affluent Survey USA. Web (Desktop/Laptop)–comScore Media Metrix®. Mobile Web–comScore Mobile Metrix. Video–comScore Video Metrix.
TotalAudienceGrowth+1.4%
52% Print+Digital Editions932.7 Million
32% Mobile Web579.9 Million
12% Web (Desktop/ Laptop)
222.6 Million
4% Video76.4 Million
Full Year 20171.81 Billion
Full Year 20161.79 Billion
51% Print+Digital Editions902.5 Million
32% Mobile Web578.5 Million
14% Web (Desktop/ Laptop)
249.1 Million
3% Video56.2 Million
Magazine Media 360ºAudience Mix — Full Year 2017 vs. 2016

MAGAZINE MEDIA 360º011THE ASSOCIATION OF MAGAZINE MEDIA
Print + Digital Web (desktop/laptop) Mobile Web Video Total Brand AudienceAUDIENCE UNIQUE VISITORS UNIQUE VISITORS UNIQUE VIEWERS
1 People 41,604 ESPN The Magazine 22,707 ESPN The Magazine 50,878 ESPN The Magazine 11,289 ESPN The Magazine 102,245
2 AARP 38,285 Forbes 16,840 Forbes 38,847 Forbes 5,091 People 79,683
3 Better Homes and Gardens 37,303 WebMD Magazine 13,323 WebMD Magazine 34,552 Entrepreneur 4,886 Forbes 68,231
4 National Geographic 31,782 Allrecipes 11,866 Allrecipes 32,851 Vanity Fair 4,074 WebMD Magazine 59,472
5 Good Housekeeping 19,666 Time 6,472 People 27,772 People 4,027 Allrecipes 54,087
6 Reader’s Digest 19,037 People 6,280 Time 19,412 Time 3,294 Time 47,779
7 Time 18,601 The Atlantic 5,802 New York Magazine 16,750 Wired 2,927 Better Homes and Gardens 47,484
8 Sports Illustrated 18,121 New York Magazine 5,153 Entertainment Weekly 13,901 GQ 2,815 AARP 46,343
9 ESPN The Magazine 17,371 Better Homes and Gardens 4,670 The Atlantic 13,882 Bon Appétit/Epicurious 2,756 National Geographic 40,879
10 Cosmopolitan 16,720 Entertainment Weekly 3,953 Us Weekly 13,688 Sports Illustrated 2,447 Sports Illustrated 36,249
Sources: Print+Digital Editions–GfK MRI Survey of the American Consumer®, GfK MRI Accessed Prototype, OR Ipsos Affluent Survey USA. Web (Desktop/Laptop)–comScore Media Metrix®. Mobile Web–comScore Mobile Metrix. Video–comScore Video Metrix.
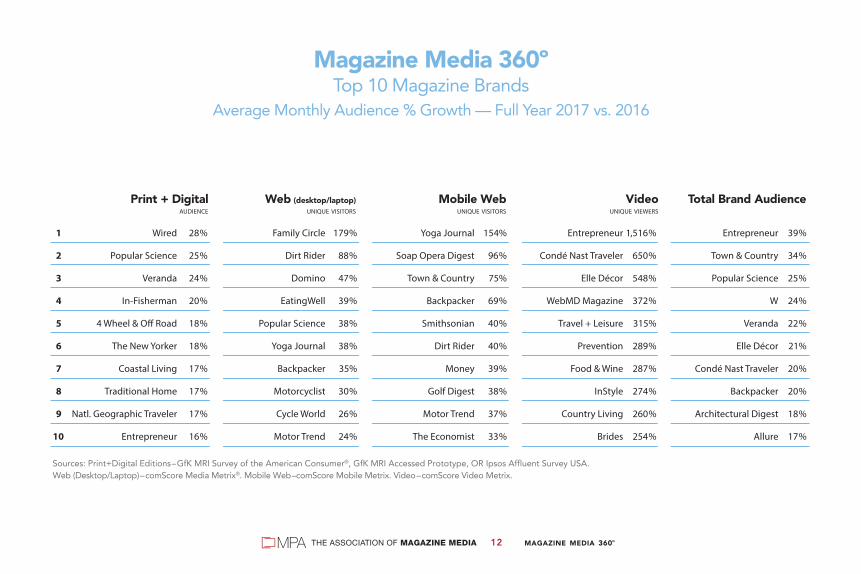
Magazine Media 360ºTop 10 Magazine Brands
Average Monthly Audience (000) — Full Year 2017 vs. 2016
MAGAZINE MEDIA 360º012THE ASSOCIATION OF MAGAZINE MEDIA
Print + Digital Web (desktop/laptop) Mobile Web Video Total Brand Audience AUDIENCE UNIQUE VISITORS UNIQUE VISITORS UNIQUE VIEWERS
1 Wired 28% Family Circle 179% Yoga Journal 154% Entrepreneur 1,516% Entrepreneur 39%
2 Popular Science 25% Dirt Rider 88% Soap Opera Digest 96% Condé Nast Traveler 650% Town & Country 34%
3 Veranda 24% Domino 47% Town & Country 75% Elle Décor 548% Popular Science 25%
4 In-Fisherman 20% EatingWell 39% Backpacker 69% WebMD Magazine 372% W 24%
5 4 Wheel & O� Road 18% Popular Science 38% Smithsonian 40% Travel + Leisure 315% Veranda 22%
6 The New Yorker 18% Yoga Journal 38% Dirt Rider 40% Prevention 289% Elle Décor 21%
7 Coastal Living 17% Backpacker 35% Money 39% Food & Wine 287% Condé Nast Traveler 20%
8 Traditional Home 17% Motorcyclist 30% Golf Digest 38% InStyle 274% Backpacker 20%
9 Natl. Geographic Traveler 17% Cycle World 26% Motor Trend 37% Country Living 260% Architectural Digest 18%
10 Entrepreneur 16% Motor Trend 24% The Economist 33% Brides 254% Allure 17%
Sources: Print+Digital Editions–GfK MRI Survey of the American Consumer®, GfK MRI Accessed Prototype, OR Ipsos Affluent Survey USA. Web (Desktop/Laptop)–comScore Media Metrix®. Mobile Web–comScore Mobile Metrix. Video–comScore Video Metrix.
Magazine Media 360ºTop 10 Magazine Brands
Average Monthly Audience % Growth — Full Year 2017 vs. 2016

MAGAZINE MEDIA 360º013THE ASSOCIATION OF MAGAZINE MEDIA
The Magazine Media 360° Social Media Report complements MPA’s Magazine Media 360° Brand Audience Report, and clearly demonstrates that consumers are enthusiastically interacting with magazine media brands on social platforms.
The report is based on data provided by SocialFlow, exclusively for MPA, which tracks four leading social networks (Facebook, Twitter, Instagram and Pinterest) for about 30 media companies. The only media industry to capture and report brands’ social media performance across networks, magazine brands demonstrate the strong connections they have with online users who are passionate about their content.
The Q1 2018 report shows a universe of 1.1 billion (gross) Likes/Followers across the four social networks tracked. Facebook is the social media behemoth, maintaining the largest share of Likes/Followers and accounting for nearly half of the magazine brand industry active audience. Twitter and Instagram jockey for second place at about one-quarter each of industry Fans, while Instagram notably has registered the highest growth rate since MPA’s reporting began three years ago. Pinterest has the lowest use among the four and has hovered at about only 1% growth each quarter.
Magazine mediaindustry content
attracts 1.1 billionlikes/followers across
the major socialnetworks in
1st quarter 2018
Social Media Report
D ATA P R O V I D E D B Y

MAGAZINE MEDIA 360º014THE ASSOCIATION OF MAGAZINE MEDIA
% Growth in Number of Magazine Media Industry Likes/Followers by Social Network(First Quarter 2018 vs Fourth Quarter 2017)
Total Magazine Media IndustryLikes/Followers by Social Network(as of March 31, 2018)
Growth in number or % of page likes/followers: The absolute or % difference between total number of page likes/followers on March 31, 2018 and total number of page likes/followers on December 31, 2017 for brands that were measured in both periods. Magazine Media Industry: Data shown are collected from about 220 magazine media brands from about 30 companies. Facebook Page Likes, Twitter Followers, Instagram Followers, Pinterest Followers: Number of people who have opted in to receive messages (posts, tweets, or pins) from that particular social entity (page or handle). For Pinterest, includes all those following any or all “boards” on the publisher’s page. All statistics gathered on last day of month. Sources: Facebook, Twitter, Instagram, Pinterest: Automatic collection through the social networks’ APIs (Application Program Interface).
486
(mill
ions
)
Facebook Twitter Instagram Pinterest
280261
29
1.1%
1.9%
4.1%
1.0%
Social Media ReportFirst Quarter 2018 vs. Fourth Quarter 2017

MAGAZINE MEDIA 360º015THE ASSOCIATION OF MAGAZINE MEDIA
Magazine Media Industry: Data shown is collected from about 220 magazine media brands from about 30 companies. Facebook Page Likes, Twitter Followers, Instagram Followers, Pinterest Followers: Number of people who have opted in to receive messages (posts, tweets, or pins) from that particular social entity (page or handle). For Pinterest, includes all those following any or all “boards” on the publisher’s page. All statistics gathered on last day of month. SOURCES: Facebook, Twitter, Instagram, Pinterest: Automatic collection through the social networks’ APIs (Application Program Interface).
TOTAL MAGAZINEMEDIA INDUSTRY
General EditorialLifestyle
Rural LifestyleNews & Information
Current Events & CultureWomen’s Lifestyle
Geographical LifestyleYoung Women’s Lifestyle
Participatory SportsMotorcycles
Business & FinanceGeneral Interest
AutomotiveOutdoor Enthusiast
Women’s Fashion & BeautyBoating & Aviation
Health & FitnessHome & Garden
Parents & KidsWomen’s Service
HobbiesEpicurean
Men’s LifestyleTravel
Spectator SportsScience & Technology
Politics & CommentaryPop Culture & Entertainment
Regional
Social Media Report% Share by Network by Editorial Category, March 31, 2018

MAGAZINE MEDIA 360º016THE ASSOCIATION OF MAGAZINE MEDIA
Social Media ReportTop 10 Magazine Brands—Likes/Followers by Social Network
First Quarter 2018 | January 1–March 31
1 Natl. Geographic Mag 21,990,746 ESPN The Magazine 34,099,496 Natl. Geographic Mag 87,081,963 Harper’s Bazaar 4,552,611
2 ESPN The Magazine 18,704,592 The Economist 23,209,020 Natl. Geographic Traveler 22,817,695 Better Homes and Gardens 1,654,428
3 Time 12,557,189 Time 15,451,855 Vogue 17,866,693 Ski 1,558,187
4 Cosmopolitan 10,238,867 Vogue 13,704,850 ESPN The Magazine 9,643,506 HGTV Magazine 1,209,848
5 Natl. Geo. Adventure 9,545,269 Wired 10,462,365 Playboy 6,438,137 Martha Stewart Living 932,727
6 Men’s Health 8,920,798 The New Yorker 8,549,094 Food Network Magazine 5,926,678 Smithsonian 924,117
7 HGTV Magazine 8,887,394 People 7,881,765 Time 5,225,330 Real Simple 761,965
8 Vogue 8,873,430 Elle 6,876,887 People 4,231,950 Vogue 708,189
9 The Economist 8,518,709 Entertainment Weekly 6,798,728 GQ 4,112,330 This Old House 671,481
10 Women’s Health 8,351,173 Food & Wine 6,689,581 Vanity Fair 3,545,955 Country Living 634,192
SOURCES: Facebook, Twitter, Instagram, Pinterest: Automatic collection through the social networks’ APIs (Application Program Interface).

MAGAZINE MEDIA 360º017THE ASSOCIATION OF MAGAZINE MEDIA
Starting third quarter of 2017, MPA augmented the quarterly Magazine Media 360° Social Media Report with a supplemental metric that measures consumer engagement. The Social Media Engagement Factor quantifies, by brand, by network, the relationship of audience reaction to the content posted by magazine media and non-magazine media brands. It is calculated by comparing the number of Social Actions to the number of Publisher Posts. Numbers support the claim that magazine brands have an undeniable connection with their consumers, resulting in a higher level of engagement. For every quarter monitored, magazine brands outperformed non-magazine brands on three or four of the four networks tracked, establishing magazine media brands as significant social media influencers. The implication is that editorial integrity, authority and inspiration create a unique connection that successfully translates across print and digital platforms to social media communities. In fact, the connection that magazine brands have with their social media following is so strong that, in the majority of cases, it surpasses the ties that social media followers have with even the most popular non-magazine brand sites. The graphs on the following pages provide insight into the relative size and growth of social media networks as used by magazine brands as well as the superior engagement performance of magazine brands vs. non-magazine brands by content category. All of the information in the Social Media Report is based on data provided by SocialFlow, exclusively for MPA.
D ATA P R O V I D E D B Y

MAGAZINE MEDIA 360º018THE ASSOCIATION OF MAGAZINE MEDIA
MPA’s Social Media Engagement Factor for a brand is calculated by comparing the number
of Social Actions (likes, comments, favorites, retweets, repins, sharing, etc.) to the number
of Publisher Posts. Using this methodology, an average Social Media Engagement Factor
is developed for each magazine and non-magazine brand on the four reported social
networks, and a median Engagement Factor is reported by network and content category.
The Social Media Engagement FactorA Formula That Works Across All Social Media Networks

MAGAZINE MEDIA 360º019THE ASSOCIATION OF MAGAZINE MEDIA
Instagram PinterestFacebook Twitter
• Facebook’s high number of posts comes from the huge popularity and size of this network, at 500 million fans of magazine brand pages
• The relatively lower engagement factor stands to reason when the size and potential dilution of the audience is considered
• Industry experts note that engagement tends to decline as fan size increases
• The tremendous volume of content on Facebook also has significant impact on engagement, with a notably greater pool of content for fans to react to
• Facebook’s recent addition of Reaction emotions (angry, sad, etc.) have joined Likes, Comments and Shares as engagement opportunities
• Facebook is known to drive far more click traffic than any of the other three platforms
• Twitter’s fast-paced, concise format makes it easy for a brand, or a person to connect
• Twitter engagement options are limited to two (favorite and retweet)
• Twitter’s format serves as a ‘ticker’ of information, but people consume far more Tweets than they react to
• Celebrities and media figures have successfully leveraged Twitter’s capacity to share timely content, fleeting information, topics, ideas and photos
• Twitter successfully connects strangers around information, rather than people with pre-established relationships
• Twitter’s capacity to support real-time happenings and easily searchable hashtags supports content ‘of the moment’, demonstrated by its having the highest number of publishers’ posts
• Instagram accounts for the highest number of actions by far of the 4 networks measured, but the lowest number of posts
• Instagram’s higher engagement rates are in part due to high use of visuals and limited, user-friendly response icons
• A highly-visual platform rewards magazine media’s highly curated content
• Instagram posts generally must be made from a mobile device, driving mobile usage, but limiting third-party applications and making it more labor-intensive to post
• Instagram generally does not permit click-through to a publisher’s website, so monetization is more difficult
• Pinterest lends itself to rich visuals, based on product, tips/recipes and inspiring ideas, allowing users to curate content found on the internet
• Pinterest’s dynamic of pulling in content from other places to collect in a grouping is in contrast to Instagram’s pushing out of an individual user’s content
• The Pinterest audience may click to buy or find out more about a product, leading to potential for commercial value
• Pinterest pages are far fewer for magazine brands than for the other social networks tracked
Characteristics That Define and Enhance Audience Engagement

MAGAZINE MEDIA 360º020THE ASSOCIATION OF MAGAZINE MEDIA
MAGAZINE MEDIA
Total Likes/Followers 497,038,857 298,697,387 265,092,550 28,949,576
Total Engagement Actions 160,333,335 43,850,049 1,056,352,085 791,865
Total Publisher Posts 185,953 327,592 35,037 64,342
Engagement Factor* (median) 269 24 4,090 10
NON-MAGAZINE MEDIA
Total Likes/Followers 564,657,220 362,142,781 122,499,786 35,351,383
Total Engagement Actions 353,842,875 128,874,913 1,068,780,133 824,715
Total Publisher Posts 244,007 516,497 44,372 94,648
Engagement Factor* (median) 221 29 2,575 8
*SOCIAL MEDIA ENGAGEMENT FACTOR = SOCIAL MEDIA ACTIONS ÷ PUBLISHER POSTSSources: Facebook, Twitter, Instagram, Pinterest: Automatic collection through the social networks’ APIs (Application Program Interface).
Instagram PinterestFacebook Twitter
SOCIAL MEDIA ENGAGEMENT FACTORS BY SOCIAL NETWORK (median) | 2018 QTR 1
Magazine media brands are the original(and still most powerful) influencers
MAGAZINE MEDIA 360º021THE ASSOCIATION OF MAGAZINE MEDIA
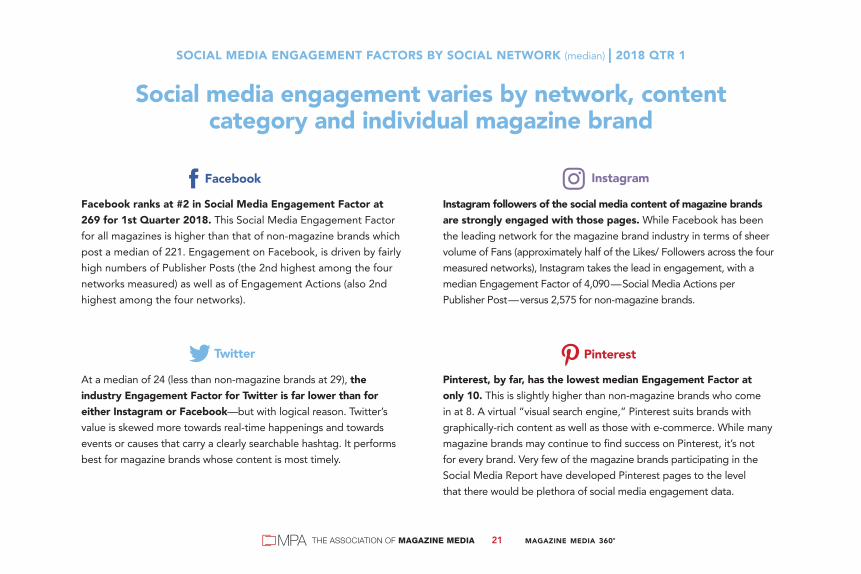
SOCIAL MEDIA ENGAGEMENT FACTORS BY SOCIAL NETWORK (median) | 2018 QTR 1
Social media engagement varies by network, contentcategory and individual magazine brand
Facebook ranks at #2 in Social Media Engagement Factor at 269 for 1st Quarter 2018. This Social Media Engagement Factor for all magazines is higher than that of non-magazine brands which post a median of 221. Engagement on Facebook, is driven by fairly high numbers of Publisher Posts (the 2nd highest among the four networks measured) as well as of Engagement Actions (also 2nd highest among the four networks).
At a median of 24 (less than non-magazine brands at 29), the industry Engagement Factor for Twitter is far lower than for either Instagram or Facebook—but with logical reason. Twitter’s value is skewed more towards real-time happenings and towards events or causes that carry a clearly searchable hashtag. It performs best for magazine brands whose content is most timely.
Instagram followers of the social media content of magazine brands are strongly engaged with those pages. While Facebook has been the leading network for the magazine brand industry in terms of sheer volume of Fans (approximately half of the Likes/ Followers across the four measured networks), Instagram takes the lead in engagement, with a median Engagement Factor of 4,090—Social Media Actions per Publisher Post—versus 2,575 for non-magazine brands.
Pinterest, by far, has the lowest median Engagement Factor at only 10. This is slightly higher than non-magazine brands who come in at 8. A virtual “visual search engine,” Pinterest suits brands with graphically-rich content as well as those with e-commerce. While many magazine brands may continue to find success on Pinterest, it’s not for every brand. Very few of the magazine brands participating in the Social Media Report have developed Pinterest pages to the level that there would be plethora of social media engagement data.

MAGAZINE MEDIA 360º022THE ASSOCIATION OF MAGAZINE MEDIA
Source: Facebook Automatic tabulation through social networks’ APIs (Application Program Interface) collected by SocialFlow. April, 2018
316
282
295
281
269
221
magazine media brands
non-magazine media brands
3500
Q3 2017
Q4 2017
Q1 2018
Social Media Engagement Factor Trends by Quarter: FacebookMagazine brands demonstrate consistency of influence over time

MAGAZINE MEDIA 360º023THE ASSOCIATION OF MAGAZINE MEDIA
Social Media Engagement Factor Trends by Quarter: TwitterMagazine brands demonstrate consistency of influence over time
Source: Twitter Automatic tabulation through social networks’ APIs (Application Program Interface) collected by SocialFlow. April, 2018
Q3 2017
Q4 2017
Q1 2018
350
magazine media brands
non-magazine media brands 34
31
24
23
29
24

MAGAZINE MEDIA 360º024THE ASSOCIATION OF MAGAZINE MEDIA
Source: Instagram Automatic tabulation through social networks’ APIs (Application Program Interface) collected by SocialFlow. April, 2018
3,117
1,620
3,195
2,608
4,090
2,575
45000
Q3 2017
Q4 2017
Q1 2018
magazine media brands
non-mag media brands
Social Media Engagement Factor Trends by Quarter: InstagramMagazine brands demonstrate consistency of influence over time

Source: Pinterest Automatic tabulation through social networks’ APIs (Application Program Interface) collected by SocialFlow. April, 2018
Q3 2017
Q4 2017
Q1 2018
100
magazine media brands
non-magazine media brands
9
8
8
5
10
8
Social Media Engagement Factor Trends by Quarter: PinterestMagazine brands demonstrate consistency of influence over time
MAGAZINE MEDIA 360º025THE ASSOCIATION OF MAGAZINE MEDIA

SOCIAL MEDIA ENGAGEMENT FACTOR BY CATEGORY (median) | 2018 QTR 1
Action and Adventure Enthusiast
SOCIAL MEDIA ENGAGEMENT FACTOR = SOCIAL MEDIA ACTIONS ÷ PUBLISHER POSTS
MagazineMedia Brands
Non-MagazineMedia Brands
371
98
25
4
9,691
1,852
Magazine Media Brands: National Geographic Adventure, Outdoor Life, Outside, Powder, Ski, Snowboarder Magazine, Surfer, Transworld SKATEboarding, TransWorld SNOWboarding. Non-Magazine Media Brands: Grand View Outdoors, On The Snow, Outdoor Channel, OutdoorHub, Section Hiker, Wide Open Spaces.Sources: Facebook, Twitter, Instagram, Pinterest: Automatic tabulation through social networks’ APIs (Application Program Interface) collected by SocialFlow.
MAGAZINE MEDIA 360º026THE ASSOCIATION OF MAGAZINE MEDIA

SOCIAL MEDIA ENGAGEMENT FACTOR BY CATEGORY (median) | 2018 QTR 1
Automotive
SOCIAL MEDIA ENGAGEMENT FACTOR = SOCIAL MEDIA ACTIONS ÷ PUBLISHER POSTS
MagazineMedia Brands
Non-MagazineBrands
295 297
13
26
126
2,211
Magazine Media Brands: 4 Wheel & Off-Road, ATV Rider, Automobile, Car and Driver, Car Craft, Chevy High Performance, Diesel Power, Dirt Rider, European Car, Four Wheeler, Hot Rod, Jp, Lowrider, Motor Trend, Muscle Mustangs & Fast Fords, Mustang Monthly, Road & Track, Street Rodder, Super Chevy, Super Street, Truck Trend, Truckin’, Vette. Non-Magazine Media Brands: AutoBlog, CarBuzz, Cars.com, Carscoops, Chevy Hardcore, Corvette Online, Diesel Army, Dragzine, Drive Tribe, EngineLabs, Ford Muscle, FordNXT, Jalopnik, KBB.com, LSX Magazine, Off Road Xtreme, Rod Authority, Speed Video, Street Muscle, The Fast Lane Truck, Topspeed, Turnology.Sources: Facebook, Twitter, Instagram, Pinterest: Automatic tabulation through social networks’ APIs (Application Program Interface) collected by SocialFlow.
MAGAZINE MEDIA 360º027THE ASSOCIATION OF MAGAZINE MEDIA

SOCIAL MEDIA ENGAGEMENT FACTOR BY CATEGORY (median) | 2018 QTR 1
Business and Finance
SOCIAL MEDIA ENGAGEMENT FACTOR = SOCIAL MEDIA ACTIONS ÷ PUBLISHER POSTS
Magazine Media Brands: Entrepreneur, Fast Company, Fortune, Inc., Money, The Economist. Non-Magazine Media Brands: Business Insider, CNN, CNN Money, Crunchbase, International Business Times, Mainstreet, MarketWatch, Motley Fool, MSN Money, The Balance, TheStreet, Yahoo! Finance, Zero Hedge.Sources: Facebook, Twitter, Instagram, Pinterest: Automatic tabulation through social networks’ APIs (Application Program Interface) collected by SocialFlow.
MagazineMedia Brands
Non-MagazineBrands
202
100
36
53
1,426
2,450
MAGAZINE MEDIA 360º028THE ASSOCIATION OF MAGAZINE MEDIA

SOCIAL MEDIA ENGAGEMENT FACTOR BY CATEGORY (median) | 2018 QTR 1
Current Events and Political Commentary
SOCIAL MEDIA ENGAGEMENT FACTOR = SOCIAL MEDIA ACTIONS ÷ PUBLISHER POSTS
MagazineMedia Brands
Non-MagazineBrands
668 694
143
177
3,938
16,527
Magazine Media Brands: New York Magazine, The Atlantic, The Economist, The New Yorker, Time, Vanity Fair. Non-Magazine Media Brands: Drudge Report, Huffington Post, Motley Fool, NPR, Politico, QZ, Salon, Slate, The Blaze, The Hill, The Root, Vox.Sources: Facebook, Twitter, Instagram, Pinterest: Automatic tabulation through social networks’ APIs (Application Program Interface) collected by SocialFlow.
MAGAZINE MEDIA 360º029THE ASSOCIATION OF MAGAZINE MEDIA

SOCIAL MEDIA ENGAGEMENT FACTOR BY CATEGORY (median) | 2018 QTR 1
Epicurean
SOCIAL MEDIA ENGAGEMENT FACTOR = SOCIAL MEDIA ACTIONS ÷ PUBLISHER POSTS
MagazineMedia Brands
Non-MagazineBrands
311
170
9
111,733
1,972
5
32
Magazine Media Brands: AllRecipes, Bon Appétit, Cooking Light, EatingWell, Food & Wine, Food Network Magazine, Grub Street, Louisiana Cookin’, People Food, Rachael Ray Every Day, Saveur, Taste of Home, Taste of the South. Non-Magazine Media Brands: CD Kitchen, Chowhound, Delish, Food52, Genius Kitchen, Huffington Post Food Beast, HuffPost Kitchen Daily, HuffPost Taste, MyRecipes, OhMyVeggies, Recipe.com, Serious Eats, Simply Recipes, Tasting Table, The Daily Meal, The Kitchn, VegKitchen, Yummly.Sources: Facebook, Twitter, Instagram, Pinterest: Automatic tabulation through social networks’ APIs (Application Program Interface) collected by SocialFlow.
MAGAZINE MEDIA 360º030THE ASSOCIATION OF MAGAZINE MEDIA
SOCIAL MEDIA ENGAGEMENT FACTOR BY CATEGORY (median) | 2018 QTR 1
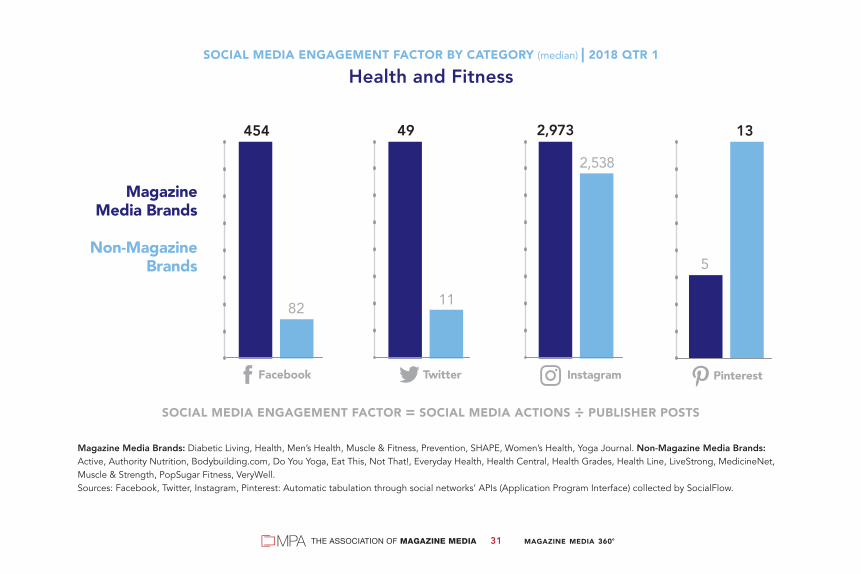
Health and Fitness
SOCIAL MEDIA ENGAGEMENT FACTOR = SOCIAL MEDIA ACTIONS ÷ PUBLISHER POSTS
Magazine Media Brands: Diabetic Living, Health, Men’s Health, Muscle & Fitness, Prevention, SHAPE, Women’s Health, Yoga Journal. Non-Magazine Media Brands: Active, Authority Nutrition, Bodybuilding.com, Do You Yoga, Eat This, Not That!, Everyday Health, Health Central, Health Grades, Health Line, LiveStrong, MedicineNet, Muscle & Strength, PopSugar Fitness, VeryWell.Sources: Facebook, Twitter, Instagram, Pinterest: Automatic tabulation through social networks’ APIs (Application Program Interface) collected by SocialFlow.
MagazineMedia Brands
Non-MagazineBrands
454
82
49
11
2,973
2,538
5
13
MAGAZINE MEDIA 360º031THE ASSOCIATION OF MAGAZINE MEDIA
SOCIAL MEDIA ENGAGEMENT FACTOR BY CATEGORY (median) | 2018 QTR 1
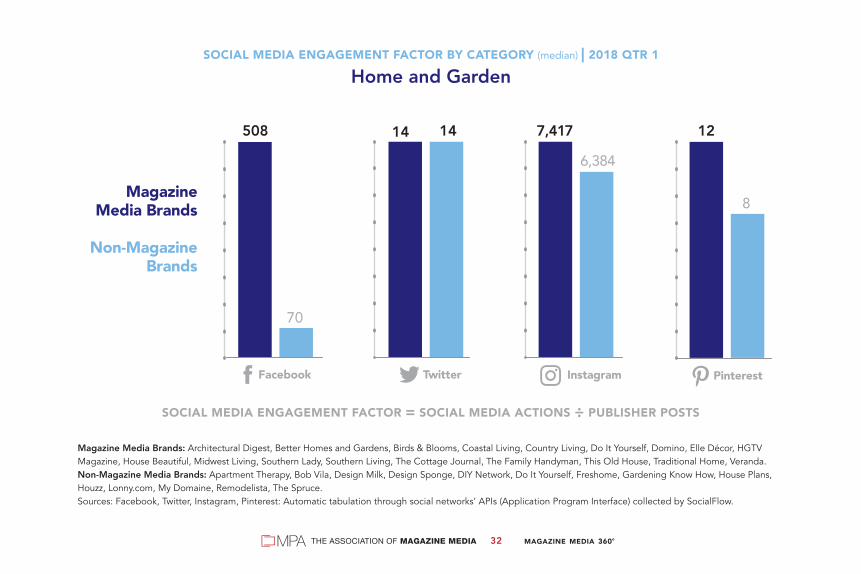
Home and Garden
SOCIAL MEDIA ENGAGEMENT FACTOR = SOCIAL MEDIA ACTIONS ÷ PUBLISHER POSTS
Magazine Media Brands: Architectural Digest, Better Homes and Gardens, Birds & Blooms, Coastal Living, Country Living, Do It Yourself, Domino, Elle Décor, HGTV Magazine, House Beautiful, Midwest Living, Southern Lady, Southern Living, The Cottage Journal, The Family Handyman, This Old House, Traditional Home, Veranda. Non-Magazine Media Brands: Apartment Therapy, Bob Vila, Design Milk, Design Sponge, DIY Network, Do It Yourself, Freshome, Gardening Know How, House Plans, Houzz, Lonny.com, My Domaine, Remodelista, The Spruce.Sources: Facebook, Twitter, Instagram, Pinterest: Automatic tabulation through social networks’ APIs (Application Program Interface) collected by SocialFlow.
MagazineMedia Brands
Non-MagazineBrands
508
70
14 14
6,384
7,417
8
12
MAGAZINE MEDIA 360º032THE ASSOCIATION OF MAGAZINE MEDIA

SOCIAL MEDIA ENGAGEMENT FACTOR BY CATEGORY (median) | 2018 QTR 1
Men’s Fashion, Grooming and Lifestyle
SOCIAL MEDIA ENGAGEMENT FACTOR = SOCIAL MEDIA ACTIONS ÷ PUBLISHER POSTS
Magazine Media Brands: Esquire, GQ, Men’s Health, Men’s Journal, Playboy. Non-Magazine Media Brands: AskMen, Deadspin, Gear Patrol, George Hahn, Hypebeast, The Art of Manliness, The Sartorialist, UrbanDaddy.Sources: Facebook, Twitter, Instagram, Pinterest: Automatic tabulation through social networks’ APIs (Application Program Interface) collected by SocialFlow.
MagazineMedia Brands
Non-MagazineBrands
558
485
5
85 3,317
644
MAGAZINE MEDIA 360º033THE ASSOCIATION OF MAGAZINE MEDIA

SOCIAL MEDIA ENGAGEMENT FACTOR BY CATEGORY (median) | 2018 QTR 1
Popular Culture and Entertainment
SOCIAL MEDIA ENGAGEMENT FACTOR = SOCIAL MEDIA ACTIONS ÷ PUBLISHER POSTS
Magazine Media Brands: Entertainment Weekly, National Enquirer, OK! Magazine, People, People Babies, People Country, People en Español, People Pets, People Style, SI Swimsuit, Soap Opera Digest, Star, Us Weekly, Vanity Fair, Vulture. Non-Magazine Media Brands: AOL Celebrity, A.V. Club, Bossip, BuzzFeed, CNN Entertainment, Deadline Hollywood, E! Online, ET Online, HipHopWired, Hollywood Life, i-D, imdb, Jezebel, Just Jared, Perez Hilton, Pitchfork, Pop Sugar, Quien, Radar Online, Rotten Tomatoes, The Daily Beast, The Wrap, TMZ, Wonderwall.Sources: Facebook, Twitter, Instagram, Pinterest: Automatic tabulation through social networks’ APIs (Application Program Interface) collected by SocialFlow.
MagazineMedia Brands
Non-MagazineBrands
444
334
49
84
5,844
11,718
5
9
MAGAZINE MEDIA 360º034THE ASSOCIATION OF MAGAZINE MEDIA
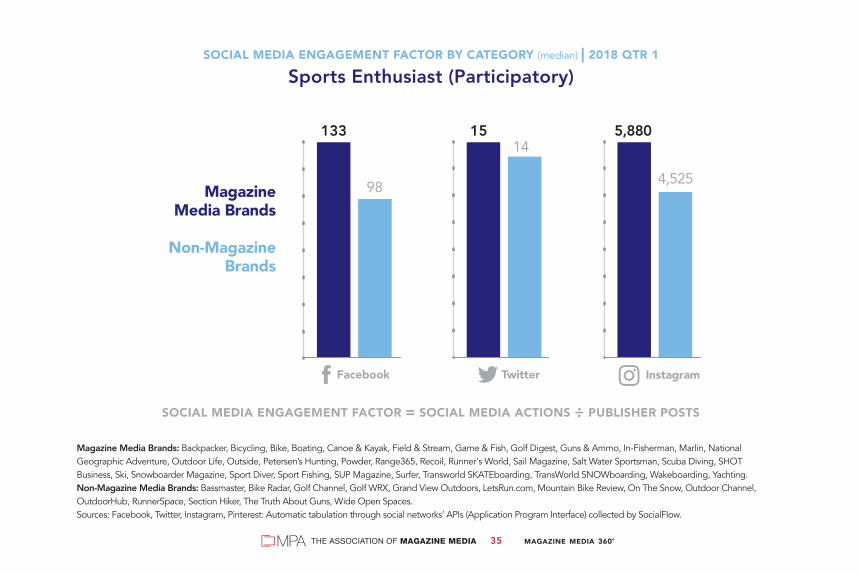
SOCIAL MEDIA ENGAGEMENT FACTOR BY CATEGORY (median) | 2018 QTR 1
Sports Enthusiast (Participatory)
SOCIAL MEDIA ENGAGEMENT FACTOR = SOCIAL MEDIA ACTIONS ÷ PUBLISHER POSTS
MagazineMedia Brands
Non-MagazineBrands
133
98
1415
4,525
5,880
Magazine Media Brands: Backpacker, Bicycling, Bike, Boating, Canoe & Kayak, Field & Stream, Game & Fish, Golf Digest, Guns & Ammo, In-Fisherman, Marlin, National Geographic Adventure, Outdoor Life, Outside, Petersen’s Hunting, Powder, Range365, Recoil, Runner's World, Sail Magazine, Salt Water Sportsman, Scuba Diving, SHOTBusiness, Ski, Snowboarder Magazine, Sport Diver, Sport Fishing, SUP Magazine, Surfer, Transworld SKATEboarding, TransWorld SNOWboarding, Wakeboarding, Yachting. Non-Magazine Media Brands: Bassmaster, Bike Radar, Golf Channel, Golf WRX, Grand View Outdoors, LetsRun.com, Mountain Bike Review, On The Snow, Outdoor Channel, OutdoorHub, RunnerSpace, Section Hiker, The Truth About Guns, Wide Open Spaces.Sources: Facebook, Twitter, Instagram, Pinterest: Automatic tabulation through social networks’ APIs (Application Program Interface) collected by SocialFlow.
MAGAZINE MEDIA 360º035THE ASSOCIATION OF MAGAZINE MEDIA

SOCIAL MEDIA ENGAGEMENT FACTOR BY CATEGORY (median) | 2018 QTR 1
Thought Leader
SOCIAL MEDIA ENGAGEMENT FACTOR = SOCIAL MEDIA ACTIONS ÷ PUBLISHER POSTS
MagazineMedia Brands
Non-MagazineBrands
885
670
156165
5,991
10,696
Magazine Media Brands: Fortune, National Geographic Magazine, New York Magazine, The Atlantic, The Economist, The New Yorker, Time, Wired.Non-Magazine Media Brands: Drudge Report, Huffington Post, NPR, Politico, Poynter, QZ, Salon, Slate, TED.com, The Hill, Vox.Sources: Facebook, Twitter, Instagram, Pinterest: Automatic tabulation through social networks’ APIs (Application Program Interface) collected by SocialFlow.
MAGAZINE MEDIA 360º036THE ASSOCIATION OF MAGAZINE MEDIA

SOCIAL MEDIA ENGAGEMENT FACTOR BY CATEGORY (median) | 2018 QTR 1
Travel
SOCIAL MEDIA ENGAGEMENT FACTOR = SOCIAL MEDIA ACTIONS ÷ PUBLISHER POSTS
Magazine Media Brands: AFAR, Condé Nast Traveler, Departures, Florida Travel + Life, National Geographic Magazine, National Geographic Traveler, Travel + Leisure. Non-Magazine Media Brands: Caribbean Journal, Fodor’s Travel, Frommer's, Lonely Planet, Quintessentially Travel, Travel Channel, Trip Advisor, Trip Savvy, Trips To Discover, Zicasso.Sources: Facebook, Twitter, Instagram, Pinterest: Automatic tabulation through social networks’ APIs (Application Program Interface) collected by SocialFlow.
MagazineMedia Brands
Non-MagazineBrands
1,052
873
6668
8,727
40,908
3
12
MAGAZINE MEDIA 360º037THE ASSOCIATION OF MAGAZINE MEDIA

SOCIAL MEDIA ENGAGEMENT FACTOR BY CATEGORY (median) | 2018 QTR 1
Women’s Fashion and Beauty
SOCIAL MEDIA ENGAGEMENT FACTOR = SOCIAL MEDIA ACTIONS ÷ PUBLISHER POSTS
MagazineMedia Brands
Non-MagazineBrands
545
90
35
56
1,325
11,511
5
7
Magazine Media Brands: Allure, Elle, Glamour, Harper's Bazaar, InStyle, People Style, Seventeen, The Cut, Vogue, W. Non-Magazine Media Brands: Business of Fashion, Byrdie, eHow Fashion & Style, Fashionista, Into The Gloss, Refinery29, StyleBlazer, The Fashion Spot, Total Beauty, Who What Wear.Sources: Facebook, Twitter, Instagram, Pinterest: Automatic tabulation through social networks’ APIs (Application Program Interface) collected by SocialFlow.
MAGAZINE MEDIA 360º038THE ASSOCIATION OF MAGAZINE MEDIA

SOCIAL MEDIA ENGAGEMENT FACTOR BY CATEGORY (median) | 2018 QTR 1
Women’s Service and Lifestyle
SOCIAL MEDIA ENGAGEMENT FACTOR = SOCIAL MEDIA ACTIONS ÷ PUBLISHER POSTS
MagazineMedia Brands
Non-MagazineBrands
358
288 13
175,049
5,428
5
7
Magazine Media Brands: AARP The Magazine, Brides, Cosmopolitan, Family Circle, Glamour, Good Housekeeping, Marie Claire, Martha Stewart Living, Martha Stewart Weddings, MyWedding, O, The Oprah Magazine, Rachael Ray Every Day, Real Simple, Redbook, Seventeen, The Cut, The Strategist, Town & Country, Victoria, Woman’s Day. Non-Magazine Media Brands: Bloglovin’, Bustle, Hello Beautiful, Huffington Post Women, Jezebel, Madame Noire, MSN Lifestyle Network, Oxygen, PopSugar, PureWow, Refinery29, SheKnows, Style Me Pretty, Wedding Wire.Sources: Facebook, Twitter, Instagram, Pinterest: Automatic tabulation through social networks’ APIs (Application Program Interface) collected by SocialFlow.
MAGAZINE MEDIA 360º039THE ASSOCIATION OF MAGAZINE MEDIA

INFLUENCE/IMPACT040THE ASSOCIATION OF MAGAZINE MEDIA
Magazine readersare the strongest
everyday influencersin multiple product
categories
Conversation Catalysts in each category among devoted users of each medium (index)
magazine
Overall media internet* TV radio
Conversation Catalysts® 155 96 91 129
telecom 196 103 94 148
finance 178 90 82 136
wine & spirits 176 97 94 146
children 173 89 80 146
auto 169 94 96 131
home 169 94 90 135
tech 166 103 80 128
household 164 91 90 128
beverage 163 99 94 129
travel 162 88 79 126
sports/recreation 158 95 89 135
retail/apparel 156 97 90 127
health 155 92 91 125
*Includes internet magazine activity and social media activity. Sample size: 31,629Note: Conversation Catalysts® are people with wider social networks who are more involved in their communities and keep informed about more product categories than most Americans, defined according to a proprietary segmentation developed by Engagement LabsIndex: Top quartile of users of each medium vs. adults 18–69.Source: TotalSocial® (January–December 2017) from Engagement Labs

INFLUENCE/IMPACT041THE ASSOCIATION OF MAGAZINE MEDIA
Devoted magazinereaders have manyfriends and spreadtheir ideas over awide social circle
Number of friends among devoted media users (index)
magazines internet* TV radio
15 or more 154 112 117 154
10 or more 151 102 112 148
8 or more 142 103 111 133
Self perception (index) magazines internet* TV radio
Have a wide social circle and enjoy it 134 94 99 123
Get energy by being in a group of people 125 100 115 124
Enjoy entertaining people at home (definitely agree or agree) 116 94 102 109
View social skills as a strength 112 96 103 100
Index: Percentage of top users of each medium vs. percentage of adults 18+.Note: Devoted print magazine readers are defined as those who read printed magazines at least several times per week or digital magazines more than once a day. Devoted radio listeners are those who listen to FM Radio at least two hours a day or AM radio at least one hour a day. Devoted TV viewers are defined as those who watch live or “catch-up” TV at least 31 hours per week. Each group represents approximately the same proportion of US adults 18+. Source: YouGov Profiles, January 2018
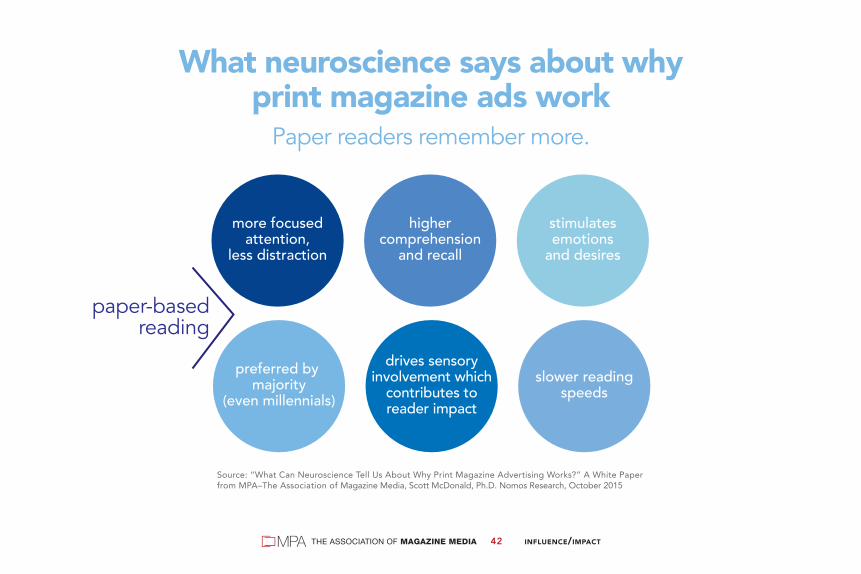
INFLUENCE/IMPACT042THE ASSOCIATION OF MAGAZINE MEDIA
What neuroscience says about whyprint magazine ads work
Paper readers remember more.
paper-basedreading
Source: “What Can Neuroscience Tell Us About Why Print Magazine Advertising Works?” A White Paper from MPA–The Association of Magazine Media, Scott McDonald, Ph.D. Nomos Research, October 2015
highercomprehension
and recall
preferred by majority
(even millennials)
more focusedattention,
less distraction
stimulatesemotions
and desires
slower readingspeeds
drives sensoryinvolvement which
contributes toreader impact

Total number of adults 18+ who read magazines* 2012–2017*Includes digital editionsNote: Measured magazine titles excluding Sunday magazines.Source: GfK MRI, Fall 2012–2017
210.7
214.1215.7
221.9
2012 2013 2014 2015 2016 2017
Audience for#print and #digital
magazines increasedby 3.3 million adults18+ from 2016–2017
Source: GfK MRI, Fall 2012–2017 in m
illio
ns/ 200 million
216.5
INFLUENCE/IMPACT043THE ASSOCIATION OF MAGAZINE MEDIA
225.2
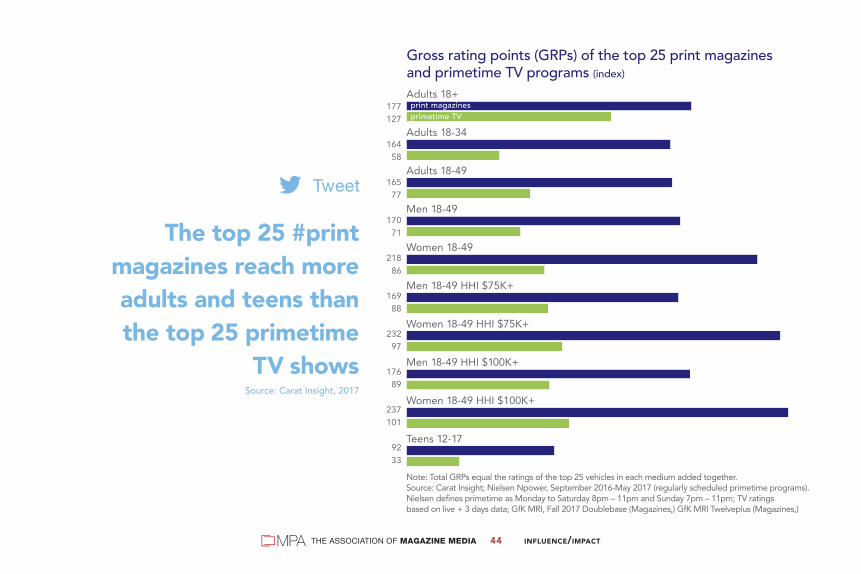
Note: Total GRPs equal the ratings of the top 25 vehicles in each medium added together.Source: Carat Insight; Nielsen Npower, September 2016-May 2017 (regularly scheduled primetime programs). Nielsen defines primetime as Monday to Saturday 8pm – 11pm and Sunday 7pm – 11pm; TV ratings based on live + 3 days data; GfK MRI, Fall 2017 Doublebase (Magazines,) GfK MRI Twelveplus (Magazines,)
177127
16458
16577
17071
21886
16988
23297
17689
237101
9233
Gross rating points (GRPs) of the top 25 print magazinesand primetime TV programs (index)
Adults 18+
Adults 18-34
Adults 18-49
Men 18-49
Women 18-49
Men 18-49 HHI $75K+
Women 18-49 HHI $75K+
Men 18-49 HHI $100K+
Women 18-49 HHI $100K+
Teens 12-17
print magazinesprimetime TV
The top 25 #printmagazines reach moreadults and teens thanthe top 25 primetime
TV showsSource: Carat Insight, 2017
INFLUENCE/IMPACT044THE ASSOCIATION OF MAGAZINE MEDIA

INFLUENCE/IMPACT045THE ASSOCIATION OF MAGAZINE MEDIA
Americans of all ages read magazines— especially younger adults
91% of adults 94% of those under 35
95% of those under 25
Read magazine media in the last six months (print and digital editions)Base: U.S. adults 18+. Source: GfK MRI, Fall 2017
95% of adults 18–29 read magazines vs. 81% who use FacebookSource: Pew Research Center Social Media Fact Sheet, Feb 2018; GfK MRI, Fall 2017
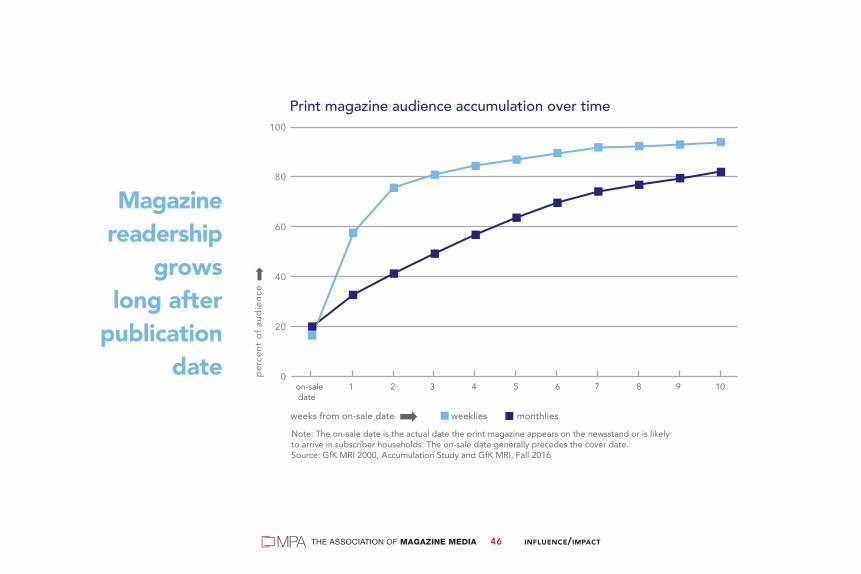
Magazinereadership
growslong after
publicationdate
INFLUENCE/IMPACT046THE ASSOCIATION OF MAGAZINE MEDIA
weeks from on-sale date weeklies monthlies
Note: The on-sale date is the actual date the print magazine appears on the newsstand or is likely to arrive in subscriber households. The on-sale date generally precedes the cover date. Source: GfK MRI 2000, Accumulation Study and GfK MRI, Fall 2016
Print magazine audience accumulation over time
0
20
40
60
80
100
on-sale 1 2 3 4 5 6 7 8 9 10 date
per
cent
of
aud
ienc
e

Print magazine readership by age
total under 25 under 35 35+ 35–49 50+
issues read in past month 8.2 7.2 7.5 8.5 8.8 8.3
index 100 88 92 103 107 101
devoted magazine readers (top quintile) 20.0 16.6 17.5 21.1 21.7 20.7
index 100 83 88 105 109 104
Base: U.S. adults 18+Source: GfK MRI, Fall 2017
Readers of all ages enjoy print magazines
INFLUENCE/IMPACT047THE ASSOCIATION OF MAGAZINE MEDIA

INFLUENCE/IMPACT048THE ASSOCIATION OF MAGAZINE MEDIA
110
60
147
91
138
110
94
79
112
75
92
149
46
111
53
Devoted media usage (top quintile for each medium) (index)
Index: Percent in top quintile within each generation vs. percent in top quintile among adults 18+.Source: GfK MRI, Fall 2017
Boomers (born 1946–1964)
Gen Xers (born 1965–1976)
Millennials (born 1977–1996)
magazines
internet
TV
radio
newspapers
Print #magazineconsumption is
strong acrossgenerations
Source: GfK MRI, Fall 2017

Median age by media usage*Includes internet magazine activity.Note: Magazines and newspaper numbers represent print only.Source: GfK MRI, Fall 2017
Median ageof U.S. adult
population: 47.1
43.1 45.8 48.0 48.8 52.4
*int
erne
t
radi
o
prin
t mag
azin
es TV
new
spap
ers
Devoted #magazinereaders most
closely reflect theU.S. population in age
Source: GfK MRI, Fall 2017
INFLUENCE/IMPACT049THE ASSOCIATION OF MAGAZINE MEDIA

INFLUENCE/IMPACT050THE ASSOCIATION OF MAGAZINE MEDIA
Magazine media readership is diverse
Read magazine media in the last six months (print and digital editions)
African-American adults readan average of 10.8 print
magazine issues per month,compared to 8.2 issues per
month for all U.S. adults.
Source: GfK MRI, Fall 2017
Asian-American adultsread an average of8.0 print magazine
issues per month, closeto the U.S. average.
Hispanic-American adultsread an average of8.7 print magazine
issues per month, higherthan the U.S. average.
Lesbian, Gay, Bisexualand Transgender (LGBT)
adults read an average of8.1 print magazine issues
per month, close to theU.S. average.
African-Americanadults
Asian-Americanadults
Hispanic-Americanadults
LGBTadults
91% 92% 87% 96%

When it comes to influencers,magazine editors are the originals.No one knows their stuff—orYOU—better. Their authentic,authoritative content makesmagazine media more trustedthan any other. No wonder itsprint, online, mobile and videoaudience has grown to 2.0 billion.
Experts you can trust. That’ssomething to believe in.
#BelieveMagMedia | BelieveMagMedia.com
Sour
ces:
MPA
, Tot
al M
agaz
ine
Med
ia 3
60° A
udie
nce,
201
7, B
rand
Aud
ienc
e Re
port;
Sim
mon
s Re
sear
ch, M
ulti-
Med
ia E
ngag
emen
t Stu
dy, S
prin
g 20
17.

INFLUENCE/IMPACT052THE ASSOCIATION OF MAGAZINE MEDIA
Percent lift with increased exposureData is Delta. Delta=Exposed-Control. Number of respondents: 1-2 exposures n=60,259; 3-4 exposures n=12,638; 5+ exposures n=14,789*Print includes newspapers and digital editions of magazines; however, newspapers were represented inless than 10% of the analyzed campaigns and generally represented a small portion of the print media buy.Source: Millward Brown Digital, 2007–2015
Increased exposureto print media
ads boosts keyadvertising metrics brand awareness
print ad awareness
brand favo
rability
brand purchase
intent
7.3
10.8
12.2
8.3
9.510
11.7
13.8
14.2
18.4
17.6
16.9
1–2exposures
3–4exposures
5+exposures

INFLUENCE/IMPACT053THE ASSOCIATION OF MAGAZINE MEDIA
+6%
+4%
+11%
BRANDAWARENESSIssue Readers
PURCHASEINTENT
Issue Readers
PURCHASEINTENT
Issue ReadersWho Saw Ad
Average change, post vs. preData is Delta. Delta=Post-publication of issue – pre-publication of issue.
Total number of ads=472. Total number of respondents to post-publication waves=9,394.Source: Signet Research AdLift studies of 20 isssues of various magazines.
Advertising inmagazines raises
brand awareness andpurchase intent

Across 1,400advertising campaigns,
magazines show thehighest return on
advertising spend—the ultimate KPI
Source: Nielsen Catalina Solutions, 2016
Average return on advertising spend — all studies Note: Nielsen Catalina Solutions comparison of average increase in dollar sales per dollar ofadvertising spend by media in study across 1,400 CPG campaigns.Source: Nielsen Catalina Solutions, Multi-Media Sales Effect Studies from 2004 – Q4 2015
$2.63
magazines display cross media linear TV mobile digital video
$2.55 $2.45
$1.53
$3.94
$2.62
INFLUENCE/IMPACT054THE ASSOCIATION OF MAGAZINE MEDIA

INFLUENCE/IMPACT055THE ASSOCIATION OF MAGAZINE MEDIA
CASE STUDYMagazine campaign drives conversions
to branded prescription drug
Magazine media campaignproduced $18.2 million in
incremental sales for advertisedpharmaceutical brand
ROAS: $8.93Campaign period: May-Dec., 2016
+6%
+22%
Among those with prescription for competing brand or no prescription in category
Among those with priorprescription for brand
Note: Based on comparison of exposed to unexposed.Source: Symphony Health, Meredith Corporation, 2016
Revenue lift due to conversion to prescriptionfor advertised brand after exposure

INFLUENCE/IMPACT056THE ASSOCIATION OF MAGAZINE MEDIA
Advertising in magazine mediaincreases sales across product categories
Bea
uty
Food
Hea
lth
HH
Goo
ds
Pet C
are
Phar
ma
Reta
il
Tota
l Prin
t
12%11%
9%
6%
22%
19%
12%
7%
$10.37 $6.62 $7.06 $4.85 $8.61 $8.93 $18.59 $7.54
Households exposed to magazine
media campaigns spent significantly
more than those not exposed
(test vs. control). Positive ROI for
all categories ranged from
$1.21 to $18.59 incremental
for every media dollar spent.
Note: Based on comparison exposed to matched unexposed control. Average dollar purchases per household/year (includes non-buyers). Number of brands per category: Beauty (21), Food (53), Health (8), Household Goods (7), Pet Care (8), Pharma (1), Retail (1).Source: Meredith Corporation/Nielsen Catalina Solutions/Symphony Health/Nielsen Buyers Insights
Average ROI for Print

INFLUENCE/IMPACT057THE ASSOCIATION OF MAGAZINE MEDIA
Advertising in magazinemedia increases sales on both
print and digital platformsB
eaut
y
Food
HH
Goo
ds
Pet C
are
Reta
il
Tota
l Dig
ital
12%
8%
4%
6%
2%
6%
$5.04 $4.94 $3.56 $1.74 $16.95 $5.50
Note: Based on comparison exposed to matched unexposed control.Average dollar purchases per household/year (includes non-buyers).Number of brands per category: Beauty (1), Food (13), Household Goods (4), Pet Care 2), Retail (2).Source: Meredith Corporation/Nielsen Catalina Solutions
Average ROI for Premium Digital
Bea
uty
Food
OTC
HH
Goo
ds
Reta
il
Tota
l Int
egra
ted
26%
10%
7%
3%
19%
11%
$1.21 $5.42 $3.65 $3.96 $3.81 $4.65
Note: Based on comparison exposed to matched unexposed control.Average dollar purchases per household/year (includes non-buyers).Number of brands per category: Beauty (1), Food (10), OTC (2), Household Goods (2), Retail (1).Source: Meredith Corporation/Nielsen Catalina Solutions
Average ROI for Integrated

INFLUENCE/IMPACT058THE ASSOCIATION OF MAGAZINE MEDIA
The power of maga ine brandsacross all platforms
Whether in print or on a digital platform, magazine media boost salesand generate strong returns on advertising spend
Positive ROI for all measured categoriesadvertised in Meredith print magazines
ranging from $4.85 to $18.59
Positive ROI for all measured categoriesadvertised in Meredith digital magazines
ranging from $1.74 to $16.95
Positive ROI for all measured categoriesadvertised in Meredith print and digitalmagazines ranging from $1.21 to $5.42
+12%
+6%
+11%
Data are averages over 99 campaigns in Meredith print magazines, 22 campaigns in Meredithbrand digitl properties, and 16 integrated print and digital campaigns.Note: ROI defined as incremental sales generated per media dollar spent, no margin applied.Source: Meredith Corporation/Nielsen Catalina Solutions/Symphony Health/Nielsen Buyers Insights 2011–2018
Meredith rintROI: $7.54
Meredith DigitalROI: $5.50
Meredith ntegratedROI: $4.65
average sales lift

With fake news leaving mostAmericans confused about eventhe basic facts, magazine mediakeeps it real. Whether in print,online, on mobile or video, peopletrust it to be expertly researched,written and fact-checked. Nowonder magazine readers aremore engaged and more likely torecommend advertised products.
Being real matters. That’s a fact.
#BelieveMagMedia | BelieveMagMedia.com
Sour
ce: 2
017
Surv
ey, P
ew R
esea
rch
Cent
er, G
fK M
RI, S
prin
g 20
17

INFLUENCE/IMPACT060THE ASSOCIATION OF MAGAZINE MEDIA
While trust in platforms declines,trust in journalism rebounds
Percent trust in each source for general news and information, 2012 to 2018
Source: 2018 Edelman Trust Barometer. COM_MCL. When looking for general news and information, how much would you trust each type of source for general news and information? Please use a nine-point scale where one means that you “do not trust it at all” and nine means that you “trust it a great deal.” (Top 4 Box. Trust), question asked of half of the sample. General population, 25-country global total.Journalism is an average of traditional media and online-only media. Platforms is an average of search engines and social media.
2012 2013 2014 2015 2016 2017 2018
54
53
52
50
54
53
54
51
56
54
53
51
54
59 +5journalism
-2platforms
Average trust in traditional andonline-only media
Average trust in search enginesand social media platforms

INFLUENCE/IMPACT061THE ASSOCIATION OF MAGAZINE MEDIA
Source: 2018 Edelman Trust Barometer. COM_MCL. When looking for general news and information, how much would you trust each type of source for general news and information? Please use a nine-point scale where one means that you “do not trust it at all” and nine means that you “trust it a great deal.” (Top 4 Box. Trust), question asked of half of the sample. General population U.S.Journalism is an average of traditional media and online-only media. Platforms is an average of search engines and social media.
2012 2013 2014 2015 2016 2017 2018
57
56
5153
35
55
28
57
35
54
32
65
58 +0journalism
-11platforms
Traditional mediaOnline-only media From 2012-2015, “Hybrid Media” was included as a media type. In 2016, it was changed to “Online-only media.”
Search enginesFrom 2012-2015, “Online Search Engines” were included as a media type. In 2016, it was changed to “Search Engines.”
Social media
U.S. trust in journalism stable,trust in platforms declines
Percent trust in each source for general news and information in the U.S.
40 41
30
5256
5256
58
4048
3841
39
5047
change2017–2018
INFLUENCE/IMPACT062THE ASSOCIATION OF MAGAZINE MEDIA
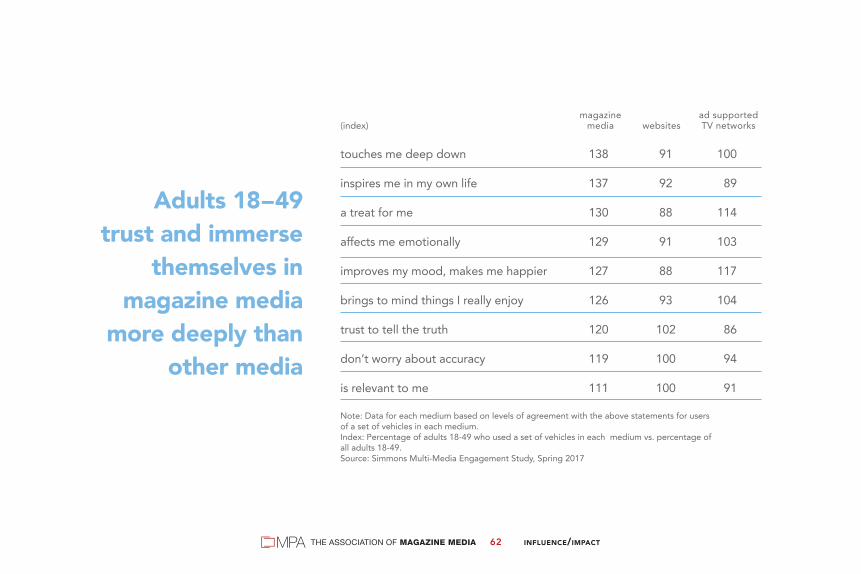
Adults 18–49trust and immerse
themselves inmagazine media
more deeply thanother media
magazine ad supported(index) media websites TV networks
touches me deep down 138 91 100
inspires me in my own life 137 92 89
a treat for me 130 88 114
affects me emotionally 129 91 103
improves my mood, makes me happier 127 88 117
brings to mind things I really enjoy 126 93 104
trust to tell the truth 120 102 86
don’t worry about accuracy 119 100 94
is relevant to me 111 100 91
Note: Data for each medium based on levels of agreement with the above statements for users of a set of vehicles in each medium.Index: Percentage of adults 18-49 who used a set of vehicles in each medium vs. percentage of all adults 18-49. Source: Simmons Multi-Media Engagement Study, Spring 2017

INFLUENCE/IMPACT063THE ASSOCIATION OF MAGAZINE MEDIA
11894
100
11594
100
1159993
11291
108
11095
102
1109897
ad attention/receptivity
inspirational
life-enhancing
personal time-out
social interaction
trustworthy
Appropriateness of description for each medium (index)
Notes: Data for each medium based on composite scores for a set of vehicles in each medium. TV data are for ad-supported programs only.Index: Composite scores of adults 18-49 who used a set of vehicles in each medium vs. composite scores of adults 18-49 who used any of the magazine media, websites and TV vehicles.Source: Simmons Multi-Media Engagement Study, Spring 2017
magazine mediawebsitesTV
Adults 18–49value and take
inspiration from#magmedia
Source: Simmons Research, Spring 2017

INFLUENCE/IMPACT064THE ASSOCIATION OF MAGAZINE MEDIA
Magazine readers believe in brands—and are heavily swayed by advertising
Definitely agree or agree that . . . (index) magazines Internet* TV radio
I choose branded drugs because they are higher quality 144 99 126 130
I am willing to pay more for luxury brands 134 104 118 114
People tend to ask me for advice before buying things 132 103 108 112
I will buy some brands without even looking at the price 131 104 121 122
I have expensive tastes 125 102 112 109
Well-known brands tend to be better than generic brands 122 102 111 113
I tend to choose premium products and services 121 96 109 117
Advertising helps me choose what I buy 121 101 115 117
I like trying new brands 112 102 107 104
I don’t mind paying extra for quality 107 98 98 103
*Includes internet magazine activity.Index: Percentage of top users of each medium vs. percentage of adults 18+.Note: Devoted print magazine readers are defined as those who read printed magazines at least several times per week or digital magazines more than once a day. Devoted Internet users are those who use it at least 30 hours per week. Devoted radio listeners are those who listen to FM Radio at least two hours a day or AM radio at least one hour a day. Devoted TV viewers are defined as those who watch live or “catch-up” TV at least 31 hours per week. Each group represents approximately the same proportion of US adults 18+. Source: YouGov Profiles, March 2018

INFLUENCE/IMPACT065THE ASSOCIATION OF MAGAZINE MEDIA
magazine ad supported(index) media websites TV networks
ads fit well with the content 147 92 94
ads help make purchase decisions 147 93 97
products/services advertised are high quality 146 89 94
has ads about things I care about 144 91 94
more likely to buy products in ads 143 93 97
get valuable info from the ads 142 91 94
Note: Data for each medium based on levels of agreement with above statements for a set of vehicles in each medium.Index: Percentage of adults 18-49 who used a set of vehicles in each medium vs. percentage of all adults 18-49 who used any of these magazine media, websites, and TV vehicles.Source: Simmons Multi-Media Engagement Study, Spring 2017
Ads in magazinemedia engageadults 18–49
more than adsin other media

INFLUENCE/IMPACT066THE ASSOCIATION OF MAGAZINE MEDIA
Advertising effectiveness by position noted action taken*
first quarter of book 55% 64%
second quarter of book 50 64
third quarter of book 50 65
fourth quarter of book 52 65
* Among those who notedNote: Includes all ads, size/color and cover positions.Source: GfK MRI Starch, July 2016–June 2017
Action taken includes:• have a more favorable opinion about the advertiser
• consider purchasing the advertised product or service
• gather more information about the advertised product or service
• recommend the product or service
• visit the advertiser’s website
• purchase the product or service
• clip or save the ad
• visit or plan to visit a dealership
Print #magazines inspire readers to take action—to clip ads, recommend products and buy them
Source: GfK MRI Starch, July 2016–June 2017

INFLUENCE/IMPACT067THE ASSOCIATION OF MAGAZINE MEDIA
Impact of print magazine advertising noted action taken*
all ads 52% 65%
AD SIZEmultiple pages (excluding spreads) 66 65
gatefold ads 60 63
spread 52 62
full page 51 64
half page 45 69
third page 44 69
less than half page 44 69
COLORfour color 52 65
black and white 44 61
PREMIUM POSITIONinside front cover 76 64
inside back cover 61 64
back cover 63 65
adjacent to table of contents 58 64
*Among those who notedSource: GfK MRI Starch Advertising Research, July 2016 – June 2017
Print magazineadvertising is noticed
and acted on regardlessof size or placement
65% of readers takeaction after seeing aprint #magazine ad
Source: GfK MRI Starch Advertising Research,July 2016 – June 2017
INFLUENCE/IMPACT068THE ASSOCIATION OF MAGAZINE MEDIA
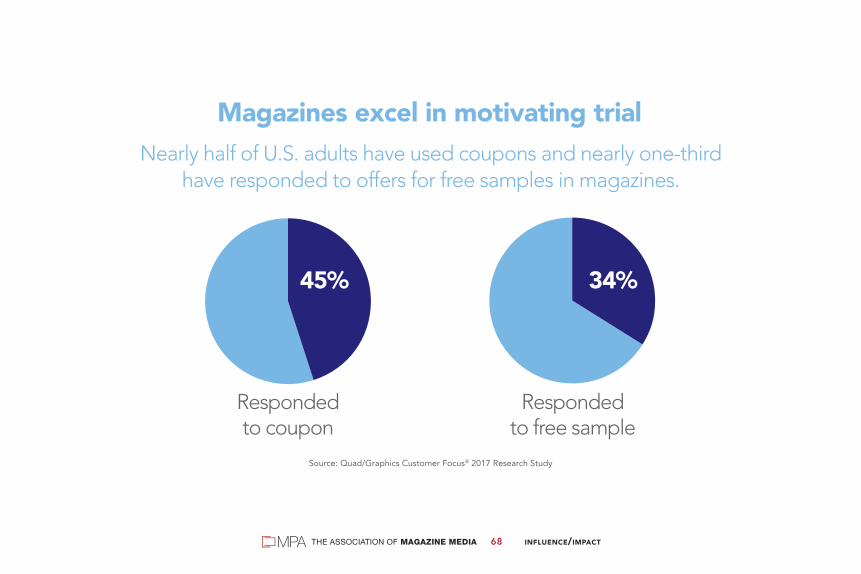
Respondedto coupon
Respondedto free sample
45% 34%
Magazines excel in motivating trialNearly half of U.S. adults have used coupons and nearly one-third
have responded to offers for free samples in magazines.
Source: Quad/Graphics Customer Focus® 2017 Research Study

INFLUENCE/IMPACT069THE ASSOCIATION OF MAGAZINE MEDIA
Number of times medium ranks #1 among affluent influential consumers across 60 product categories*Includes internet magazine activity. Base: Top quintile of users of each medium among adults with HHI of $75K+. Category influentials are defined as people who have great experience in this topic and whose advice on this topic is trusted by friends and family members. Source: GfK MRI, Spring 2017
22
18
9
7
4
print internet* newspapers radio TVmagazines
Print #magazinesare no. 1 in reaching
affluent influentialconsumers in more
categories thanother mediaSource: GfK MRI, Spring 2017

INFLUENCE/IMPACT070THE ASSOCIATION OF MAGAZINE MEDIA
Super influentialsin a wide range
of categories aredevoted print
magazine readers
Super influentials among devoted media users (index)
*Includes internet magazine activity. Index: Percentage of super influentials within top quintile of users of each medium vs. percentage of super influentials among adults 18+. Note: Super influentials are defined as people who have great experience in this topic and whose advice on this topic is trusted by friends and family members, and who recommend products or services on this topic to others. Source: GfK MRI, Spring 2017
household furnishings
interior decorating
wine
cleaning products
vacation travel
143129
74122
90
141102
59117
71
1308883
129108
121116
93104
98
114112
45112
97
print magazinesinternet*TVradionewspapers

INFLUENCE/IMPACT071THE ASSOCIATION OF MAGAZINE MEDIA
116101102108104
11198
107100102
110105111104106
109100
8699
102
107103
92102
95
automotive
healthcare
finance
vacation travel
food
*Includes internet magazine activity. Index: Percentage of recommenders within top quintile of users of each medium with HHI of $75K+ vs.percentage of recommenders among adults 18+ with HHI of $75K+. Recommenders are defined as people who say they have recommended products or services to others in the past 12 months within a category. Source: GfK MRI, Spring 2017
Trusted recommenders among affluent devoted media users (index)
print magazinesinternet*TVradionewspapers
Among affluentconsumers, devoted
print magazinereaders are trusted
recommenders acrossproduct categories
Source: GfK MRI, Spring 2017

INFLUENCE/IMPACT072THE ASSOCIATION OF MAGAZINE MEDIA
*Includes internet magazine activity. Index: Top quintile of users of each medium vs. all adults 18+.Source: GfK MRI, Spring 2017
119115
85107103
118116105112
97
117118
95101
97
115100105103105
purchase or lease a sport utility vehicle
buy a used vehicle
lease a vehicle
purchase or lease a van/minivan
Very likely actions among devoted media users (index)
magazinesinternet*TVradionewspapers
Print magazinesdeliver consumers
with strongauto purchase
intent
INFLUENCE/IMPACT073THE ASSOCIATION OF MAGAZINE MEDIA
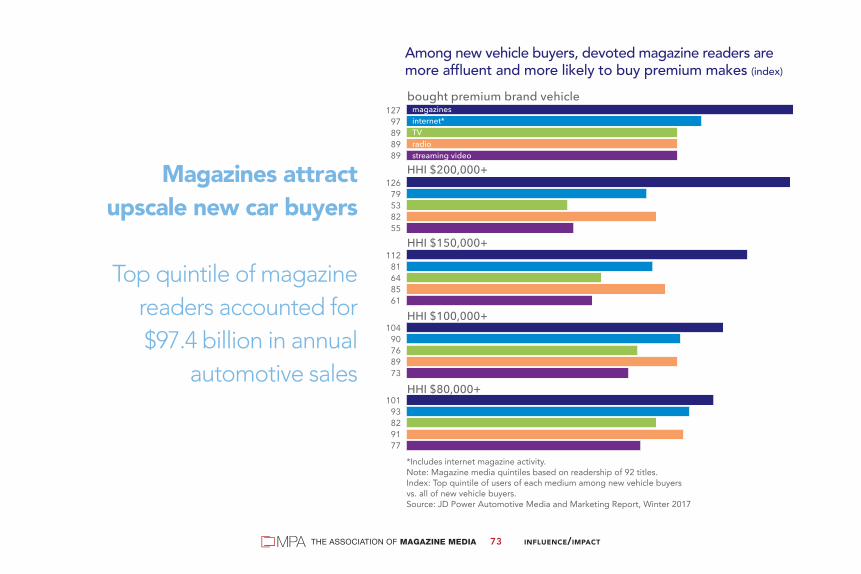
*Includes internet magazine activity. Note: Magazine media quintiles based on readership of 92 titles.Index: Top quintile of users of each medium among new vehicle buyersvs. all of new vehicle buyers. Source: JD Power Automotive Media and Marketing Report, Winter 2017
Magazines attractupscale new car buyers
Top quintile of magazinereaders accounted for$97.4 billion in annual
automotive sales
12797898989
12679538255
11281648561
10490768973
10193829177
bought premium brand vehicle
HHI $200,000+
HHI $150,000+
HHI $100,000+
HHI $80,000+
Among new vehicle buyers, devoted magazine readers aremore affluent and more likely to buy premium makes (index)
magazinesinternet*TVradiostreaming video

INFLUENCE/IMPACT074THE ASSOCIATION OF MAGAZINE MEDIA
143114106117120
138111
84120
86
129113
99107
89
111106
698655
Luxury goods category influencers among affluentdevoted media users (index)
*Includes internet magazine activity. +Other than clothes and shoesIndex: Percentage of category influentials within the top quintile of users of each mediumamong adults 18+ with HHI of $75K+ vs. percentage of category influentials among adultswith HHI of $75K+. Category influentials are defined as people who have great experiencein the topic and whose advice on this topic is trusted by friends and family members.Source: GfK MRI, Spring 2017
household furnishings
interior decorating
shopping
fashion – other+
print magazinesinternet*TVradionewspapers
Affluent luxurygoods categoryinfluencers aredevoted print
magazine readers

*Includes internet magazine activity. Index: Individual medium vs. average for all mediaSource: GfK MRI, Spring 2017
Consumers, especiallyaffluent ones, use
print magazines tokeep up with
the latest styles
148
123
104
147
35
43
151
137
110
134
31
37
Medium keeps me up-to-date with the latest styles and trends (index)
Adults with HHI $75K+
All adultsmagazines
internet*
mobile web
TV
radio
newspapers
INFLUENCE/IMPACT075THE ASSOCIATION OF MAGAZINE MEDIA

INFLUENCE/IMPACT076THE ASSOCIATION OF MAGAZINE MEDIA
166
147
110
115
89
I spend a lot of money on beauty and skin care products–Agree (index)
Magazine media readers lead spendingon beauty and skin care products
*Includes internet magazine activity.Index: Top quintile of users of each medium vs. adults 18+.Source: Kantar Media, MARS Consumer Health Study, 2017
magazines
internet*
TV
radio
newspapers
INFLUENCE/IMPACT077THE ASSOCIATION OF MAGAZINE MEDIA
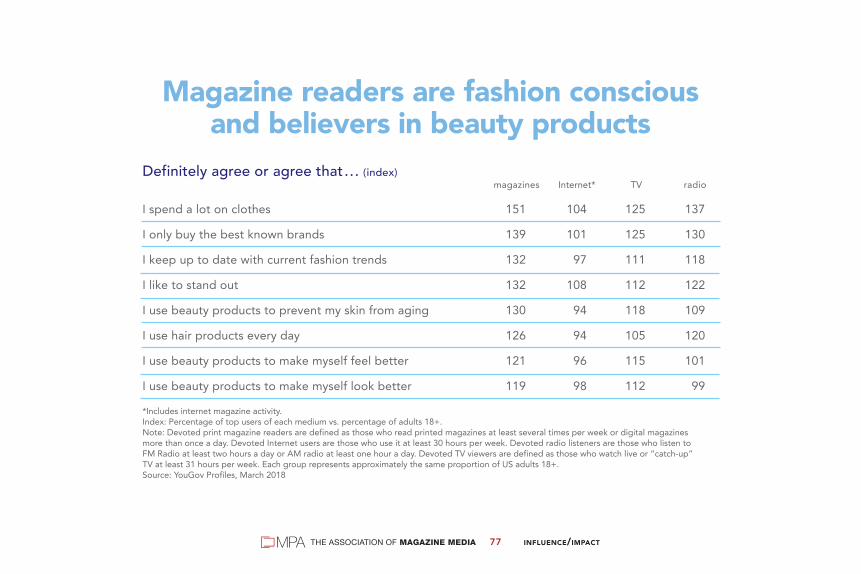
Magazine readers are fashion consciousand believers in beauty products
Definitely agree or agree that . . . (index) magazines Internet* TV radio
I spend a lot on clothes 151 104 125 137
I only buy the best known brands 139 101 125 130
I keep up to date with current fashion trends 132 97 111 118
I like to stand out 132 108 112 122
I use beauty products to prevent my skin from aging 130 94 118 109
I use hair products every day 126 94 105 120
I use beauty products to make myself feel better 121 96 115 101
I use beauty products to make myself look better 119 98 112 99
*Includes internet magazine activity.Index: Percentage of top users of each medium vs. percentage of adults 18+.Note: Devoted print magazine readers are defined as those who read printed magazines at least several times per week or digital magazines more than once a day. Devoted Internet users are those who use it at least 30 hours per week. Devoted radio listeners are those who listen to FM Radio at least two hours a day or AM radio at least one hour a day. Devoted TV viewers are defined as those who watch live or “catch-up” TV at least 31 hours per week. Each group represents approximately the same proportion of US adults 18+. Source: YouGov Profiles, March 2018

When searching for real health advice,you shouldn’t have to trust your gut.Trust magazine brands instead.
Whether in print, online, on mobile or video, people believe magazine media more than any other. No wonder it’s more engaging and drives more healthcare and pharmaceuticalactions. Magazines have expertlyresearched content and a safeenvironment that makes everyonefeel a whole lot better.
#BelieveMagMedia | BelieveMagMedia.com
SISICCKK OOFF PHPHONYHEAHEALTLTL H
EEXXPERTS ? Sour
ces:
Sim
mon
s Re
sear
ch, M
ulti-
Med
ia E
ngag
emen
t Stu
dy, S
prin
g 20
17;
Kant
ar M
edia
, MAR
S Co
nsum
er H
ealth
Stu
dy, 2
017.

INFLUENCE/IMPACT079THE ASSOCIATION OF MAGAZINE MEDIA
*Includes internet magazine activity. Index: Percentage of super influentials among top quintile of users of each medium vs.percentage of super influentials among adults 18+. Super influentials are defined as peoplewho have great experience in this topic, whose advice on this topic is trusted by friendsand family members and who recommend products or services on this topic to others. Source: GfK MRI, Spring 2017
Super influential consumers for healthcarecategories among devoted media users (index)
13291
106105
92
120104
64114100
117110
79100
77
prescription drugs
healthcare
dieting
print magazines
internet*
TV
radio
newspapers
Print magazinesexcel in reachingsuper influential
consumers in#healthcareSource: GfK MRI, Spring 2017

INFLUENCE/IMPACT080THE ASSOCIATION OF MAGAZINE MEDIA
Agreement with statements and opinions about pharmaceuticals and healthcare (index)
magazine media internet* TV radio newspapersI am first among my peers to investigate vaccines that are recommended but not required 154 111 126 116 118Friends come to me for advice about healthcare and medications 147 109 109 127 109It’s worth paying more for branded prescription medications rather than getting generic products 145 111 113 109 108I research treatment options on my own and then ask my doctor about them 137 104 101 119 96I research healthcare information so that I am better informed about different healthcare treatment options 135 108 102 109 105I often discuss new prescription medicines with my doctor 134 96 119 105 110I typically conduct research online prior to a doctor’s appointment 132 121 91 118 84I am willing to ask my doctor for a prescription medication or drug sample that I have seen or heard advertised 131 98 115 104 104I am willing to pay extra for prescription drugs not covered by health insurance 126 100 94 108 115I am willing to ask my doctor for a vaccine that I have seen or heard advertised 121 100 114 99 114I am better informed about my health than most people 118 95 103 105 115*Includes internet magazine activity.Index: Top quintile of users of each medium vs. adults 18+.Source: Kantar Media, MARS Consumer Health Study, 2017
Devoted magazine readers are the most informedand engaged healthcare/pharma customers

INFLUENCE/IMPACT081THE ASSOCIATION OF MAGAZINE MEDIA
Magazine media advertising drives consumerhealthcare actions more than advertising anywhere else
Actions taken in the last 12 months as a result of healthcare advertising (index)
magazine media internet* TV radio newspapers
Used a coupon 225 114 134 143 120
Discussed an ad with your doctor 221 93 137 179 95
Consulted a pharmacist 211 121 128 105 161
Discussed an ad with a friend or relative 209 140 114 134 113
Visited any website 205 148 106 135 118
Watched a video online 202 186 156 178 120
Conducted an online search 195 140 110 121 131
Purchased a non-prescription product 190 128 150 140 149
Made an appointment to see a doctor 171 130 131 126 105
Took medication 169 129 156 96 131
Refilled a prescription 157 121 133 116 117
*Includes internet magazine activity.Index: Top quintile of users of each medium vs. adults 18+.Source: Kantar Media, MARS Consumer Health Study, 2017

#Magmedia readers are the most health-conscious consumersSource: Kantar Media, MARS Consumer Health Study, 2017
Agreement with statements and opinions about pharmaceuticals and healthcare (index)
magazine media internet* TV radio newspapers
As a preventative measure it is important my children take vitamins every day 143 102 101 131 75
I refer my friends to certain websites I find helpful 140 127 108 130 104
Diet plans usually work for me 138 102 96 114 113
I take non-prescription medicine as soon as I get sick 125 114 114 121 94
Exercise is important to my diet and nutrition plan 120 93 90 105 109
I believe that vitamins and nutritional supplements make a difference in long-term health 118 93 109 117 104
I do everything I can to promote and maintain my personal health and wellness 112 93 91 101 105
*Includes internet magazine activity.Index: Top quintile of users of each medium vs. adults 18+.Source: Kantar Media, MARS Consumer Health Study, 2017
INFLUENCE/IMPACT082THE ASSOCIATION OF MAGAZINE MEDIA

Magazinemedia readerstake action to
maintaintheir health
*Includes internet magazine activity. Base: Those who had been to any doctor in the last 12 months.Index: Top quintile of users of each medium vs. adults 18+. Source: Kantar Media, MARS Consumer Health Study, 2017
193128112128144
177133126130128
175156105133
99
136123101114109
134103107114120
Actions taken after seeing medical professionalsin the last 12 months (index)
Visited a social media site related to a condition or prescribed treatment
Conducted an online search about a drug or treatment options
Looked into alternative treatments after receiving prescription
Conducted an online search about a condition
Made an effort to eat healthier or exercise more
magazinesinternet*TVradionewspapers
INFLUENCE/IMPACT083THE ASSOCIATION OF MAGAZINE MEDIA

Household income $250K+ (index)*Includes internet magazine activity. Index: Top quintile of users of each medium vs. adults 18+. Source: GfK MRI, Fall 2017
128
114 114
82
49
print internet* newspapers radio TVmagazines
Households withincome of $250K+
are drawn to#magazines
Source: GfK MRI, Fall 2017
INFLUENCE/IMPACT084THE ASSOCIATION OF MAGAZINE MEDIA

INFLUENCE/IMPACT085THE ASSOCIATION OF MAGAZINE MEDIA
Households withthe greatest
financial assetsfavor #magmedia
Source: Ipsos Affluent Survey USA, Fall 2017
136
102
130
98
92
103
122
102
113
95
95
101
Affluent magazine readers beat others innet worth and liquid assets (index)
Median household liquid assets
Median household net worth
*Includes digital magazine reading. +Includes internet magazine activity. Index: Median household net worth and median liquid assets for top quintile of usersof each medium (based on number of issues (magazines), hours (TV), internet, radio), activities (mobile web) or apps used regularly (mobile apps) among adults18+ with HHI $125K+ vs. medians for all adults 18+ with HHI $125K+Source: Ipsos Affluent Survey USA, Fall 2017
magazines*
internet+
TV
radio
mobile web
mobile apps

INFLUENCE/IMPACT086THE ASSOCIATION OF MAGAZINE MEDIA
Affluent #magazinereaders charge moreto their credit cardsthan consumers of
other mediaSource: Ipsos Affluent Survey USA, Fall 2017
*Includes digital magazine reading. +Includes internet magazine activity. Index: Top quintile of users of each medium among adults 18+ with HHI $125K+vs. all adults 18+ with HHI $125K+. Source: Ipsos Affluent Survey USA, Fall 2017
140127120102115115
131
123
128
110
110
113
109
102
106
103
103
106
Average monthly charges of $1,000 or more (index)
American Express
Mastercard
Visa
magazines*
internet+
TV
radio
mobile web
mobile apps

INFLUENCE/IMPACT087THE ASSOCIATION OF MAGAZINE MEDIA
magazines+
internet*TVradiomobile webmobile apps
157141132108141132
136119130108111128
130107117
99103106
121107117111105108
11397
102101
98103
used a private banker
used a wealth advisor
used full-service broker
used financial planner
used a CPA
Financial consultant used by anyone in household in past 12 months (index)
+ Includes digital magazine reading. *Includes internet magazine activity. Index: Top quintile of users of each medium, based on number of issues (magazines), hours(TV, internet, radio), activities (mobile web) or apps used regularly (mobile apps), amongadults 18+ with HHI $125K+ vs. all adults 18+ with HHI $125K+.Source: Ipsos Affluent Survey USA, Fall 2017
Magazine media:Where to findactive affluent
investors

INFLUENCE/IMPACT088THE ASSOCIATION OF MAGAZINE MEDIA
magazines+internet*TVradiomobile webmobile apps
153110123122126131
147128135127131125
146119120123126125
129115123123122122
121103114112111112
open or move a non-retirement account
refinance a mortgage
use or change financial planner
open or move a retirement account
invest in stocks, mutual funds, etc.
Financial services planned by anyone in householdin next 12 months (index)
+ Includes digital magazine reading. *Includes internet magazine activity. Index: Top quintile of users of each medium, based on number of issues (magazines), hours(TV, internet, radio), activities (mobile web) or apps used regularly (mobile apps), amongadults 18+ with HHI $125K+ vs. all adults 18+ with HHI $125K+.Source: Ipsos Affluent Survey USA, Fall 2017
Magazine media:Where to find
affluent users offinancial services

INFLUENCE/IMPACT089THE ASSOCIATION OF MAGAZINE MEDIA
Luxury goods andservices category
influencers aredevoted print
#magazine readersSource: GfK MRI, Spring 2017
Luxury goods and services category influencers amongdevoted media users (index)
print news- magazines internet* TV radio papers
interior decorating 135 122 76 117 82
other fashion+ 130 130 81 114 63
real estate 126 115 69 100 126
finance/investment 121 119 68 95 116
vacation travel 118 114 58 101 104
+Not including clothes or shoes. *Includes internet magazine activity.Index: Percentage of category influentials within top quintile of users of each medium vs. percentage of category influentials among all adults. Category influentials are defined as people who have great experience in this topic, whose advice on this topic is trusted byfriends and family members. Source: GfK MRI, Spring 2017

INFLUENCE/IMPACT090THE ASSOCIATION OF MAGAZINE MEDIA
Affluent devoted magazine readers very likelyto remodel in the next 12 months
111
93
85
98
109
Very likely to remodel at least one room in the next 12 months (index)
*Includes internet magazine activity.Includes kitchen, bathroom, home office, exterior addition, other Index: Top quintile of users of each medium among adults with HHI of $75K+, vs. all adults with HHI $75K+Source: GfK MRI, Spring 2017
magazines
internet*
TV
radio
newspapers
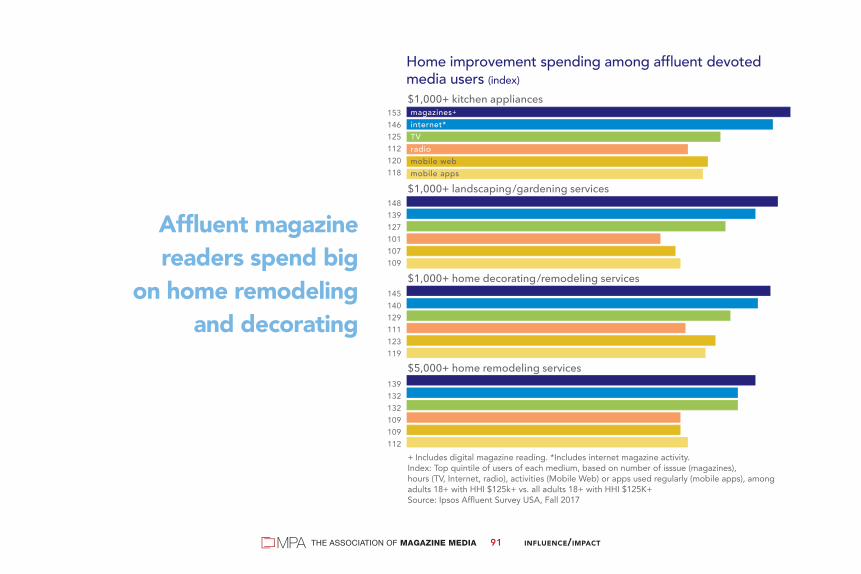
INFLUENCE/IMPACT091THE ASSOCIATION OF MAGAZINE MEDIA
Affluent magazinereaders spend big
on home remodelingand decorating
$1,000+ kitchen appliances
$1,000+ landscaping/gardening services
$1,000+ home decorating/remodeling services
$5,000+ home remodeling services
Home improvement spending among affluent devoted media users (index)
+ Includes digital magazine reading. *Includes internet magazine activity. Index: Top quintile of users of each medium, based on number of isssue (magazines), hours (TV, Internet, radio), activities (Mobile Web) or apps used regularly (mobile apps), among adults 18+ with HHI $125k+ vs. all adults 18+ with HHI $125K+Source: Ipsos Affluent Survey USA, Fall 2017
magazines+
internet*TVradiomobile webmobile apps
153146125112120118
148139127101107109
145140129111123119
139132132109109112

INFLUENCE/IMPACT092THE ASSOCIATION OF MAGAZINE MEDIA
Affluent magazine readers lead in homeimprovement and renovation
Home improvement activity among affluent devoted media users (index)
IN THE PAST 12 MONTHS magazines+ internet* TV radio mobile web mobile apps
Used interior designer/decorator 169 151 137 115 131 129Spent 12+ days redecorating home 144 129 120 108 125 122Used landscape designer 141 124 122 107 118 122Used any home-related professional 131 120 119 108 114 112Used retail store design or sales staff 128 107 114 112 116 119
IN THE NEXT 12 MONTHSPlan to remodel or renovate kitchen 135 127 129 118 128 131Plan to remodel or renovate bathroom 126 114 121 113 114 114Plan to remodel or renovate home 125 113 120 111 113 115Plan to construct/remodel/renovate outdoor living space 120 104 113 111 111 111Plan to sell primary home or second home 119 104 116 109 114 116Plan to remodel or renovate garden or plantings 118 102 113 112 109 111
+Includes digital magazine reading. *Includes internet magazine activityIndex: Top quintile of users of each medium, based on number of issues (magazines), hours (TV, Internet, radio), activities (Mobile Web) or apps used regularly (mobile apps), among adults 18+ with HHI $125K+ vs. all adults 18+ with HHI $125K+Source: Ipsos Affluent Survey USA, Fall 2017

INFLUENCE/IMPACT093THE ASSOCIATION OF MAGAZINE MEDIA
Luxury goods spending among affluent devoted media users in past year (index) magazines+ internet* TV radio mobile web mobile apps
$500+ watches 162 159 133 112 139 127$500+ fine jewelry 152 147 133 112 129 123$1,000+ fine jewelry 162 155 137 117 131 124$1,000+ fine watches, fine jewelry 157 151 136 113 134 126$3,000+ fine watches, fine jewelry 171 167 141 119 141 132 $1,000+ skin care, cosmetics, and fragrance 145 136 129 112 124 119$5,000+ men’s apparel and accessories 179 170 150 122 144 138$5,000+ women’s apparel and accessories 156 145 133 118 133 130$5,000+ apparel and accessories (total) 143 132 125 114 128 124$10,000+ apparel and accessories (total) 164 158 138 121 139 134$15,000+ apparel and accessories (total) 182 179 149 122 144 136
+Includes digital magazine reading. *Includes internet magazine activityIndex: Top quintile of users of each medium, based on number of issues (magazines), hours (TV, Internet, radio), activities (Mobile Web) or apps used regularly (mobile apps), among adults 18+ with HHI $125K+ vs. all adults 18+ with HHI $125K+Source: Ipsos Affluent Survey USA, Fall 2017
Affluent magazine readersspend heavily on luxury goods

INFLUENCE/IMPACT094THE ASSOCIATION OF MAGAZINE MEDIA
Affluent magazine readers arethe most frequent travelers
Travel habits of affluent devoted media users (index) magazines+ internet* TV radio mobile web mobile apps
Took five or more airline trips for businessin past 12 months 138 136 124 122 123 122
Own a powerboat or sailboat 135 118 117 124 102 102
Took five or more airline trips for domestic vacations in past 12 months 133 112 110 118 120 119
Took a cruise of 7+ days in past three years 128 118 119 100 104 107
Travel to Europe in the past three years 121 101 104 103 108 114
Belong to car rental frequent traveler program 121 111 112 107 108 111
Belong to hotel frequent traveler program 112 104 107 105 104 106
+Includes digital magazine reading. *Includes internet magazine activityIndex: Top quintile of users of each medium, based on number of issues (magazines), hours (TV, internet, radio), activities (mobile web) or apps used regularly (mobile apps), among adults 18+ with HHI $125K+ vs. all adults 18+ with HHI 125K+.Source: Ipsos Affluent Survey USA, Fall 2017

INFLUENCE/IMPACT095THE ASSOCIATION OF MAGAZINE MEDIA
*Includes digital magazine reading. +Includes internet magazine activity. Index: Top quintile of users of each medium, based on number of issues (magazines), hours (TV, internet, radio), activities (mobile web) or apps used regularly (mobile apps), among adults 18+ with HHI $75K+ vs. all adults 18+ with HHI 125K+.Source: Ipsos Affluent Survey USA, Fall 2017
153128123110119127
141130128117117120
140122116107113115
126116117109109110
Amount spent on all travel in past 12 months (index)
$10,000+ on all travel outside the U.S.
$10,000+ on all travel within the U.S.
$5,000+ on all travel outside the U.S.
$5,000+ on all travel within the U.S.
magazines*internet+
TVradiomobile webmobile apps
Affluent #magmediareaders spendmore on travel
Source: Ipsos Affluent Survey USA, Fall 2017

INFLUENCE/IMPACT096THE ASSOCIATION OF MAGAZINE MEDIA
*Includes digital magazine reading. +Includes internet magazine activity. Index: Top quintile of users of each medium, based on number of issues (magazines), hours (TV, internet, radio), activities (mobile web) or apps used regularly (mobile apps), among adults 18+ with HHI $125K+ vs. all adults 18+ with HHI 125K+.Source: Ipsos Affluent Survey USA, Fall 2017
140108113102110121
135118128117115119
134108113109108115
123107117110103105
Amount spent on vacations in past 12 months (index)
$10,000+ on vacation outside the U.S.
$10,000+ on vacation within the U.S.
$5,000+ on vacation outside the U.S.
$5,000+ on vacation within the U.S.
magazines*internet+
TVradiomobile webmobile apps
Affluent #magmediareaders are most
likely to spendheavily on vacations
Source: Ipsos Affluent Survey USA, Fall 2017

*Includes internet magazine activity. Index: Top quintile of users of each medium vs. adults 18+. +Vacation abroad outside Europe, Caribbean, and South America. Source: GfK MRI, Spring 2017
120110
8087
103
119105
87102113
119110
6984
107
108103
8794
104
very likely next 12 months: Vacation in Asia, Africa, Australia+
very likely next 12 months: Vacation in Caribbean
very likely next 12 months: Vacation in Europe
very likely next 12 months: Vacation in Florida
Travel characteristics of devoted media users (index)
print magazinesinternet*TVradionewspapers
Print magazines:Top destination
for overseastravelers
Source: GfK MRI, Spring 2017
INFLUENCE/IMPACT097THE ASSOCIATION OF MAGAZINE MEDIA

With half-baked blogs and food failsgalore, more Americans than ever aretrusting mealtime to magazine brands.
In print, online, on mobile and video, they serve up triple-tested recipes and verified diet tips. No other media is more inspired, trusted or engaging. With an audience of 2.0 billion, magazine media delivers the authority and safe environment everyone hungers for.
#BelieveMagMedia | BelieveMagMedia.com
HHUNUNGGRRYRYR FORFFOOODD TIPS
YYOYOY U CANTRUST?
Sour
ces:
Sim
mon
s Re
sear
ch, M
ulti-
Med
ia E
ngag
emen
t Stu
dy, S
prin
g 20
17;
Tota
l Mag
azin
e M
edia
360
° Aud
ienc
e, 2
017,
Bra
nd A
udie
nce
Repo
rt.

INFLUENCE/IMPACT099THE ASSOCIATION OF MAGAZINE MEDIA
Affluent foodinfluencers
consume printmagazines
146100
9191
119
116107
81112104
116103
91100102
wine
grocery shopping
cooking
*Includes internet magazine activity. Index: Percentage of category influentials among top quintile of users of each mediumamong adults 18+ with HHI of $75K+ vs. percentage of category influentials among adults with HHI $75K+. Category influentials are defined as people who have great experience in the topic and whose advice on this topic is trusted by friends and family members. Source: GfK MRI, Spring 2017
Affluent influential consumers for food purchasesamong devoted media users (index)
print magazinesinternet*TVradionewspapers
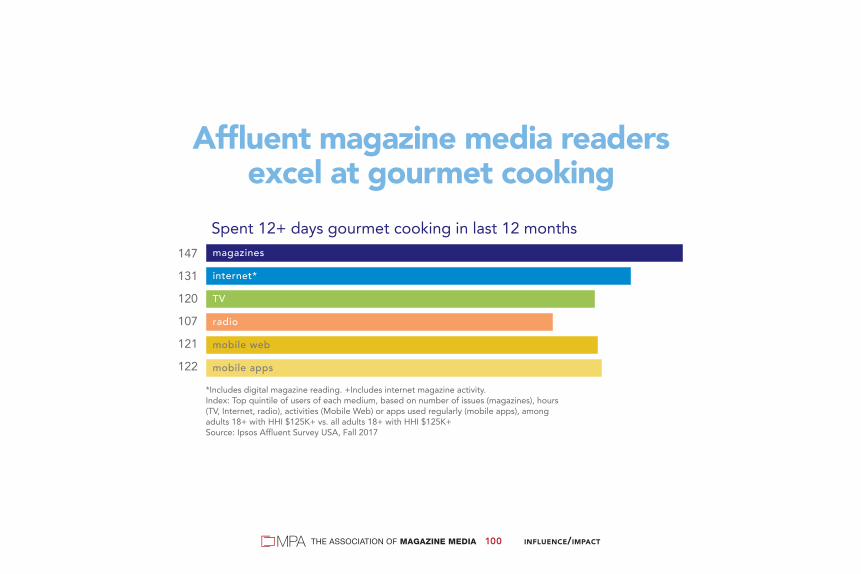
INFLUENCE/IMPACT100THE ASSOCIATION OF MAGAZINE MEDIA
Affluent magazine media readersexcel at gourmet cooking
147
131
120
107
121
122
Spent 12+ days gourmet cooking in last 12 months
*Includes digital magazine reading. +Includes internet magazine activity. Index: Top quintile of users of each medium, based on number of issues (magazines), hours (TV, Internet, radio), activities (Mobile Web) or apps used regularly (mobile apps), among adults 18+ with HHI $125K+ vs. all adults 18+ with HHI $125K+Source: Ipsos Affluent Survey USA, Fall 2017
magazines
internet*
TV
radio
mobile web
mobile apps

INFLUENCE/IMPACT101THE ASSOCIATION OF MAGAZINE MEDIA
Affluent influential consumers among devoted media users (index)
print magazines internet* TV radio newspapers
gardening 136 87 113 102 138
pets 125 100 88 118 89
restaurants 119 109 85 105 98
sports 117 100 92 107 99
vacation travel 116 110 63 87 105
books 113 98 83 93 115
*Includes internet magazine activity.Index: Percentage of affluent influentials among the top quintile of users of each medium with HHI of $75K+ vs. percentage of all affluent influentials among adults 18+ with HHI of $75K+.Note: Affluent influentials are defined as people who have great experience in this topic, whose advice on this topic is trusted by friends and family members.Source: GfK MRI, Spring 2017
Affluent print magazine readers influenceothers in how they use their free time

INFLUENCE/IMPACT102THE ASSOCIATION OF MAGAZINE MEDIA
Magazine mediareaders lead the
most active lives,enriching mind
and body
Activities participate in regularly (index)
magazine media internet* TV radio newspapers
adult education courses 189 162 114 126 95
dancing 175 143 121 161 94
bicycling 154 91 77 114 144
tennis 151 116 67 121 138
spa services 150 110 57 113 121
basketball 144 123 102 118 136
fitness walking 142 81 70 108 124
visit museums 139 101 83 100 135
swimming 138 102 92 116 140
volunteer your time 138 101 98 97 124
cooking for fun 136 105 94 114 114
aerobics 135 95 90 129 104
shopping for fun 128 111 108 108 88
hiking 126 97 47 113 124
entertaining friends/family 125 103 88 120 110*Includes internet magazine activity.Index: Top quintile of users of each medium vs. adults 18+.Source: Kantar Media, MARS Consumer Health Study, 2017

INFLUENCE/IMPACT103THE ASSOCIATION OF MAGAZINE MEDIA
Print magazine readers areentertainment enthusiasts
Entertainment activities among devoted media users (index)
print magazines internet* TV radio newspapers
viewed any pay-per-view movies in past 12 months 145 130 111 103 104
attend movies once a week or more 141 120 76 118 102
viewed any movies on demand in past 30 days 138 120 96 109 104
bought iPad (any model) 137 129 88 88 102
attend movies at least twice per month 122 111 77 106 95
very or somewhat likely to buy satellite radio in next 12 months 119 117 103 111 99
*Includes internet magazine activity.Index: Top quintile of users of each medium vs. adults 18+.Source: GfK MRI, Spring, 2017

INFLUENCE/IMPACT104THE ASSOCIATION OF MAGAZINE MEDIA
Magazinereaders seek
knowledge andnew experiences
Self-perception (index)
*Includes internet magazine activity.Index: Percentage of top users of each medium vs. percentage of adults 18+.Note: Devoted print magazine readers are defined as those who read printed magazines at least several times per week or digital magazines more than once a day. Devoted Internet users are those who use it at least 30 hours per week. Devoted radio listeners are those who listen to FM Radio at least two hours a day or AM radio at least one hour a day. Devoted TV viewers are defined as those who watch live or “catch-up” TV at least 31 hours per week. Each group represents approximately the same proportion of US adults 18+. Source: YouGov Profiles, March 2018
140110117133
132110
8698
130109
90107
12590
100115
1189887
103
111102
9698
usually know all the new and emerging music artists
knowledgeable
cerebral
adventurous
analytical
like to surround self with a diverse range of cultures and ideas
magazinesinternet*TVradio

INFLUENCE/IMPACT105THE ASSOCIATION OF MAGAZINE MEDIA
Adults 18–49 rely on magazine mediato provide them with valued information,
conversation and purchase inspiration magazine ad supported(index) media websites TV networks
a way to learn about new products 143 98 85
gets me to try new things 139 97 87
inspires me to buy things 135 100 85
gives me something to talk about 125 92 102
bring up things from medium in conversation 124 93 102
provides info that helps me make decisions 122 100 83
get valuable info from this 118 102 88
Note: Data for each medium based on levels of agreement with the above statements for users of a set of vehicles in each medium.Index: Percentage of adults 18-49 who used a set of vehicles in each medium vs. percentage of all adults 18-49. Source: Simmons Multi-Media Engagement Study, Spring 2017

MAGAZINE BRAND VITALITY106THE ASSOCIATION OF MAGAZINE MEDIA
Editorial category page total percentages 2017category percent
Beauty & Grooming 4.3%Building 2.2%Business & Industry 6.7%Children 0.3%Consumer Electronics 0.5%Culture 8.5%Destination Travel/Restaurants 4.4%Entertainment/Celebrity 18.0%Fiction 0.4%Food & Nutrition 8.1%Gardening & Farming 0.9%General Interest 3.3%Global/Foreign Affairs 4.4%Health/Medical Science 2.7%Home Furnish/Management 5.5%Misc (Cover/Index/Announcements) 4.8%Motor Vehicles 0.3%National Affairs 4.6%Personal Finance 1.4%Personal Fitness/Exercise 1.2%Self Help/Relationships 2.8%Sports/Recreation/Hobby 3.7%Wearing Apparel/Accessories 11.1%Total Editorial Pages 100.0%Data as of Monday, January 1, 2018. Total issues in sample: 1,392Source: © MA-Focus Media Magazine Reports. All Rights Reserved.
Edit Pages62.4%
Ad Pages37.6%
Magazines satisfymultiple consumer
passions and interests
The top three editorialcategories make up 38%
of all editorial content
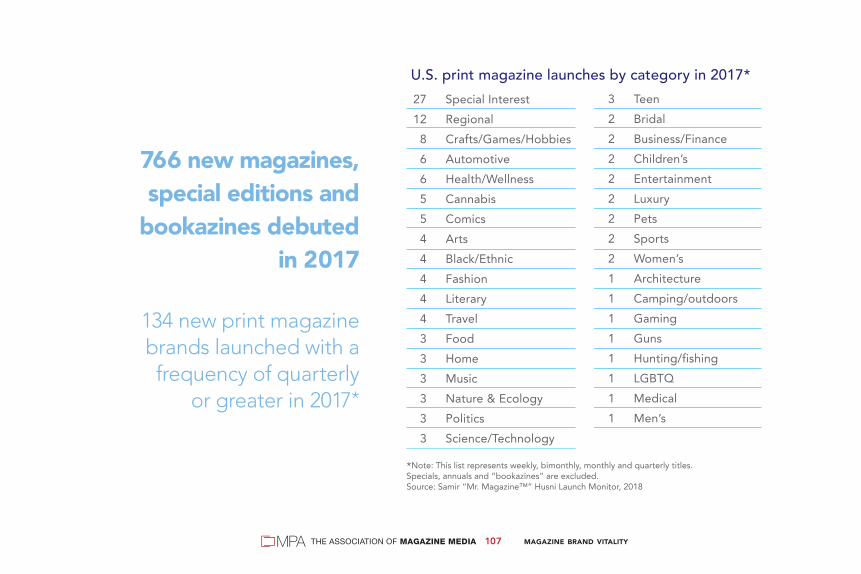
MAGAZINE BRAND VITALITY107THE ASSOCIATION OF MAGAZINE MEDIA
27 Special Interest 12 Regional 8 Crafts/Games/Hobbies 6 Automotive 6 Health/Wellness 5 Cannabis 5 Comics 4 Arts 4 Black/Ethnic 4 Fashion 4 Literary 4 Travel 3 Food 3 Home 3 Music 3 Nature & Ecology 3 Politics 3 Science/Technology
U.S. print magazine launches by category in 2017*
*Note: This list represents weekly, bimonthly, monthly and quarterly titles. Specials, annuals and “bookazines” are excluded.Source: Samir “Mr. Magazine™” Husni Launch Monitor, 2018
3 Teen 2 Bridal 2 Business/Finance 2 Children’s 2 Entertainment 2 Luxury 2 Pets 2 Sports 2 Women’s 1 Architecture 1 Camping/outdoors 1 Gaming 1 Guns 1 Hunting/fishing 1 LGBTQ 1 Medical 1 Men’s
766 new magazines,special editions and
bookazines debutedin 2017
134 new print magazinebrands launched with afrequency of quarterly
or greater in 2017*
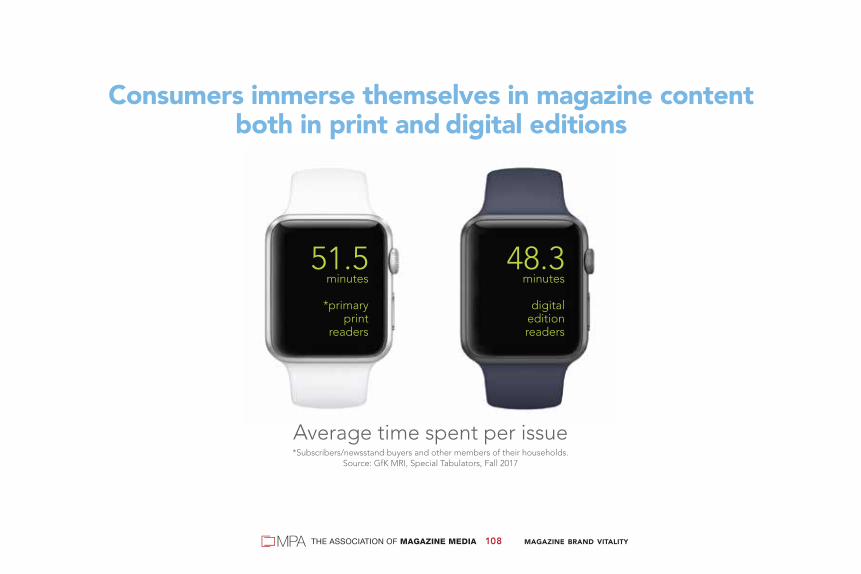
MAGAZINE BRAND VITALITY108THE ASSOCIATION OF MAGAZINE MEDIA
Consumers immerse themselves in magazine contentboth in print and digital editions
51.5minutes
*primaryprint
readers
Average time spent per issue*Subscribers/newsstand buyers and other members of their households.
Source: GfK MRI, Special Tabulators, Fall 2017
48.3minutes
digitaleditionreaders

January–March23.2%
April–June25.7%
Note: Includes all publications measured in GfK MRI Issue-Specific StudySource: GfK MRI, July 2016–June 2017
DEC JAN
MAR
JUL
APR
MAY
FEB
AUG
SEP
OCT
NOV
JUN
7.9
6.9
8.3
8.1
9.1
8.58.0
7.5
8.8
9.4
8.8
8.6
October–December26.8%
July-September24.4%
Issue-specific audiences 2016–2017by month and quarter (percent)
Readership is steady all year long
MAGAZINE BRAND VITALITY109THE ASSOCIATION OF MAGAZINE MEDIA

MAGAZINE BRAND VITALITY110THE ASSOCIATION OF MAGAZINE MEDIA
Magazine brands endureMore than 180 print magazineshave thrived for more than50 years (only 11 TV programscan say the same)Source: MPA Info Center, MediaFinder.com, Museum of Broadcast Communications, 2018 data.
54 print magazineshave flourishedfor more than100 years

MAGAZINE BRAND VITALITY111THE ASSOCIATION OF MAGAZINE MEDIA
Staying power:For the past 10 years,
the total number ofconsumer magazineshas surpassed 7,000
Number of U.S. printconsumer magazines 2008–2017
Note: Includes consumer print magazines in theU.S. regardless of publishing frequency.Source: National Directory of Magazines
MediaFinder.com, 2017
CONSUMER YEAR MAGAZINES 2017 7,176
2016 7,216
2015 7,293
2014 7,289
2013 7,240
2012 7,390
2011 7,179
2010 7,163
2009 7,110
2008 7,383

MAGAZINE BRAND VITALITY112THE ASSOCIATION OF MAGAZINE MEDIA
96%total paid andverified print
4%total paidand verifieddigital
Print and digitalcirculation
Subscriptions andsingle copy sales
92%total paid
subscriptions
4%total paidand verifiedsubscriptions
4% totalsingle copy
sales
Print remains strong:Subscriptions dominate
Source: AAM, 2017, 2H; 291 U.S. consumer magazines in analysis.

MAGAZINE BRAND VITALITY113THE ASSOCIATION OF MAGAZINE MEDIA
Note: Sunday magazines excluded. Source: PIB and Kantar Media, data as of January 2018
Leadingmarketers
investin print
magazines
2017 Top 50 marketers’ print magazine rate card reported spend: $6,107,047,892 1 2 3 4 5 6 7 8 9 10 11 12 13 14 15 16 17 18 19
20 21 22 23
24
25
L’Oréal SA (in thousands) 699,460 Procter & Gamble Co. 561,041 Pfizer Inc. 369,058 Kraft Heinz Co. 337,444 Johnson & Johnson 240,900 LVMH Möet Hennessy Louis Vuitton SA 216,313 Berkshire Hathaway Inc. 187,089 Allergan Plc 174,576 Mars Inc. 172,300 Unilever 158,498 Kellogg Co. 153,531 General Motors Corp. 153,017 Nestle SA 152,496 JAB Holding Co. 142,195 Bradford Exchange Ltd 128,364 Pepsico Inc. 104,939 Merck & Co. Inc. 102,168 Novartis AG 100,016 Eli Lilly & Co. 98,478 Toyota Motor Corp. 98,264 Kering SA 97,189 Estée Lauder Cosmetics Inc. 95,274 Altria Group Inc. 87,011 Synergistic Marketing Llc 69,186 Comcast Corp. 69,003
26 27 28 29 30 31 32 33 34 35 36 37 38 39 40 41 41 43 44 45 46 47 48 49 50
Chanel SA 67,436 MacNeil Automotive Products Ltd 67,091 Edgewell Personal Care Co. 66,067 AbbVie Inc. 63,312 AstraZeneca Plc 62,202 Fiat Chrysler Automobiles NV 61,109 Church & Dwight Co. Inc. 60,919 JM Smucker Co. 60,341 Clorox Co. 60,062 Skechers USA Inc. 59,645 Bristol-Myers Squibb Co. 58,733 Campbell Soup Co. 54,910 Iovate Health Sciences Intl Inc. 51,658 Serta Simmons Holdings Llc 51,062 Kao Corp. 49,609 Rolex Watch Co. SA 46,790 Blue Buffalo Co. 46,326 Norwegian Cruise Line Holdings Ltd 45,837 Tyson Foods Inc. 45,300 Colgate-Palmolive Co. 44,514 Amazon.com Inc. 44,310 Molson Coors Brewing Co. 43,577 Glaxosmithkline Plc 43,004 Compagnie Financiere Richemont AG 42,766 Kimberly-Clark Corp. 42,658
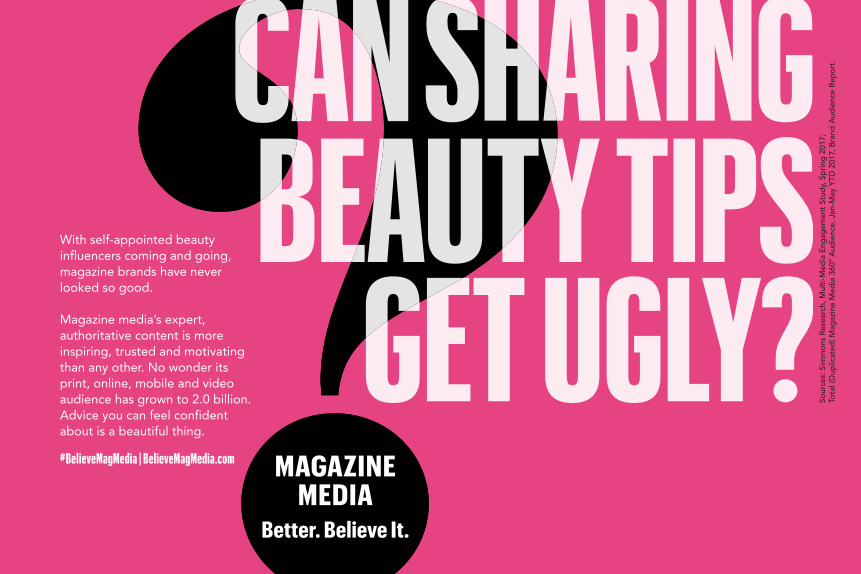
With self-appointed beautyinfluencers coming and going,magazine brands have never looked so good.
Magazine media’s expert,authoritative content is moreinspiring, trusted and motivatingthan any other. No wonder itsprint, online, mobile and videoaudience has grown to 2.0 billion.Advice you can feel confident about is a beautiful thing.
#BelieveMagMedia | BelieveMagMedia.com
Sour
ces:
Sim
mon
s Re
sear
ch, M
ulti-
Med
ia E
ngag
emen
t Stu
dy, S
prin
g 20
17;
Tota
l (D
uplic
ated
) Mag
azin
e M
edia
360
° Aud
ienc
e, J
an-M
ay Y
TD 2
017,
Bra
nd A
udie
nce
Repo
rt.

MAGAZINE.ORG115THE ASSOCIATION OF MAGAZINE MEDIA
MPA—THE ASSOCIATION OF MAGAZINE MEDIA is the primary advocate and voice for the magazine media industry, driving thought leadership and game-changing strategies to promote the industry’s vitality, increase revenues and grow market share. Establishedin 1919, MPA represents 175 domestic, associate and international members. MPA is headquartered in New York City, with a government affairs office in Washington, D.C.
The MPA Information Center offers personalized research services for MPA members, advertisers and their agencies. The staff can provide data on historical trends, industrystatistics, news and much more.
Members wishing to subscribe to the MPA Daily News Roundup, the industry’s comprehensive email newsletter of the latest magazine media news and developments, can email [email protected].
Members can send requests to [email protected]. Staff is available 9:00am to 5:00pmEST, Monday through Friday.
Find more information and updates at magazine.org.
The Magazine Media Factbook 2018/19. Produced by MPA–The Association of Magazine Media. MPA, 757 Third Avenue, 11th Floor, New York, NY 10017. © Copyright 2018. All rights reserved.

The race to post, tweet and chatevery minute has made it hardto know what’s real. And it’smaking magazine brands mattermore than ever. Truth is, theirauthoritative content is moretrusted, inspiring and motivatingthan any other.
Magazine media cuts throughthe clutter, in print, online, onmobile and video.
#BelieveMagMedia | BelieveMagMedia.com
Sour
ces:
201
7 Su
rvey
, Pew
Res
earc
h Ce
nter
; Sim
mon
s Re
sear
ch, M
ulti-
Med
ia E
ngag
emen
t Stu
dy, S
prin
g 20
17.

MAGAZINE.ORG117THE ASSOCIATION OF MAGAZINE MEDIA
MPA MEMBERSHIP grants magazine media companies and related industries the opportunity to be a part of a dynamic organization that is the leading advocate of the magazine media industry. MPA is the primary voice for magazine media and drives thought leadership and game-changing strategies to promote vitality, increase revenues and grow market share. Members gain access to the leaders and innovators transforming the industry, member-only benefits that provide bottom-line impact, as well as customized news, research and reporting. Membership is available in two categories: Magazine Media Members and Associate Members. For more information about membership, contact Elizabeth Tighe at [email protected]. IMAG is a community of independent publishers within MPA membership designed to facilitate peer-to-peer convening, sharing and learning. The entrepreneurial leaders of IMAG companies have navigated the transition from traditional magazine company to 360° magazine media brand with creativity and innovation. Fueled by the passionate interest of enthusiast audiences, IMAG brands produce world-class content that captures the attention and loyalty of consumers.
MPA NEXT is a community for up-and-coming professionals in the magazine media industry.Its event series features professional workshops, lectures covering a range of relevant topics, open forums focused on media needs and social trends, as well as media mixers and networking receptions. For more information, email [email protected].

SPONSORSHIP OF MPA EVENTS grants key vendor partners premier access to membersat events and activities that take place throughout the year. From large-scale conferences to intimate roundtable discussions and everything in between, strategic sponsorships can help related industries grow their businesses while supporting the health and vitality of magazine media. For more information on sponsorship opportunities, contact Alison Heisler [email protected].
AMERICAN MAGAZINE MEDIA CONFERENCE is the magazine media industry’s premiere annual conference, bringing together member companies, related industries and outside guests for a full day of convening. The most influential people in magazine media gather at this must-attend conference to examine all aspects of the industry’s dynamics in depth and discuss its evolving future and vast opportunities. In addition to magazine media luminaries, notable past guests and speakers include: Presidents Barack Obama and Bill Clinton, First Lady Michelle Obama, Oprah Winfrey, Jeff Bezos, Ron Howard, Ronan Farrow, Amy Schumer, Julianne Moore, Seth Meyers, Evan Spiegel, Lena Dunham, and many more.
MAGAZINE.ORG118THE ASSOCIATION OF MAGAZINE MEDIA

MAGAZINE ORG119THE ASSOCIATION OF MAGAZINE MEDIA
Better.Believe It.
ur thanks to the followingfor their research contribution
AAMCarat Insight
comScoreEdelman
Engagement LabsGfK MRI, GfK MRI Starch
Quad/GraphicsIpsos
J.D. Power & AssociatesKantar Media
MA-FocusMediaFinder, Oxbridge Communications
Meredith CorporationMillward Brown Digital
Museum of Broadcast CommunicationsNielsen Catalina Solutions, Nielsen Homescan
NOMOS ResearchPew Research Center
Professor Samir Husni, Mrmagazine.comPublishers Information Bureau® (PIB)
Signet ResearchSimmons Research
SocialFlowSymphony Health
YouGov

PublishersInformationBureau
THANK YOU TO OUR PRINT SPONSOR
magazine.org
Making Great Impressions for Your Successfreeportpress.com

Print magazines inspire readers to take action—to clip ads, torecommend products and to buy them. — page 66

Better.Believe It.
Magazine brand cross-platformaudiences continue to rise over time,+23% since launch. — page 8


