February 24-27, 2014 GSAW Conference 1 Magnetospheric MultiScale (MSS) System Manager Conrad Schiff Fran Maher Sean Henely Dave Rand https://ntrs.nasa.gov/search.jsp?R=20140005701 2018-08-26T21:50:59+00:00Z
• The Mission – Science of Magnetic Reconnection– Spacecraft Description– Flight Dynamics Concept
• System Manager Concept– Why Automate? And How To?– System Manager Architecture– Process Representation– Scheduling Concepts– Database
• Contact Analysis Implementation– Defining the contact problem– System Manager Approach– Results
February 24-27, 2014 GSAW Conference
3
THE MISSION
February 24-27, 2014 GSAW Conference
4
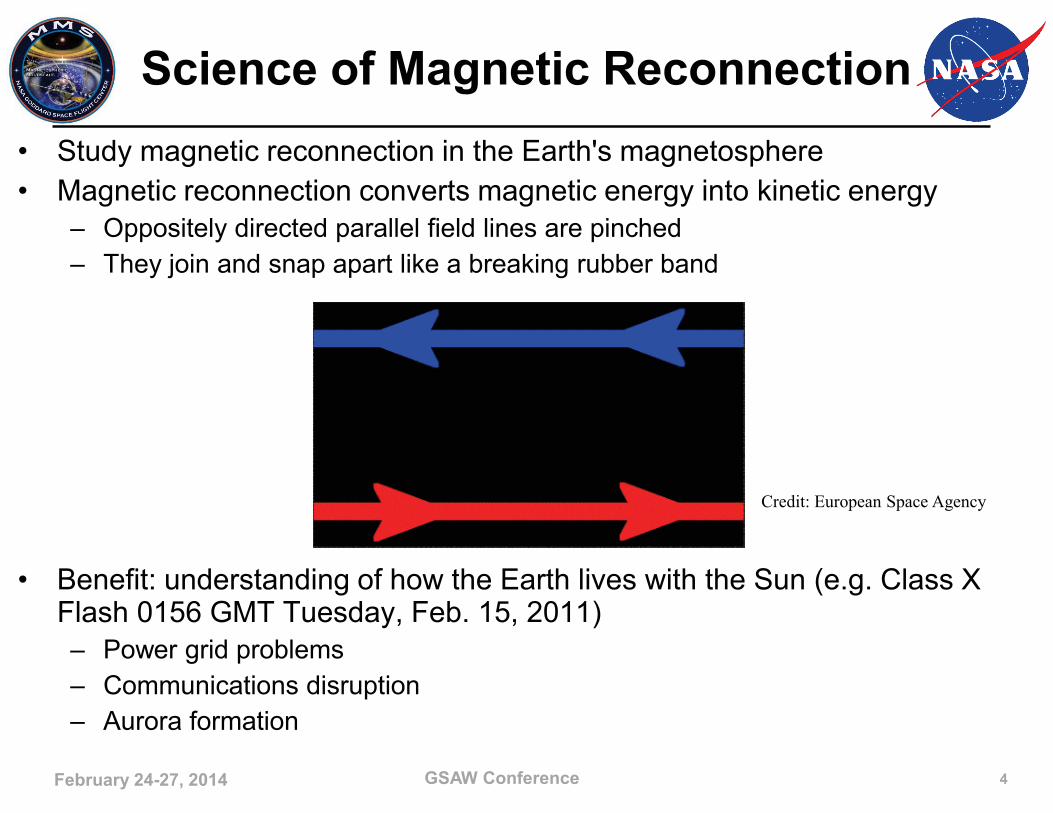
Science of Magnetic Reconnection• Study magnetic reconnection in the Earth's magnetosphere• Magnetic reconnection converts magnetic energy into kinetic energy
– Oppositely directed parallel field lines are pinched– They join and snap apart like a breaking rubber band
• Benefit: understanding of how the Earth lives with the Sun (e.g. Class X Flash 0156 GMT Tuesday, Feb. 15, 2011)– Power grid problems– Communications disruption– Aurora formation
Credit: European Space Agency
February 24-27, 2014 GSAW Conference
5
(a) (b)
Spacecraft Description• The 4 MMS Spacecraft are
– Equipped with the standard ‘particles and fields’ instrument suit (7 types of instruments – multiple copies per spacecraft)
Why Automate? And How To?• Automation needed handling the complexity
– Large number of interactions– Goal to reduce human error and operations cost – Want dependable agent – must act like an ‘ideal operator’ that is never sick,
always on time, able to handle multiple processes once taught– Want smart agent – must adapt to changing situations and know when to ask
for help• System Manager Automation framework using agents
– User-defined Agents – core automation objects that respond to events or defined schedules by triggering forward-chain or backward-chain processes.
– Process Control – collaborative set of agents that achieve objectives based on the state of the process flow via user-defined rules.
– Adaptive Scheduling – existing schedules are altered based on incoming events
– Operations Planning/Automated Recovery – target operational state is used to plan a proper course of action via backward-chaining (inferring the cause that gives a desired effect)
• Response Schedule is a list of expected activities to be performed, using defined processes, as a response to an event
• Response Schedule is dynamic – based on external special requests (i.e. from MOC) and automated response to events, user/agents can add or remove activities
• Automation uses the schedule in two ways:1. Perform activities currently on schedule (schedule-driven)2. Add an activity to the schedule as a response to a detected event (event-driven)
Operational Activities
Testing Activities
Analysis Activities
Automation•Manages Schedule•Controls Processes•QAs Processes •Distributes Products•Archives Data
Activity Log
Component(s)
Expected EventsSchedules
Schedules define activities to be
executed
Status
User Interface
Triggering EventAlert Notification
February 24-27, 2014 GSAW Conference
14
Database
• Database functionality using the Entity Framework forms the backbone for the automation
• Serves as the intermediary for inter-process communications– Used as media to transfer data between processes.
• Enables data mining and querying– User queries using transformations and operators defined by entities.– Metadata-based model allows for queries specifying multiple physical,
dimensions, engineering units, coordinates systems, etc. – ‘Snapshot’ functionality allows for GUI data monitors and visualization to
show internal state of process being executed• User entry point for debugging• Automated fault detection and (where possible) correction
February 24-27, 2014 GSAW Conference
15
CONTACT ANALYSISIMPLEMENTATION
February 24-27, 2014 GSAW Conference
16
Contact Analysis:Problem Definition
• Contact between the MMS spacecraft and the TDRS fleet is needed every perigee (see slide 7)– Important for science retrieval– Critical for formation maneuvers
• Motion model (line-of-sight & distance vs. time)– TDRS in correct geostationary boxes– MMS following its elliptical trajectory
• Antenna model (gain pattern & field-of-view (FOV))– TDRS-E/W S-band Single Access (SSA) antennas
with 4 FOVs (simple, primary, elliptical extended x2 –ordered approximately from most to least available)
– TDRS-Z SSA with simple FOV– MMS has upper & lower deck s-band omni (‘garden
weasel’) antennas• Objective
– Find the simplest operational scenario (number of handoffs) that maximizes data rate (link margin)
TDSR-E: better line-of-sight
TDSR-ZTDSR-W: better data rate
February 24-27, 2014 GSAW Conference
17
Contact Analysis:System Manager Approach
• System Manager generated a set of predicted events– Logical yes/no for link between MMS and TDRS at a given data-rate
(typical operations approach)– Constraint transitions (yes-to-no or no-to-yes) placed in a decision tree (not
so-typical in operations)• Decision tree hierarchy based on the importance of mission rules/constraints
(e.g. occultation has higher precedence than FOV)
• System Manager used an A* search algorithm to generate the optimal contact schedule– A* search works by finding the ‘shortest path’ across a ‘set of nodes’– The decision tree provides the nodes based on the constraint transitions– Link margin, antenna availability, data rates, etc. automatically built-in
February 24-27, 2014 GSAW Conference
18
Contact Analysis:Results
• System Manager analyzed a typical 2.5-year mission scenario– Able to find the best schedule (smallest number of hand-offs for the
maximum date rate)– Statistically characterized the mission probability of successful contacts –
e.g. 87% percent meet requirements, remaining 13% needs a workaround– Results consistent with official results from Space Network Loading and
Modeling • Performance
– Analysis took several seconds on a typical Windows-based workstation– Results successfully vetted against hand-computations of all permutations
(days of work)• Operational benefit
– Provides a robust way to find optimal results for given mission scenario– Gives a sense of how often MMS will have to work around network
constraints– Makes a rapid response possible should base assumptions change