24
INVESTOR PRESENTATION 1Q 2018 RESULTS published on April 20, 2018
INVESTOR PRESENTATION
1Q 2018 RESULTS published on April 20, 2018
Magnit at a Glance
Magnit at a Glance
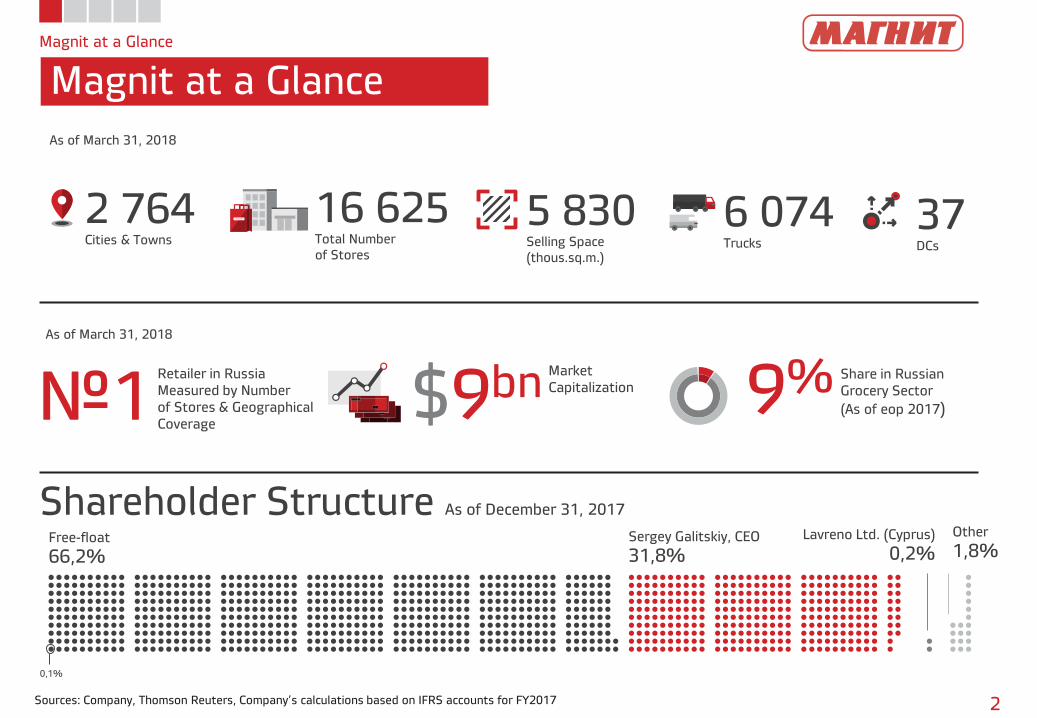
Sources: Company, Thomson Reuters, Company’s calculations based on IFRS accounts for FY2017 2
2 764Cities & Towns
16 625Total Number
of Stores
5 830Selling Space
(thous.sq.m.)
37DCs
6 074Trucks
№1Retailer in Russia
Measured by Number
of Stores & Geographical
Coverage$9bn
Market
Capitalization 9% Share in Russian
Grocery Sector
(As of eop 2017)
Shareholder Structure As of December 31, 2017
66,2%Free-float
31,8%Sergey Galitskiy, CEO
0,2%Lavreno Ltd. (Cyprus)
0,1%
1,8%Other
As of March 31, 2018
As of March 31, 2018
Magnit at a Glance
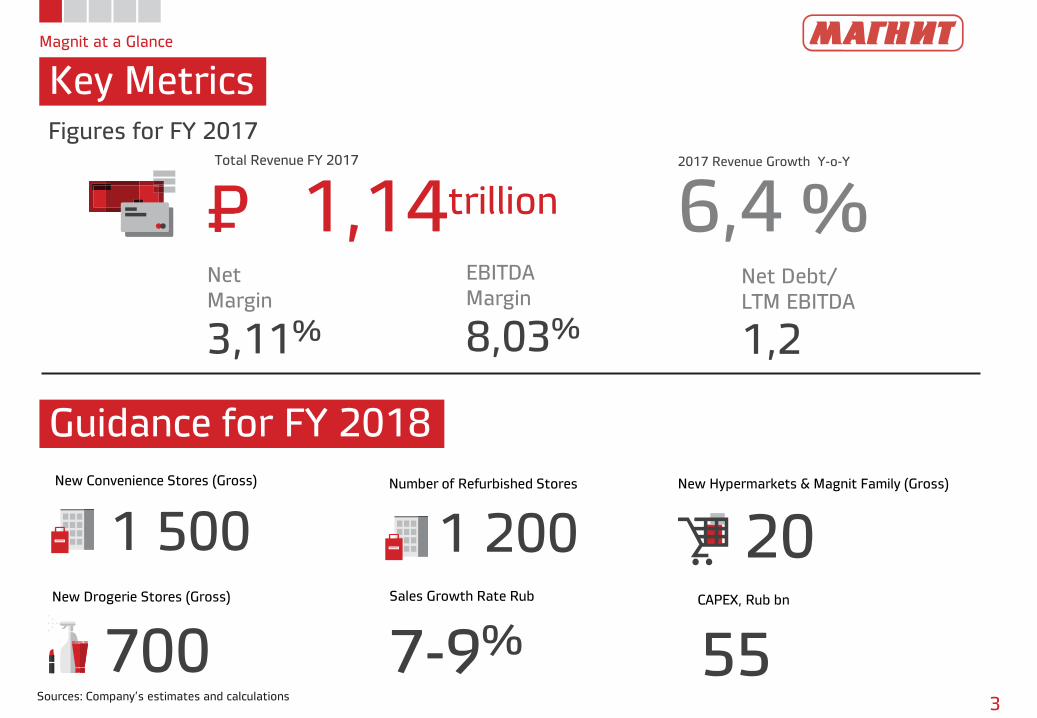
Key Metrics
3Sources: Company’s estimates and calculations
1,14trillion 6,4 %
3,11%
Net
Margin
8,03%
EBITDA
Margin
1,2
Net Debt/
LTM EBITDA
1 500 20
700
P=2017 Revenue Growth Y-o-Y
Guidance for FY 2018
Figures for FY 2017
7-9%
Sales Growth Rate Rub
New Convenience Stores (Gross)
New Drogerie Stores (Gross)
Total Revenue FY 2017
New Hypermarkets & Magnit Family (Gross)
55
CAPEX, Rub bn
Number of Refurbished Stores
1 200
69
Magnit at a Glance
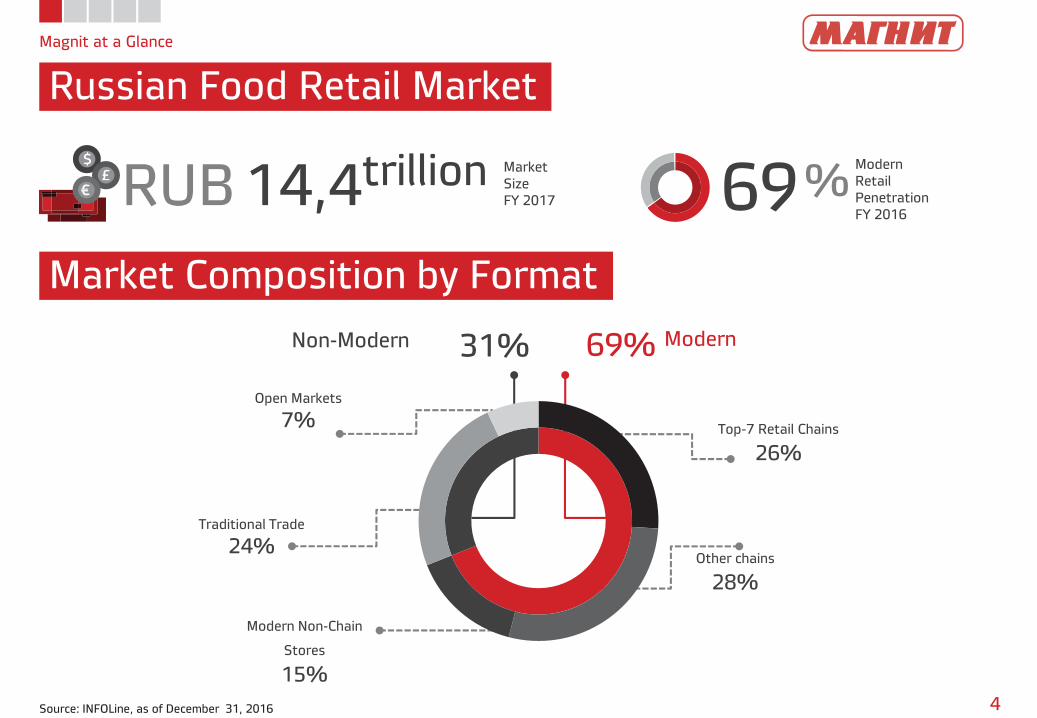
Russian Food Retail Market
4
Market Composition by Format
RUB 14,4trillion Market
Size
FY 2017%
Modern
Retail
Penetration
FY 2016
Non-Modern Modern
Source: INFOLine, as of December 31, 2016
69%31%
Top-7 Retail Chains
26%
Modern Non-Chain
Stores
15%
Other chains
28%
Traditional Trade
24%
Open Markets
7%
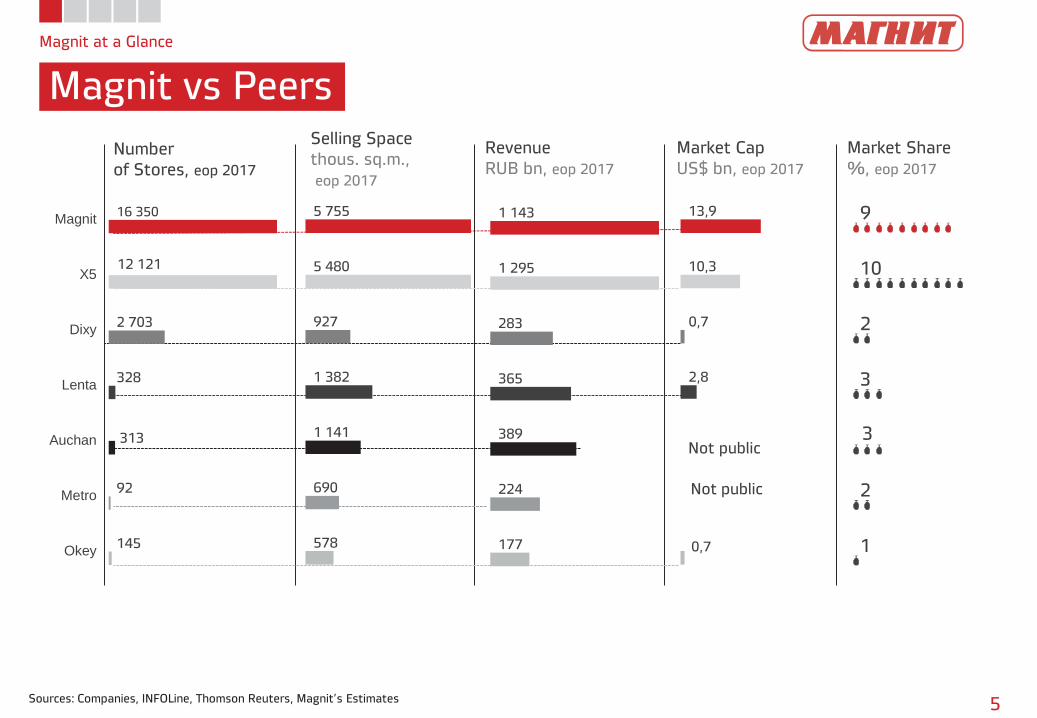
5 755
5 480
927
1 382
1 141
690
578
16 350
12 121
2 703
328
313
92
145
Magnit
X5
Dixy
Lenta
Auchan
Metro
Okey
1 143
1 295
283
365
389
224
177
13,9
10,3
0,7
2,8
0,7
Magnit at a Glance
Magnit vs Peers
5Sources: Companies, INFOLine, Thomson Reuters, Magnit’s Estimates
Number
of Stores, eop 2017
Selling Space
thous. sq.m.,
eop 2017
Revenue
RUB bn, eop 2017
Market Cap
US$ bn, eop 2017
Market Share
%, eop 2017
9
10
2
3
3
2
1
Not public
Not public
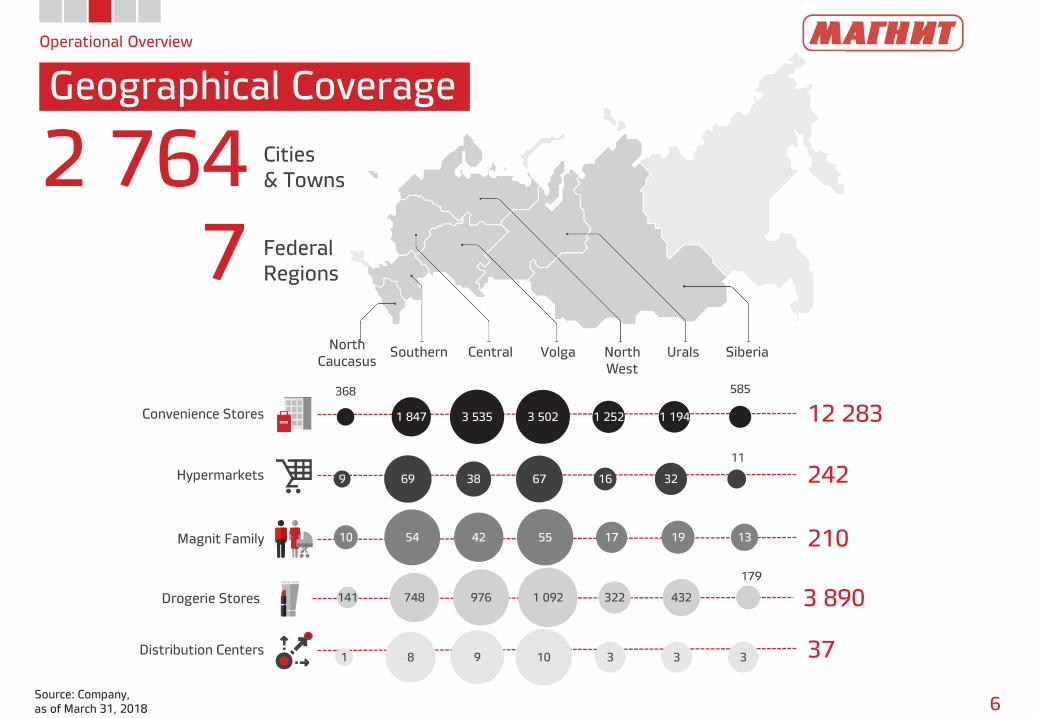
3 890Drogerie Stores 141 748 976 1 092 322 432
179
12 283Convenience Stores
242Hypermarkets
210Magnit Family
37Distribution Centers
10 54 42 55 17 19 13
9 69 38 67 16 32
11
368
1 847 3 535 3 502 1 252 1 194
585
Operational Overview
Geographical Coverage
6Source: Company,
as of March 31, 2018
2 764 Cities
& Towns
7 Federal
Regions
North
CaucasusSouthern Volga North
West
Urals SiberiaCentral
1 8 9 10 3 3 3
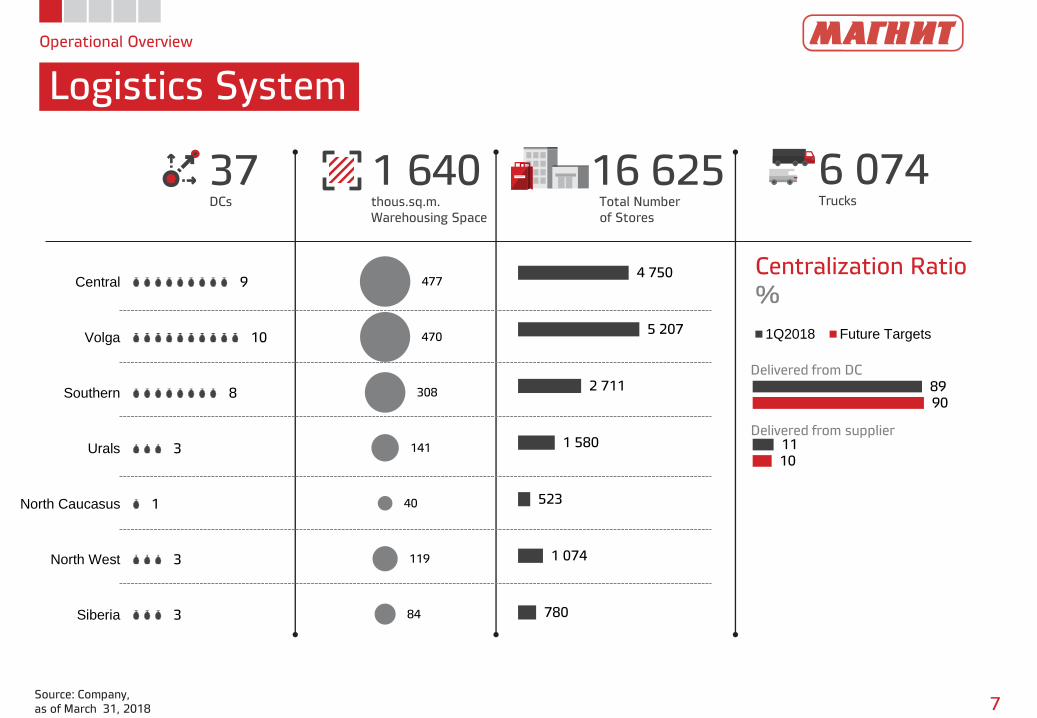
Operational Overview
Logistics System
7Source: Company,
as of March 31, 2018
16 625Total Number
of Stores
1 640thous.sq.m.
Warehousing Space
37DCs
6 074Trucks
9
10
8
3
1
3
3
Central
Volga
Southern
Urals
North Caucasus
North West
Siberia
4 750
5 207
2 711
1 580
523
1 074
780
477
470
308
141
40
119
84
Centralization Ratio
%
89
11
90
10
1Q2018 Future Targets
Delivered from DC
Delivered from supplier
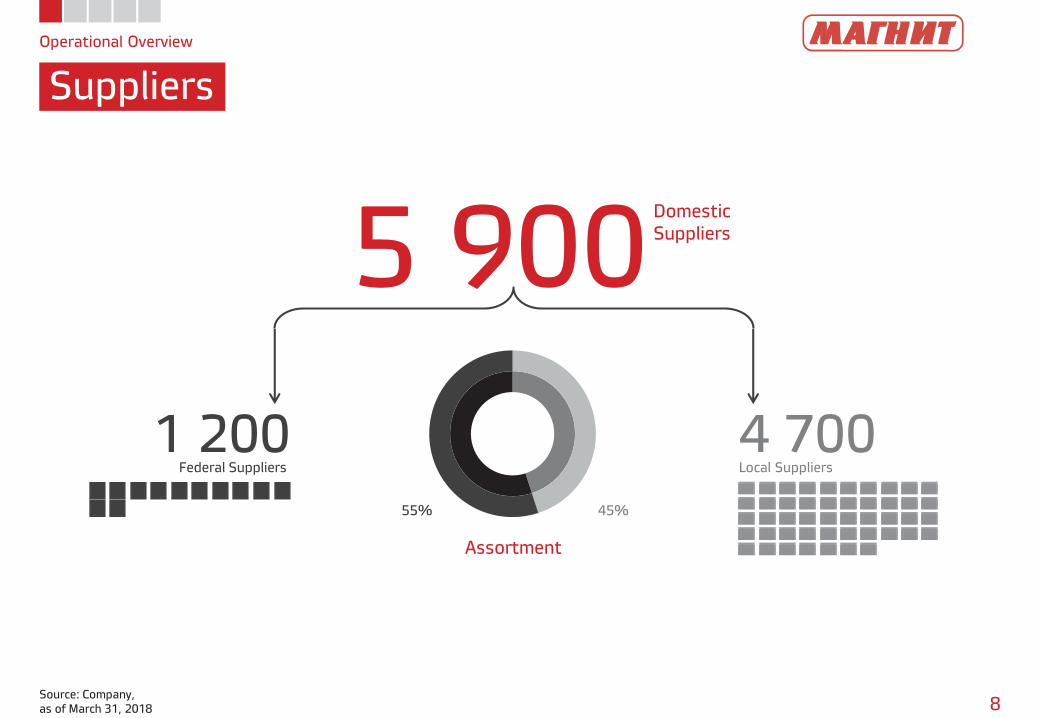
Operational Overview
Suppliers
8Source: Company,
as of March 31, 2018
5 900Domestic
Suppliers
4 700Local Suppliers
1 200Federal Suppliers
Assortment
55% 45%
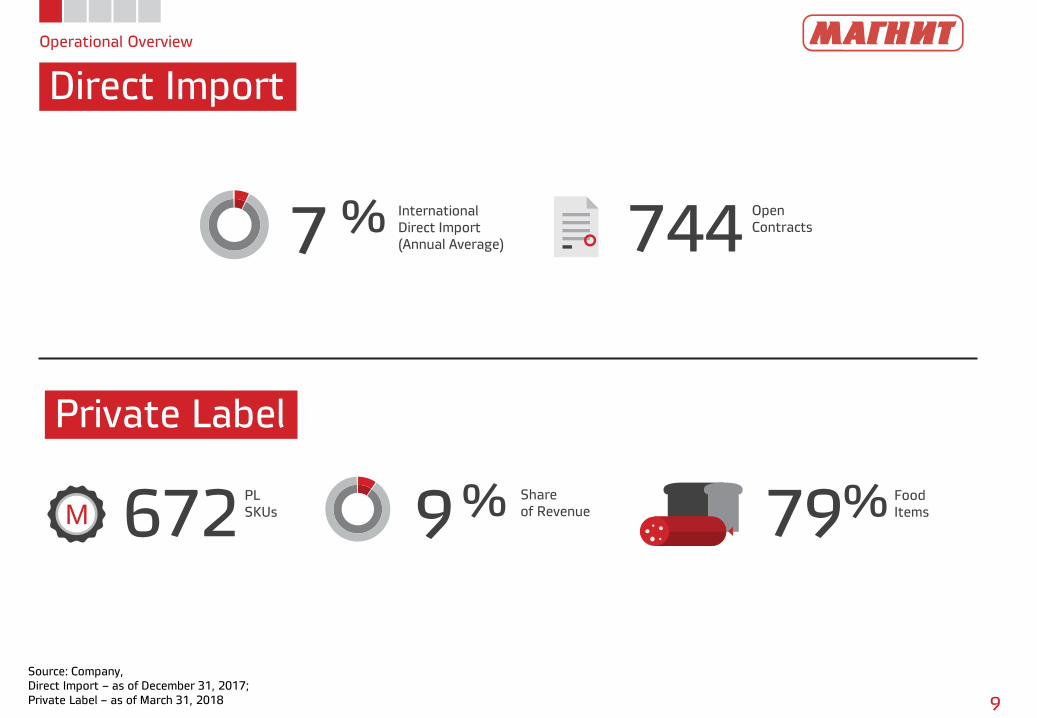
Operational Overview
Direct Import
9
9 % Share
of Revenue672PL
SKUsM 79% Food
Items
Private Label
7 % International
Direct Import
(Annual Average) 744Open
Contracts
Source: Company,
Direct Import – as of December 31, 2017;
Private Label – as of March 31, 2018
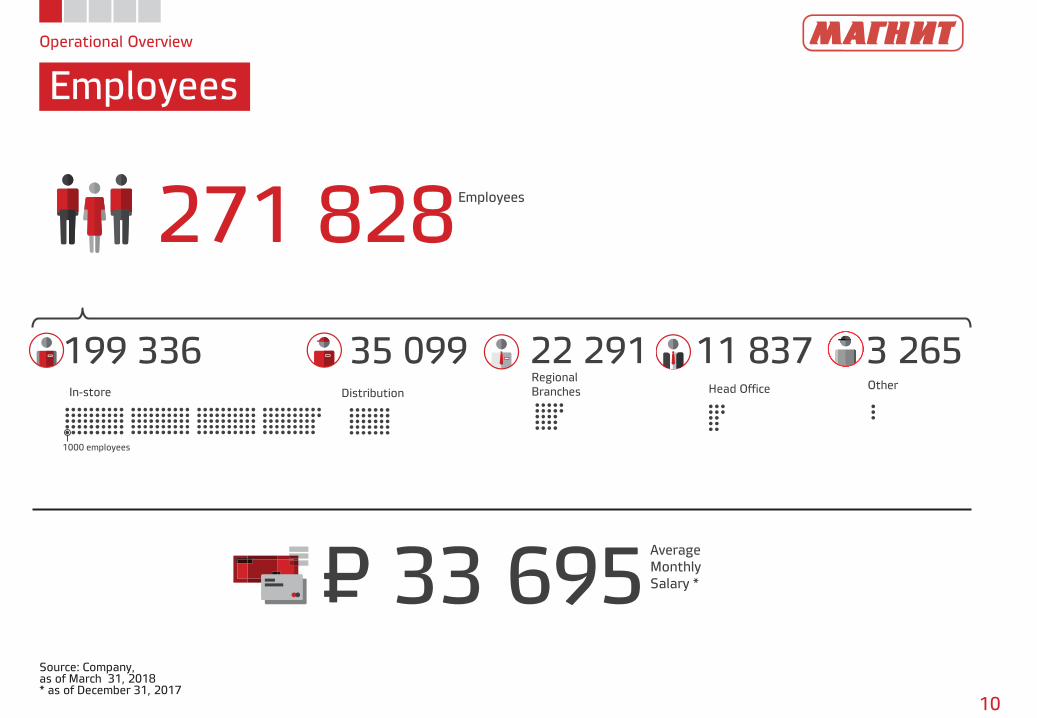
Operational Overview
Employees
10
Source: Company, as of March 31, 2018* as of December 31, 2017
271 828Employees
33 695Average
Monthly
Salary *P=
199 336In-store
35 099Distribution
22 291Regional
Branches
11 837Head Office
1000 employees
3 265Other
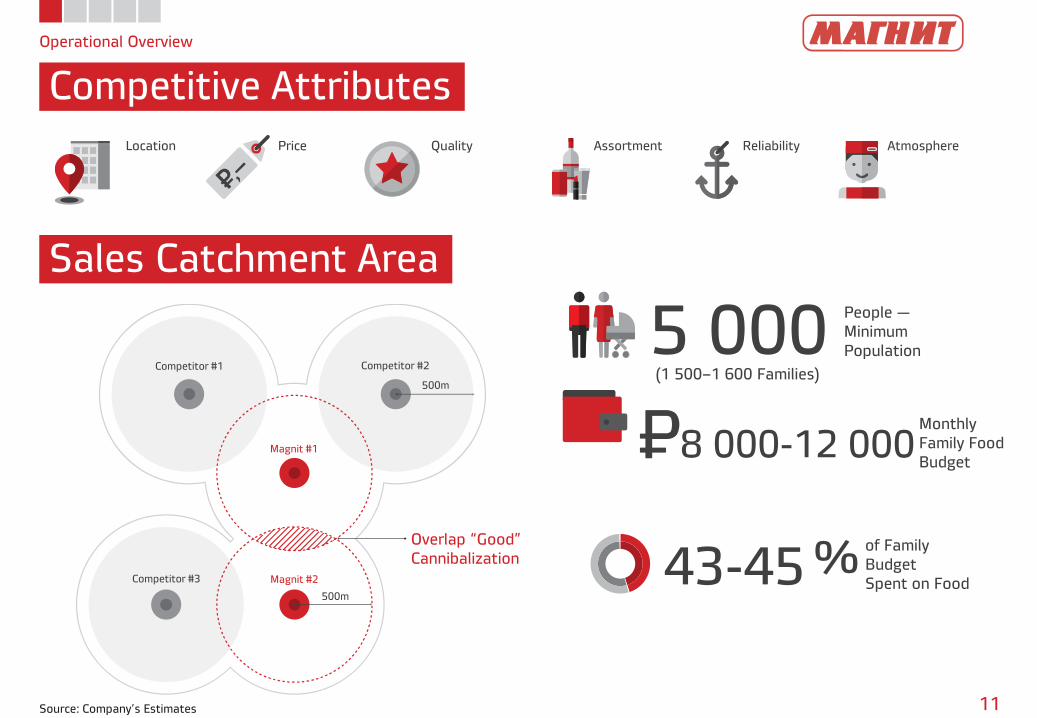
Operational Overview
Competitive Attributes
11
43-45 %of Family
Budget
Spent on Food
Location Quality Assortment Reliability AtmospherePrice
5 000People —
Minimum
Population
(1 500–1 600 Families)
8 000-12 000Monthly
Family Food
BudgetP=
Overlap “Good”
Cannibalization
Magnit #1
Magnit #2
500m
Competitor #1 Competitor #2
Competitor #3
500m
Sales Catchment Area
Source: Company’s Estimates
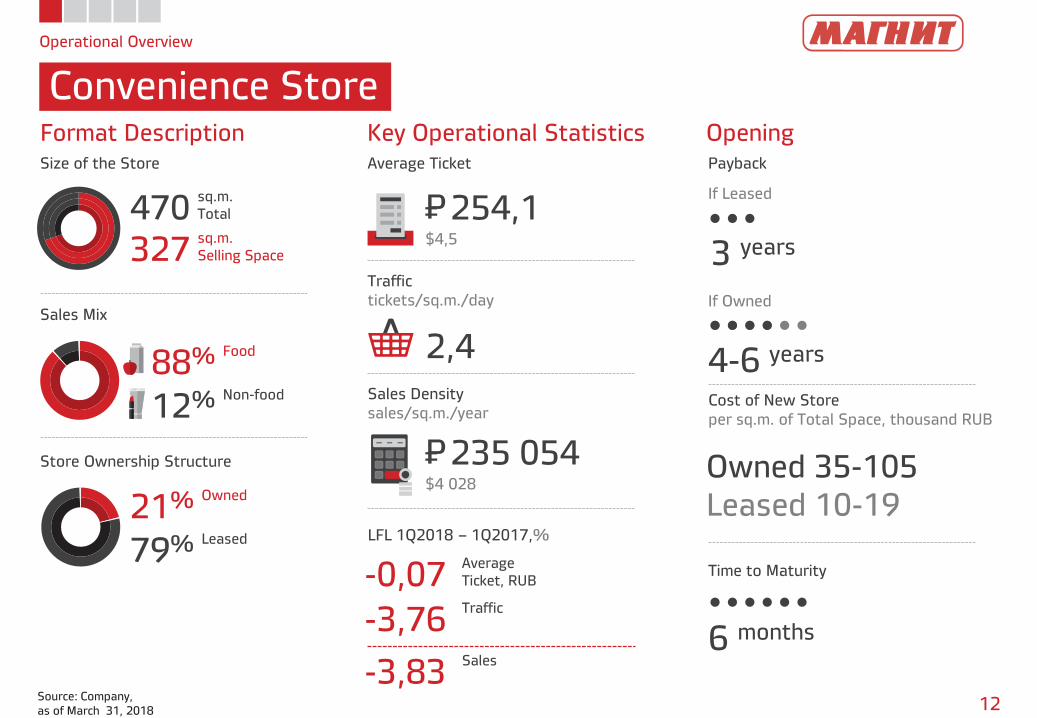
Operational Overview
Convenience Store
12Source: Company,
as of March 31, 2018
470sq.m.
Total
327sq.m.
Selling Space
88% Food
12% Non-food
21% Owned
79% Leased
Format Description Key Operational Statistics Opening
Size of the Store Average Ticket Payback
Store Ownership Structure
Sales Mix
Traffic
tickets/sq.m./day
Sales Density
sales/sq.m./year
LFL 1Q2018 – 1Q2017,%
254,1P=$4,5
235 054P=$4 028
-0,07Average
Ticket, RUB
-3,76Traffic
-3,83Sales
2,4
3 years
If Leased
If Owned
Cost of New Store
per sq.m. of Total Space, thousand RUB
Time to Maturity
6 months
4-6 years
Owned 35-105
Leased 10-19
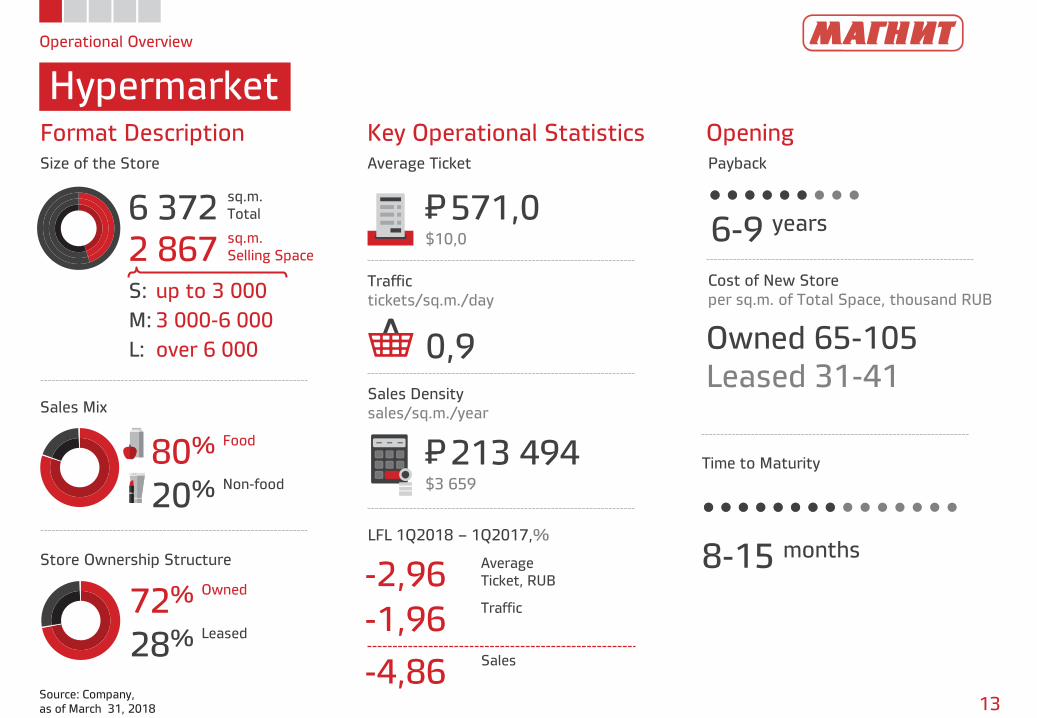
Operational Overview
Hypermarket
13Source: Company,
as of March 31, 2018
80% Food
20% Non-food
72% Owned
28% Leased
Format Description Key Operational Statistics
Size of the Store Average Ticket
Store Ownership Structure
Sales Mix
Traffic
tickets/sq.m./day
Sales Density
sales/sq.m./year
LFL 1Q2018 – 1Q2017,%
571,0P=$10,0
213 494P=$3 659
0,9
6 372sq.m.
Total
2 867sq.m.
Selling Space
-2,96Average
Ticket, RUB
-1,96Traffic
-4,86Sales
Opening
Payback
6-9 years
Cost of New Store
per sq.m. of Total Space, thousand RUB
Owned 65-105
Leased 31-41
8-15 months
Time to Maturity
S: up to 3 000
M: 3 000-6 000
L: over 6 000
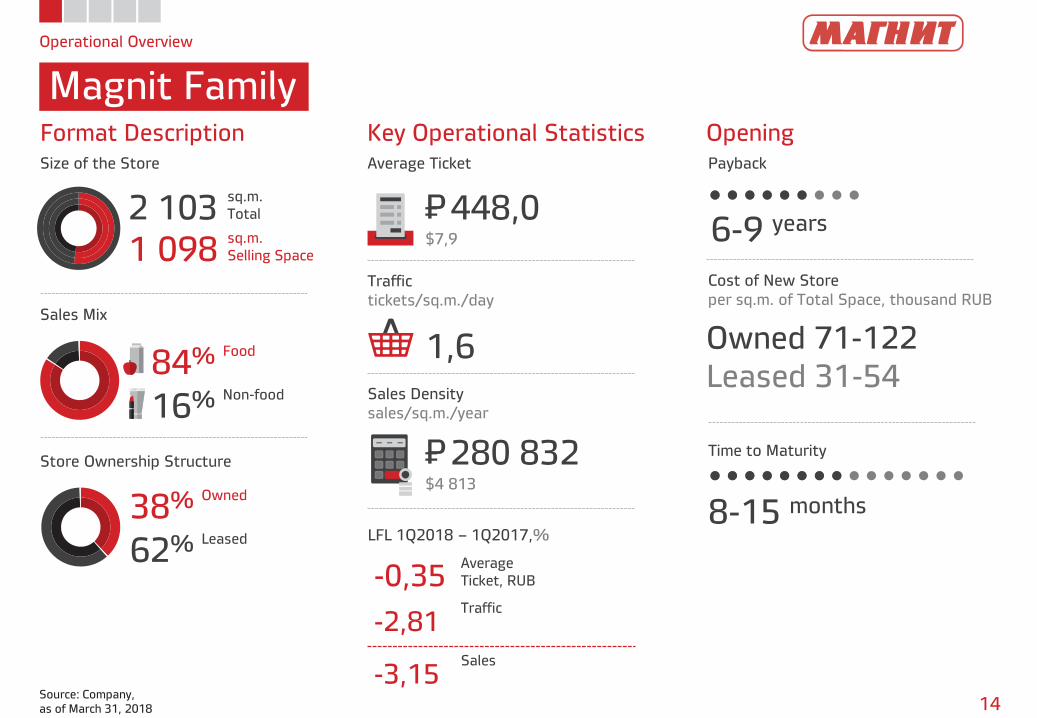
Operational Overview
Magnit Family
14Source: Company,
as of March 31, 2018
2 103sq.m.
Total
1 098sq.m.
Selling Space
84% Food
16% Non-food
38% Owned
62% Leased
Format Description Key Operational Statistics Opening
Size of the Store Average Ticket Payback
Store Ownership Structure
Sales Mix
Traffic
tickets/sq.m./day
Sales Density
sales/sq.m./year
LFL 1Q2018 – 1Q2017,%
448,0P=$7,9
280 832P=$4 813
1,6
6-9 years
Cost of New Store
per sq.m. of Total Space, thousand RUB
Owned 71-122
Leased 31-54
8-15 months
-0,35Average
Ticket, RUB
-2,81Traffic
-3,15Sales
Time to Maturity
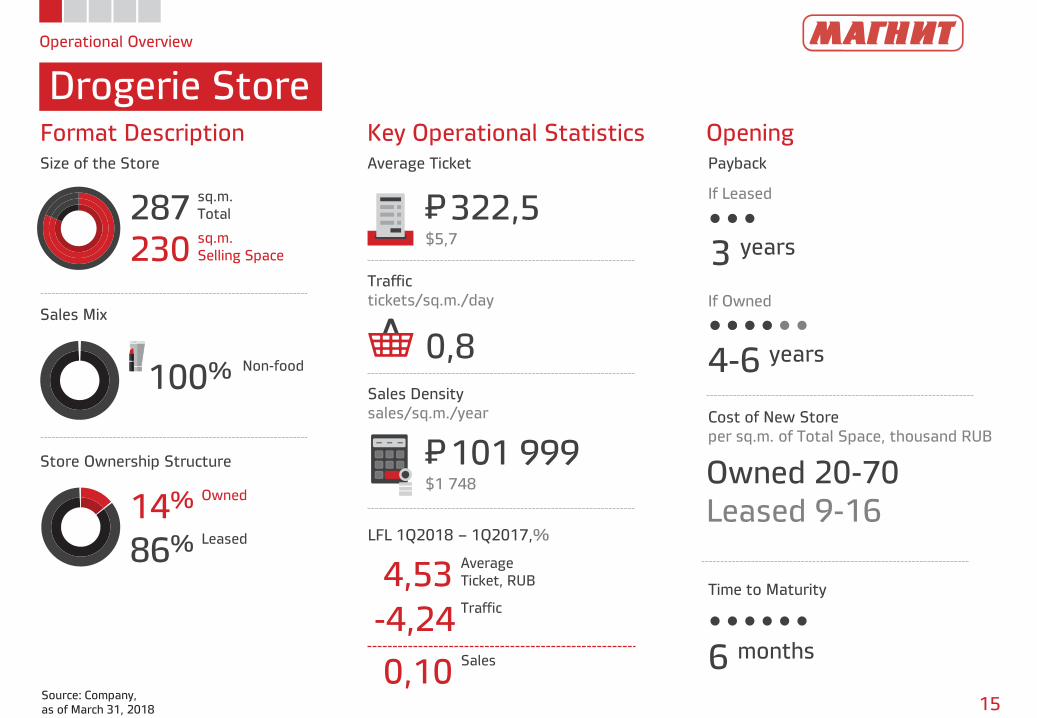
Operational Overview
Drogerie Store
15Source: Company,
as of March 31, 2018
287sq.m.
Total
230sq.m.
Selling Space
14% Owned
86% Leased
Format Description Key Operational Statistics Opening
Size of the Store Average Ticket Payback
Store Ownership Structure
Sales Mix
Traffic
tickets/sq.m./day
Sales Density
sales/sq.m./year
LFL 1Q2018 – 1Q2017,%
322,5P=$5,7
101 999P=$1 748
4,53Average
Ticket, RUB
-4,24Traffic
0,10Sales
0,8
3 years
If Leased
If Owned
Cost of New Store
per sq.m. of Total Space, thousand RUB
Time to Maturity
6 months
Owned 20-70
Leased 9-16
4-6 years
100% Non-food
Size
of the Storesq.m.
Average
Ticket
Traffic
Tickets/sq.m./day
Density
Sales/sq.m./year
Sales
Mix
LFL 1Q2018-
1Q2017%
Store Owner-
ship Structure
PaybackYears
Cost of New
Storeper sq.m.
of Total Space
Time
to MaturityMonths
• Total
• Selling Space
• Food
• Non-food
• Av.ticket
• Traffic/ Sales
• Owned
• Leased
-0,07
-2,96
4,53
-0,35
-3,76
-1,96
-4,24
-2,81
-3,83
-4,86
0,10
-3,15
80%
20%
14%
86%
38%
62%
72%
28%
21%
79%
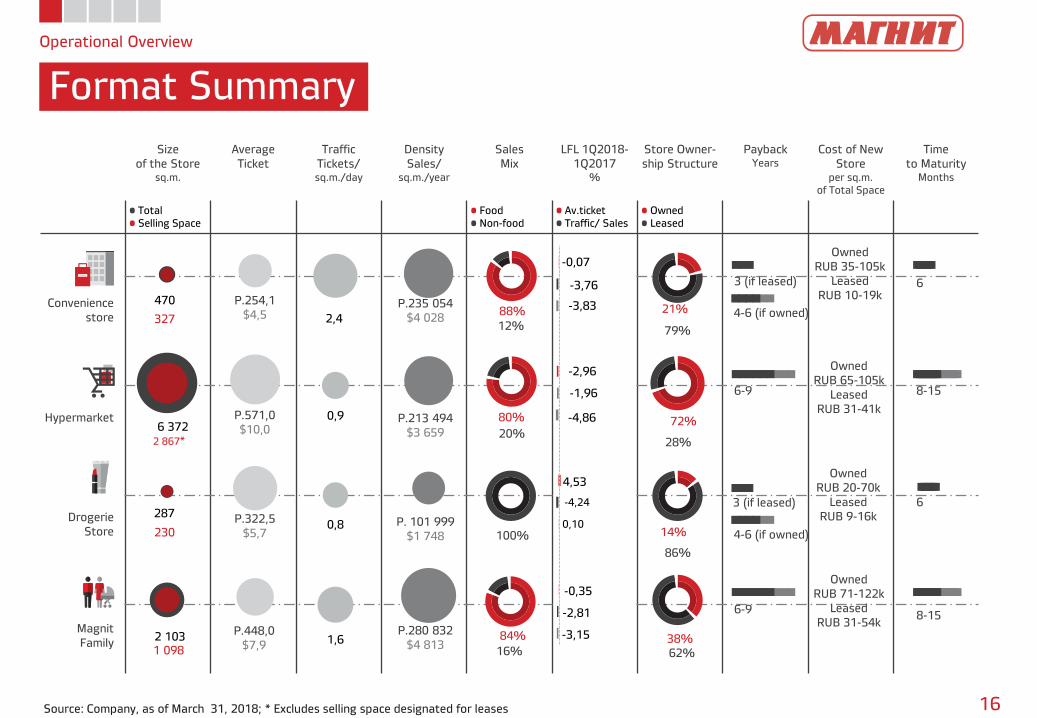
Operational Overview
Format Summary
16Source: Company, as of March 31, 2018; * Excludes selling space designated for leases
Hypermarket
Drogerie
Store
Magnit
Family
470
6 372
287
2 103
327
2 867*
230
1 098
Owned
RUB 35-105k
Leased
RUB 10-19k
2,4
0,9
0,8
1,6
P.254,1
$4,5
P.571,0
$10,0
P.322,5
$5,7
P.448,0
$7,9
P.235 054
$4 028
P.213 494
$3 659
P. 101 999
$1 748
P.280 832
$4 813
88%
12%
Convenience
store
6
8-15
6
8-15
3 (if leased)
6-9
3 (if leased)
6-9
4-6 (if owned)
4-6 (if owned)
Owned
RUB 65-105k
Leased
RUB 31-41k
Owned
RUB 20-70k
Leased
RUB 9-16k
Owned
RUB 71-122k
Leased
RUB 31-54k84%
16%
100%
Financial Overview
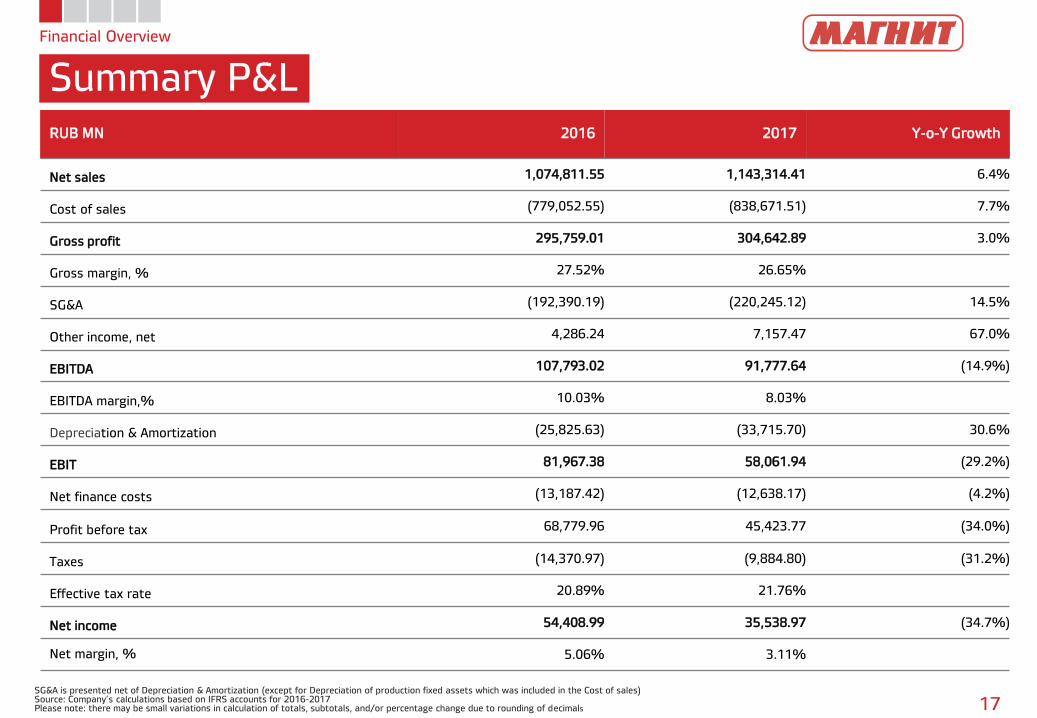
Summary P&L
SG&A is presented net of Depreciation & Amortization (except for Depreciation of production fixed assets which was included in the Cost of sales)Source: Company’s calculations based on IFRS accounts for 2016-2017Please note: there may be small variations in calculation of totals, subtotals, and/or percentage change due to rounding of decimals 17
RUB MN 2016 2017 Y-o-Y Growth
Net sales 1,074,811.55 1,143,314.41 6.4%
Cost of sales (779,052.55) (838,671.51) 7.7%
Gross profit 295,759.01 304,642.89 3.0%
Gross margin, % 27.52% 26.65%
SG&A (192,390.19) (220,245.12) 14.5%
Other income, net 4,286.24 7,157.47 67.0%
EBITDA 107,793.02 91,777.64 (14.9%)
EBITDA margin,% 10.03% 8.03%
Depreciation & Amortization (25,825.63) (33,715.70) 30.6%
EBIT 81,967.38 58,061.94 (29.2%)
Net finance costs (13,187.42) (12,638.17) (4.2%)
Profit before tax 68,779.96 45,423.77 (34.0%)
Taxes (14,370.97) (9,884.80) (31.2%)
Effective tax rate 20.89% 21.76%
Net income 54,408.99 35,538.97 (34.7%)
Net margin, % 5.06% 3.11%
5954
36
2015 2016 2017
9511 075 1 143
2015 2016 2017
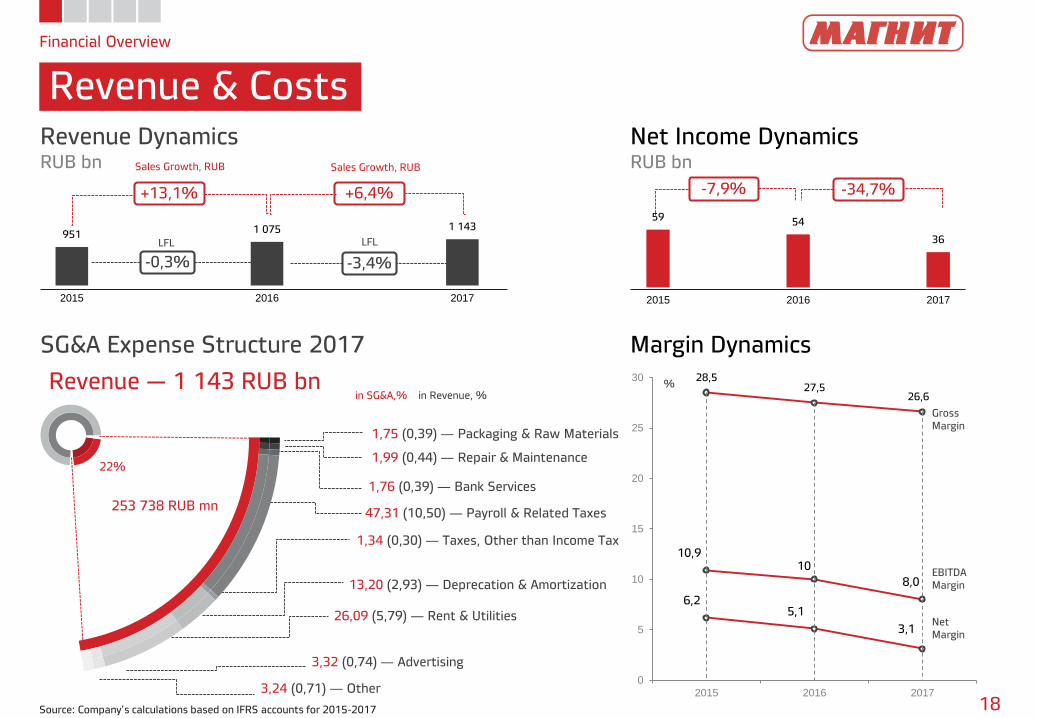
Financial Overview
Revenue & Costs
18Source: Company’s calculations based on IFRS accounts for 2015-2017
28,527,5
26,6
10,910
8,0
6,25,1
3,1
0
5
10
15
20
25
30
2015 2016 2017
Revenue DynamicsRUB bn
Net Income DynamicsRUB bn
Margin DynamicsSG&A Expense Structure 2017
Revenue — 1 143 RUB bn
Gross
Margin
EBITDA
Margin
Net
Margin
%
+13,1%
-0,3% -3,4%
+6,4% -7,9% -34,7%
LFLLFL
Sales Growth, RUB Sales Growth, RUB
1,75 (0,39) ― Packaging & Raw Materials
1,99 (0,44) ― Repair & Maintenance
47,31 (10,50) ― Payroll & Related Taxes
1,34 (0,30)― Taxes, Other than Income Tax
13,20 (2,93) ― Deprecation & Amortization
26,09 (5,79) ― Rent & Utilities
3,24 (0,71) ― Other
in SG&A,% in Revenue, %
3,32 (0,74) ― Advertising
1,76 (0,39) ― Bank Services
22%
253 738 RUB mn
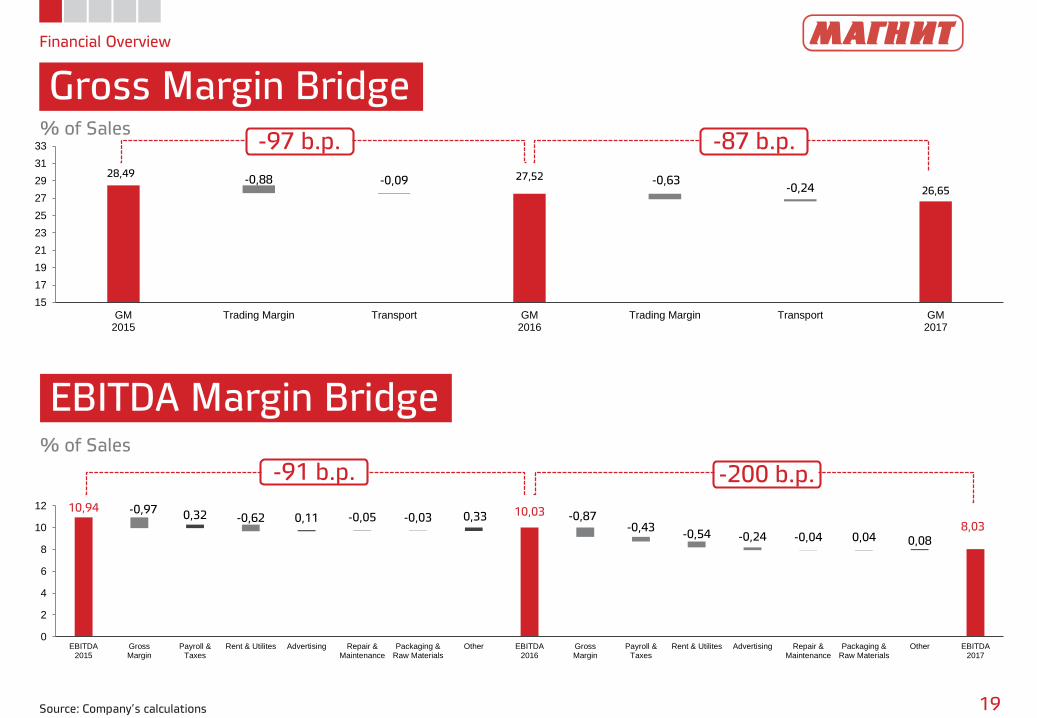
28,49 27,52
26,65-0,88 -0,09 -0,63
-0,24
15
17
19
21
23
25
27
29
31
33
GM2015
Trading Margin Transport GM2016
Trading Margin Transport GM2017
Financial Overview
Gross Margin Bridge
19Source: Company’s calculations
EBITDA Margin Bridge
% of Sales
% of Sales
-87 b.p.
-91 b.p. -200 b.p.
10,94 10,03
8,03
-0,97-0,62 -0,05 -0,03 -0,87
-0,43-0,54 -0,24 -0,04
0,32 0,11 0,33
0,04 0,08
0
2
4
6
8
10
12
EBITDA2015
GrossMargin
Payroll &Taxes
Rent & Utilites Advertising Repair &Maintenance
Packaging &Raw Materials
Other EBITDA2016
GrossMargin
Payroll &Taxes
Rent & Utilites Advertising Repair &Maintenance
Packaging &Raw Materials
Other EBITDA2017
-97 b.p.
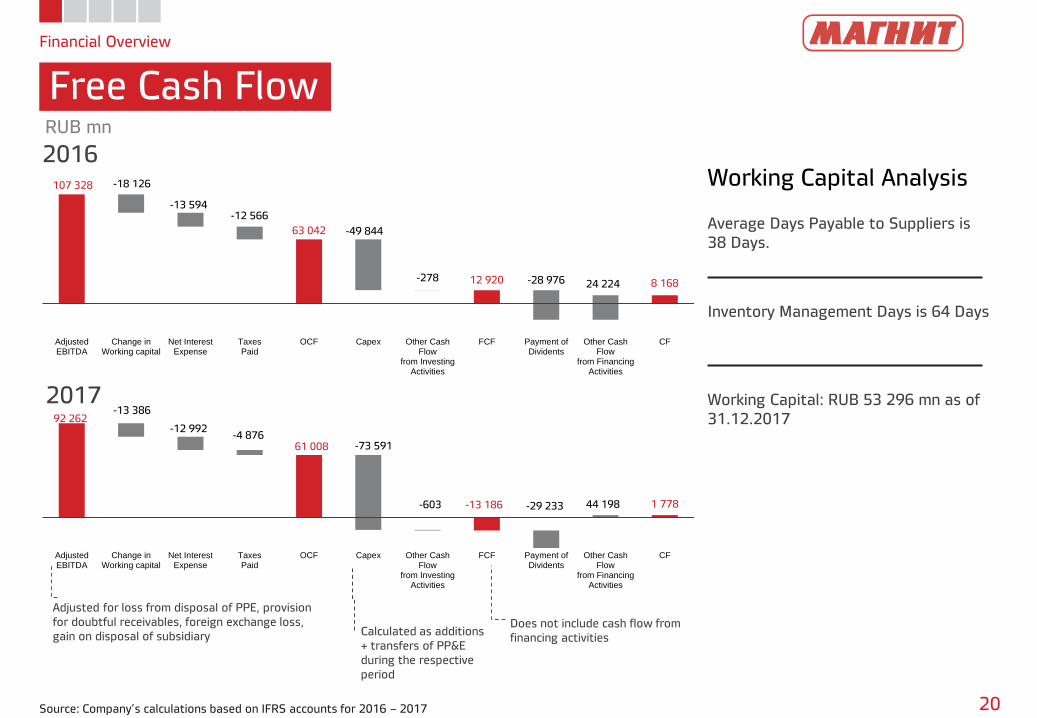
Financial Overview
Free Cash Flow
20Source: Company’s calculations based on IFRS accounts for 2016 – 2017
Working Capital Analysis
Average Days Payable to Suppliers is
38 Days.
Inventory Management Days is 64 Days
Working Capital: RUB 53 296 mn as of
31.12.2017
RUB mn
2016
2017
Adjusted for loss from disposal of PPE, provision
for doubtful receivables, foreign exchange loss,
gain on disposal of subsidiary Calculated as additions
+ transfers of PP&E
during the respective
period
Does not include cash flow from
financing activities
107 328
63 042
12 920 8 168
-18 126
-13 594-12 566
-49 844
-278 -28 976 24 224
AdjustedEBITDA
Change inWorking capital
Net InterestExpense
TaxesPaid
OCF Capex Other CashFlow
from InvestingActivities
FCF Payment ofDividents
Other CashFlow
from FinancingActivities
CF
92 262
61 008
-13 186 1 778
-13 386
-12 992-4 876
-73 591
-603 -29 233 44 198
AdjustedEBITDA
Change inWorking capital
Net InterestExpense
TaxesPaid
OCF Capex Other CashFlow
from InvestingActivities
FCF Payment ofDividents
Other CashFlow
from FinancingActivities
CF
Financial Overview
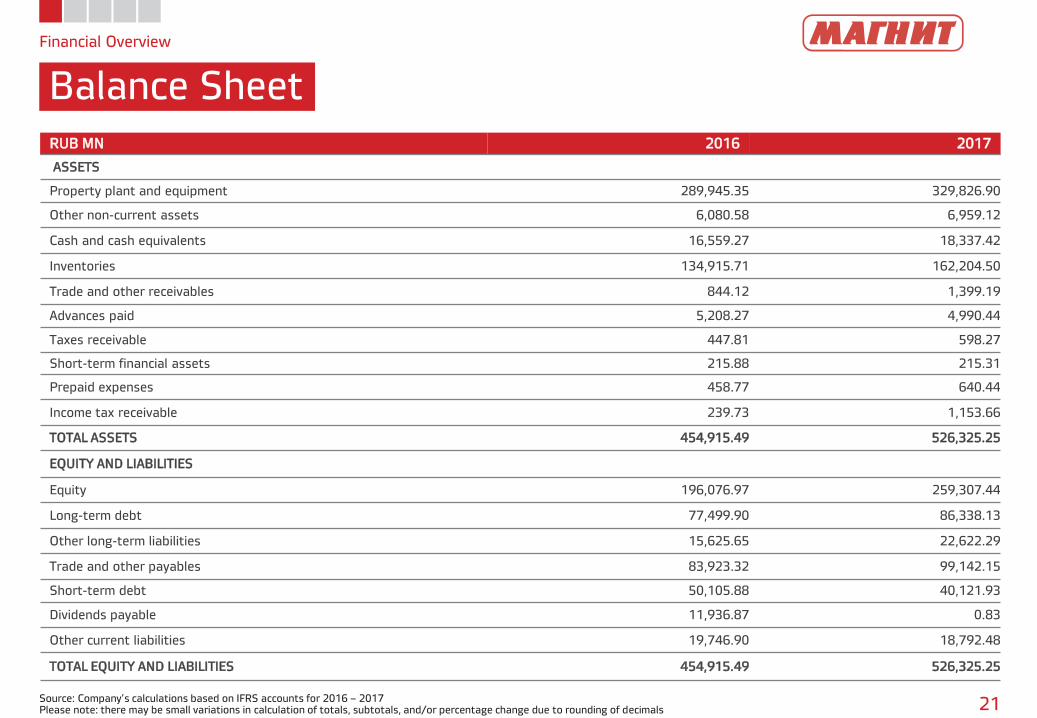
Balance Sheet
Source: Company’s calculations based on IFRS accounts for 2016 – 2017Please note: there may be small variations in calculation of totals, subtotals, and/or percentage change due to rounding of decimals 21
RUB MN 2016 2017
ASSETS
Property plant and equipment 289,945.35 329,826.90
Other non-current assets 6,080.58 6,959.12
Cash and cash equivalents 16,559.27 18,337.42
Inventories 134,915.71 162,204.50
Trade and other receivables 844.12 1,399.19
Advances paid 5,208.27 4,990.44
Taxes receivable 447.81 598.27
Short-term financial assets 215.88 215.31
Prepaid expenses 458.77 640.44
Income tax receivable 239.73 1,153.66
TOTAL ASSETS 454,915.49 526,325.25
EQUITY AND LIABILITIES
Equity 196,076.97 259,307.44
Long-term debt 77,499.90 86,338.13
Other long-term liabilities 15,625.65 22,622.29
Trade and other payables 83,923.32 99,142.15
Short-term debt 50,105.88 40,121.93
Dividends payable 11,936.87 0.83
Other current liabilities 19,746.90 18,792.48
TOTAL EQUITY AND LIABILITIES 454,915.49 526,325.25
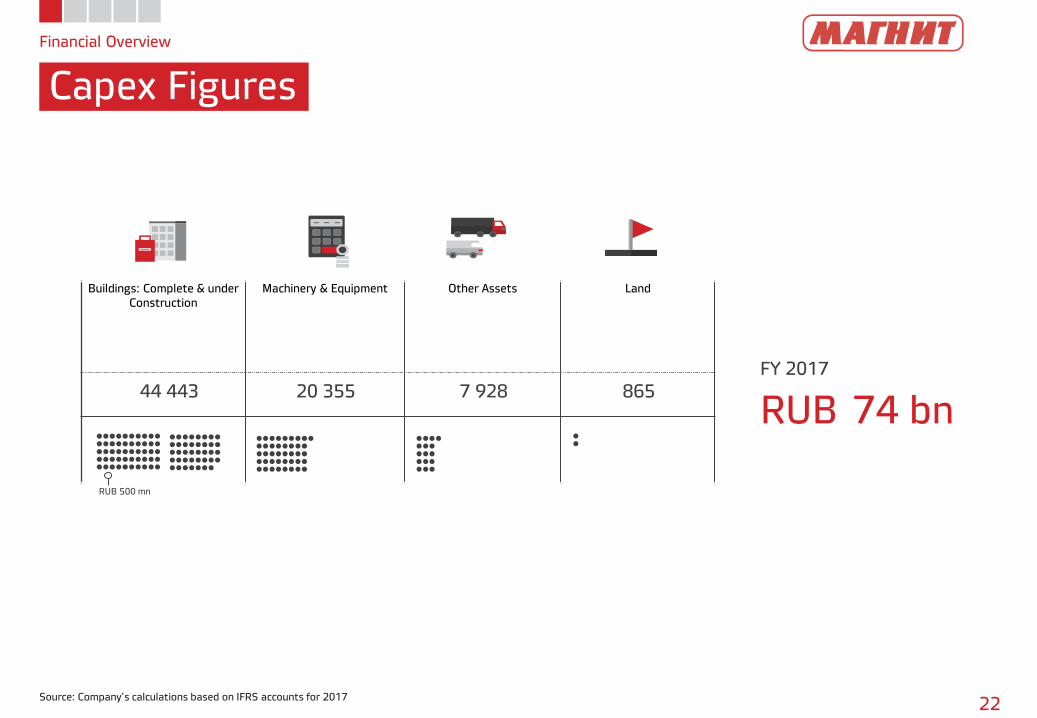
Financial Overview
Capex Figures
22Source: Company’s calculations based on IFRS accounts for 2017
Buildings: Complete & under
Construction
Machinery & Equipment Other Assets Land
44 443 20 355 7 928 865
FY 2017
RUB 74 bn
RUB 500 mn
104 228
127 606 126 460
95 837
111 047108 123
44 817
50 106
40 122
59 411
77 500
86 338
2015 2016 2017
Net Debt
Short-term Debt
Long-term Debt
%
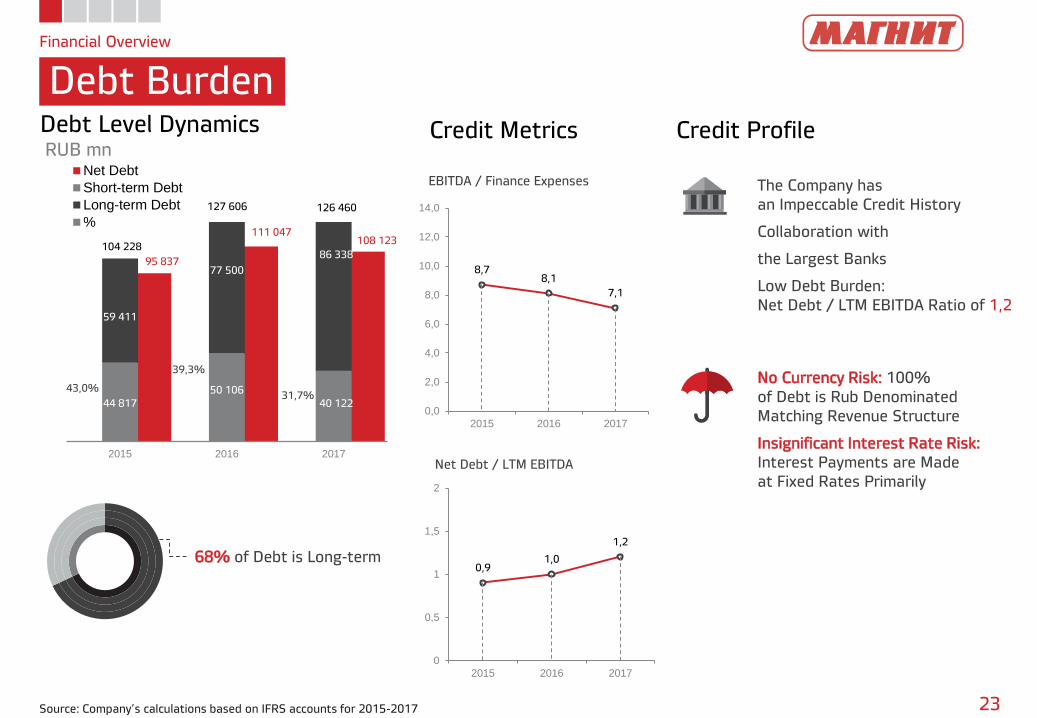
Financial Overview
Debt Burden
23Source: Company’s calculations based on IFRS accounts for 2015-2017
8,78,1
7,1
0,0
2,0
4,0
6,0
8,0
10,0
12,0
14,0
2015 2016 2017
0,91,0
1,2
0
0,5
1
1,5
2
2015 2016 2017
Debt Level DynamicsRUB mn
Credit Metrics Credit Profile
EBITDA / Finance Expenses
Net Debt / LTM EBITDA
The Company has
an Impeccable Credit History
Collaboration with
the Largest Banks
Low Debt Burden:
Net Debt / LTM EBITDA Ratio of 1,2
No Currency Risk: 100%
of Debt is Rub Denominated
Matching Revenue Structure
Insignificant Interest Rate Risk:
Interest Payments are Made
at Fixed Rates Primarily
43,0%
39,3%
31,7%
68% of Debt is Long-term
Contact Information
Contact Information
24
Timothy Post
Head of Investor Relations
http://ir.magnit.com
15/2 Solnechnaya Street
Krasnodar, 350072
Russian Federation


