Making the most of PIAAC: Preliminary investigation of adults’ numeracy practices through secondary analysis of the PIAAC dataset Diana Coben University of Waikato New Zealand [email protected]Barbara Miller-Reilly Paul Satherley and David Earle University of Auckland Ministry of Education New Zealand New Zealand ALM22 conference: Opening Our Mathematical Eyes
Transcript
Making the most of PIAAC:Preliminary investigation of adults’ numeracy practices through secondary analysis of the
• Exploring what secondary analysis of PIAAC data can tell us about what adults do regarding numeracy
• Reviewing accessibility and user-friendliness of the data
• Encouraging beginners and experienced practitioners and researchers to explore the PIAAC dataset
Making the most of secondary data sources
“A number of secondary data sources […] are currently under utilised for education research on adults.
One reason for this is that a huge time investment is needed by the researcher to analyse such data, as the data sets are large and complex.
Making available better guidance specific to education researchers would be helpful to encourage greater use of these data sets.”
(Vignoles, 2007)
Numeracy in PIAAC
“the ability to access, use, interpret and communicate mathematical information and ideas in order to engage in and manage the mathematical demands of a range of situations in adult life…”
“Numerate behaviour involves managing a situation or solving a problem in a real context, by responding to mathematical content/information/ideas represented in multiple ways.”
(OECD, 2012, p. 34)
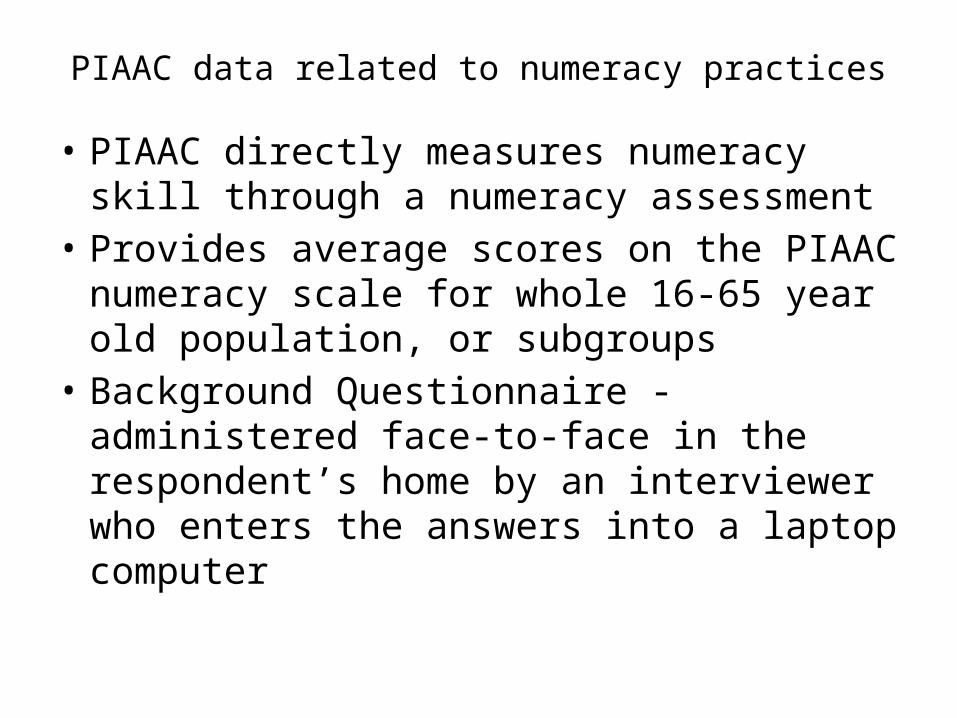
PIAAC data related to numeracy practices
• PIAAC directly measures numeracy skill through a numeracy assessment
• Provides average scores on the PIAAC numeracy scale for whole 16-65 year old population, or subgroups
• Background Questionnaire - administered face-to-face in the respondent’s home by an interviewer who enters the answers into a laptop computer
PIAAC Background QuestionnaireCovers educational background, skills used at work (for those currently or recently in employment) and in other contexts such as the home and the community, e.g.:
– Demographic characteristics – age, gender, ethnicity, country of birth, first language, language spoken most often at home
– Other personal characteristics – learning dispositions, self-assessed health status
– Education and training characteristics– Work characteristics– Self-assessed mathematics skills for work– Self-assessed reading and writing skills for work– Skill use in everyday life – literacy activities, ICT activities
May help answer interesting questions when analysed together with numeracy practice information
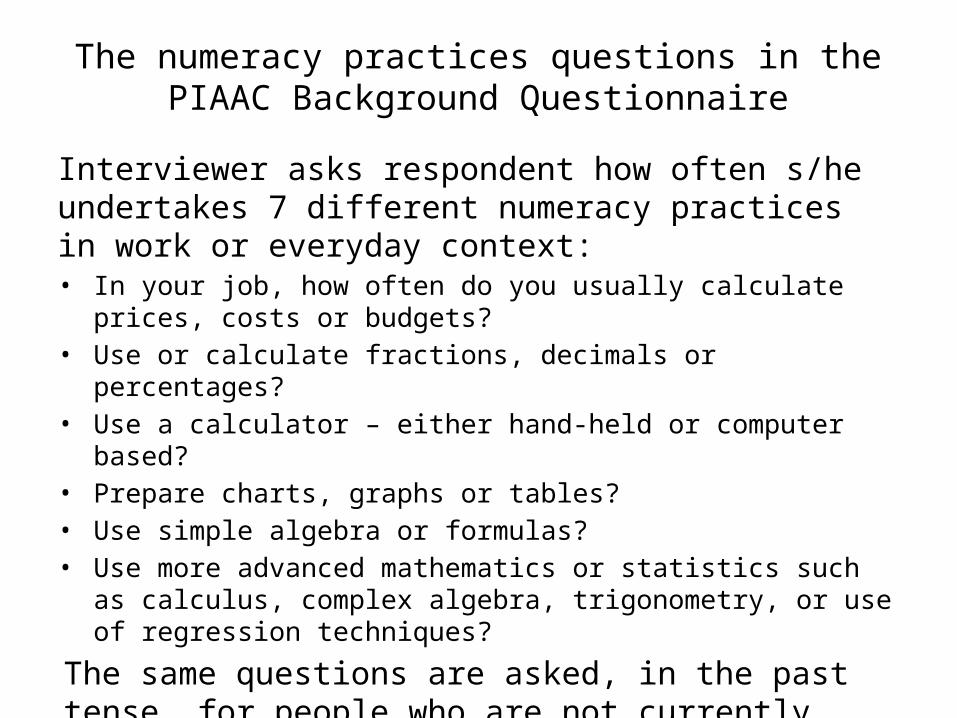
The numeracy practices questions in the PIAAC Background Questionnaire
Interviewer asks respondent how often s/he undertakes 7 different numeracy practices in work or everyday context: • In your job, how often do you usually calculate prices, costs or
budgets?• Use or calculate fractions, decimals or percentages?• Use a calculator – either hand-held or computer based?• Prepare charts, graphs or tables?• Use simple algebra or formulas?• Use more advanced mathematics or statistics such as calculus,
complex algebra, trigonometry, or use of regression techniques?
The same questions are asked, in the past tense, for people who are not currently working, but who worked in the last 12 months
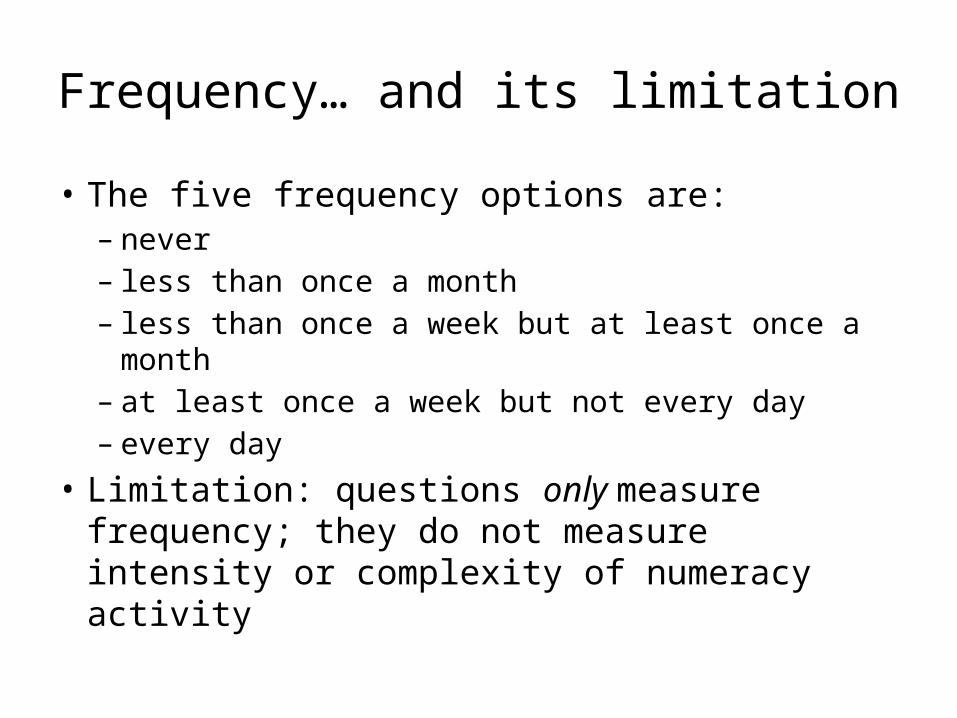
Frequency… and its limitation
• The five frequency options are:– never– less than once a month– less than once a week but at least once a month– at least once a week but not every day– every day
• Limitation: questions only measure frequency; they do not measure intensity or complexity of numeracy activity
Types of analysis and analysis issues• A range of types of analysis are possible to help answer
different questions about adults’ numeracy practices.• First steps often simple univariate tabulations - provide a
‘big picture’ view• Next steps may be multivariate analysis - allows better
understanding of complex associations between factors• PIAAC dataset can provide in-depth understanding of
associations between various factors• Multivariate analyses:
– can show which factors are most strongly associated with frequent numeracy practice, and
– can provide numerical measures of, e.g., how much increase in frequency of numeracy practice is associated with one unit of measured numeracy skill, whilst holding other factors constant
Secondary analysis of PIAAC data
Secondary analysis of PIAAC data is: • undertaken later in time than primary analysis• more in-depth and multivariate• less headline-focused and descriptive• brings together different parts of PIAAC dataset to generate new
knowledge and understanding of associations and relationships• provides empirical findings to build or refine conceptual or statistical
models• often theme-based, rather than general in focus
Primary PIAAC analysis:• includes average scale scores in PIAAC skill domains for key
demographic and socioeconomic groups• aligns with international headline reporting
What PIAAC data cannot tell us• PIAAC data cannot tell us to what extent frequent
numeracy practice causes high numeracy skill• Analytical writing should clearly distinguish associations
from causes and not use ambiguous language such as leads to, brings about, influences, is linked with, etc.
• It may be that numeracy practice, opportunity or requirement to undertake numeracy practice, and numeracy skill, are all mutually reinforcing
• Even where the data show a strong association between two factors (e.g., numeracy practice and numeracy skill) whilst controlling for other factors, we cannot infer that a change in one factor will result in a change in the other – either on an individual or a group level
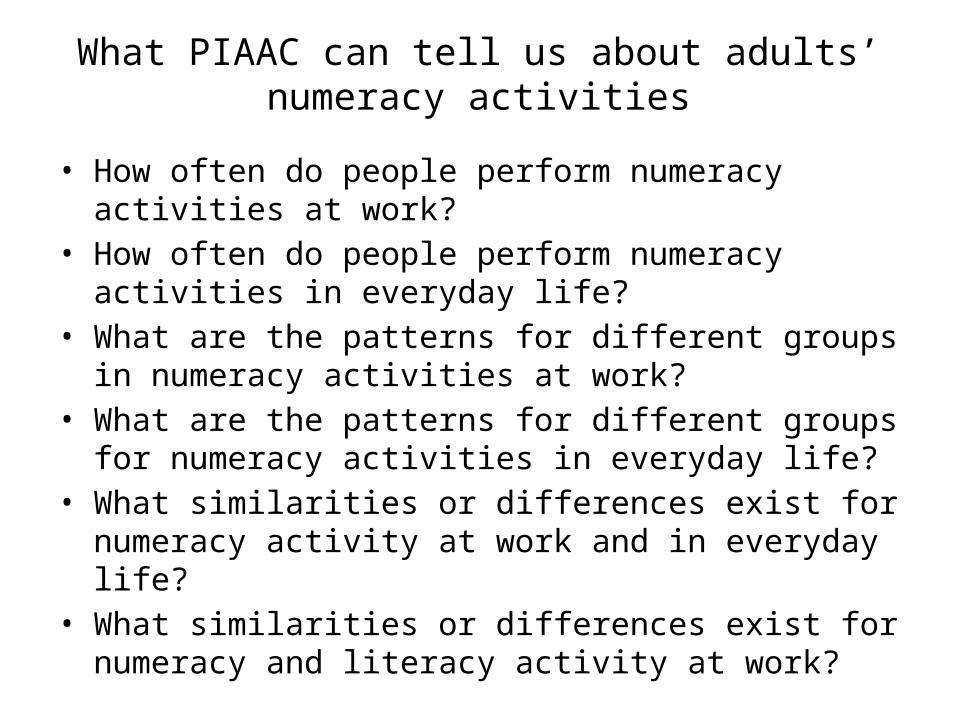
What PIAAC can tell us about adults’ numeracy activities
• How often do people perform numeracy activities at work?
• How often do people perform numeracy activities in everyday life?
• What are the patterns for different groups in numeracy activities at work?
• What are the patterns for different groups for numeracy activities in everyday life?
• What similarities or differences exist for numeracy activity at work and in everyday life?
• What similarities or differences exist for numeracy and literacy activity at work?
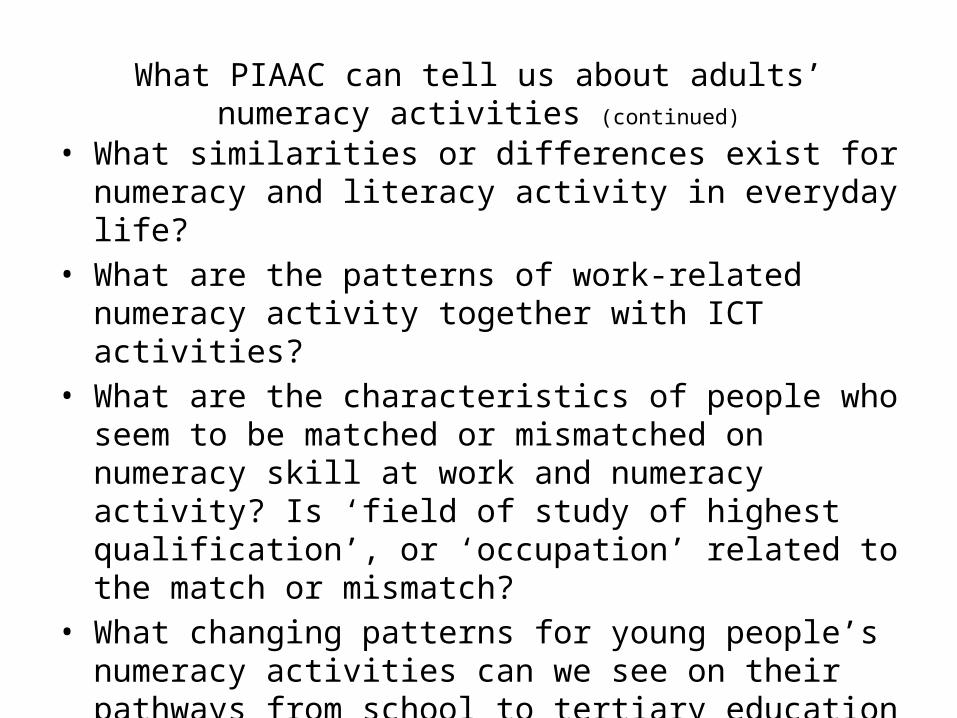
What PIAAC can tell us about adults’ numeracy activities (continued)
• What similarities or differences exist for numeracy and literacy activity in everyday life?
• What are the patterns of work-related numeracy activity together with ICT activities?
• What are the characteristics of people who seem to be matched or mismatched on numeracy skill at work and numeracy activity? Is ‘field of study of highest qualification’, or ‘occupation’ related to the match or mismatch?
• What changing patterns for young people’s numeracy activities can we see on their pathways from school to tertiary education to work?
• How have patterns of numeracy activity at work changed over time?
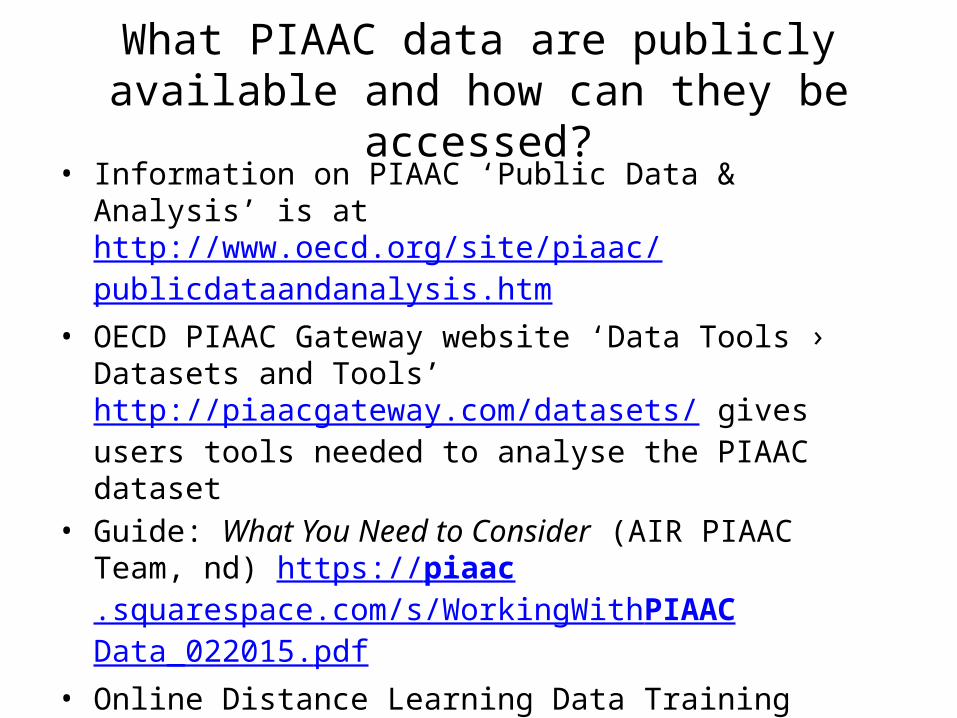
What PIAAC data are publicly available and how can they be accessed?
• Information on PIAAC ‘Public Data & Analysis’ is at http://www.oecd.org/site/piaac/publicdataandanalysis.htm
• OECD PIAAC Gateway website ‘Data Tools › Datasets and Tools’ http://piaacgateway.com/datasets/ gives users tools needed to analyse the PIAAC dataset
• Guide: What You Need to Consider (AIR PIAAC Team, nd) https://piaac.squarespace.com/s/WorkingWithPIAACData_022015.pdf
• Online Distance Learning Data Training (DLDT) modules http://nces.ed.gov/training/datauser/#PIAAC cover statistical procedures and methods of analysis
• FAQ webpage http://nces.ed.gov/surveys/piaac/faq.asp• Interactive ‘Q & A. Your questions, our answers’ athttp
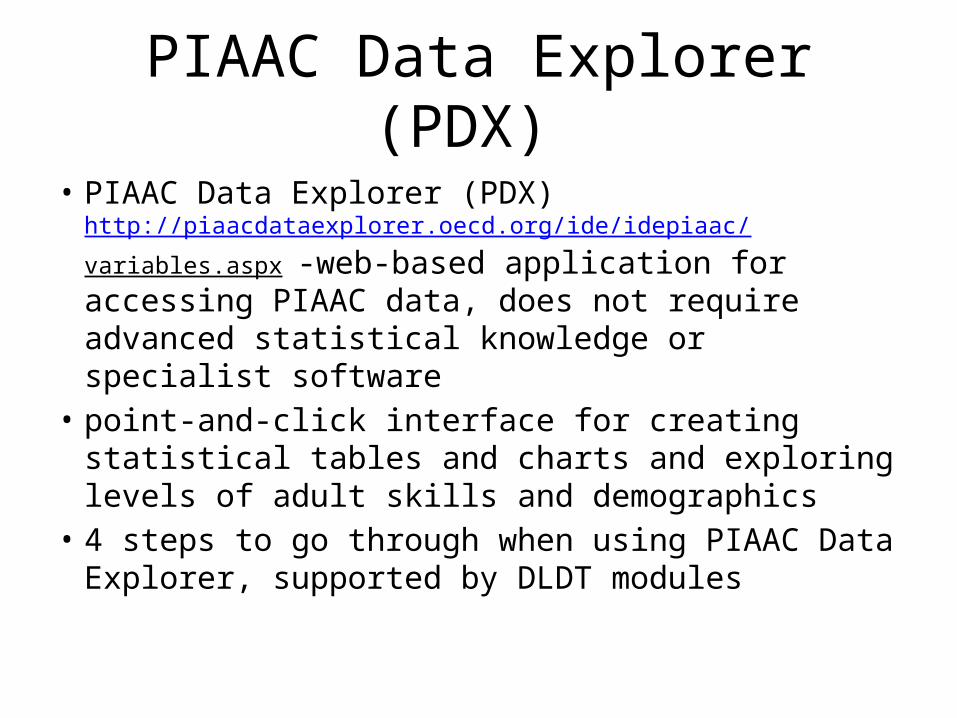
• PIAAC Data Explorer (PDX) http://piaacdataexplorer.oecd.org/ide/idepiaac/variables.aspx -web-based application for accessing PIAAC data, does not require advanced statistical knowledge or specialist software
• point-and-click interface for creating statistical tables and charts and exploring levels of adult skills and demographics
• 4 steps to go through when using PIAAC Data Explorer, supported by DLDT modules
• We chose “Numeracy” as our Subject• Note that “Adults (16-65)” only option for Age at this point• After choosing “Numeracy”, fuller screen appears with a
choice of dataset to use: “PIAAC 2012”, “ALL 2003” or “All years/studies”. We chose “PIAAC 2012”
• Then choice of 72 Categories and Groups. – Under the Category “Scale Scores”, and Sub-Category “Skills”,
the Measure “PIAAC Numeric: Numeracy” is already selected. – Under the Group “International”, we chose the Jurisdiction
“OECD average”
• Choose “Select Variables” to move to Step 2 to select the independent variable(s)
STEP 1
X
PIAAC International Data Explorer Step 2
• Under the Category (and Sub-Category) “Major reporting group” we chose the variable “All Adults”.
• In addition, under the category “International Background Questionnaire”, and Sub-Category” “Skill use – literacy & numeracy”, we chose the following six variables:
• “Skill use work - Numeracy - How often - Calculating costs or budgets”• “Skill use work - Numeracy - How often - Use or calculate fractions or percentages”• “Skill use work - Numeracy - How often - Use a calculator”• “Skill use work - Numeracy - How often - Prepare charts graphs or tables”• “Skill use work - Numeracy - How often - Use simple algebra or formulas”• “Skill use work - Numeracy - How often - Use advanced math or statistics”
• Now that the variables are selected, choose “Edit Reports” to move to Step 3.
STEP 2
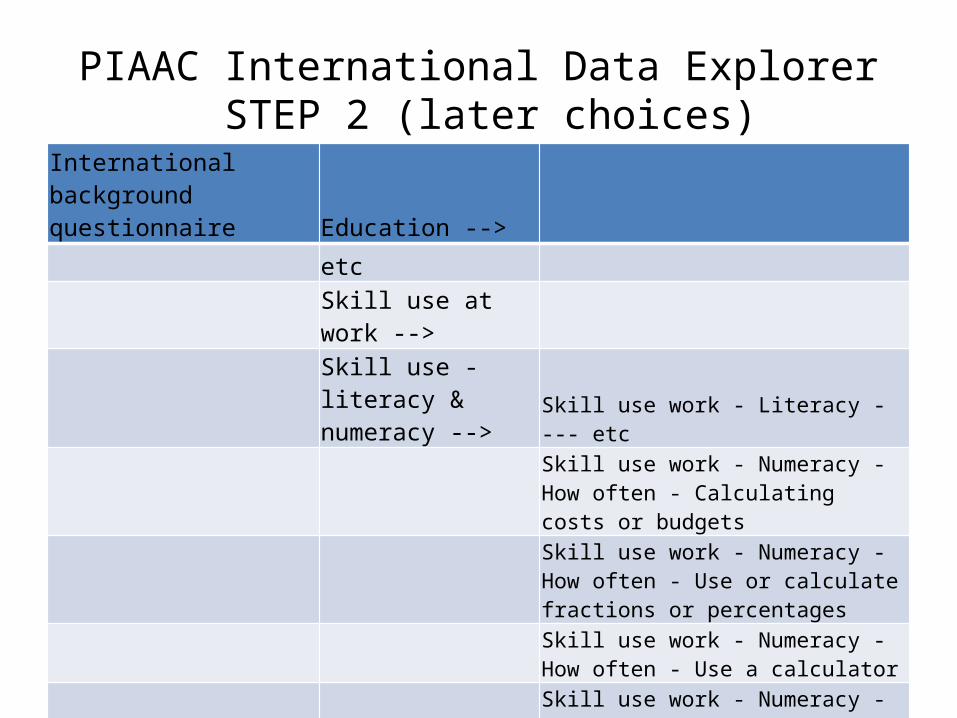
PIAAC International Data Explorer STEP 2 (later choices)
International background questionnaire Education -->
etc
Skill use at work -->Skill use - literacy & numeracy --> Skill use work - Literacy - --- etc
Skill use work - Numeracy - How often - Calculating costs or budgetsSkill use work - Numeracy - How often - Use or calculate fractions or percentages Skill use work - Numeracy - How often - Use a calculatorSkill use work - Numeracy - How often - Prepare charts graphs or tablesSkill use work - Numeracy - How often - Use simple algebra or formulas Skill use work - Numeracy - How often - Use advanced math or statistics
Skill use work - ICT - --- etc
PIAAC International Data Explorer Step 3
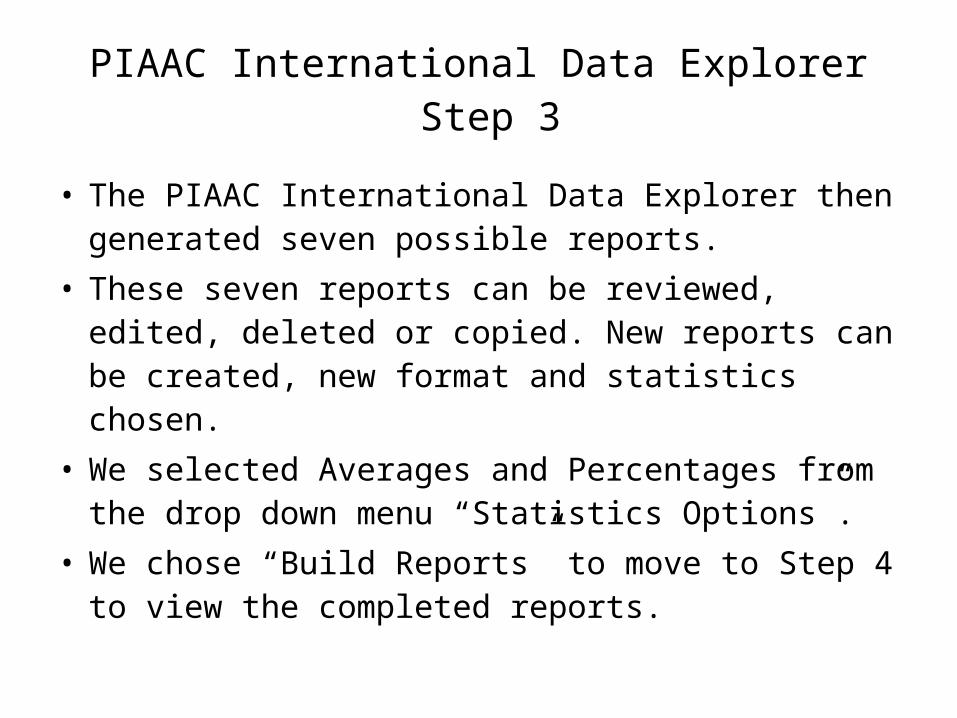
• The PIAAC International Data Explorer then generated seven possible reports.
• These seven reports can be reviewed, edited, deleted or copied. New reports can be created, new format and statistics chosen.
• We selected Averages and Percentages from the drop down menu “Statistics Options”.
• We chose “Build Reports” to move to Step 4 to view the completed reports.
STEP 3
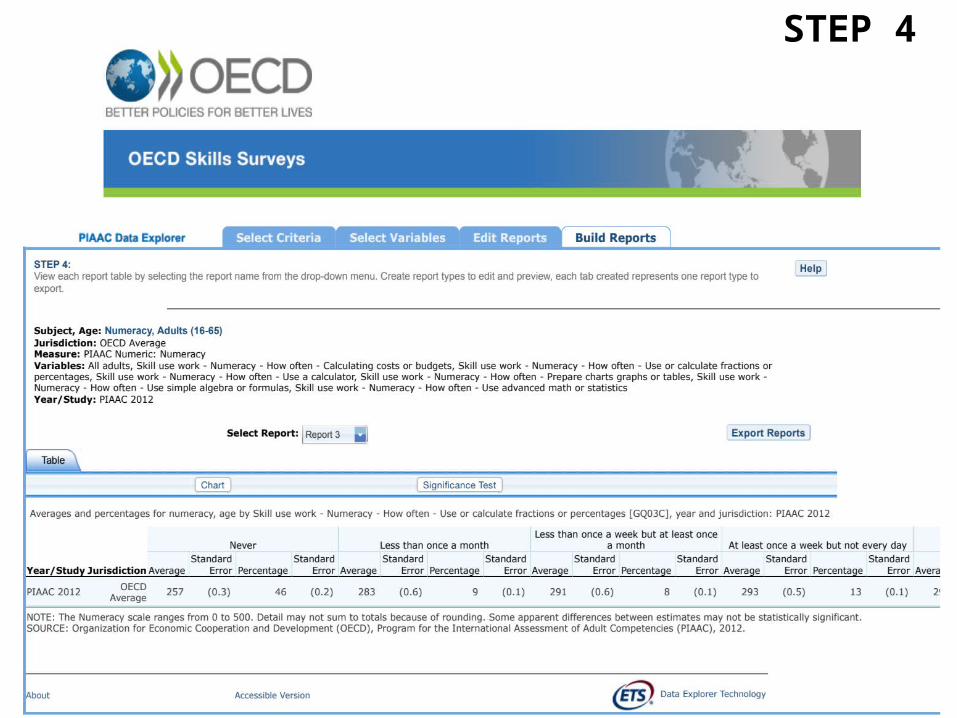
PIAAC International Data Explorer Step 4
• For each of the six variables of Numeracy Skills used at work, a report is generated.
• Each report lists Averages of the Numeracy scale scores and Percentages of the population (each with Standard Errors) for the response categories (Never; Less than once a month; Less then once a week but at least once a month; At least once a week but not every day; Every day).
• At Step 4 each report table can be viewed by selecting the report name from the drop-down menu. It is possible to generate charts and complete significant tests for any table.
• We chose “Export reports” to download selected reports as Excel worksheets (or Word document or HTML).
STEP 4
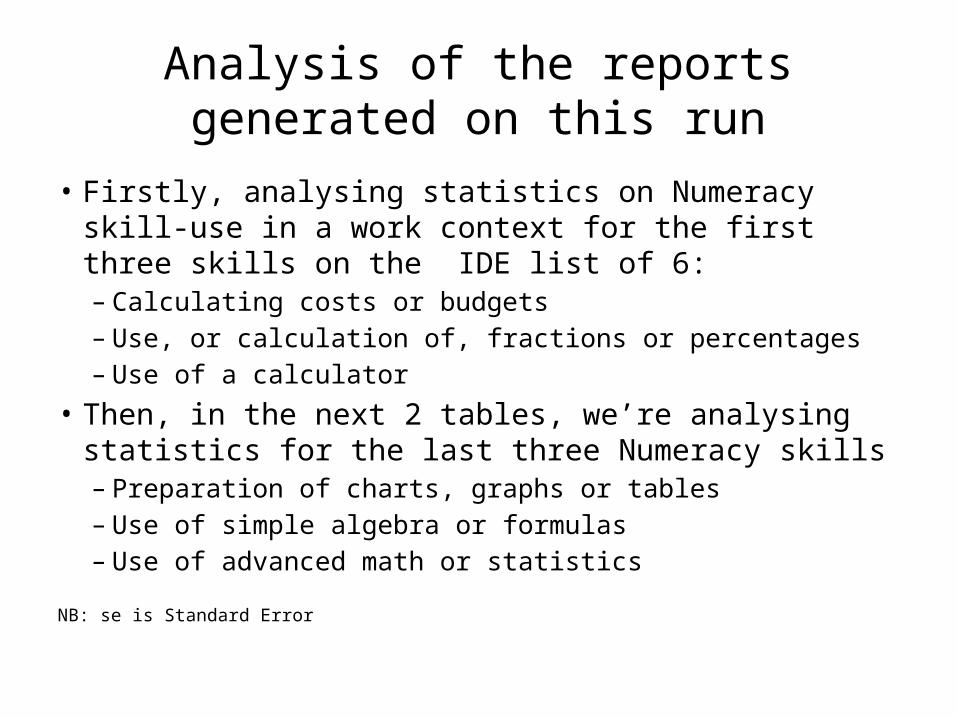
Analysis of the reports generated on this run
• Firstly, analysing statistics on Numeracy skill-use in a work context for the first three skills on the IDE list of 6: – Calculating costs or budgets– Use, or calculation of, fractions or percentages– Use of a calculator
• Then, in the next 2 tables, we’re analysing statistics for the last three Numeracy skills – Preparation of charts, graphs or tables– Use of simple algebra or formulas– Use of advanced math or statistics
NB: se is Standard Error
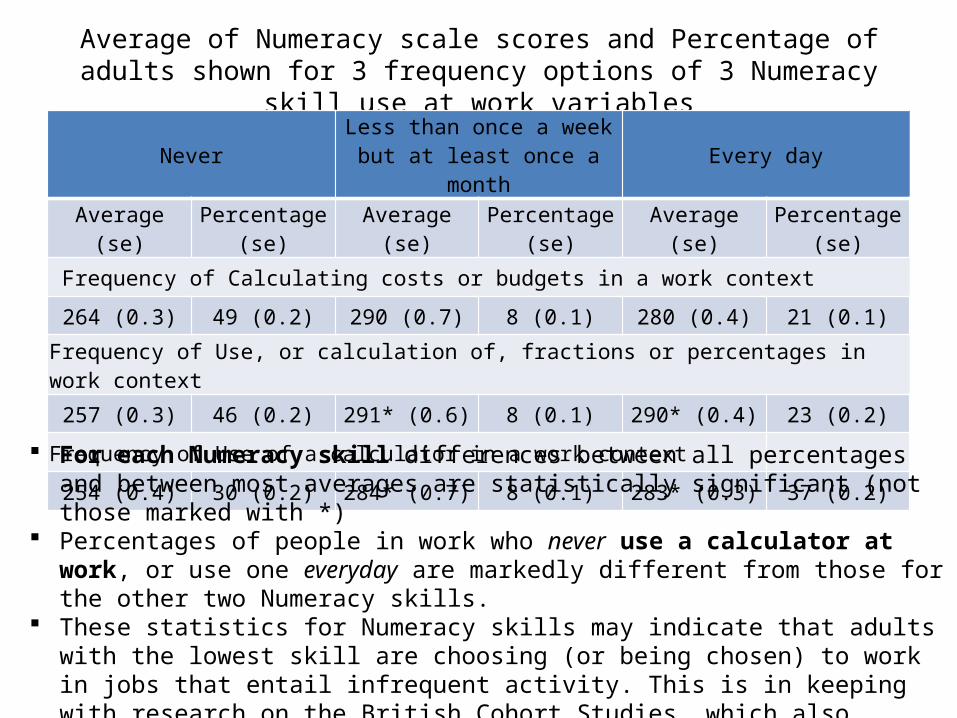
Average of Numeracy scale scores and Percentage of adults shown for 3 frequency options of 3 Numeracy skill use at work variables
NeverLess than once a week but at
least once a monthEvery day
Average (se) Percentage (se) Average (se) Percentage (se) Average (se) Percentage (se)
Frequency of Calculating costs or budgets in a work context
For each Numeracy skill differences between all percentages and between most averages are statistically significant (not those marked with *)
Percentages of people in work who never use a calculator at work, or use one everyday are markedly different from those for the other two Numeracy skills.
These statistics for Numeracy skills may indicate that adults with the lowest skill are choosing (or being chosen) to work in jobs that entail infrequent activity. This is in keeping with research on the British Cohort Studies, which also showed that people’s skills diminish with lack of use (Bynner & Parsons, 1998, 2000).
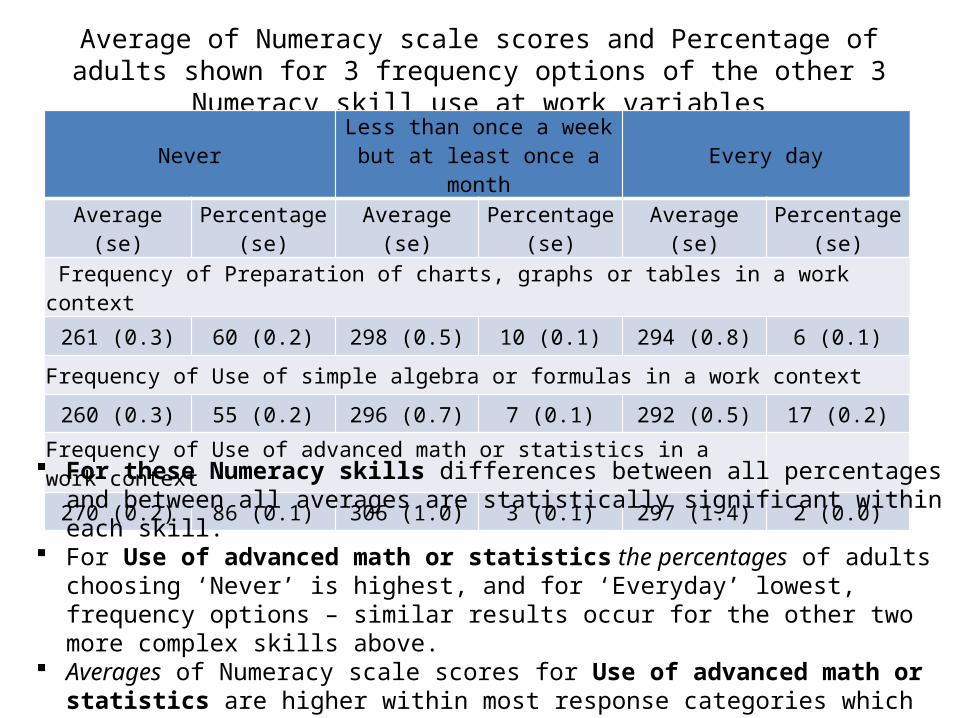
Average of Numeracy scale scores and Percentage of adults shown for 3 frequency options of the other 3 Numeracy skill use at work variables
NeverLess than once a week but at
least once a monthEvery day
Average (se) Percentage (se) Average (se) Percentage (se) Average (se) Percentage (se)
Frequency of Preparation of charts, graphs or tables in a work context
For these Numeracy skills differences between all percentages and between all averages are statistically significant within each skill.
For Use of advanced math or statistics the percentages of adults choosing ‘Never’ is highest, and for ‘Everyday’ lowest, frequency options – similar results occur for the other two more complex skills above.
Averages of Numeracy scale scores for Use of advanced math or statistics are higher within most response categories which suggests that people with strong numeracy skills have jobs that entail frequent numeracy activity.
Some concluding thoughts
• Overall, we found our exploration of the PIAAC dataset stimulating and challenging in equal measure
• While the scale and complexity of the dataset may appear daunting we would encourage you to undertake your own exploration
• Our advice is: start with something simple and take it from there
References• AIR PIAAC Team. (nd). What You Need to Consider Before Working with PIAAC
Data. Retrieved 3 May, 2015, from http://static1.squarespace.com/static/51bb74b8e4b0139570ddf020/t/54e773d7e4b0328389a39b36/1424454615327/WorkingWithPIAACData_022015.pdf
• OECD. (2011). PIAAC Conceptual Framework of the Background Questionnaire Main Survey. Paris: OECD. http://www.oecd.org/site/piaac/PIAAC(2011_11)MS_BQ_ConceptualFramework_1%20Dec%202011.pdf
• OECD. (2013). Technical Report of the Survey of Adult Skills (PIAAC). Paris: OECD. www.oecd.org/site/piaac/_Technical%20Report_17OCT13.pdf
• OECD, PIAAC, www.oecd.org/site/piaac/• OECD, PIAAC, Public Data & Analysis (includes link to PIAAC International Data
OECD Education Working Paper (Vol. 35). Paris: OECD Publishing. http://www.oecd-ilibrary.org/education/piaac-numeracy-a-conceptual-framework_220337421165
• PIAAC Gateway: Datasets and Tools http://piaacgateway.com/datasets/• Vignoles, A. (2007). The Use of Large Scale Data-sets in Educational Research.
Retrieved 10 July, 2015, from http://www.tlrp.org/capacity/rm/wt/vignoles