Air and Moisture Control in Building Enclosures 2014 Design & Trade Conference Marc A. Loranger, P.E., LEED AP May 29, 2014 Gale Associates, Inc. E n g i n e e r s a n d P l a n n e r s Gale’s Expertise • Building Enclosure Technology • Structural Engineering • Civil Engineering • Athletic Facilities Planning and Design • Airport Engineering and Planning Building Enclosure Commissioning Services Newton, MA
Transcript
Air and Moisture Control in Building Enclosures
2014 Design & Trade Conference
Marc A. Loranger, P.E., LEED APMay 29, 2014
Gale Associates, Inc.E n g i n e e r s a n d P l a n n e r s
Gale’s Expertise
• Building Enclosure Technology
• Structural Engineering
• Civil Engineering
• Athletic Facilities Planning and Design
• Airport Engineering and Planning
Building Enclosure Commissioning ServicesNewton, MA
Building Enclosure Commissioning Services Boston, MA
Building Enclosure Commissioning ServicesNew Haven, CT
Commercial and Residential buildings use 40% of the nations primary energy usage. Heating, Ventilating, and Air Conditioning accounts for 17%. NIST 2005 Study indicated Northeast can save 42% of heat cost and 26% of cooling cost with air barriers and continuous insulationHeating and Cooling a typical home consist of 54% of utility bills (DOE)
Building Enclosure Function
Control water penetrationControl air flowControl water vapor flowControl heat flowControl noise transmissionControl solar radiationFire separation
Building Enclosure Function
Presentation Outline
• Part I – Air and Vapor Barriers 101• Part II – The Good, the Bad, the Ugly• Part III – Energy Retrofit Case Study• Part IV – Insulation Retrofit
Part 1 – Air and Vapor Barriers 101
Air /vapor barriers (AVB’S), when correctly installed, help buildings achieve high levels of energy efficiency. But, when AVB’s are incorrectly installed, they can cause problems, including deterioration of sheathing, structural members, and the formation of mold.
Improving thermal/moisture performance and interior air quality of buildingsUnique solutions to improve overall building performances and aesthetics through a continuous air barrierAttendees will learn methods to include when specifying or detailing an AVBReview substrate preparation requirements that are critical to a good AVB installation but are the responsibility of another trade
Learning Objectives
Basic Principals & Characteristics of AVB’sWhy Consider AVB’sTypes of AVB’sDesign ConceptsSite Observations
Topics & Definitions
Basic Principles of Vapor BarriersWhat is a Vapor Barrier?
A material used to slow or stop the diffusion of moisture vapor through exterior building enclosures
Does NOT need to be continuous
Connecticut is Zone 5A (moist)
2003 IBC/2005 CSBC….. “approved vapor retarder”
2012 IBC/IECCClass I = Sheet polyethylene, non perforated aluminum foil
Class 2 = Kraft-faced fiberglass batt or paint with a perm rating > 0.1 and < or = 1 Perm
Class 3 = Latex or enamel paint (vented cladding or insulated sheathing)
What is an Air Barrier?A group of assemblies made of materials and accessories designated to prevent or retard the flow of air through a building envelope assembly and its transitions.
Basic Principles of Air Barriers
Characteristics:
Clearly identified or noted on Contract DocumentsContinuous over all surfaces from lowest floor to, and including roofResist positive/negative wind, fan, stack effect pressuresJoint, transitions and penetrations shall accommodate movement in the structure
Several states now include air barrier requirements in their building codes.
Up to 40% of energy used to heat/cool a building is from uncontrolled air leakage
US Government Agencies require them on federally funded building projectsReduced building enclosure moisture problemsImproved indoor air quality
Why Use an Air Barrier System?
Why Stop the Flow of Air through the Building Enclosure?
Can transport 30 to 200 times more moisture into the building than vapor diffusion Can cause concentrated areas of condensation, mold, corrosion and premature failure Causes the HVAC system to use more energy Reduces the effectiveness of thermal insulation, increasing heating and cooling costsDisrupts mechanical system pressurization
Air leakage: moisture travels in the air as it freely passes through wall cracks and penetrationsVapor diffusion: moisture is driven through a material by vapor pressure
Why Stop the Flow of Air through the Building Enclosure?
Impacts of Air Leakage
Impacts of Air Leakage
Impacts of Air Leakage
Types of Air BarriersPlywood – minimum 3/8”OSB – minimum 3/8”Exterior Gypsum Sheathing – min ½”Fully Adhered Roofing MembranesExtruded Polystyrene Board – min ½”Stucco – min ½”Cast in Place and Precast ConcreteSheet MetalClosed Cell Polyurethane Foam 2lb/cfMembranes (vapor permeable)
Types of Vapor BarriersLiquid Applied Membranes– Spray or Roll AppliedSheet Applied Membranes – Self-AdheringSpray Polyurethane Foam (SPF)Extruded PolystyreneSheet MetalPolyethylene Sheet
Design Considerations for AVB Systems
Connections should be made between:Foundations and wallsWalls and windows/doorsDifferent wall systemsWall and roof over conditioned spaceWalls, floor and roof across construction, control and expansion jointsAt Penetrations
Detailing
Detailing
Detailing
Detailing
Detailing
General Observations
General ObservationsSubstrates – Preparation and Application
General ObservationsSubstrates – Preparation and Application
General ObservationsSubstrates – Preparation and Application
General ObservationsSubstrates – Preparation and Application
Lack of coordinated details between construction tradesWorkmanshipLack of technical understanding of moisture/airintrusion mechanismsNo defined expectation of building’s performance with regard to selecting materials and detailsLack of modeling / review / testing
Part II
Addressing envelope issues in the early stages of building construction projects saves money and time, and reduces liability for the design and construction team.Avoid common issues in building construction, including water intrusion, indoor air quality issues, mold growth, air infiltration, and energy loss.HVAC and BET go hand in hand as the HVAC systems will never operate as designed unless the building envelope performs.The earlier the commissioning process begins, the easier it is to incorporate the comments into the construction documents.
Learning Objectives
Most Common Issue –Leakage/Business Interruption
20th Century Building Envelopes
Simple building materials
Limited layers
Trained workforce
Today’s Building Envelopes
Complex, new building materials
Multiple layers / configurations
Limited designer/contractor experience
Wall System Peer Review (BOD)
Wall System Peer Review (BOD)
Names of these projects are withheld to
protect the guilty…
The Good
Detailing Membrane
Patching
Roof Tie-in
Roof Steps
What about the Sill?
End Dams? Who needs End Dams?
Through-wall flashing?
The Forgotten Column
Bad or Ugly?
Bad or Ugly?
How do you install behind conduits
The Runs
Wet Substrates
Got Water?
What Water?
Mock-Up TestingTo be built by on-site trades
Full-scale laboratory testing
To include as many typical details as possible
To be tested for compliance with established standards
Access for modifications to address potential problems
Troubleshoot potential problems
Establishes standard of care for trades
On-Site Mock-Up
On-Building Mock-Up
ASTM E 2813 – Standard Practice for Building Enclosure Commissioning
ASTM E 783 Standard Test Method for Field Measurement of Air Leakage through Installed Exterior Windows and Doors
ASTM E-1105 and AAMA 501.2 Testing
Electric Field Vector Monitoring and ASTM D-5957 Flood Testing
ASTM E 1186 Standard Practice for Air Leakage Detection in Building Enclosures and Air Barrier Systems
ASTM E 1186, Standard Practice for Air Leakage Detection in Building Envelopes and Air Barrier Systems
ASTM E 779, Standard Test Method for Determining Air Leakage Rate by Fan Pressurization
ASTM D 4541 Standard Test Method for Pull-Off Strength of Coatings – Portable Adhesion Testing
ASTM C 1153, Standard Practice for Location of Wet Insulation in Roofing Using Infrared Imaging
AAMA 501.1 Water Penetration Test Using Dynamic Pressure
AAMA 501.1 Water Penetration Test Using Dynamic Pressure
Part III
Renovations to Existing Building Enclosures to Improve Energy Performance
Learning Objectives
Improving thermal, moisture and air infiltrationmanagement performance, and occupantcomfort with resultant improvement of indoor airqualityUnique solutions to improve overall buildingperformanceCoordinating construction at occupied facilities,and complying with campus funding levelsAttendees can gain an understanding of variousoptions available to improve their buildings’performance
Typical three story dorm building – east / courtyard elevation. Typical two story dorm buildings, photo shows the south elevation of the north wing.
Background - History
The EIFS panels are cracked atthe vertical joints and are bowingStaining of EIFS under thewindow.Open joints were observed at thehorizontal sealant line.The EIFS is not adhered to thewall at the foundation which iswet, note water running downbehind the EIFS.
Background - History
South wing roof which blew off in the wind storm of April 15th and 16th, 2007. Prior to the storm, the EIFS wall was previously secured with fasteners by University staff. The EIFS is in direct contact with the shingles. Step flashing was observed behind the EIFS. The step flashing was not flashed or secured tightly to the substrate.
Background - History
Typical staining at the window sill corners. The sealant at the corners is failed and has vegetation staining. The sealant surface is crazed, split at the sill exposing the backer rod.The sealant and backer rod is wet and is experiencing algae growth at the window sill corner.
Background - History
Background - History
Background - History
Area highlighted by IR ScanTest cut performed to confirm condition.The OSB was observed to be wet and deterioratedThe sealant, backer rod, wood blocking were wetStanding water was observed on the OSB sheet below the sealant
Background - History
The canopy’s mechanical duct penetration exhibited severe deterioration. Staining and algae growth notedPanels are loose and not adhered to the wall. The EIFS was removed to expose fully deteriorated and delaminated OSB. At the canopy, the OSB was removed to expose wet and deteriorating sill plate and wet insulation
Background - History
New plywood sheathingContinuous air barrier from foundation to roof eaveExterior continuous insulationCementitious wood siding and trimWith goal to provide a “New England” aesthetic to existing modern style dormitory complex
Proposed Design
Proposed design included the installation an air barrier and continuous rigid insulation on top of roof deck with a vented nail boardWould have provided continuous air barrier and insulation at full building enclosureRoof Air Barrier engineered out of the project due to budget concerns
Proposed Design
Budget limitations eliminated scope of air sealing at ceiling and roofAir barrier tie-in at eave line was limited due to accessLimited interior work performed so air leakage between units not addressedDue to existing recessed entries exterior insulation was limited to 1”
Proposed Design
Project performed under IBC 2009 (with state modifications)Plywood installed as sheer wall to comply with current code requirements
Proposed Design
ASHRAE Research Project 1365 “Thermal Performance of Building Envelope Details for Mid- and High-Rise Buildings”¹
Morrison Hershfield – Solutions MH Vol 2011. issue 02Figure 2: Thermal Gradients and heat flow paths for the selectedcladding attachments 1) Vertical, 2) Horizontal, 3) Vertical/Horizontal
Don’t forget the thermal impact of the cladding support elements passing through the exterior insulation.
Proposed Design
New Cellulose insulation R-21 equivalent to R16.3 ci when framing taken into accountExterior insulation installed R-value of 6.5 but wood furring with R-1.875 reduces total exterior R-value to approximately R-5.49System R-value is 24.07 or U-value of 0.0415
Proposed Design
WUFI - Hygrothermal Analyses
Assess wall system behavior with respect to static vapor drive, condensation potential, and capability for drying out accumulated moisture over time.Utilizes integral building physics calculations, employs historic weather patterns for specific project locations.One-dimensional analyses by transient modeling.
Proposed Design
WUFI - Hygrothermal Analyses
Limitations:Dependent of specific material propertiesStandard WUFI material database may not reflect exact in-place conditions
Boundary Conditions:Orientation (Exposure / Rain Load)Climate (Exterior / Interior)Surface Transfer Coefficients Initial ConditionsCalculation Period
RH > 80% For 30 DaysRH > 98% For 7 DaysRH > 100% For 24 Hours
6. Liquid Moisture Formation (100% RH)
Proposed Design
Proposed Design:
Siding attached through furring and into existing wood studsInsulation continuous behind furring members
Proposed Design
Design Requirements: Recent research indicates that installation of claddings of 5 psf through up to 8” thickness of insulation does not create short or long-term deflection or creep issues.Wood, metal, vinyl and fiber cement siding 5 psf typicallyInsulation between furring and exterior wall sheathing provides increased capacity for:
Rotational resistanceVertical movement resistance
Proposed Design
Construction
Construction
Construction
Construction
Construction
Construction
After Year 1 – Phase 1Complex 1 renovations completeComplex 2 undergoing renovationsComplex 3 awaiting renovations
Testing
ASTM 779-10HVAC balancing dampers/registers left openOperable dampers (bathroom vents, fireplaces, etc.) that do not pass air to pressurize the building are sealed off
Testing
Photo Credit: Retrotec
Testing
Unit plan 2nd floor
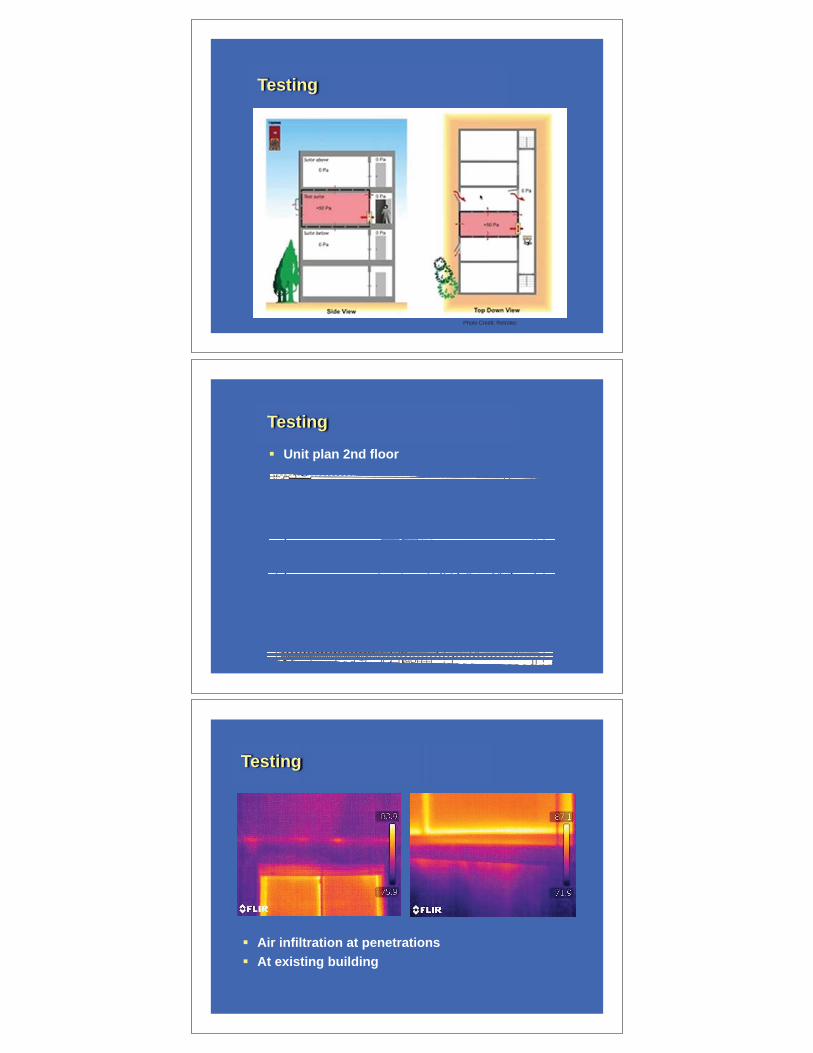
Testing
Air infiltration at penetrationsAt existing building
Testing
Air infiltration at floorAt existing building
Testing
Air infiltration at penetrationsAt existing building
Testing
Smoke entry under wall sill plate
Testing
Smoke entry at window
Testing
ASTM 779-10 Blower Door TestRenovated Dorm
Testing
• ASTM 779-10 Blower Door Test• Renovated Dorm
Potential Air Infiltration
Testing
Preferred Design Detail
Testing
Test results: What do you get and how?50 vs 75 Pascal Test Pressure
Air Flow MeasurementCubic Feet per Minute (CFM) vs Air Exchanges per Hour ACH
ACH = CFM x 60Building Volume
Energy Comparison
Energy Comparison
How to calculate energy lossConduction – ContactConvection – Fluid MovementRadiation – Less Impact on Energy Loss/Gain
Energy Comparison
Heat Loss via Air Movement (QA)Measured in BTU/HR
Air Movement = ConvectionQA= CFM x DAIR x CP x (Ti –To) x 60
CFM – Ventilation of air in cubic feet/min
DAIR – Density of air
CP – Specific heat capacity of air @ constant pressure
Ti – Indoor air temperature
To – Outdoor air temperature
Energy Comparison
Example:
QA= CFM x DAIR x CP x (Ti –To) x 60
CFM = 1.73 – Measured difference between new and existing building
DAIR = 0.0749 – Density of air (lb/ft3)
CP = 0.24 – Specific heat capacity of air @ constant pressure (BTU/lb * °F)
Ti – Indoor air temperature (°F)
To – Outdoor air temperature (°F)
Result: 44640 BTU/Month
Energy Comparison
Heat Loss via Conduction
Thermal Resistance (R)Coefficient of Heat Transmittance (U)
QC= U x A x T
QC – Heat loss through substrate/building enclosure
U – Coefficient of heat transmittance
A – Wall area
T – Temperature difference between exterior and interior environments