Page 1 Copyrighted Material. All rights reserved. The McLean Group, LLC M&A Trends: Tech & Government Contracting Deal Dynamics, Valuation, Drivers and Markets in an Era of Uncertainty Presented by: Greg Boucher Managing Director The McLean Group [email protected]Direct: 410.799.2053 September 25, 2012
Transcript
Page 1 Copyrighted Material. All rights reserved. The McLean Group, LLC
M&A Trends: Tech & Government
Contracting Deal Dynamics, Valuation, Drivers and Markets in an Era of Uncertainty
Alternatives for granting equity awards to key employees:
1. Restricted Stock
2. Restricted Stock Units
3. Stock Options
Incentive Stock Options (ISOs)
Nonqualified Stock Options (NQSOs)
4. Stock Appreciation Rights
5. Phantom Stock
Awards may be used in whole or in part to carry-out a succession plan
32
Restricted Stock
A grant of shares of stock with limitations on transferability; may be subject to vesting requirements or other “substantial risk of forfeiture”
May be awarded for no consideration as a stock bonus or recipient may pay all or a portion of stock’s FMV
May be subject to repurchase restrictions that require the resale of stock to the company at some predetermined or formula price upon certain triggering events
Not treated as “non-qualified deferred compensation” (NQDC) under the American Jobs Creation Act (AJCA)
33
Restricted Stock
Tax Overview
Governed by IRC § 83 – taxation of “property” transferred “in
connection with the “performance of services”
Taxed upon vesting of the award (i.e., when stock is no longer
subject to a substantial risk of for forfeiture)
If no substantial risk of forfeiture, taxed at time of award
Substantial Risk of Forfeiture (IRC § 83)
Exists where rights in property are conditioned upon future
performance of substantial services by any person, or the
occurrence of a condition related to a purpose of the transfer
Section 83(b) election is available.
34
Stock Options
Represent a right to buy stock during a specified period at a
fixed purchase price
Types:
Incentive Stock Options (ISOs)
Non-qualified Stock Options (NQSOs)
Generally not deemed to be “property” for income tax purposes
(IRC § 83)
35
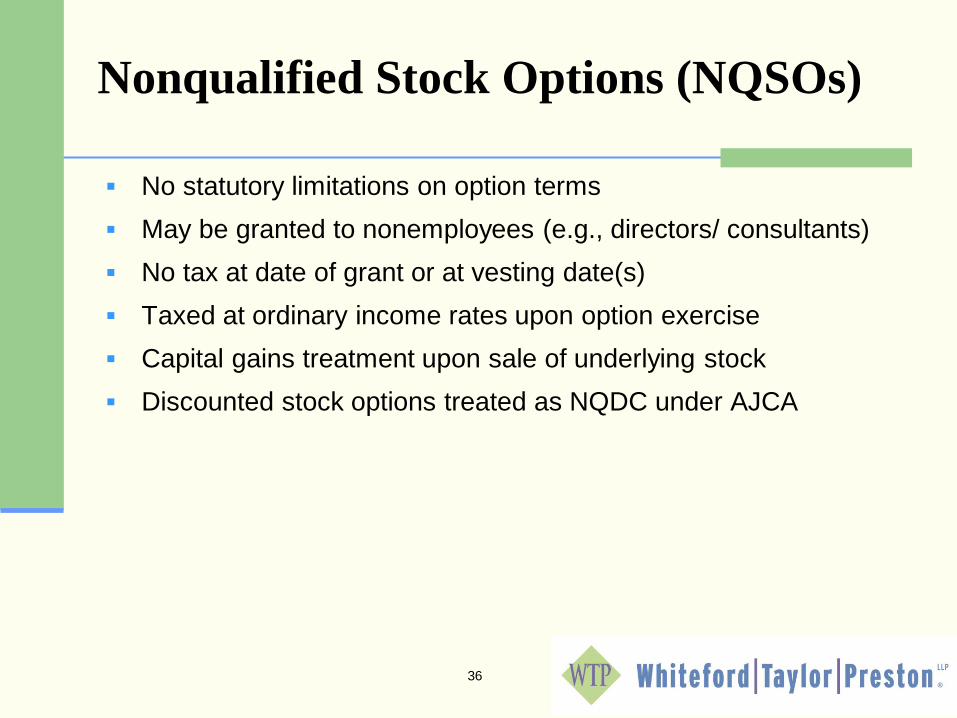
Nonqualified Stock Options (NQSOs)
No statutory limitations on option terms
May be granted to nonemployees (e.g., directors/ consultants)
No tax at date of grant or at vesting date(s)
Taxed at ordinary income rates upon option exercise
Capital gains treatment upon sale of underlying stock
Discounted stock options treated as NQDC under AJCA
36
Incentive Stock Options (ISOs)
Plan Requirements: Written Plan
Must specify aggregate number of shares subject to Plan
May limit all awards under omnibus plan or may limit ISO
awards only
“Net” share counting permitted (i.e., forfeited shares and shares
issued to satisfy exercise price can be reissued under Plan)
Must identify eligible Employees or class of Employees
Stockholder approval required within 12 months of adoption of Plan
No additional stockholder approval required for ISOs assumed
in a corporate transaction
ISOs are not subject to AJCA
ISO grant terms are subject to numerous special requirements
under the IRC.
37
Other Types of Equity Awards
Phantom Stock
Employee granted units equivalent to (but not actual) shares of Employer stock
Stock Appreciation Rights
Represent right to be paid spread between grant price and FMV of stock at exercise date
Restricted Stock Units Units representing shares of common stock settled by delivery of
shares at vesting or later payout
38
Equity Compensation –
Employee Tax Summary
NQSO ISO Phantom
Stock
SARs Restricted
Stock
Restricted Stock
Units
Grant Date No tax impact No tax
impact
No tax
impact
No tax
impact
No tax impact1 No tax impact
Vesting Date No tax impact No tax
impact
No tax
impact
No tax
impact
Ordinary
income1
Ordinary income2
Exercise
Date
Ordinary
income on
spread
No tax
impact3
Ordinary
income on
FMV of unit
Ordinary
income on
spread
N/A N/A
Sale Date Capital gain on
appreciation
post exercise
Capital Gain4 N/A N/A Capital gain on
appreciation1
Capital Gain on
appreciation
1 Assumes substantial risk of forfeiture exists and that recipient does not make a §83(b) election. 2 RSU may provide for deferral of payout after vesting – subject to AJCA deferral requirements. 3 AMT may be applicable. 4 Absent “disqualifying disposition.”
39
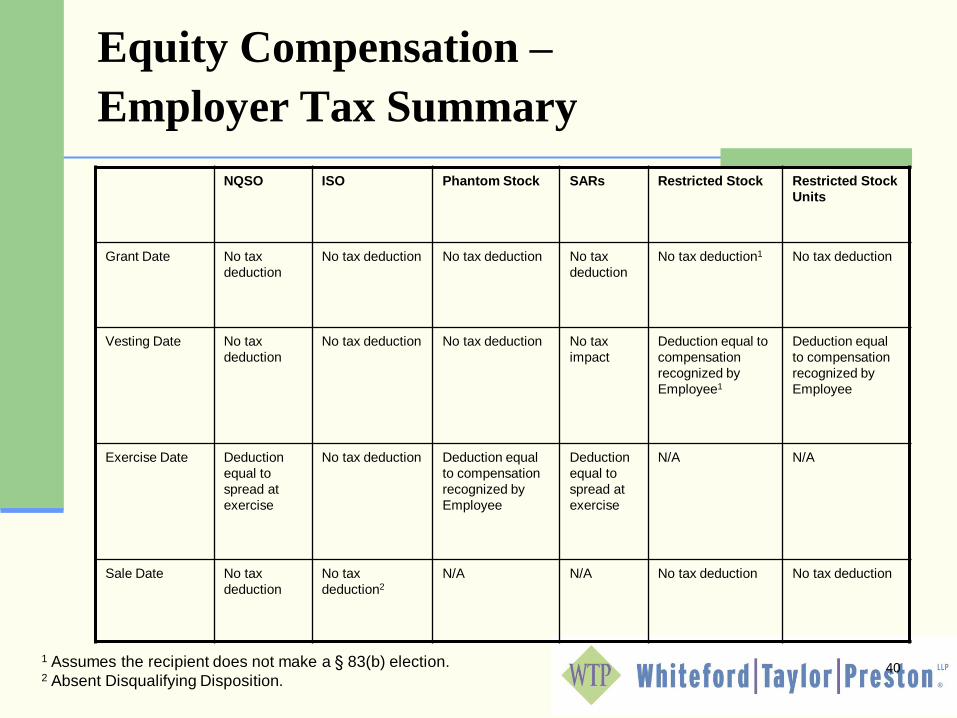
Equity Compensation –
Employer Tax Summary
NQSO ISO Phantom Stock SARs Restricted Stock Restricted Stock
Units
Grant Date No tax
deduction
No tax deduction No tax deduction No tax
deduction
No tax deduction1 No tax deduction
Vesting Date No tax
deduction
No tax deduction No tax deduction No tax
impact
Deduction equal to
compensation
recognized by
Employee1
Deduction equal
to compensation
recognized by
Employee
Exercise Date Deduction
equal to
spread at
exercise
No tax deduction Deduction equal
to compensation
recognized by
Employee
Deduction
equal to
spread at
exercise
N/A N/A
Sale Date No tax
deduction
No tax
deduction2
N/A N/A
No tax deduction No tax deduction
1 Assumes the recipient does not make a § 83(b) election. 2 Absent Disqualifying Disposition.
40
Basic Types of Exit Strategies:
41
1. Company Stock Redemption
2. Management Led Buyout
3. Third Party Sale
4. Sale to an ESOP
This Presentation is focused on a sale of target to a third-party
Buyer
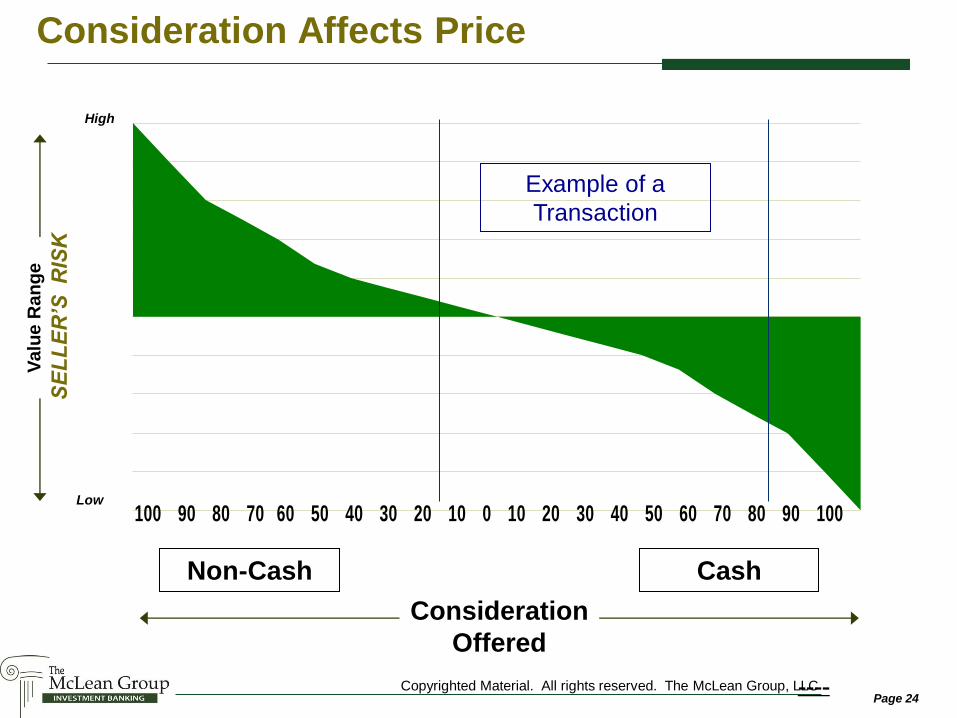
M&A Risks for Seller
Disruption of business, loss of key employees, etc.
Loss of ownership/control
Confidentiality issues and risks
Unless an “all cash” deal, Buyer’s stock
Substantial costs and negotiation time
Earn-outs and contingent consideration
Escrow, holdbacks and indemnities
Failure to integrate and execute successfully
Affect on customers/suppliers if deal doesn’t go through
42
Preparing a Company for Sale
Buyer’s evaluation of target falls into four major categories:
1. Financial (e.g., accounting, financial systems and controls)
2. Business (e.g., products, customers, facilities, operations)
Analyze the impact of the deal structure on the owner’s ability to meet lifetime financial
goals and objectives
Explore advantages of wealth transfer planning pre-transaction
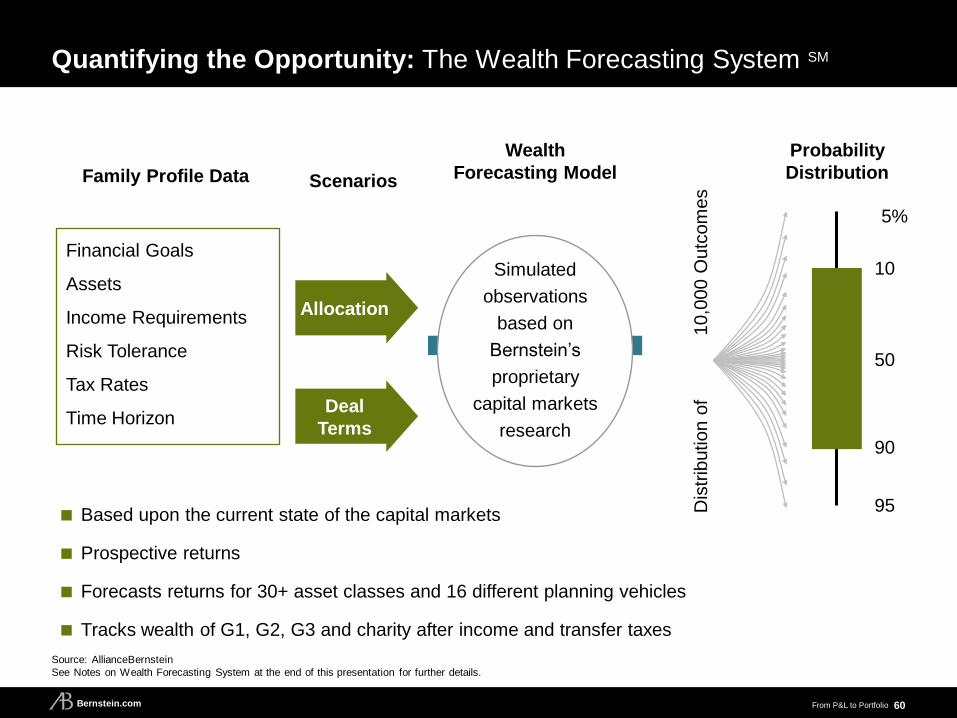
From P&L to Portfolio Bernstein.com 60
Quantifying the Opportunity: The Wealth Forecasting System SM
Based upon the current state of the capital markets
Prospective returns
Forecasts returns for 30+ asset classes and 16 different planning vehicles
Tracks wealth of G1, G2, G3 and charity after income and transfer taxes
Family Profile Data
Wealth
Forecasting Model
Probability
Distribution
Financial Goals
Assets
Income Requirements
Risk Tolerance
Tax Rates
Time Horizon
Dis
trib
ution o
f 10,0
00 O
utc
om
es
Simulated
observations
based on
Bernstein’s
proprietary
capital markets
research
5%
50
90
10
95
Scenarios
Allocation
Deal
Terms
Source: AllianceBernstein
See Notes on Wealth Forecasting System at the end of this presentation for further details.
From P&L to Portfolio Bernstein.com
Evaluating What You Need and What You Want
61
How much?
To whom?
How quickly?
What techniques?
Excess Capital
Amount that can be
transferred
How much do you spend?
What is your age?
What is your risk tolerance?
Core Capital
Amount to ensure spending
needs are met
Calculated at 90% level of
confidence
Charity
Capital for Next
Venture
Extra Spending
Children and
Grandchildren
Personal Reserve
Lifestyle
Spending
From P&L to Portfolio Bernstein.com
How does their risk tolerance affect their decision?
Which offer should the couple take so that they can retire confidently today?
Case Study: Retiring Securely
Married couple, age 60, wants to sell their technology company and retire
Investment assets of $1.25 million of which $250,000 is in a qualified retirement plan
Currently spending $240,000 per year
Evaluating two term sheets:
(More Upfront) The first provides $10 million total—$8 million upfront and an annual earnout of
$400,000 for five years
(Less Upfront) The other provides $12 million total—$4 million upfront and an annual earnout of
$1.6 million for five years
62
From P&L to Portfolio Bernstein.com
$12.6
$9.5
$8.2 $7.7
0/100 20/80 40/60 60/40
$4.5 Mil. (Less Upfront)
$7.7 Mil. (More Upfront)
Current Assets**
What Is the Couple’s Core Portfolio?
63
Amount Needed to Fund Core Portfolio Today Spend $240,000 (Real)
($ Millions)*
*Based on Bernstein’s estimate of returns for the applicable capital markets over the applicable time horizon. Data do not represent past performance and are not a promise of
actual or a range of future results. Core capital calculated at 90% level of confidence assuming adjusted joint life expectancy. Variations in actual income, spending, applicable
tax rates, life span and market returns may substantially impact the likelihood that a core-capital estimate will be sufficient to provide for future expenses.
**Current assets are the sum of the beginning portfolio assets plus the after-tax sale proceeds in the first year of the analysis. A combined 19.25% state and federal capital gains tax
rate was assumed.
***“Asset Allocation” refers to the proportion of assets invested in stocks and the proportion invested in bonds over the next 35 years. Assumes globally diversified stocks (21% US
value, 21% US growth, 21% US diversified, 7% US small and mid cap, 22.5% developed international and 7.5% emerging markets); bonds are assumed to be intermediate term
with municipal bonds in the taxable portfolio and taxable bonds in the tax-deferred portfolio. See Notes on Wealth Forecasting System at the end of this presentation for further
details.
Source: AllianceBernstein
Asset Allocation (Stocks/Bonds)***
From P&L to Portfolio Bernstein.com
What Is the Couple’s Investment Risk?
42%
32%
69%
93%
2% 2%11%
46%
2% 2% 2%
12%
0/100 20/80 40/60 60/40
10% Loss 20% Loss 30% Loss
64
Probability of Peak-to-Trough Losses over 40
years*
Data do not represent past performance and are not a promise of actual or a range of future results.
*Data indicate the probability of a peak-to-trough decline in pretax, pre-cash-flow cumulative returns of 10%, 20% or 30% over the next 40 years. Because the Wealth Forecasting
System uses annual capital markets returns, the probability of peak-to-trough losses measured on a more frequent basis (such as daily or monthly), may be understated. The
probabilities depicted above include an upward adjustment intended to account for the incidence of peak-to-trough losses that do not last an exact number of years.
**“Asset Allocation” refers to the proportion of assets invested in stocks and the proportion invested in bonds over the next 40 years. Assumes globally diversified stocks (21% US
value, 21% US growth, 21% US diversified, 7% US small and mid cap, 22.5% developed international and 7.5% emerging markets); bonds are assumed to be intermediate term
with municipal bonds in the taxable portfolio and taxable bonds in the tax-deferred portfolio. See Notes on Wealth Forecasting System at the end of this presentation for further
details.
Source: AllianceBernstein
Asset Allocation (Stocks/Bonds)**
From P&L to Portfolio Bernstein.com
94% 96% 96% 98%
40/60 60/40 40/60 60/40
Both Deals Meet Spending Plan—If They Get 100% of Earnouts
65
35th Year—Probability of Maintaining Spending* Spending $240,000 (Real)
100% Earnout**
Asset Allocation (Stocks/Bonds)***
*“Probability of Maintaining Spending” represents the probability of having assets greater than $0 at the end of the 35th year. Based on Bernstein’s estimate of returns for the
applicable capital markets over the next 35 years. Data do not represent past performance and are not a promise of actual or a range of future results.
**Assumes the couple receives each annual payout in its entirety as described previously.
***“Asset Allocation” refers to the proportion of assets invested in stocks and the proportion invested in bonds over the next 35 years. Assumes globally diversified stocks (21% US
value, 21% US growth, 21% US diversified, 7% US small and mid cap, 22.5% developed international and 7.5% emerging markets); bonds are assumed to be intermediate term
with municipal bonds in the taxable portfolio and taxable bonds in the tax-deferred portfolio. See Notes on Wealth Forecasting System at the end of this presentation for further
details.
Source: AllianceBernstein
More Upfront
Less Upfront
From P&L to Portfolio Bernstein.com
If Earnouts Are Less Certain, Asset Allocation Can Help
66
35th Year—Probability of Maintaining Spending* Spending $240,000 (Real)
60% Earnout**
*“Probability of Maintaining Spending” represents the probability of having assets greater than $0 at the end of the 35th year. Based on Bernstein’s estimate of returns for the
applicable capital markets over the next 35 years. Data do not represent past performance and are not a promise of actual or a range of future results.
**Assumes the couple receives an earnout of only $240,000 per year in the “More Upfront” scenarios and $960,000 per year in the “Less Upfront” scenarios.
***“Asset Allocation” refers to the proportion of assets invested in stocks and the proportion invested in bonds over the next 35 years. Assumes globally diversified stocks (21% US
value, 21% US growth, 21% US diversified, 7% US small and mid cap, 22.5% developed international and 7.5% emerging markets); bonds are assumed to be intermediate term
with municipal bonds in the taxable portfolio and taxable bonds in the tax-deferred portfolio. See Notes on Wealth Forecasting System at the end of this presentation for further
details.
Source: AllianceBernstein
91% 94%
84% 89%
40/60 60/40 40/60 60/40
Asset Allocation (Stocks/Bonds)***
More Upfront
Less Upfront
From P&L to Portfolio Bernstein.com
0
23
45
68
90
$3.3$1.1
What Is the Impact on the Couple’s Future Wealth?
67
$45.9
$14.1
$26.7
$8.7
$62.5
$20.5
$36.9
$13.5
Range of Wealth Values, Year 35* After Taxes and Cash Flows, Nominal
60% Earnout**
$ M
illio
ns
*Based on Bernstein’s estimate of returns for the applicable capital markets over the next 35 years. Data do not represent past performance and are not a promise of actual or
a range of future results.
Asset values represent the estimated market value; if the assets were liquidated, additional capital gains or losses would be realized that are not reflected here.
**Assumes the couple receives an earnout of only $240,000 per year in the “More Upfront” scenarios and $960,000 per year in the “Less Upfront” scenarios.
***“Asset Allocation” refers to the proportion of assets invested in stocks and the proportion invested in bonds over the next 35 years. Assumes globally diversified stocks (21% US
value, 21% US growth, 21% US diversified, 7% US small and mid cap, 22.5% developed international and 7.5% emerging markets); bonds are assumed to be intermediate term
with municipal bonds in the taxable portfolio and table bonds in the tax-deferred portfolio. See Notes on Wealth Forecasting System at the end of this presentation for further details.
Source: AllianceBernstein
40/60 60/40 40/60 60/40
Asset Allocation (Stocks/Bonds)***
More Upfront Less Upfront
5%
10
50
90
95
Level of
Confidence
From P&L to Portfolio Bernstein.com
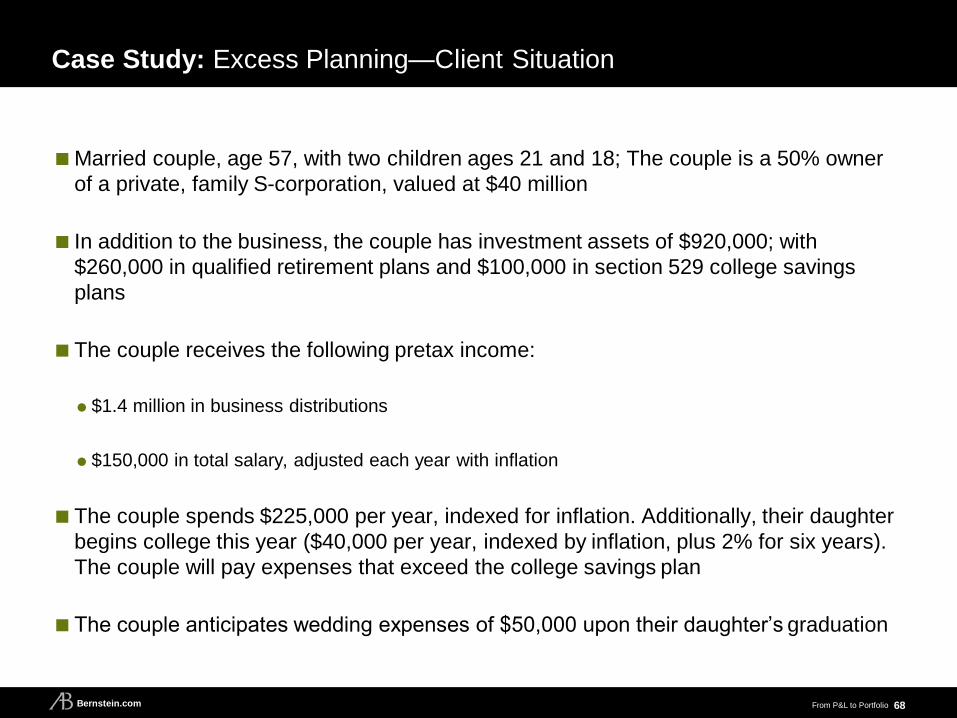
Case Study: Excess Planning—Client Situation
68
Married couple, age 57, with two children ages 21 and 18; The couple is a 50% owner
of a private, family S-corporation, valued at $40 million
In addition to the business, the couple has investment assets of $920,000; with
$260,000 in qualified retirement plans and $100,000 in section 529 college savings
plans
The couple receives the following pretax income:
$1.4 million in business distributions
$150,000 in total salary, adjusted each year with inflation
The couple spends $225,000 per year, indexed for inflation. Additionally, their daughter
begins college this year ($40,000 per year, indexed by inflation, plus 2% for six years).
The couple will pay expenses that exceed the college savings plan
The couple anticipates wedding expenses of $50,000 upon their daughter’s graduation
From P&L to Portfolio Bernstein.com
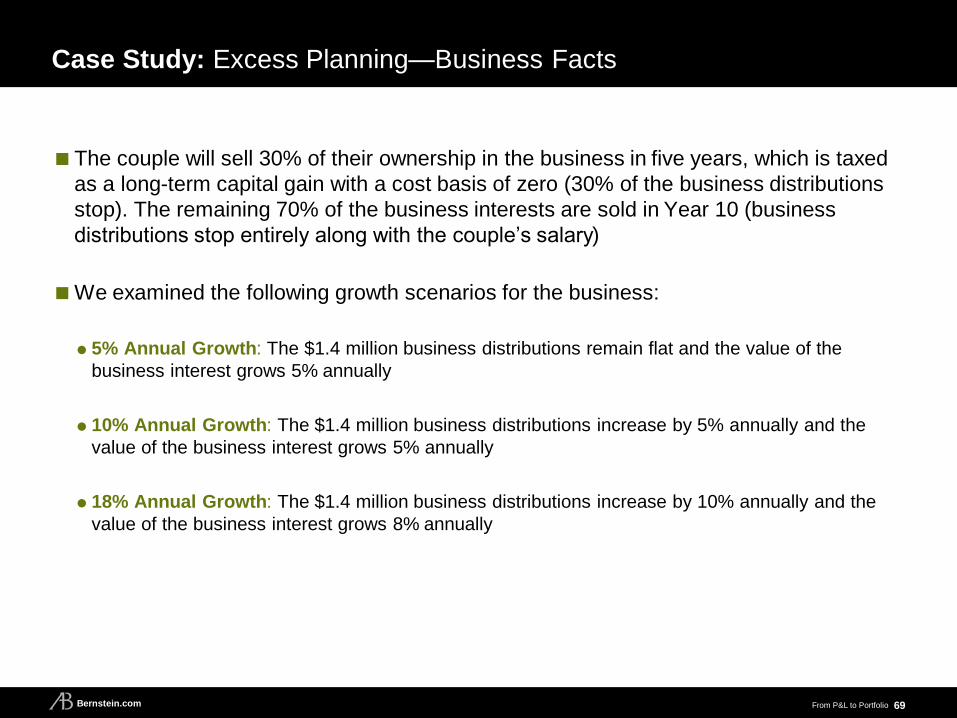
Case Study: Excess Planning—Business Facts
69
The couple will sell 30% of their ownership in the business in five years, which is taxed
as a long-term capital gain with a cost basis of zero (30% of the business distributions
stop). The remaining 70% of the business interests are sold in Year 10 (business
distributions stop entirely along with the couple’s salary)
We examined the following growth scenarios for the business:
5% Annual Growth: The $1.4 million business distributions remain flat and the value of the
business interest grows 5% annually
10% Annual Growth: The $1.4 million business distributions increase by 5% annually and the
value of the business interest grows 5% annually
18% Annual Growth: The $1.4 million business distributions increase by 10% annually and the
value of the business interest grows 8% annually
From P&L to Portfolio Bernstein.com
No Wealth Transfer: Distribution of 40-Year Family Wealth*
40/60 Portfolio for G1 After Spending and Taxes in Typical Markets (Nominal)
Bernstein is not a legal, tax or estate advisor. Investors should consult with professionals in those areas as appropriate before making any decisions.
*Median results. Assumes the grantor’s assets are invested 40% globally diversified stocks and 60% intermediate term bonds. Assumes that the spouses die in the same year, and
that $5 million, indexed for inflation, per person, is exempt from estate taxes less any gifts made during life. The remaining estate is taxed using a 35% estate tax rate. See Notes on
Estate Transfer and Taxation at the end of this presentation for further details. Based on Bernstein estimates of the range of returns for the applicable capital markets over the
duration of the analysis. Data do not represent past performance and are not a promise of actual or a range of future results. See Notes on Wealth Forecasting System at the
You’re Kidding, Right? There Has to Be a Better Way
71
Couple makes an $8 million gift of interests in their business to an irrevocable grantor
trust for the benefit of their children
Pro: Couple has a combined $10.24 million applicable lifetime exclusion in 2012 and can
comfortably make gifts without jeopardizing their core portfolio; immediately removes the present
value of the growth of the business from their estate
Con: Uncertainty about future gift and estate tax policies
Other Strategies to Consider:
Discounted sale to children or a trust for their benefit in exchange for a promissory note
Pro: Uses little or no gift tax exclusion and requires little to no gift taxes to be paid; the applicable
federal rates are near historic lows
Con: The principal value of the note remains in the grantor’s estate
Discounted transfer to a grantor retained annuity trust (GRAT)
Pro: Requires no gift tax exclusion to be used when GRAT is zeroed out; Section 7520 rates are
near historic lows
Con: Mortality risk; frequent valuations required
From P&L to Portfolio Bernstein.com
Gift/Estate Strategies Benefit from a Discount
72
Capitalize on the valuation discount, due to illiquidity and lack of control
Assuming transfer of a minority interest. Bernstein does not advise on the value of any discounts; information on discounts was provided by clients’ tax and legal teams.
Source: AllianceBernstein
Grantor
Value of Gift for
Transfer Tax Purposes Discount
$8.0 Million
$6.0 Million
$8 Million
Pre-
Transaction
Gift
$5.2 Million 35%
25%
0%
The couple’s deal team advises them to use a 25% valuation discount, due to illiquidity and lack of marketability
From P&L to Portfolio Bernstein.com
Planning: Distribution of 40-Year Family Wealth*
73
40/60 Portfolio for G1; 80/20 Portfolio for G2** After Spending and Taxes in Typical Markets (Nominal)
Bernstein is not a legal, tax or estate advisor. Investors should consult with professionals in those areas as appropriate before making any decisions.
*Median results. Assumes G1 assets are invested 40% globally diversified stocks and 60% intermediate-term bonds, and G2 assets are invested 80% global stocks and 20% bonds.
Assumes that the spouses die in the same year, and that $5 Million, indexed for inflation, per person, is exempt from estate taxes less any gifts made during life. The remaining
estate is taxed using a 35% estate tax rate. See Notes on Estate Transfer and Taxation at the end of this presentation for further details.
**G2 portfolio is assumed to be an irrevocable grantor trust for the first 10 years, at which time the trust pays its own taxes. Based on Bernstein estimates of the range of returns for
the applicable capital markets over the duration of the analysis. Data do not represent past performance and are not a promise of actual or a range of future results. See
Notes on Wealth Forecasting System at the end of this presentation for further details.