15
Not an offer or solicitation. Updated As Of: October 2019 Management Presentation For use by the State of Rhode Island Investment Commission Only

Not an offer or solicitation.
Updated As Of:
October 2019
Management
PresentationFor use by the State of Rhode Island
Investment Commission Only

Not an offer or solicitation.
DisclaimerThe information contained herein is being provided to you at your request for informational purposes only and is not, and may not be relied on in any manner as
legal, tax or investment advice or as an offer to sell or a solicitation of an offer to buy an interest in any investment vehicle (a “Fund”) sponsored by Odyssey
Investment Partners, LLC or its affiliates (together with such affiliates, “Odyssey”) or any other security, which may only be made pursuant to the delivery of the
related organizational and offering documents for the Fund.
Before deciding to invest in any Fund, prospective investors should pay particular attention to the risk factors contained in the offering documents. The
information contained herein is intended to supplement discussion between Odyssey and prospective investors; the supplemental discussion is required for the
information herein to be meaningful and complete.
Prospective investors should make their own investigations and evaluations of the information contained herein. Prior to the closing of a private offering of
interests in a Fund, the manager of a Fund will give investors the opportunity to ask questions and receive additional information concerning the terms and
conditions of such offering and other relevant matters. Each prospective investor should consult its own attorney, business adviser and tax adviser as to legal,
business, tax and related matters concerning the information contained herein and any such offering.
The information contained herein may not be reproduced or redistributed in whole or in part, in any format, without the express written approval of Odyssey.
The foregoing shall not limit the disclosure of the tax treatment or tax structure of a Fund (or any transactions undertaken by a Fund). Certain information
contained herein (including financial information) has been obtained from published and non-published sources and has not been independently verified by
Odyssey, which does not assume responsibility for the accuracy of such information. Except where otherwise indicated herein, information provided herein is as
of June 30, 2019, and there is no obligation to update or otherwise revise such information after such date. Investment in a Fund involves significant risks,
including loss of the entire investment.
There can be no assurance that pending investments will close at all or in the currently contemplated format. In considering any performance data contained
herein, each recipient should bear in mind that past performance is not indicative of future results, and there can be no assurance that any Fund or
investment will achieve comparable results.
This presentation contains forward-looking statements, including information about portfolio companies, which can be identified by the use of terms such as
“may”, “will”, “should”, “expect”, “anticipate”, “project”, “estimate”, “intend”, “continue”, or “believe” (or the negatives thereof) or other variations thereof.
Due to various risks and uncertainties, actual events, results or performance may differ materially from those reflected or contemplated in such forward-looking
statements. These statements are based on a set of assumptions that may change over time or may prove to be incorrect, and there is no guarantee that the
conditions on which such assumptions are based will materialize as anticipated or will be applicable to the Fund’s portfolio companies.
None of the information contained herein has been filed with the Securities and Exchange Commission, any securities administrator under any state securities
laws or any other governmental or self-regulatory authority. No governmental authority has passed on the merits of this offering or the adequacy of the
information contained here. Any representation to the contrary is unlawful.
If you are requested or required by law (for example, pursuant to a freedom of information act request) to disclose any of the information contained in this
presentation, please contact Odyssey as soon as possible after you receive notice of such request or after you determine that you may be required to so disclose
any such information.
1

Not an offer or solicitation.
Disclaimer (Cont’d)Internal Rate of Return (“IRR”) is calculated based on monthly capital inflows and outflows from portfolio companies. The gross IRRs shown are calculated before
fund expenses, management fees and carried interest, if any. Other than for Fund I, the net IRRs shown are calculated after fund expenses, management fees and
carried interest, if any. Net IRR calculations for Fund I are hypothetical and not an actual net IRR since Fund I did not employ a traditional private equity structure.
The assumptions for this Fund I net IRR calculation include a 2% management fee and 20% carried interest, but do not include fund-level expenses. Supporting data
used in the net IRR calculations presented herein, are available upon request.
IRRs for unrealized investments and realized investments with remaining interest have been calculated by assuming that the remaining interest has been sold as of
June 30, 2019 at the unrealized fair value as determined by the General Partner of the Fund. There can be no assurance that unrealized investments will ultimately be
realized for such value. The actual realized returns will depend on, among other factors, future operating results, the value of assets and market conditions at the time
of disposition, any related transaction costs and the timing and manner of sale, all of which may differ from the assumptions on which the valuations contained herein
are based.
The fund returns are presented at the fund level. The returns received by individual investors may differ from the returns presented due to a number of factors.
Certain assumptions have been made in calculating the return information and preparing the other information set forth in this document. While made in good faith,
there can be no assurance that such assumptions will prove correct or will be applicable to a Fund’s actual investments.
2
Not an offer or solicitation.
Executive Summary
3
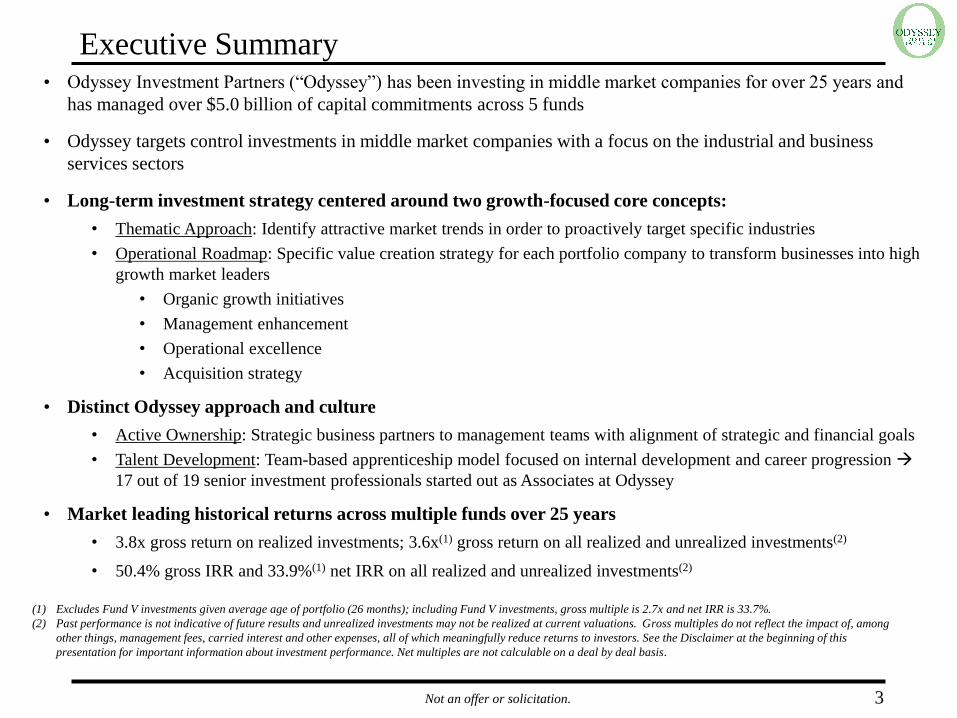
• Odyssey Investment Partners (“Odyssey”) has been investing in middle market companies for over 25 years and
has managed over $5.0 billion of capital commitments across 5 funds
• Odyssey targets control investments in middle market companies with a focus on the industrial and business
services sectors
• Long-term investment strategy centered around two growth-focused core concepts:
• Thematic Approach: Identify attractive market trends in order to proactively target specific industries
• Operational Roadmap: Specific value creation strategy for each portfolio company to transform businesses into high
growth market leaders
• Organic growth initiatives
• Management enhancement
• Operational excellence
• Acquisition strategy
• Distinct Odyssey approach and culture
• Active Ownership: Strategic business partners to management teams with alignment of strategic and financial goals
• Talent Development: Team-based apprenticeship model focused on internal development and career progression →
17 out of 19 senior investment professionals started out as Associates at Odyssey
• Market leading historical returns across multiple funds over 25 years
• 3.8x gross return on realized investments; 3.6x(1) gross return on all realized and unrealized investments(2)
• 50.4% gross IRR and 33.9%(1) net IRR on all realized and unrealized investments(2)
(1) Excludes Fund V investments given average age of portfolio (26 months); including Fund V investments, gross multiple is 2.7x and net IRR is 33.7%.
(2) Past performance is not indicative of future results and unrealized investments may not be realized at current valuations. Gross multiples do not reflect the impact of, among
other things, management fees, carried interest and other expenses, all of which meaningfully reduce returns to investors. See the Disclaimer at the beginning of this
presentation for important information about investment performance. Net multiples are not calculable on a deal by deal basis.

Not an offer or solicitation.
Odyssey Overview
4
Key Odyssey Strengths…
Experienced Team Culture of Candor & Transparency
Thematic Approach → Differentiated Sourcing Deep Sector Expertise
Roadmap for Business Transformation
Active Ownership → Strategic Partners
… Lead to Strong Outcomes …
Ownership
• Accelerated growth
• Enhanced processes &
systems
• Margin expansion
Sourcing
• Broad and deep OIP
network
• Diligence insights
• Preferred partner to
management
• Businesses built to
last
• Premium multiples
Exit
Buy and Build Track Record
• Attract
• Develop
• Retain
Apprenticeship Model
Investments Talent Development
Not an offer or solicitation.
$1,497.3$1,881.9
$0
$1,250
$2,500
$3,750
$5,000
Investment Total Value
$2,273.3
$8,577.3
$1,669.8
$2,181.9
$3,943.1
$10,759.3
$0
$3,000
$6,000
$9,000
$12,000
Investment Total Value
$583.4
$1,557.2
$0
$400
$800
$1,200
$1,600
Investment Total Value
$188.2
$780.8
$0
$250
$500
$750
$1,000
Investment Total Value
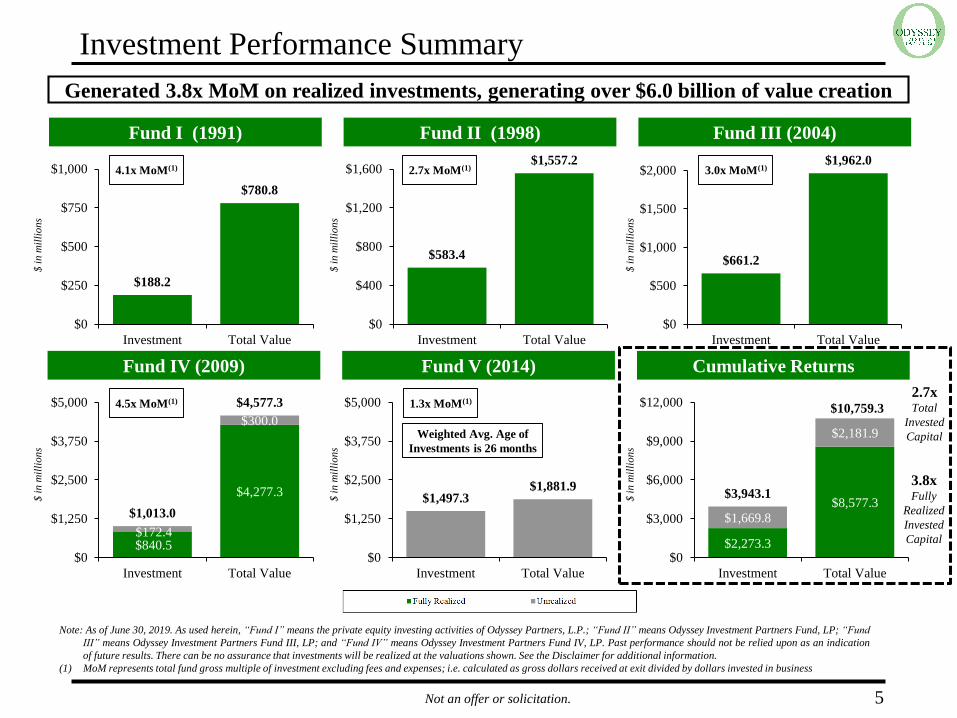
Investment Performance Summary
5
Generated 3.8x MoM on realized investments, generating over $6.0 billion of value creation
Fund I (1991) Fund II (1998) Fund III (2004)
Fund IV (2009) Fund V (2014) Cumulative Returns
Note: As of June 30, 2019. As used herein, “Fund I” means the private equity investing activities of Odyssey Partners, L.P.; “Fund II” means Odyssey Investment Partners Fund, LP; “Fund
III” means Odyssey Investment Partners Fund III, LP; and “Fund IV” means Odyssey Investment Partners Fund IV, LP. Past performance should not be relied upon as an indication
of future results. There can be no assurance that investments will be realized at the valuations shown. See the Disclaimer for additional information.
(1) MoM represents total fund gross multiple of investment excluding fees and expenses; i.e. calculated as gross dollars received at exit divided by dollars invested in business
4.1x MoM(1) 2.7x MoM(1)
$661.2
$1,962.0
$0
$500
$1,000
$1,500
$2,000
Investment Total Value
3.0x MoM(1)
$840.5
$4,277.3
$172.4
$300.0
$1,013.0
$4,577.3
$0
$1,250
$2,500
$3,750
$5,000
Investment Total Value
4.5x MoM(1) 1.3x MoM(1)
$ i
n m
illi
on
s
$ i
n m
illi
on
s
$ i
n m
illi
on
s
$ i
n m
illi
on
s
$ i
n m
illi
on
s
$ i
n m
illi
on
s
Weighted Avg. Age of
Investments is 26 months
2.7xTotal
Invested
Capital
3.8xFully
Realized
Invested
Capital

Not an offer or solicitation.
Investment Performance Summary (Cont’d.)(1)
6
Note: As used herein, “Fund I” means the private equity investing activities of Odyssey Partners, L.P.; “Fund II” means Odyssey Investment Partners Fund, LP; “Fund III” means Odyssey
Investment Partners Fund III, LP; “Fund IV” means Odyssey Investment Partners Fund IV, LP; and “Fund V” means Odyssey Investment Partners Fund V, LP.
(1) As of June 30, 2019. Please see the Disclaimer at the beginning of this presentation for important information regarding the calculation of IRRs. Unrealized investments are valued at
fair value as determined in good faith by the applicable general partner as of June 30, 2019 in accordance with FAS 157 and Odyssey’s valuation policy. Fund V investments in Aramsco
and Barcodes, which have been held less than one year as of June 30, 2 019, are held at cost. Past performance should not be relied upon as an indication of future results. There can be
no assurance that investments will be realized at the valuations shown. Gross figures do not reflect the impact of, among other things, management fees, carried interest and other
expenses.
(2) Fund I did not have a traditional private equity fund structure and therefore did not have a first and final closing, pool of committed capital, or bear management fees, carried interest,
or fund level expenses. Net figures for Fund I assume a 2% management fee and 20% carried interest, but not fund level expenses.
(3) Excludes GP commitments of $69 million
(4) Funds IV and V provided guarantees to financings for certain portfolio companies, none of which were called. Odyssey believes these guarantees benefitted investors. Any possible
benefits of such guarantees is included in the IRRs.
(3)
($ in millions) Fund I (2)
Fund II Fund III Fund IV Fund V
Vintage Year 1991 1998 2004 2009 2014
Fund Size $188 $760 $750 $1,500 $2,000
Invested Capital
Realized 188.2 583.4 661.2 840.5 –
Unrealized – – – 172.4 1,497.3
Total Invested Capital $188.2 $583.4 $661.2 $1,013.0 $1,497.3
Total Proceeds / Value
Realized 780.8 1,557.2 1,962.0 4,277.3 –
Unrealized – – – 300.0 1,881.9
Total Proceeds / Value $780.8 $1,557.2 $1,962.0 $4,577.3 $1,881.9
Realized Investments
Gross Mult of Investment 4.1x 2.7x 3.0x 5.1x N/A
Gross IRR 57.4% 21.5% 36.1% 50.5% N/A
Total Fund
Gross Mult. of Investment 4.1x 2.7x 3.0x 4.5x 1.3x
Net Mult. of Total Cost 3.2x 2.0x 2.3x 3.1x 1.1x
Gross IRR 57.4% 21.5% 36.1% 47.1% 11.5%
Net IRR 45.0% 14.6% 23.9% 33.2% 3.3%
(4) (4)

Not an offer or solicitation.
Experienced, Cohesive Team
Odyssey Team has invested successfully for over 25 years through a variety of economic
conditions
• Broad, experienced team
• 30 investment professionals → ~300 years of collective experience at Odyssey
• Consistent leadership throughout Odyssey’s 25+ year history
• Successful apprenticeship model → experienced Odyssey investment team and
strong talent pipeline
• 17 of 19 senior investment professionals started as Associates at Odyssey
• Principals and Vice Presidents trained in methods of Active Ownership
• Track record of “hands on” operational experience and career development / internal
promotions → significant advantage in recruiting strong candidates
• Proven operating platform across two offices for the last 15 years
• Investment team supported by experienced professionals across all key functional
areas
7
Not an offer or solicitation.
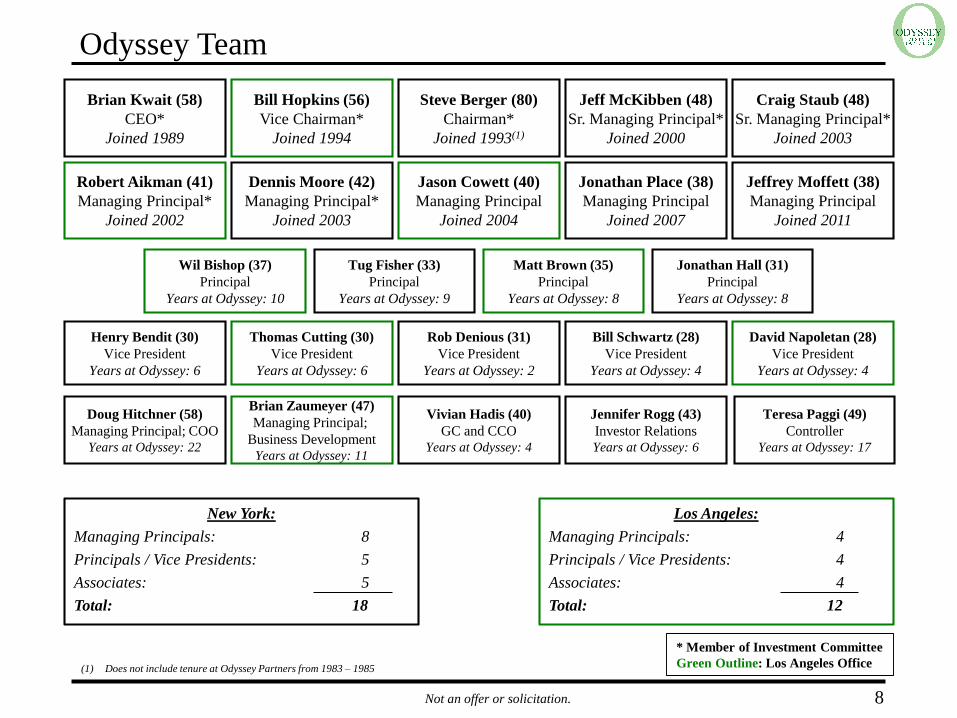
Odyssey Team
8
Brian Kwait (58)
CEO*
Joined 1989
Steve Berger (80)
Chairman*
Joined 1993(1)
Bill Hopkins (56)
Vice Chairman*
Joined 1994
Jeff McKibben (48)
Sr. Managing Principal*
Joined 2000
Craig Staub (48)
Sr. Managing Principal*
Joined 2003
Robert Aikman (41)
Managing Principal*
Joined 2002
Jason Cowett (40)
Managing Principal
Joined 2004
Dennis Moore (42)
Managing Principal*
Joined 2003
Jonathan Place (38)
Managing Principal
Joined 2007
Jeffrey Moffett (38)
Managing Principal
Joined 2011
(1) Does not include tenure at Odyssey Partners from 1983 – 1985
Wil Bishop (37)
Principal
Years at Odyssey: 10
Tug Fisher (33)
Principal
Years at Odyssey: 9
Matt Brown (35)
Principal
Years at Odyssey: 8
Jonathan Hall (31)
Principal
Years at Odyssey: 8
Henry Bendit (30)
Vice President
Years at Odyssey: 6
Thomas Cutting (30)
Vice President
Years at Odyssey: 6
Rob Denious (31)
Vice President
Years at Odyssey: 2
Bill Schwartz (28)
Vice President
Years at Odyssey: 4
David Napoletan (28)
Vice President
Years at Odyssey: 4
New York:
Managing Principals: 8
Principals / Vice Presidents: 5
Associates: 5
Total: 18
Los Angeles:
Managing Principals: 4
Principals / Vice Presidents: 4
Associates: 4
Total: 12
Doug Hitchner (58)
Managing Principal; COO
Years at Odyssey: 22
Vivian Hadis (40)
GC and CCO
Years at Odyssey: 4
Brian Zaumeyer (47)
Managing Principal;
Business Development
Years at Odyssey: 11
Jennifer Rogg (43)
Investor Relations
Years at Odyssey: 6
Teresa Paggi (49)
Controller
Years at Odyssey: 17
* Member of Investment Committee
Green Outline: Los Angeles Office
Not an offer or solicitation.
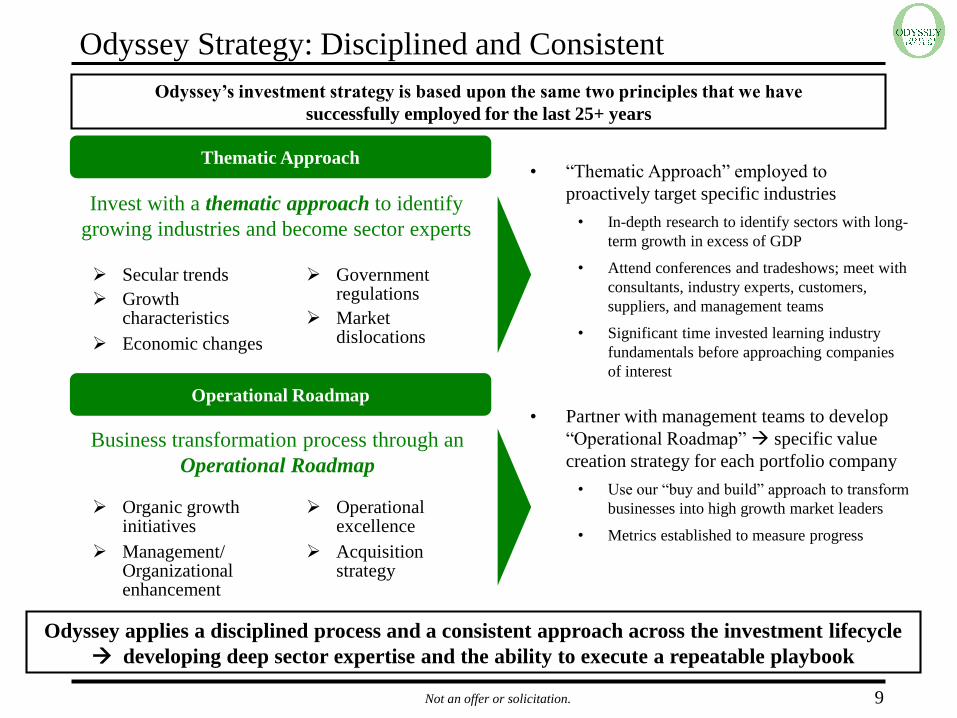
➢ Government regulations
➢ Market dislocations
➢ Operational excellence
➢ Acquisition strategy
• “Thematic Approach” employed to
proactively target specific industries
• In-depth research to identify sectors with long-
term growth in excess of GDP
• Attend conferences and tradeshows; meet with
consultants, industry experts, customers,
suppliers, and management teams
• Significant time invested learning industry
fundamentals before approaching companies
of interest
• Partner with management teams to develop
“Operational Roadmap” → specific value
creation strategy for each portfolio company
• Use our “buy and build” approach to transform
businesses into high growth market leaders
• Metrics established to measure progress
Odyssey Strategy: Disciplined and Consistent
9
Odyssey’s investment strategy is based upon the same two principles that we have
successfully employed for the last 25+ years
Invest with a thematic approach to identify
growing industries and become sector experts
Business transformation process through an
Operational Roadmap
Thematic Approach
➢ Secular trends
➢ Growth characteristics
➢ Economic changes
Operational Roadmap
➢ Organic growth initiatives
➢ Management/ Organizational enhancement
Odyssey applies a disciplined process and a consistent approach across the investment lifecycle
→ developing deep sector expertise and the ability to execute a repeatable playbook

Not an offer or solicitation.
Thematic Approach: Develop Deep Sector Expertise
10
Applying the Thematic Approach for 25+ years has led to a depth of experience and expertise in
multiple sectors
Aerospace / DefenseAutomated Equipment /
Industrial Technology
Packaging
Insurance Services Energy Services (1)
Denotes current portfolio company as of September 2019
Safety and Testing
Industrial Services (1)
Pharma OutsourcingHuman Capital
ManagementEvent Outsourcing
New Fund V Sectors
(1) Odyssey equipment rental investments have predominantly been in Industrial and Energy Services
Not an offer or solicitation.
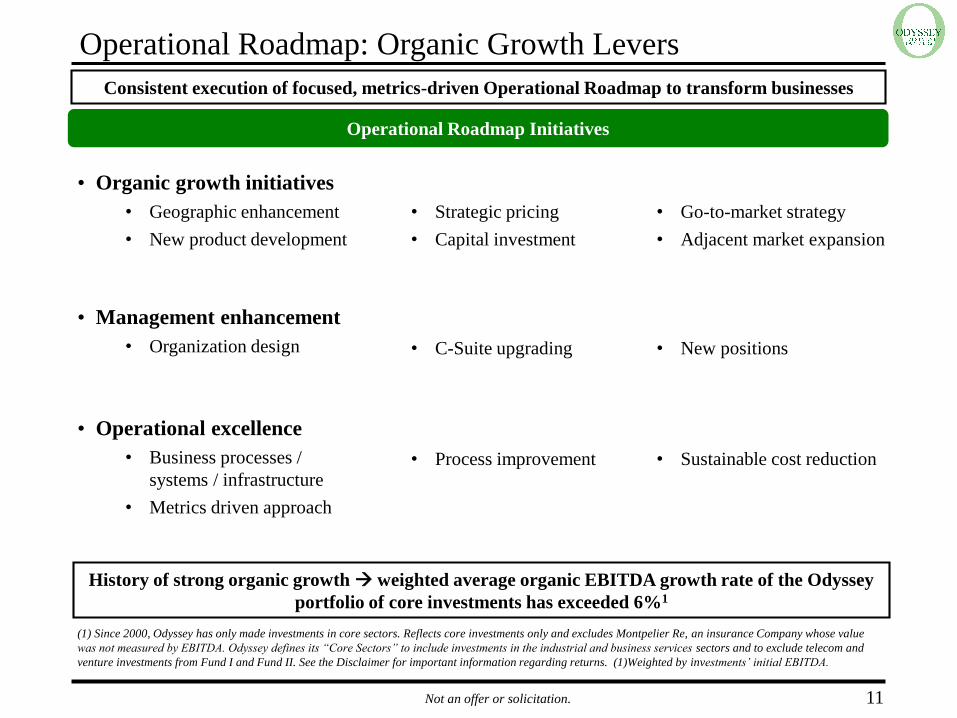
Operational Roadmap: Organic Growth Levers
11
Operational Roadmap Initiatives
Consistent execution of focused, metrics-driven Operational Roadmap to transform businesses
(1) Since 2000, Odyssey has only made investments in core sectors. Reflects core investments only and excludes Montpelier Re, an insurance Company whose value
was not measured by EBITDA. Odyssey defines its “Core Sectors” to include investments in the industrial and business services sectors and to exclude telecom and
venture investments from Fund I and Fund II. See the Disclaimer for important information regarding returns. (1)Weighted by investments’ initial EBITDA.
• Organic growth initiatives
• Geographic enhancement
• New product development
• Strategic pricing
• Capital investment
• Go-to-market strategy
• Adjacent market expansion
• Management enhancement
• Organization design • C-Suite upgrading • New positions
• Operational excellence
• Business processes /
systems / infrastructure
• Metrics driven approach
• Process improvement • Sustainable cost reduction
History of strong organic growth → weighted average organic EBITDA growth rate of the Odyssey
portfolio of core investments has exceeded 6%1

Not an offer or solicitation.
Operational Roadmap: Add-on Acquisitions
12
• Accelerate growth → with strategic guidance and technical support, we believe Odyssey’s
involvement is a catalyst for change and gives management confidence to increase the pace
of M&A
• Focus on strategic acquisitions that we believe will deliver tangible benefits
• Market consolidation
• Broader product / service offering
• Enhanced capabilities
• Operational talent
• Expanded geographic coverage
• Share diligence and integration capabilities
• Leverage a broad network of outside experts to support the team
• Develop people and processes to institutionalize M&A as an imbedded capability
Experienced acquirers → across 39 core sector platform investments(1) in Funds I - V, Odyssey has executed
nearly 200 add on investments
Add-on acquisitions are an integral part of the Operational Roadmap & help accelerate business transformation
(1) Since 2000, Odyssey has only made investments in core sectors. Odyssey defines its “Core Sectors” to include investments in the industrial and business services sectors and to exclude telecom and venture investments from
Fund I and Fund II. Includes Montpelier (OIP I), in platform count but does not include EBITDA contribution from this company. Reflects core investments only.
Buy and Build Approach

Not an offer or solicitation.
Organic
Growth
Initiatives
Management
Enhancement
Operational
Excellence
M&A
Operational Roadmap – Investment Case Studies
13
• 8 add on acquisitions
• $44M of acquired EBITDA
• Expanded product offering
and end-markets
• Facility rationalization
• Global sourcing
• New / upgraded ERP system
• Recruited entirely new
management team → CEO,
CFO, VP of Operations, VP of
Marketing and VP of business
development
• New product development
• Pursued strategic pricing
initiatives
• Reorganization of go-to-
market strategy
Repeatable playbook across multiple industries and management partnerships
• 4 add-on acquisitions
• $12.7M of acquired EBITDA
• Divested smaller commodity
segments
• Unlocked value of aerospace
segment with strategic divestiture
• Structured organization to create
focus by end market (aerospace,
medical, industrial)
• Expanded medical clean-room
and doubled production size of
facility in Mexicali, Mexico
• Supplemented strong existing
team with a new position in
aerospace (GM) and medical
(GM)
• Implemented strategic pricing
initiatives
• Restructured commercial
organization around attractive
end-markets
Note: For illustrative purposes only. See the Disclaimer at the beginning of this presentation. Past performance is not necessarily indicative of future results. The above investments are not representative of all of the investments in Odyssey’s funds.

Not an offer or solicitation. 14
Executive Summary of Terms
The Fund Odyssey Investment Partners Fund VI, LP, a Delaware limited partnership, together with any
parallel funds established to accommodate the investment requirements of certain investors.
Capital Commitments Target: $2.75 billion. Cap: $3.25 billion.
Closings Target first close: mid-late November 2019. Target final close: January 2020.
Investment Period 6 years.
Term 10 years, with 2 one year extensions by consent of Advisory Committee.
Management Fee During the Investment Period: 2.0% of Capital Commitments. Thereafter, 1.75% of invested
capital.
Distributions 8% hurdle, followed by an 80/20 split, 20% carried interest
Transaction, Break-Up and Other
Fees
100% management fee offset.
Disclaimer: This summary of terms is subject to the final definitive Limited Partnership Agreement of the Fund.


