Managerial Investment and Changes in GAAP: An Internal Consequence of External Reporting Nemit O. Shroff University of Michigan Stephen M. Ross School of Business 701 Tappan St. Ann Arbor, MI 48109 E–mail: [email protected]November, 2010 Abstract This paper investigates whether mandatory changes in Generally Accepted Accounting Principles (GAAP) affect managerial investments in physical capital and research and development. Using a sample containing forty–nine changes in GAAP, I find evidence that changes in accounting rules affect investment decisions. I then examine two mechanisms through which changes in GAAP affect investment. First, I show that the process of complying with certain mandatory changes in financial reporting alters managers’ information sets and consequently changes the quality of their investment decisions. Second, I show that managers of firms with financial covenants likely to be affected by changes in GAAP invest more (less) when the change in GAAP increases (decreases) covenant slack. This paper contributes to the literature on the real effects of accounting by showing that accounting rules affect investment decisions and by documenting specific mechanisms through which the relation manifests. Key Words: Investment, Investment Efficiency, Capital Expenditure, R&D, GAAP, Covenants JEL Classification: D9, G30, G31, M40, M41 I am very grateful to my dissertation committee members, Michelle Hanlon (co–chair), Russell Lundholm (co–chair), Amy Dittmar, Raffi Indjijekian, Yusufcan Masatlioglu, and Gregory Miller for their insightful comments and guidance. I am also grateful to Feng Li for help and guidance at the preliminary stages of the project and Beth Blankespoor and Hal White for comments and the numerous conversations we have had about the paper. I thank Anna Costello, S.P. Kothari, Bill Lanen, Roby Lehavy, Michal Matejka, Mike Minnis, Venky Nagar, Cathy Shakespeare, Terry Shevlin, Joseph Weber, Chris Williams, Gwen Yu and workshop participants at the Univeristy of Michigan for comments. I thank Jerry Searfoss for thoughtful discussions about the standard setting process and how changes in accounting standards affect firm behavior. I thank Ryan Hill, Arkisha Howard, Peter Lundholm, Paul Michaud, and Niketa Shroff for help with data collection. I thank Peter Demerjian for providing me data to link Dealscan with Compustat. Finally, I gratefully acknowledge financial support from the Paton Accounting Fellowship and the Deloitte Fellowship.
Transcript
Managerial Investment and Changes in GAAP: An Internal Consequence of External Reporting
Abstract This paper investigates whether mandatory changes in Generally Accepted Accounting Principles (GAAP) affect managerial investments in physical capital and research and development. Using a sample containing forty–nine changes in GAAP, I find evidence that changes in accounting rules affect investment decisions. I then examine two mechanisms through which changes in GAAP affect investment. First, I show that the process of complying with certain mandatory changes in financial reporting alters managers’ information sets and consequently changes the quality of their investment decisions. Second, I show that managers of firms with financial covenants likely to be affected by changes in GAAP invest more (less) when the change in GAAP increases (decreases) covenant slack. This paper contributes to the literature on the real effects of accounting by showing that accounting rules affect investment decisions and by documenting specific mechanisms through which the relation manifests. Key Words: Investment, Investment Efficiency, Capital Expenditure, R&D, GAAP, Covenants JEL Classification: D9, G30, G31, M40, M41 I am very grateful to my dissertation committee members, Michelle Hanlon (co–chair), Russell Lundholm (co–chair), Amy Dittmar, Raffi Indjijekian, Yusufcan Masatlioglu, and Gregory Miller for their insightful comments and guidance. I am also grateful to Feng Li for help and guidance at the preliminary stages of the project and Beth Blankespoor and Hal White for comments and the numerous conversations we have had about the paper. I thank Anna Costello, S.P. Kothari, Bill Lanen, Roby Lehavy, Michal Matejka, Mike Minnis, Venky Nagar, Cathy Shakespeare, Terry Shevlin, Joseph Weber, Chris Williams, Gwen Yu and workshop participants at the Univeristy of Michigan for comments. I thank Jerry Searfoss for thoughtful discussions about the standard setting process and how changes in accounting standards affect firm behavior. I thank Ryan Hill, Arkisha Howard, Peter Lundholm, Paul Michaud, and Niketa Shroff for help with data collection. I thank Peter Demerjian for providing me data to link Dealscan with Compustat. Finally, I gratefully acknowledge financial support from the Paton Accounting Fellowship and the Deloitte Fellowship.
1
1. Introduction
In this paper, I investigate whether changes in Generally Accepted Accounting Principles (GAAP)
affect an important managerial decision — corporate investment. Further, I investigate two mechanisms
through which this relation manifests. First, I put forward and examine a novel reason why changes in
GAAP might affect investment. I argue that changes in GAAP can force managers to collect and
process additional information to comply with the new standard, which changes their information set
and their subsequent decisions (henceforth, I refer to this proposed mechanism as the “information
hypothesis”). Second, I examine whether changes in GAAP affect investment decisions when
accounting numbers are used to compute covenants in private debt agreements. Financial accounting
statements based on GAAP serve as the foundation for contracting on accounting information
(Leftwich, 1983). Therefore, when contracts do not provide for a course of action in the event of a
change in GAAP, and contract renegotiation is costly, the change in GAAP can affect the real
decisions of firms participating in these contracts (Holthausen and Leftwich, 1983; Watts and
Zimmerman, 1986; henceforth, I refer to this proposed mechanism as the “contracting hypothesis”).
The information hypothesis is predicated on the observation that managers have limited
attention and are unlikely to process all the information available within the firm. Supporting the idea
that managers have limited attention, Simon (1973) argues that, “…the scarce resource is not
information; it is processing capacity to attend to information. Attention is the chief bottleneck…and
the bottleneck becomes narrower and narrower as we move to the tops of organizations...” When
attention is a bottleneck, managers might find it costly to maintain separate accounting systems for
internal and external reporting. For example, when internal and external accounting systems report
different numbers for the same concept, confusion arises as to which system is producing the “right”
number (Zimmerman, 2009; pg. 7). As a result, firms often generate internal accounting reports using
GAAP as the foundation for measurement.1
Managers relying on closely aligned accounting systems for external reporting and internal
decision making may fail to recognize some of the deficiencies of using GAAP for internal decisions.
Consequently, some changes in GAAP that obligate managers to collect and process additional 1 See Ball (2004) for anecdotal evidence. Hopper et al. (1992) and Drury and Tayles (1997) provide survey evidence.
2
information to implement the new rule can incrementally inform managers about the future cash flow
consequences of their decisions. For example, Singh (2001) quoted Ben Neuhausen, a partner in
Arthur Andersen’s professional standards group, as saying, “I think some companies were genuinely
clueless about how much these benefits were going to cost them over the long haul…once Statement
106 [post retirement benefits] forced them to measure these obligations, a lot of companies realized
that they had offered benefits they could not afford.” Therefore, the process of complying with some
accounting standards can inform managers that they under– or over–estimated the future cash flow
consequences of their decisions. I hypothesize that changes in GAAP that inform managers that they
overestimated (underestimated) the future cash flows and net present values (NPV) of their investment
decisions cause managers to decrease (increase) investment.2 In addition, if changes in GAAP inform
managers, they are likely to improve managerial investment decisions by reducing the likelihood of
investing in negative NPV projects, and increasing the likelihood of investing in positive NPV projects.
The contracting hypothesis argues that because the numbers reported in financial statements have
a direct bearing on institutional arrangements and contractual outcomes, managers pay close attention
to the impact their actions have on financial statements. Consequently, if an accounting change
significantly alters firms’ financial statements but contracts are not fully adjusted to accommodate such
a change, managers will be inclined to alter their actions (Holthausen and Leftwich, 1983). For
example, debt contracts often contain covenants based on numbers reported in financial statements
(Smith and Warner, 1979). The covenants in these contracts make it desirable for firms to report
higher earnings and book equity (Watts and Zimmerman, 1986). When a change in GAAP has an
unfavorable (favorable) impact on current and future financial statements, and debt covenants are not
adjusted to incorporate the changes, the change in GAAP will likely tighten (loosen) covenant slack.
Consequently, the change in slack may cause a decrease (an increase) in any discretionary spending
that increases the probability of obtaining an unfavorable financial statement outcome.
2 For example, if the adoption of SFAS 106 informed managers that they underestimated the cost of employees, this information is likely to cause a downward revision in NPV estimates, and thus, turn some previously positive NPV projects into negative NPV projects. Any such change in managerial NPV estimates is likely to decrease total investment. However, it is also conceivable that managers shift resources away from investments whose NPV is revised downward to other investments that are relatively more attractive in light of the information obtained from the change in GAAP. Therefore, changes in GAAP might be unrelated to total investment.
3
I test whether changes in GAAP affect managerial investment using a sample containing forty–
nine mandatory accounting rule changes implemented between 1991 and 2007. I measure investment
as research and development (R&D) and capital expenditures, and I use the cumulative effect of an
accounting change to measure the impact an accounting rule change has on firms’ earnings and book
equity.3 An innovation of my setting is that I use multiple accounting changes spread over 17 years,
which enables me to control for accounting standard fixed effects and mitigate concerns that the
results are driven by idiosyncratic attributes of a standard or the economic conditions around the
adoption of any single standard (Ball, 1980).
I begin my analysis by testing whether the cumulative effect of an accounting change is related to
managerial investment decisions after controlling for other determinants of investment. The
cumulative effect captures both the magnitude and sign of the impact an accounting change has on
firms’ financial statements, thus if changes in GAAP affect managerial investment then I expect the
cumulative effect to be positively related to investment under either hypothesis. Specifically, negative
cumulative effects may inform managers that they overestimated profits and cause them to revise NPV
estimates downward, leading to a decrease in investment (and vice versa for positive cumulative effects).
Alternatively, managers might cut investment because the cumulative effect has an unfavorable impact
on financial statements, which increases the probability of obtaining an unfavorable contractual
outcome (and vice versa for positive cumulative effects). I find evidence consistent with my overall
research question – the cumulative effect of an accounting change is positively related to both capital
and R&D investments, evidence that changes in GAAP affect managerial investment decisions.
To identify whether the relation between changes in GAAP and investment is explained by one
or both – information and contracting – hypotheses, I exploit the variation in the nature of the
changes in GAAP. In particular, I classify the standards into two groups based on their likelihood of
providing managers with information.4 The contracting hypothesis suggests a positive relation between
3 The cumulative effect of an accounting change is a one–time, non–cash, below–the–line charge reflecting the catch up effect from adopting the new accounting rule. The cumulative effect captures the difference between the old and new accounting practice as well as the degree to which a firm uses the economic transaction for which the accounting changed. 4 The classification of change in GAAP as more or less likely to inform managers is based on my subjective assessment of the accounting standard’s likelihood of informing managers. I validate this measure using a returns based test described in section 3.4, and I discuss the rationale for each classification choice in Appendix A.
4
the cumulative effect and investment for all changes in GAAP that alter contractual outcomes by
changing the manner in which financial statements are prepared. However, the information hypothesis
suggests that the relation between the cumulative effect and investment is restricted to the cumulative
effects arising from changes in GAAP that are likely to inform managers. Further, the information
hypothesis predicts an improvement in the quality of managerial investment decisions (i.e., investment
efficiency) following changes in GAAP that are likely to inform managers. In contrast, the contracting
hypothesis makes no prediction about investment efficiency.
I find that the relation between the cumulative effect of an accounting change and investment is
positive and statistically significant when the change in GAAP is likely to inform managers; the relation
is insignificant otherwise. I also find that investment efficiency improves following changes in GAAP
that are more likely to inform managers. Both findings suggest that changes in GAAP can provide
managers with information and facilitate their investment decisions.
To substantiate my inference and move away from the subjective classification of accounting
standards, I investigate whether firms with diverse operations (measured by the Herfindahl index for
diversification following Bushman et al., 2004) derive larger benefits from any information realized
from changes in GAAP. The premise for this test is that diverse operations reduce top management
focus and exacerbate problems associated with limited attention. Therefore, there is a greater
likelihood that managers of diversified firms neglect some information relevant for decision making,
and that a change in GAAP informs them. Consistent with this prediction, I find that the
improvement in investment efficiency is greater for diversified firms. Collectively, these results suggest
that some changes in GAAP can inform managers and improve their investment decisions.
The tests thus far provide limited support for the contracting hypothesis. To investigate further, I
examine the contracting hypothesis in a setting where managers are more likely to be concerned about
contracting outcomes. It is plausible that managers on average do not change long–term investment
behavior to affect contracting outcomes due to changes in GAAP because managers have other perhaps
less costly mechanisms through which they can alter contracting outcomes in the short run (e.g.,
accrual manipulation, altering operating activities, etc.). Therefore, I examine whether firms with
covenants in private debt agreements are more likely to change investment in response to a change in
5
GAAP.5 Most investments have an uncertain future outcome and some positive probability that the
outcome is a loss. Therefore, such investments increase the probability of violating covenants in the
future by adversely impacting future financial ratios. As a result, a decrease in covenant slack increases
the probability of violating covenants, to which managers might respond by cutting investment in risky
assets with the goal of preserving net worth and preventing deterioration of financial ratios.
I find that changes in GAAP affect both capital and R&D investments in the presence of
financial covenants. Additional tests reveal that changes in GAAP affect investment via its effect on
covenants only for the subset of firms whose debt contracts allow changes in GAAP to affect covenant
slack (i.e., when contracts are based on floating GAAP). In contrast, when debt contracts explicitly
disallow accounting changes from influencing the computation of covenants, I find that the relation
between changes in GAAP and investment is statistically insignificant. I also find that changes in
GAAP have a larger impact on investment when borrowers are likely to find renegotiating the debt
contract costly, where renegotiation costs are measured by the change in firm performance. These
results suggest that changes in GAAP affect managerial investment decisions not only by changing
managerial information sets but also by altering contracting outcomes.
This paper makes several contributions to the accounting and finance literatures. First, I provide
direct evidence that changes in GAAP affect managerial investment decisions. Prior research on the
relation between accounting changes and economic behavior examine whether accounting for a
transaction has real effects on that particular transaction for which the accounting changed. For
example, Mittelstaed et al. (1995) show that the change in accounting for post retirement benefits (SFAS
106) leads to a reduction in post retirement benefits offered to employees. In contrast, I show that
accounting rules have a more fundamental impact on investment decisions even when the accounting
rule change is unrelated to the measurement and reporting of managerial investment decisions.
Second, I show that the process of complying with certain mandatory changes in financial reporting 5 Contracting concerns are likely to play an important role in determining managerial actions also when accounting numbers are used in compensation contracts or for regulatory purposes. However, prior research suggests that managerial compensation contracts are often adjusted following changes in GAAP (e.g., Gaver and Gaver, 1998). I do not examine whether regulatory uses of accounting numbers cause changes in GAAP to affect managerial actions because the majority of industrial firms are unaffected by such regulation. Moreover, prior research provides convincing evidence that changes in GAAP have real effects in such settings (e.g., Bens and Monahan, 2008). However, there is limited evidence that changes in GAAP have real effects in other settings (Beatty, 2007).
6
alters managers’ information set, and consequently the quality of their investment decisions. This
internal information effect is largely unexplored by prior financial reporting studies that take the
managers’ information set as constant when examining how changes in reporting rules affect outside
investors’ information sets.
Third, this paper contributes to a recent stream of research in finance that examines the relation
between investment and financial contracting. In a related study, Chava and Roberts (2008) show that
capital investment declines sharply following a financial covenant violation, when creditors use the
threat of accelerating the loan to intervene in management. Nini et al. (2009) find that debt contracts
often contain capital expenditure restrictions, especially when credit quality deteriorates, which causes
a reduction in investment. These studies show that financial contracting imposes a direct cost on firms
by constraining investment when firm performance declines. My paper builds on this line of research
by showing that even non–performance related increases in the probability of violating covenants due
to changes in GAAP can cause managers to cut investment – an indirect cost of financial contracting.
Lastly, this paper contributes to a growing body of research that shows that financial reporting
considerations are associated with managerial investment decisions.6 These studies identify settings
where accounting information is more likely to affect contracting outcomes or investor perceptions to
examine the link between accounting and investment. A potential issue with these studies, which these
studies fully acknowledge, is that firms’ investment decisions and reporting choices are endogenous
(e.g., see Murphy and Zimmerman (1993) and Fields et al. (2001) for discussions of the endogeneity
concern). By studying changes in firm behavior around the adoption of multiple new standards, this
paper adds evidence on the link between accounting and investment in a completely different setting
that is less likely to be confounded by simultaneity bias.
The rest of the paper proceeds as follows. The next section discusses prior research and develops
the hypotheses. Section 3 discusses the variables. Section 4 describes the data. Section 5 discusses the
research design and empirical results. Section 6 addresses identification and endogeneity concerns.
Section 7 discusses additional analyses, and Section 8 concludes.
6 See e.g., Dechow and Sloan (1991), Bushee (1998), Bens et al. (2002), McNichols and Stubben (2008), Jackson et al. (2009), and Graham et al. (2010).
7
2. Prior research, motivation, and hypotheses
2.1 Information, changes in GAAP, and managerial investment
One of the primary objectives of financial reporting is to provide investors with information to
estimate firms’ future cash flows and facilitate investors’ capital allocation decisions (Beaver, 1981;
Kothari et al., 2010).7 Managers make capital allocation decisions by forecasting and discounting future
cash flows from investments (Graham and Harvey, 2001). Therefore, the production of financial
accounting statements for external investors can have a spillover effect on managers’ information sets
by requiring managers to assimilate information to comply with financial accounting rules – rules that
are partly designed to help forecast firms’ future cash flows. However, managers have virtually
unconstrained access to all information within the firm on a more timely basis and in greater detail
than that reported in financial statements.8 If the costs of compiling and processing information are
low, managers should be able to obtain any information relevant for decision making.
Although managers have unconstrained access to information within the firm, theories of costly
information acquisition and processing suggest that managers have limited information processing
capacities and are unlikely to be cognizant of all the possible information relevant for decision making
(Simon, 1973; Sims, 2003). When regulators change accounting rules with the stated objective of
improving the ability of financial statements to forecast future cash flows, the accounting change might
inform managers about the cash flow consequences of their actions and thus facilitate their decisions.
Changes in GAAP can affect managerial information sets for two reasons. First, simply the act of
presenting information in public financial statements can cause managers to pay closer attention to it.
Public financial statements are closely scrutinized by the entire investing community and the press,
which creates incentives for managers to closely monitor the information in financial statements.
Therefore, a change in reporting requirements can alert managers to unused information, which can
cause them to revise investment decisions. Second, the process of complying with a new accounting 7 Financial Accounting Standards Board (FASB) in their statement of concepts (SFAC No. 1, highlights) state that “[f]inancial reporting should provide information to help present and potential investors and creditors and other users in assessing … prospective cash receipts … Since investors’ and creditors’ cash flows are related to enterprise cash flows, financial reporting should provide information to help investors, creditors, and others assess the amounts, timing, and uncertainty of prospective net cash inflows to the related enterprise.” 8 Revsine et al. (1999) claim that “…managers regularly make operating and financing decisions based on information that is much more detailed and timely than the information found in financial statements…”
8
rule can cause firms to gather additional data within the firm, which might improve managerial
estimates of future cash flows. For example, compliance with standards such as SFAS 106 (post
retirement obligation) among others require firms to hire outside experts (e.g., actuaries, appraisers,
etc.) to help managers estimate accruals and evaluate the value of assets/liabilities. Therefore, such
changes in GAAP can improve the quality of the information available to managers to make their
investment decisions.9,10
Supporting the argument that changes in accounting rules affect managerial information sets,
anecdotal and survey evidence show that financial accounting rules affect management information
systems – the premier source of information for managerial decision making.11 Conventional wisdom
claims that managerial and financial accounting are fundamentally different entities since they cater to
fundamentally different audiences. However, Zimmerman (2009; pg. 7) argues that using different
systems for managerial decision making and external reporting can be costly because managers have
limited information processing capacities and the different systems can create disorder when they
report different numbers for the same concept. Besides, maintaining a similar accounting system for
internal and external reporting has other benefits such as a lower cost of auditing the system. In such a
scenario, changes in financial reporting rules can affect internal information systems and thus provide
managers with new information, which facilitates their investment decisions.
2.2 Contracting outcomes, changes in GAAP, and managerial investment
Accounting numbers prepared under GAAP serve as a foundation for contracting on accounting
information (Leftwich, 1983). As a result, changes in GAAP can affect real decisions through their
effect on contractual outcomes and managerial incentives (Holthausen and Leftwich, 1983; Watts and
9 It is important to note that I do not make any assumption about the quality of the new standard and its de facto effect on the ability of financial statements to forecast cash flows. 10 Hemmer and Labro (2008) argue that changes in financial reporting rules affect the optimal precision of the management accounting system and hence, the quality of managerial investment decisions. Their model relies on the observation that information asymmetry between managers and outsiders is affected by the quality of both the financial and management reporting system in place. By changing the amount of information asymmetry between managers and investors, changes in financial reporting rules lead to changes in the quality of the management information systems and subsequent management decisions. Although I do not explore this mechanism in detail, I control for the changes in the quality of information received by outsiders and hence, any change in information asymmetry due to the accounting change. 11 See e.g., Kaplan (1984), Johnson and Kaplan (1987), Hopper et al. (1992), Drury and Tayles (1997), and Ball (2004).
9
Zimmerman, 1986).12 Holthausen and Leftwich (1983) discuss that in the presence of incomplete
contracts and transaction costs it can be difficult to alter institutional arrangements to accommodate a
change in accounting rules. Consequently, changes in GAAP can have economic consequences by
altering the distribution of firms’ cash flows or the wealth of contracting parties.
Following this line of reasoning, some studies examine firms’ responses to mandatory changes in
GAAP. For example, Beatty (1995) and Hodder et al. (2002) show that the implementation of SFAS
115, which requires certain debt and equity investment securities to be fair valued, led banks to change
the size and composition of their investment securities portfolio. Both studies suggest that changes to
the banks regulatory capital ratio is the principle cause for the change in firm behavior. Mittelstaedt et
al. (1995) document a reduction in retiree healthcare benefits after SFAS 106 changed the accounting
for postretirement benefits. They find that higher debt contracting costs are the primary reason for the
reduction in postretirement benefits.13 In studies more focused on managerial investment and
contracting, Bens and Monahan (2008) and Zhang (2009) provide evidence that the introduction of
FIN 46 (consolidation of variable interest entities) led firms to cut investments in variable interest
entities. They attribute the decrease in such investments to the U.S. bank regulator’s use of GAAP
accounting numbers to evaluate the capital adequacy of banks. Bens and Monahan (2008) conclude
that “in certain settings, accounting standards appear to have real effects on investment activity…”
A common theme among prior studies that examine the real effects of changes in GAAP is that
they focus on whether accounting for a specific economic transaction (e.g., retirement benefits) affects
the future use of that economic transaction (e.g., providing employees retirement benefits). I build on
these studies by examining whether changes in GAAP have a more general effect on capital and R&D
investment decisions even when the accounting rules for capital and R&D investment remain
constant. This examination broadens the economic implications of changes in accounting rules (due to
incomplete contracting) beyond the direct effect of the accounting change.
12 Prior studies document stock market reactions to changes in the probability that a new accounting pronouncement will become mandatory (see e.g., Collins et al., 1981; Leftwich, 1981; Lys, 1984; and Christensen et al., 2009). These papers interpret the relation between mandatory accounting changes and stock returns as evidence that accounting changes alter firms’ financing and investment behavior in the presence of accounting based contracts. 13 Also see Imhoff and Thomas (1988), Marquardt and Wiedman (2005), and Choudhary et al. (2009) among others.
10
2.3 Hypotheses
I conjecture that changes in GAAP that have a positive (negative) impact on current and future
financial statements are likely to have two effects. First, they inform managers that they underestimated
(overestimated) the NPV of their investments. I assume that changes in GAAP that inform and cause
managers to revise NPV estimates have a homogenous effect on the NPV estimates of all available
investment opportunities. That is, changes in GAAP either inform managers that they underestimated
the NPV of all available investment opportunities or that they overestimated the NPV of all available
investment opportunities.14 Therefore, changes in GAAP that inform managers that they
underestimated (overestimated) project NPV are likely to be followed by an increase (decrease) in
investment. Second, I conjecture that changes in GAAP that have a negative (positive) impact on
financial statements are likely to increase the probability of having a negative (positive) contracting
outcome and, managers are likely to respond to such changes in GAAP by cutting investment in risky
assets with the goal of preventing further deterioration of financial ratios in the future.
H1: The cumulative effects of accounting changes are positively associated with firms’ investment. To examine whether changes in GAAP affect managerial investment by informing managers
and/or by altering contractual outcomes, I exploit variation in the likelihood that a change in GAAP
informs managers. Changes in GAAP that increase the amount of accrual accounting estimates are
more likely to inform managers because they might impose additional information processing
requirements on managers to arrive at reasonable accrual estimates. For example, compliance with
some standards such as SFAS 106 (post retirement benefits) and SFAS 142 (goodwill impairment)
require firms to make considerable judgments about future events to arrive at reasonable estimates of
the expense/benefit and the value of the asset/liability. Making informed estimates requires
information which may or may not be readily available to managers. Further, even if the information
necessary to comply with new standards is readily available, managers are likely to pay more attention
14 Note that it is conceivable that a change in GAAP informs managers that they underestimated the NPV of some investment opportunities but not of others. In such a scenario, changes in GAAP can cause managers to substitute away from investments whose NPV is revised downward and invest in other projects whose NPV is unchanged and hence, relatively better after the change in GAAP. Therefore, a change in GAAP can have an ambiguous effect on the total investment of a firm without the assumption of homogeneity. I relax this assumption for hypotheses 2b and 3.
11
to their accrual estimates when it is being reported to the public. Therefore, such standards are more
likely to inform managers.
On the other hand, compliance with rules such as SFAS 123R (expensing stock options), SOP
98–5 (mandatory expensing of business startup costs), and SAB 101 (revenue recognition) are less
likely to provide managers with decision–facilitating information. SAB 101, for example, increased
verifiability requirements to recognize revenue, which primarily resulted in postponing revenue
recognition until the higher verifiability threshold is met (Altamuro et al., 2005). Since managers are
less likely to gain any information about the underlying cash flow stream from a higher verifiability
threshold, this standard is less likely to inform managers.
The information hypothesis predicts that firms adopting accounting changes that are more likely
to inform managers will alter and improve managerial investment decisions. Conceptually, an
improvement in managerial investment entails undertaking projects with positive NPV and avoiding
projects with negative NPV (Brennan, 2003). Since a key determinant of successful capital allocation is
the precision with which managers identify the NPV of investments, changes in GAAP that improve
managers’ NPV estimates should also improve investment efficiency. The contracting hypothesis makes
no prediction about investment efficiency. The above discussion leads to the following hypotheses:
H2a: The cumulative effects of accounting changes are positively associated with firms’ investment when the accounting change is more likely to inform managers about the profitability of current or future projects.
H2b: The magnitude of the cumulative effect of an accounting change is positively associated with
changes in investment efficiency when the accounting change is more likely to inform managers about the profitability of current or future projects.
To further examine the information hypothesis, I investigate cross–sectional variation in the
relation between changes in GAAP and investment efficiency based on the level of diversification of
firms. Firms with diverse operations face more complex information environments and potentially
derive more benefit from any new information that might be realized from changes in GAAP relative
to firms with tighter operating focus. Specifically, multi–segment firms confront the possibility that
diverse activities reduce top management focus and exacerbate problems associated with limited
attention. Further, combining diverse operations creates information aggregation problems that can
12
result in information asymmetries within the firm (Bushman et al., 2004). Therefore, I also examine
whether the relation between changes in GAAP and investment efficiency is affected by the complexity
of the firm’s internal information environment.
H3: The association between the magnitude of the cumulative effect of an accounting change and changes in investment efficiency is stronger for firms with more complex internal information environments.
Finally, I hypothesize that changes in GAAP affect managerial investment decisions by altering
the probability of violating debt covenants in the future. Financial covenants in private debt
agreements provide a good setting to examine the effects of changes in GAAP on investment because
of their ubiquity and because covenants are generally defined in terms of modified versions of GAAP
(Smith and Warner, 1979). Further, since the covenants in private credit agreement are tightly set,
even small changes in financial ratios are likely to affect firm behavior (Kahan and Tuckman, 1993;
Verde, 1999; Dichev and Skinner, 2002). Therefore, when a change in GAAP pushes firms closer to
(away from) covenant violation, firms are likely to respond by cutting (increasing) investment spending,
provided the covenants are not fully adjusted to undo the effect of the change in GAAP.
H4: The cumulative effects of accounting changes are positively associated with firms’ investment when firms have financial covenants that are affected by the change in GAAP.
Ex ante, it is uncertain whether changes in the probability of covenant violation due to mandatory
accounting changes will cause managers to alter investment. Financial covenants are generally put in
place to monitor managers and prevent them from taking actions that transfer wealth from debt
holders to equity holders (Tirole, 2006). Since firms do not have a choice but to adopt mandatory
changes in GAAP, debt holders are likely to be more willing to renegotiate debt contracts to
accommodate changes in GAAP. Therefore, any costs of violating financial covenants due to
mandatory changes in GAAP are indirect costs of financial covenants which may or may not be large
enough to warrant a change in managerial investment.15 Moreover, managers have other mechanisms
through which they can alter contracting outcomes in the short run. For example, prior research
15 Even the direct costs of violating covenants such as increased interest rates, faster loan repayment, etc. are not always very high (see Armstrong et al. (2010) for a review of the literature). If the threat of violating covenants is sufficiently unlikely or if renegotiation costs are expected to be low as in the case of mandatory changes in GAAP, managers are unlikely to change investment decisions in response to a change in the probability of violating covenants.
13
suggests that managers manipulate accruals (Healy and Wahlen, 1999; Dechow and Skinner, 2000),
cash flows (Lee, 2010), and day—to—day operations (Roychowdhury, 2006; Cohen et al., 2009) to
achieve the desired financial reporting outcomes. Given these alternatives, whether managers change
long–term investment to lower the probability of an adverse accounting outcome and the resultant
contracting outcome is an empirical question.
3. Variable Measurement
The five primary variables used to test my hypotheses include 1) investment and its determinants,
2) changes in investment efficiency, 3) impact of changes in GAAP on firms’ financial statements, 4)
the likelihood that a change in GAAP provides managers with new information, and 5) managers’ debt
contracting incentives to modify behavior. I describe the measurement of these variables below.
3.1 Measuring investment and the determinants of investment
I measure Investment as either capital or R&D expenditure.16 I assume that R&D expenditure is
zero when it is missing in Compustat. The determinants of investment include: Tobin’s Q, Growth, Age,
MVE, CFO, Cash, Leverage, Returns, and lagged Investment. Tobin’s Q is the sum of the market value of
equity, long term and short term debt scaled by total assets; Growth is the percentage change in total
assets from year t–2 to t–1, when Investment is measured in t; Age is the natural logarithm of the
difference between the first year the firm enters Compustat and the current year. MVE is the natural
logarithm of market value of equity; CFO represents the cash flows from operations reported in the
statement of cash flow; Cash is cash and cash equivalents; Leverage is the sum of short– and long–term
debt, and Returns is stock returns from year t–1 to year t. I deflate Investment, CFO, Cash, Leverage, and
Cumulative Effect by the average of assets in period t and t–1. See Appendix B for variable definitions.
The variables Tobin’s Q, Growth, and Age are used to proxy for available investment opportunities
(Adam and Goyal, 2008; McNichols and Stubben, 2008; Richardson, 2006). CFO, Cash, and Leverage
proxy for financing constraints and agency problems associated with free cash flows, while MVE is a 16 My inferences are unchanged when I use the sum of capital and R&D expenditure as a measure of investment. Richardson (2006) uses a measure of investment that includes acquisitions in addition to capital expenditure and R&D. I do not examine acquisitions because they have an ambiguous effect on financial covenants. Further, information generated within the company is relatively less important for acquisitions because of the larger role played by the quality of the targets’ accounting practices and valuation.
14
proxy for both investment opportunities and the availability of financing (McNichols and Stubben,
2008; Richardson, 2006). I also control for contemporaneous Returns to account for any changes in
risk (Richardson, 2006). I control for lagged Investment, which gives the regression coefficients a
changes interpretation and captures a firm–specific component to investment decisions not captured
by the other variables (McNichols and Stubben, 2008). Lastly, I include indicator variables for each
two–digit SIC industry or for each change in GAAP in my regressions (Jackson et al., 2009; Biddle et
al., 2009). The indicator variables filter out industry– or standard–specific patterns in investment.
3.2 Measuring changes in investment efficiency
I measure investment efficiency as the magnitude of the deviation of actual investment from the
expected level of investment given the firm’s investment opportunities using two models of expected
investment extensively given in prior studies. The two models of expected investment are as follows:
where Investment is defined as either capital expenditure or the sum of capital and R&D expenditure.17
Sales Growth is the percentage changes in sales from year t–2 to t–1; Tobin’s Q and CFO are as defined
earlier. Equations (1) and (2) are estimated using all firms in Compustat for each industry–year based
on the Fama–French 30 industry classification for all industries with at least 20 observations each year.
The magnitudes of the residuals from each model (multiplied by minus one) are my primary measures
of investment efficiency.18 Examples of prior studies that use one of the above models to measure
expected investment are as follows. The first model is used by Wurgler (2000), Whited (2006), Acharya
et al. (2007), and Biddle et al. (2009). The second model of expected investment is used by Fazzari et al.
(1988), Hoshi et al. (1991), Biddle and Hillary (2006), and McNichols and Stubben (2008).
17 For the investment efficiency regressions I do not measure investment using R&D expenditure alone because more than half my sample firms do not invests in R&D, which makes the OLS estimator unsuitable to estimate equations (1) and (2). Further, the residuals from alternative models that allow the dependent variable to have a mass point (e.g., Tobit model) do not lend themselves to measuring investment efficiency since the residuals are not orthogonal to the independent variables. To overcome this issue, I use the sum of capital and R&D expenditure as an alternative measure of investment. 18 I examine the robustness of my inferences to two additional measures of investment efficiency using alternative models for expected investment. First, I use a modified version of Equation (2) that includes lagged growth, lagged investment, and allows for variation in the relation between investment and Tobin’s Q across different quartiles of Q (McNichols and Stubben, 2008; pg. 1579); and second, I use all the determinants of investment stated in section 3.1 to measure expected investment. I find that my inferences are unchanged with these alternative models of expected investment.
15
3.3 Identifying Changes in GAAP and measuring its impact on firms’ financial statements
The FASB allows firms flexibility in the timing and method of adoption of new accounting
standards.19 Therefore, the year in which a change in GAAP is made mandatory cannot be used to
identify firms that change accounting rules. Further, even though the adoption of changes in GAAP is
mandatory for all publicly traded firms, there is significant cross–sectional variation in the impact each
accounting standard has on adopting firms’ financial statements and in the impact different standards
have on firms’ financial statements (i.e., both within and between standard variation in impact).
To overcome problems identifying when firms adopted an accounting change and to exploit
variation in the impact an accounting change had on firms’ financial statements, I use the Cumulative
Effect of an accounting change (scaled by average assets) to identify and to measure the magnitude and
sign of the impact a change in GAAP has on firms’ financial statements. The cumulative effect is a
one–time, non–cash, below–the–line item reflecting the prior–period or ‘catch–up’ effect of changing
an accounting practice, which is recognized in the current period’s income statement. This amount
captures the difference between the old and new accounting rules, and the extent to which each firm
used the transaction (or economic activity) for which the accounting changed. Computationally, the
cumulative effect of an accounting change is the difference between the owner’s equity under the old
accounting rules, and the owner’s equity after the change in GAAP.
Although using the cumulative effect of an accounting change allows me to identify firms that
adopted a new accounting standard and to exploit cross–sectional variation in the impact of
accounting changes on firms’ financial statements, there are two limitations of the measure: 1) not all
changes in GAAP require firms to use the catch–up method to account for the transition to the new
19 Accounting rule changes can be adopted using a combination of four methods: prospective, retroactive, catch–up, and retroactive/catch–up (Balsam et al., 1995). Under the prospective method, the accounting change is adopted prospectively and it affects only current and future periods’ financial results. The retroactive method requires that all prior years’ financial statements presented as comparative income statements/balance sheets be restated to reflect the accounting change (to the extent such computation is possible). Under the catch–up approach, the prior–period effects of changes in GAAP are recognized as the “cumulative effect of an accounting change” in the current period’s income statement. Lastly, the retroactive/catch–up approach requires firms to include the cumulative effect of an accounting change in the earliest year’s comparative income statement presented along with the current period’s income statement. Under Accounting Principles Board Opinion No. 20 – the accounting rule governing changes in GAAP prior to 2005 – most accounting changes were implemented using the catch–up method. For fiscal years beginning after December 15, 2005, SFAS 154 governs the accounting for transition adjustments due to changes to GAAP and it requires firms to primarily use the retroactive method.
16
GAAP, and 2) firms often have some choice in the method and timing of adopting changes in GAAP.
The first limitation limits the number of rule changes in the sample but is unlikely to create any
systematic bias in my inferences. However, the second limitation warrants discussion, which I do in
detail in section 6.
3.4 Measuring the likelihood that a change in GAAP informs managers
I exploit differences in the characteristics of the new accounting pronouncement to classify
change in GAAP into two groups, Information and No Information, based on their likelihood of
providing managers with decision–facilitating information. To classify standards, I read all the
standards in my sample and evaluate the likelihood that they provide managers with information along
the following dimensions. One, I examine whether the change in GAAP increased the amount and
complexity of accrual accounting estimates that managers are required to make. Managers require
information to estimate the numbers reported in public financial statements, some of which may not
be readily available. Therefore, standards that increase estimation requirements are more likely to
provide managers with information. Two, standards that may require firms to hire outside experts such
as actuaries and appraisers to aid with compliance are classified as more likely to inform managers (e.g.,
Goodwill – SFAS 106, Asset Retirement Obligation – SFAS 143). Finally, I examine whether the stated
objective of the new standard is to make financial statements more relevant for valuation. Although
FASB strives to make financial statements both relevant and reliable, there is generally a trade off
between the two objectives. Therefore, some standards (e.g., SAB 101 – Revenue Recognition) are
designed to make financial statements more reliable whereas other standards (e.g., SFAS 142 –
Goodwill) are designed with the objective improving financial statement relevance. Standards designed
to improve relevance are more likely to inform managers since relevant information by definition
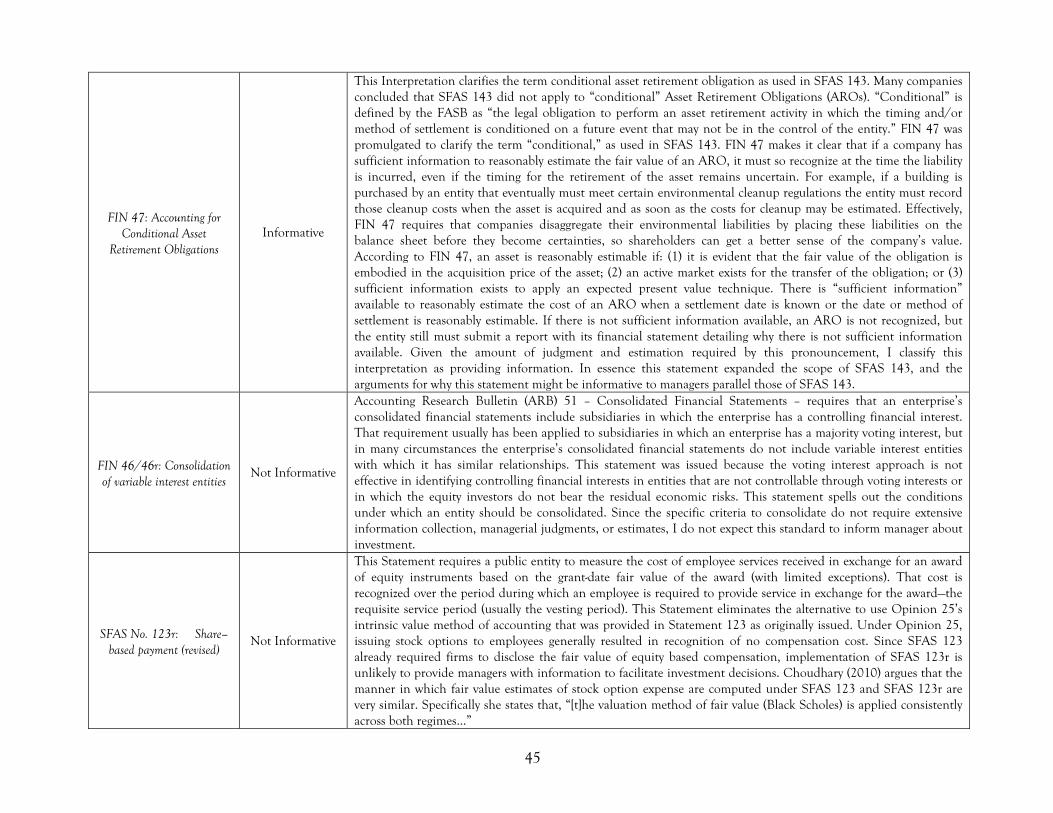
should help predict future cash flows. Table 2 and Appendix A contain my classification scheme and a
detailed discussion of my classification choices for the major standards in my sample.
To validate my classification, I examine whether the Cumulative Effects arising from standards
classified as more likely to inform managers are more closely associated with concurrent stock returns
than the Cumulative Effects arising from standards classified as less likely to inform managers,
17
controlling for contemporaneous earnings. Assuming managers’ information sets are fully impounded
in stock prices, we would observe an association between stock returns and the Cumulative Effect — a
one time catch up effect of the accounting change — only if the Cumulative Effect provides managers
with new information. I find that the Cumulative Effects arising from standards identified as more likely
to inform managers have a significantly stronger association with stock returns than standards less
likely to inform managers (unreported), thereby at least partially validating my classification. I also
conduct sensitivity tests to ensure the robustness of my results to this classification scheme (Section 7).
3.5 Measuring debt contracting incentives
Debt covenants are generally tailored for each contract and exhibit significant differences in their
computation across contracts. Such heterogeneity in covenant definitions makes it very costly to
accurately compute covenant slack for a large sample of observations. Therefore, I measure debt
contracting incentives using the presence of a debt covenant in firms’ private debt agreements. Since
covenants in private debt contracts are tightly set (Kahan and Tuckman, 1993; Dichev and Skinner,
2002) the presence of a covenant is likely to be a reasonable proxy for covenant slack while filtering out
some of the measurement error likely to be present in any measure of slack.
Specific to my research question, I note that debt contracts include several covenants, not all of
which are affected by the Cumulative Effect. For example, a covenant limiting the maximum debt to
cash flows ratio will be unaffected by the Cumulative Effect since the Cumulative Effect does not have any
direct cash flow implication. Further, debt contracts differ with respect to how they deal with changes
in GAAP. Prior research identifies three common debt contracting practices: the “fixed” GAAP
practice that excludes all accounting changes once the contract is signed; the “floating” GAAP practice
that uses the most up–to–date GAAP; and a hybrid that gives lenders and borrowers a “mutual option
to freeze” GAAP at any point in time (see Mohrman, 1996; Beatty et al., 2002; Christensen and
Nikolev, 2009). The covenant slack in debt contracts that use the fixed or hybrid GAAP are unaffected
by changes in GAAP because they explicitly disallow (or provide contracting parties the option to
disallow) such changes to covenants. Therefore, only covenants in floating GAAP debt contracts are
likely to create managerial incentives to change investment behavior. To incorporate this institutional
18
feature of debt contracts in my tests, I construct two indicator variables – Covenant and Floating GAAP
– that take on the value of one if the firm–year has at least one covenant that can be affected by the
Cumulative Effect, and if the debt agreement uses the floating GAAP practice, respectively.20
4. Data and Sample Selection
I begin my sample construction by identifying firm–years in the intersection of CRSP and
Compustat with non–missing and non–zero values for the Cumulative Effect of an accounting change.
However, both voluntary and mandatory accounting changes can cause firms to book a Cumulative
Effect, and including voluntary accounting change in my sample raises endogeneity concerns.21 To
eliminate voluntary accounting changes from my sample, I hand collect information from 10K filings
for the subset of observations in Compustat that have a non–missing and non–zero Cumulative Effect.
The information in 10K filings helps me decipher not only whether the accounting change is
mandatory or voluntary but also which mandatory accounting change caused firms to book a
Cumulative Effect. Requiring electronic 10K filings from Edgar constrains my sample to begin in 1991.
The above criteria yield 5,530 firm–year observations between 1991 and 2007. Requiring data to
compute average assets reduces my sample to 5,241 observations. I drop firms operating in any
regulated industry and the financial industry since their incentives differs from that of industrial firms,
and they often have regulatory restrictions on investment. Further, these firms also have accounting–
based regulatory requirements (e.g., rate–regulation, regulatory capital, etc.), which affect their
accounting choices (Beatty, 2007). Explicitly modeling these incentives is beyond the scope of this
paper, and hence I drop these firms, leaving 3,903 observations.22 Data requirements for other
independent variables further reduce my sample to 3,473 observations. Missing 10K filings and 10K
filings with insufficient information about the cumulative effect of an accounting change reduce my
20 From reading contractual provisions I find that some debt agreements allow contracting parties to renegotiate covenant thresholds after a change in GAAP and require firms to reconcile and disclose any change in financial ratios due to the change in GAAP. Such disclosures might affect the outcome of negotiations relating to covenants in the loan agreement and hence, might affect firm behavior as well. Therefore, I refer to both, covenants in agreements with floating GAAP and agreements requiring reconciliation disclosures as Floating GAAP. 21 For example, Sweeney (1994) shows that managers of firms approaching default adopt income increasing voluntary accounting changes prior to violating covenants. To the extent firms approaching covenant violations also encounter a decline in investment opportunities, including voluntary accounting changes in my sample could be problematic. 22 However, I find that my inferences are unchanged when I keep firms in financial or regulated industries in my sample.
19
sample to 3,012 observations, of which 2,795 observations have mandatory accounting changes and
217 observations have voluntary accounting changes. My final sample comprises 2,795 firm–years,
2,033 unique firms, and forty–nine changes in GAAP from 1991 to 2007 (see Table 1).
I also require data on the presence of financial covenants to test my fourth hypothesis, which I
obtain from Loan Pricing Corporation’s Dealscan database. Dealscan contains data on loan
agreements for 59% of my sample. I assume that observations not in Dealscan do not have private debt
agreements.23 Lastly, I hand collect data on the contracting practices – Fixed, Floating, or Mixed GAAP
– used in the loan agreements of my sample firms. I obtain loan agreements for 371 of the 652
observations in my sample with relevant covenants from either Amir Sufi’s website or Edgar, and I
identify the contracting practice used in these agreements.24 I conduct all analysis requiring data on the
definition of GAAP used in loan agreements using this smaller sample of 2,514 observations, i.e., 371
observations with covenants and identified GAAP definitions in contracts, and 2,143 observations
without covenants that are affected by the Cumulative Effect.
5. Research Design and Empirical Analyses
5.1 Summary Statistics and Correlations
Table 2 reports descriptive statistics of the changes in GAAP in my sample. Table 2, Panel A
shows the major accounting changes in my sample along with the years of adoption, methods of
implementing the standard, the mean Cumulative Effect for the rule change, the number of
observations for each standard, and whether the standard is classified as likely to provide managers
with information. The table shows that there is considerable variation in the average Cumulative Effect
across the standards. Further, all the standards allow some discretion with respect to the year in which
a standard can be adopted. Table 2, Panel B shows the number of observations and the accounting
standards adopted each year along with the scaled and unscaled mean Cumulative Effect. 23 The Dealscan database contains between 50% and 75% of the value of all commercial loans in the U.S. during the early 1990s (Carey and Hrycray, 1999). From 1995 onward, Dealscan coverage increases to include an even greater fraction of commercial loans (Chava and Roberts, 2008). Therefore, assuming that only the firms covered by Dealscan have private debt agreements is unlikely to cause much measurement error. 24 Firms are required by the SEC to file material contracts with the SEC and Nini et al. (2009) obtain a sample of 3,720 contracts by electronically searching through SEC filings for certain terms that are common to private credit agreements. This data are available on Amir Sufi’s website (http://faculty.chicagobooth.edu/amir.sufi/data.htm). For the most part, I obtain loan agreements from Amir Sufi’s website but I augment their data by obtaining some on my own.
20
Table 3 reports the summary statistics for variables used in the regression analysis. The mean
(median) Cumulative Effect is –2.6% (–0.3%) of average total assets suggesting that accounting rule
changes can have economically significant impacts on bottom line earnings and book equity. The mean
R&D Expenditure is 0.033 while the median is zero, indicating that more than half of the firm–year
observations in my sample do not invest in R&D. The average firm in my sample is 21 years old, has a
market value of equity of $3.3 billion, and cash flows from operations amounting to 6.7% of average
assets. These statistics indicate that the average firm in my sample is large and profitable. However, the
other statistics in the table show that there is considerable variation in size and profitability of firms in
my sample. Table 3 also shows that 66.8% of the observations in my sample adopted accounting
standards that are likely to inform managers; 58.7% of the observations are covered by the Dealscan
database, and 23.3% of the observations have financial covenants in their loan agreements that are
likely to be affected by the Cumulative Effect. Further, the table shows that of the 371 observations for
which I find loan agreements, 43.9%, 35.8% and 20.2% follow fixed, hybrid, and floating GAAP,
respectively, which is similar to that documented by Christensen and Nikolaev (2009).
Table 4 presents the Pearson correlation coefficients and p–values for the variables used in the
regression analysis. The univariate correlations indicate a positive relation between Capital Expenditure
and the Cumulative Effect, consistent with H1, but a negative relation between R&D Expenditure and the
Cumulative Effect. Surprisingly, the Cumulative Effect is also correlated with the other control variables
listed in the table. Upon further investigation I find that these correlations are largely due to strong
calendar year effects present in the Cumulative Effect. Once I account for calendar effects by clustering
standard errors by year, the correlations between the Cumulative Effect and Tobin’s Q, Growth, Ln(Age),
Ln(MVE), and Cash & Marketable Securities becomes statistically insignificant while the correlation
between the Cumulative Effect and Capital Expenditure remains statistically significant. The table also
shows that Tobin’s Q, Growth, and Ln(Age) – proxies for investment opportunities – are correlated with
both measures of investment in the expected direction. Further, CFO and Capital Expenditures are
positively correlated, consistent with the ‘investment–cash flow sensitivity’ literature (see Fazzari et al.,
1988). Consistent with Biddle et al. (2009), I find that Δ Financial Reporting Quality – minus one times
21
the change in the Dechow and Dichev (2002) measure of accounting quality – is positively related to all
four measure of investment efficiency. However, the correlation between Δ Financial Reporting Quality
and Cumulative Effect (both signed and unsigned) are insignificant suggesting that changes in GAAP do
not affect accounting quality on average.
5.2 Regression Analysis – Test of H1
To examine the relation between changes in GAAP and managerial investment, I test whether the
Cumulative Effect of an accounting change is associated with capital and R&D investment after
controlling for the determinants of investment documented in prior research. Specifically, I estimate
the following regression (see Section 3.1 or Appendix B for variable definitions).
The coefficient of interest in equation (3) is β1, which captures the relation between changes in GAAP
and Investment. When Capital Expenditure is the type of investment, I estimate equation (3) using
ordinary least squares (OLS), and I compute standard errors that are robust to the presence of time–
series and cross–sectional correlation in the residuals by clustering them at the firm and year level
(Petersen, 2009; Gow et al., 2010). This method accounts for residual correlation due to period specific
shocks to investment and serial correlation in investment within a firm. When R&D Expenditure is the
type of investment, I estimate equation (3) using the Tobit model (Tobin, 1958). Since R&D
Expenditure is zero for a substantial part of my sample but positive for the rest of the sample, OLS
estimates of the regression coefficients are inconsistent (see Wooldridge, 2002; pg. 524).25,26 I examine
the contemporaneous relation between Investment and the Cumulative Effect to mitigate concerns that 25 There is little dispute that OLS estimates are inconsistent for modeling R&D expenditures because of the mass point at zero. However, since R&D expenditure is not “censored” at zero but rather firms choose to invest nothing in R&D, some papers advise against using the Tobit model (e.g., Maddala, 1991) while other econometrics texts suggest the opposite (e.g., Wooldridge, 2002; Greene, 2003). I discuss the robustness of my results to other estimation techniques in Section 7. 26 For regressions with R&D as the dependent variable, I cluster standard errors only by year. I find that when implementing two-way clustering of standard errors for the R&D regressions, the estimated variance matrix has negative elements on the diagonal of the matrix, indicating a negative variance for some of the covariates in the regression. Since two-way clustering is basically standard errors clustered along each dimension (i.e., firm and year in my case) minus the standard errors clustered along the intersection of the two dimensions, large enough estimates of the standard errors clustered along the intersection can lead to negative standard error estimates based on two-way clustering. Cameron, Gelbach, and Miller (2010) suggest that this problem primarily occurs when there is “actually no need to cluster in more than one dimension.”
22
the relation between investment and changes in GAAP is due to the information obtained from the
financial statements of other firms (e.g., Durnev and Mangen, 2009) or due to feedback effects where
financial information reported to capital markets affects capital market pricing of the firm, which in
turn affects firms’ real decisions (Kanodia, 2007; Plantin et al., 2008; Sapra, 2010; Bhat et al., 2010).
However, I find that my results are robust using future Investment as the dependent variable.
Table 5 reports the results from estimating equation (3). I find that the coefficient for the
Cumulative Effect is positive and statistically significant at the 1% level both when the dependent
variable is Capital Expenditure and when it is R&D Expenditure. The coefficients suggest that changes in
accounting standards affect investment in both physical and knowledge capital, consistent with my
hypotheses. In terms of economic magnitude, I find that a one standard deviation increase in the
Cumulative Effect leads to a 3.38 percentage point increase in Capital Expenditure from its mean, ceteris
paribus. To get a sense of the importance of accounting changes I compare the economic magnitude of
the Cumulative Effect with that of CFO. I find that a one standard deviation increase in CFO leads to a
5.06 percentage point increase in Capital Expenditure suggesting that the impact of accounting changes
on investment is approximately 67% as large as that of cash flows from operations in the year of the
accounting change. The control variables generally line up consistent with expectations and prior
research. Specifically, Tobin’s Q, Growth, Returns, and lagged Investment are positively associated with
current Investment. CFO is positively related to Capital Expenditure (consistent with the investment–
cash–flow–sensitivity literature), and negatively related to R&D Expenditure (due to R&D expensing).
To corroborate my findings, I also estimate regressions where I replace the industry indictors with
23 indicator variables, one for each accounting standard group reported in Table 2. The benefit of
including fixed effects for accounting standards is that the idiosyncratic attributes of individual
accounting rules are filtered out in the estimation. Idiosyncratic attributes might cause some
accounting standards to have systematically larger Cumulative Effects than others, or to have Cumulative
Effects more subject to managerial discretion than others.27 Including accounting standard fixed effects
27 For example, some accounting standards allow more discretion in the method of adopting the standard than others (such as SFAS 106 vs. SAB 101) or some standards might allow more discretion in estimating the magnitude of the Cumulative Effect (e.g., SFAS 142 vs. SAB 101).
23
removes idiosyncratic features of a standard, and the coefficient for Cumulative Effects in the regression
captures only the common effect of all accounting changes on investment. However, the drawback of
including accounting standard fixed effects is that some information relevant for documenting a
relation between accounting changes and investment will also get filtered out in the process.
Table 5 shows that the coefficient for the Cumulative Effect in both the Capital Expenditure and
R&D Expenditure regressions continues to be positive and statistically significant at the 1% level or
better, but it drops in magnitude from 0.044 (0.016) to 0.017 (0.013) in the Capital Expenditure (R&D
Expenditure) regression. This is to be expected given that only a subset of the variation in the Cumulative
Effect is used to estimate the relation between the accounting changes and investment decisions.
5.3 Regression Analysis – Tests of H2a, H2b, and H3
Part A of my second hypothesis suggests that changes in accounting rules affect investment
decisions by informing managers about the NPV of their investments. To test this hypothesis, I
augment equation (3) by including additional independent variables to capture the relation between
the Cumulative Effect and Investment conditional on the change in GAAP providing managers with
information to facilitate their investment decisions.
Information (No Information) is an indicator variable that takes on the value of one if a firm adopts a
standard that is likely (unlikely) to provide managers with decision facilitating information; the variable
equals zero otherwise. CONTROLS is a vector of control variables listed in equation (3) and described
in Section 3.1. The coefficient of interest is β1, which captures the relation between changes in GAAP
and Investment when firms adopt standards likely to inform managers about the NPV of their
investments or available opportunities.28 H2a predicts that β1 will be greater than zero. Table 6 presents
the results from estimating equation (4). The table shows that the coefficient for the interaction term
between Information and Cumulative Effect is positive and statistically significant at the 1% level for both
28 I note that interaction terms in non–linear models such as Tobit do not equal the marginal effect of the interaction term (Ai and Norton, 2003). However, since my interest is in the relation between the Cumulative Effect and Investment conditional on Information equaling one (rather than the incremental effect of Information), the usual marginal effects apply.
24
Capital and R&D Expenditure decisions. The coefficient suggests that accounting changes affect
investment decisions when compliance with the standard provides managers with decision facilitating
information, consistent with H2a.29
The contracting hypothesis suggests that the relation between the cumulative effect and all
changes in GAAP that alter contracting outcomes should be positive. However, Table 6 shows that the
coefficient for the interaction term between No Information and Cumulative Effect (β2) is statistically
insignificant for both Capital and R&D Expenditure. This result suggests that managers, on average, do
not change long–term investment behavior to affect contracting outcomes due to changes in GAAP
when information effects are not present. I investigate this further in the next section.
Part B of my second hypothesis predicts that if changes in accounting rules facilitate managerial
investment decisions then the changes in accounting rules should improve managerial investment
decisions as well. Further, any improvement in managerial investment decisions will be greater for
diversified firms that have more complex information environments within the firm (H3). I test these
hypotheses by estimating the following regressions.
Δ Investment Efficiency is the change in investment efficiency from the year t–1 to t+1; the accounting
change is adopted in year t. The above tests require a measure of the magnitude of the impact a change
in GAAP has on the firm’s financial statements. Therefore, I use the absolute value of the Cumulative
Effect in the above regressions. Δ Financial Reporting Quality is minus one times the change in the
Dechow and Dichev (2002) measure of accounting quality with the modification suggested by
29 I do not control for accounting standard fixed effects because the differences in accounting standards helps me classify them as more or less likely to inform managers and identify the information hypothesis. However, I find statistically similar but economically weaker results when I replace industry fixed effects with accounting standard fixed effects (untabulated).
25
McNichols (2002), from the year t–1 to t+1.30 Δ Number of Analysts and Δ Institutional Ownership are the
change in the number of analysts following the firm, and the proportion of the firm’s stock held by
institutional investors from the year t–1 to t, respectively. Organizational Complexity is measured using a
Herfindahl index for business segment diversification (Bushman et al., 2004). I also include industry
fixed effects using indicator variables for each 2—digit SIC code in the above regressions.
Biddle and Hillary (2006) and Biddle et al. (2009) show that firms with better reporting quality
invest more efficiently. Since changes in GAAP might also change firms’ financial reporting quality, I
control for concurrent changes in reporting quality. I also control for changes in corporate governance
and external monitoring around the change in GAAP using the change in the number of analysts
following the firm, and the proportion of the firm owned by institutional investors to address the
possibility that firms with strong corporate governance structures and external monitoring mechanisms
are less likely to under– or over– invest (Biddle et al., 2009).
The coefficient of interest in equation (5) is β1 and it captures the relation between the quality of
managerial investment decisions and the magnitude of the impact a change in GAAP has on a firm’s
financial statements when the change in GAAP is likely to inform managers. H2b predicts that β1 will
be positive. Table 7 shows that changes in GAAP that are likely to inform managers lead to an
improvement in investment efficiency, consistent with H2b. Specifically, I find that the coefficient for
the interaction between Information and Unsigned Cumulative Effect is positive and statistically significant
at the 10% level or better in all four regressions. In terms of economic significance, I find that a one
standard deviation increase in Unsigned Cumulative Effect (Δ Financial Reporting Quality) leads to a 14
(21) percentage point increase in the change in investment efficiency from its mean, ceteris paribus.
The coefficients of interest in equation (6) are β1 and β2. β1 captures the relation between the
quality of managerial investment decisions and the magnitude of the impact a change in GAAP has on
a firm’s financial statements, and β2 captures the incremental effect of this relation for firms with
complex information environments. H2b predicts that β1 will be positive, and H3 predicts that β2 will 30 I measure the change in investment efficiency and financial reporting quality as the difference between the respective measures in year t+1 and t–1, where the change in GAAP was adopted in year t. Since the measures of investment efficiency (financial reporting quality) are computed using lagged values of investment opportunities (cash flows), I do not measure these variables in the year of the accounting change to avoid measuring the dependent and independent variables under different sets of GAAP.
26
be positive. Consistent with H2b, I find that the coefficient for the Unsigned Cumulative Effect is
positive and statistically significant at the 5% level or better in all four regressions; and consistent with
H3, I find that the coefficient for the interaction between the Unsigned Cumulative Effect and
Organizational Complexity is also positive and statistically significant at the 5% level or better in three of
the four regressions (see Table 8). The results suggest that changes in GAAP improve managerial
investment efficiency and that the improvement in investment efficiency is greater for firms with
complex internal information environments. Interestingly, Tables 7 and 8 also show that the
coefficient for Δ Financial Reporting Quality is positive and generally statistically significant. This result is
consistent with the findings in McNichols and Stubben (2008) and Biddle et al. (2009) who document
a relation between financial reporting quality and investment efficiency. My results support their
findings in a different setting using changes in investment efficiency and changes in reporting quality
due to changes in GAAP. Also consistent with Biddle et al. (2009), I find that the coefficients for Δ
Number of Analysts and Δ Institutional Ownership are statistically insignificant across all specifications.
Collectively, the results in Tables 6, 7, and 8 provide robust evidence that changes in GAAP affect and
improve managerial investment decisions by providing them with decision facilitating information.
5.4 Regression Analysis – Tests of H4
My final hypothesis predicts that changes in GAAP are likely to affect managerial investment
when firms have financial covenants that are affected by the Cumulative Effect. To test this prediction, I
augment equation (3) by including additional covariates to capture the relation between the Cumulative
Effect and Investment conditional on the presence of a Covenant and the definition of GAAP used in the
lending agreement (i.e., floating GAAP vs. others).
Covenant is an indicator variable that takes on the value of one if the firm–year has at least one
covenant that can be affected by the Cumulative Effect. No Covenant is an indicator variable that takes
on the value of one (zero) if Covenant equals zero (one). Floating GAAP is an indicator variable that
takes on the value of one if the debt agreement uses the floating GAAP practice or requires the firm to
disclose reconciliations between the old and new accounting practice while renegotiating covenants to
adjust for the change in GAAP. No Floating GAAP is an indicator variable that takes on the value of
one (zero) if Floating GAAP equals zero (one). CONTROLS is a vector of control variables listed in
equation (3) and described in Section 3.1. The coefficient of interest in equation (7) is β1, which
captures the relation between changes in GAAP and Investment for firms with Covenants. However, as
discussed previously, some loan agreements explicitly provide for a course of action in the event of a
change in GAAP, and hence are less likely to be affected by changes in GAAP. Therefore, I decompose
the interaction between Covenant and Cumulative Effect into two variables in equation (8), the first
capturing the interaction between Floating GAAP and Cumulative Effect (β1), and the second capturing
the interaction between No Floating GAAP and Cumulative Effect (β2). The coefficients of interest in
equation (8) are β1 and β2, which capture the relations between changes in GAAP and Investment for
firms with Covenants and Floating GAAP loan agreements, and Covenants and No Floating GAAP loan
agreements, respectively.
Table 9 reports the results from estimating equations (7) and (8). Panel A in Table 9 shows that
the coefficient for the interaction term between Covenant and Cumulative Effect is positive and
statistically significant at the 1% level for both the Capital Expenditure and R&D Expenditure regressions.
These results indicate that changes in GAAP have a significant impact on investment decisions in the
presence of financial covenants. Table 9, Panel A also shows that the coefficient for the interaction
between Floating GAAP and Cumulative Effect is positive and statistically significant at the 1% level
while the coefficient for the interaction between No Floating GAAP and Cumulative Effect is statistically
insignificant in the R&D Expenditure regression.31 Together these results suggest that accounting
31 Although the coefficient for the interaction between No Floating GAAP and Cumulative Effect is statistically significant in the Capital Expenditure regression, it is smaller in magnitude than that for the interaction between Floating GAAP and Cumulative Effect (albeit insignificantly).
28
changes have a significant impact on investment decisions in the presence of financial covenants and
the effect is more pronounced when loan agreements do not contain explicit provisions for adjusting
financial covenants after changes in GAAP.
To at least partially control for the information hypothesis, I re—estimate equations (7) and (8)
after replacing the industry indicator variables with indicator variables for each accounting standard to
control for their fixed effects. Columns (1) and (3) in Table 9, Panel B show that the coefficient for the
interaction between Covenant and Cumulative Effect is statistically insignificant. However, I find that the
coefficient for the interaction between Floating GAAP and Cumulative Effect is positive and statistically
significant at the 1% level. These results suggest that changes in GAAP affect investment decisions in
the presence of financial covenants only if loan agreements are based on Floating GAAP.
I also examine whether differences in the expected cost of renegotiating covenants affect the
relation between changes in GAAP and investment for firms with covenants. Firms with declining
performance are likely to find renegotiating the debt contract more costly because the decline in
performance makes their debt less valuable. Hence, such firms are likely to have greater incentives to
avoid covenant violation. On the other hand, firms whose performance has improved are likely to have
more control while renegotiating debt contracts because the improvement in performance is likely to
increase their bargaining power relative to the lenders. Consistent with the above prediction, I find
that the relation between changes in GAAP and investment for firms with covenants (and floating
GAAP contracts) is statistically significant only for firms whose earnings have declined (see Table 10).
Specifically, for firms with negative (positive) earnings growth, the coefficient for the interaction
between Floating GAAP and Cumulative Effect is 0.123 (0.028) in the Capital Expenditure regression; and
in the R&D Expenditure regression the corresponding coefficient for firms with negative (positive)
earnings growth is 0.079 (0.009). Table 10 Panel B shows that the difference between firms with
positive and negative earnings growth is even more pronounced when I replace industry fixed effects
with accounting standard fixed effects. Collectively, these findings suggest that use of accounting
numbers in contracts can cause changes in GAAP to affect managerial investment decisions, especially
when firm performance declines around the change in GAAP.
29
6. Identification and Endogeneity Concerns
Firms often have some choice in the method and timing of adopting changes in GAAP, which
could be correlated with their investment incentives leading to an endogeneity bias. A large literature
on ‘accounting choice’ shows that contracting and market incentives influence managers’ accounting
choices including the method and timing of adoption of new standards (see Fields et al. (2001) for a
review of the literature). Thus, when firms have a choice of whether to use the ‘catch up’ method to
adopt new accounting rules, this choice could be correlated with managerial incentives to invest. Even
when GAAP does not explicitly provide choice in the method of adopting new accounting rules, the
cumulative effect of an accounting change could be affected by managerial discretion. I address this
concern in the following ways. First, I control for accounting standard fixed effects in my statistical
tests. Including fixed effects for changes in GAAP allows me to capture just the portion of the relation
between accounting changes and investment decisions that is common to all changes in GAAP. Since
managerial incentives and the discretion allowed by a change in GAAP vary for each new
pronouncement, my inferences are less likely to be driven by un–modeled managerial incentives that
are idiosyncratic to a standard when I control for accounting standard fixed effects.
Second, I examine the robustness of my results to dropping firms that are early adopters of a
standard, including year fixed effects, and an indicator variable for early adopters. To the extent
incentives to adopt standards early are correlated with incentives to alter investment, my results could
be biased. However, I find that my results are unaffected in all of the above tests. Note that the
managerial incentives that drive accounting choices around changes in GAAP have to be correlated
with the incentives that influence managerial investment decisions to affect my tests. For example, the
incentives to report large positive cumulative effects need to be correlated with incentives to increase
capital expenditure and R&D to affect my tests. To the extent this is unlikely, my inferences are
unlikely to change due to any endogeneity bias.
Lastly, I examine whether the relation between the Cumulative Effect and both – Capital and R&D
Expenditure is robust to using an instrumental variables approach (i.e., Two–Stage–Least–Squares) with
the quintile rank of the Cumulative Effect serving as an instrument for the Cumulative Effect. This
30
approach to create an instrument assumes that managers have limited discretion to manipulate the
cumulative effect of an accounting change. Therefore, although the within quintile variation in the
Cumulative Effect might be susceptible to managerial choice and thus endogenous, the between quintile
variation in the Cumulative Effect is not subject to managerial choice (Hentschel and Kothari, 2001;
Frankel et al., 2006). I find that my results are robust to using the instrumental variables approach.
Notwithstanding the above arguments, I also note that only five of the major changes in GAAP in
my sample allowed choice in the method of adopting the standard, and in most cases, the managerial
incentives at play are likely to bias my tests towards the null hypothesis of no relation between changes
in GAAP and investment. For example, Beatty and Weber (2006) find evidence that contracting
incentives created by the presence of debt covenants cause firms to postpone goodwill impairments
rather than immediately book a below–the–line expense upon the adoption of SFAS 142 (Accounting
for Goodwill). Further, they show that firms with covenants record smaller cumulative effects relative
to firms without covenants. Their results suggest that firms with large negative (positive) cumulative
effects are less (more) likely to have private debt covenants to begin with, which biases my tests towards
the null of no relation between changes in GAAP and investment. However, to the extent the above
arguments do not address endogeneity or other concerns, my results could be affected.
Another potential identification concern arises because accounting changes are endogenously
determined by changes in the economic environment of the firm (Ball, 1980; Kothari et al., 2010).
Therefore, an alternative hypothesis is that changes in GAAP are the outcome of, or occur
simultaneously with changes in the firm’s investment opportunities, which causes a change in
investment. While such a hypothesis is plausible, I question its veracity for the following reason. For
my inferences to be affected by such endogeneity the magnitude and sign of the impact an accounting
change has on firms’ financial statements would also have to be correlated with changes in firms’
investing environments in the same direction. Further, this endogenous effect would have to persist
across the many different accounting changes in my sample. However, prior research suggests that the
factors leading up to each of these standards were significantly different from each other. For example,
Ramanna (2008) shows that SFAS 142 was issued in response to political pressure over the abolition of
31
pooling of interest accounting, Bens and Monahan (2008) suggest that FIN 46 was issued in response
to the Enron Scandal, SAB 101 was issued over concerns that firms manipulate revenue recognition to
manage earnings (Altamuro et al., 2005). Therefore, it is unlikely that the endogenous relation between
changes in GAAP and firms’ economic environments is the primary driver of my results.
7. Additional Analyses and Robustness Checks
7.1 Simultaneously Testing both Information and Contracting Hypotheses
To examine whether the relation between accounting changes and investment is dominated by
any one of the mechanisms, I isolate the effect of each mechanism by decomposing the Cumulative
Effect into four variables that capture different combinations of the two mechanisms. Specifically, I
decompose the Cumulative Effect into the following groups by interacting it with indicator variables for
the following: 1) firm—years with Covenants and Floating GAAP debt agreements adopting changes in
GAAP with Information; 2) firm—years with Covenants and Floating GAAP debt agreements adopting
changes in GAAP with No Information; 3) firm—years without any Covenants adopting changes in GAAP
with Information; and 4) firm—years without any Covenants adopting changes in GAAP with No
Information. Table 11 shows that the relation between changes in GAAP and Investment is restricted to
those standards that are likely to inform managers suggesting that the information hypothesis is the
primary reason for the relation between changes in GAAP and investment. The absence of evidence
for the contracting hypothesis in this test suggests that the use of accounting numbers in contracts is
not a major factor in determining managerial investment decisions for the average firm. Alternatively,
it is plausible that decomposing the Cumulative Effect into four parts leads to a far too refined
partitioning of the data, which results in this test having low power. My inferences are unchanged
when I control for standard fixed effects rather than industry fixed effects in this test (unreported).
7.2 The Tobit Model
I examine the robustness of my tests concerning R&D Expenditure to using alternative estimation
techniques besides the Tobit model. Investments in R&D are the outcome of economic choices made
by firms, and for some firms the optimal choice will be the corner solution (i.e., R&D Expenditure = 0).
32
When dealing with corner solution outcomes, some authors advise against using the Tobit model and
recommend explicitly modeling the outcome (e.g., Maddala, 1991; pg. 796), while others consider the
use of the Tobit model appropriate (e.g., Wooldridge, 2002; pg. 518). The former is based on the
argument that the standard Tobit model assumes, among other things, that the dependent variable is
censored at zero and can, in principle, take on negative values. Since R&D Expenditure cannot take on
negative values, Maddala’s (1991) argument suggests that the use of the Tobit model is inappropriate.
Wooldridge (2002) and Greene (2003), on the other hand, argue that the Tobit model lends itself to
both situations – when the dependent variable is censored and when there are corner solutions.
Therefore, I re–examine my hypotheses using two alternative specifications to the Tobit: 1) using OLS
on the observations not at the mass point (i.e. where R&D Expenditure > 0 in my case) and 2) explicitly
modeling the probability that R&D Expenditures is greater than zero and using a hurdle rate model (e.g.,
Cragg, 1971).32 I find that all hypotheses except H4 are robust to both specifications. The relation
between changes in GAAP and R&D Expenditure conditional on having financial covenants is sensitive
to specification choice. Further examination of the data reveals there are 1,281 observations with R&D
Expenditure greater than zero; of these, only 33 observations have financial covenants with floating
GAAP. Therefore, the alternative tests are essentially relying on just 33 observations to identify the
relation between changes in GAAP and investment. When I examine the relation between changes in
GAAP and R&D Expenditure using just these 33 observations, I find that the coefficient for the
Cumulative Effect is positive and has a one tailed p–value of 0.0625. However, I note that my results for
H4 are sensitive to the choice of estimation technique and suggest caution interpreting them.
Another criticism of the Tobit model is that it makes strong distributional assumptions (i.e., the
error term is conditional normal and homoskedasticity). Therefore, I also estimate my results using the
Conditional Least Absolute Deviation (CLAD) estimator (Powell, 1984).33 The CLAD estimator is a
generalization of the Least Absolute Deviations estimator, which is robust to heteroskedasticity and
makes fewer distributional assumptions. I find that my interferences are unchanged.
32 I measure the probability of that R&D Expenditures is greater than zero with an indicator variable for whether the firm invested in R&D in the previous year. I find that this model has high explanatory power due to the highly persistent nature of R&D. 33 The CLAD estimator is found by minimizing ∑|yi–max(0,xi
’β)|.
33
7.3 Accounting Standards Classification
I investigate whether my results for H2a and H2b (i.e., do accounting changes affect and improve
managerial investment decision by informing managers?) are sensitive to my classification of standards
into groups. I drop one standard at a time from each group in my sample and re—run my tests for H2a
using the following regression specifications: 1) industry fixed effects, 2) standard fixed effects, 3) using
ranks for the cumulative effect of an accounting change, and 4) using decile ranks for the cumulative
effect of an accounting change. All in all I estimate 92 regressions with each dependent variable (i.e.,
capital and R&D expenditure). I find that in 90 (86) of the 92 regressions with capital (R&D)
expenditure as the dependent variable the coefficient for the Cumulative Effect is positive and
statistically significant when the changes in GAAP are likely to inform managers (i.e., when Information
equals one). For the investment efficiency regressions (i.e., tests of H2b), I again drop one standard at a
time from my sample and re—run the regressions. I estimate 23 regressions for each of the four
dependent variables and find that in 86 of the 92 regressions the coefficient for the interaction
between Information and Unsigned Cumulative Effect is positive and statistically significant; all 92
coefficients are positive. The regressions suggest that the results documented in this paper are
reasonably robust to excluding individual changes in GAAP from the analysis.
7.4 Other Sensitivity Tests
Lastly, I document that my results are robust to the following tests: 1) using future investment to
examine the relation between change in GAAP and investment, 2) measuring the changes in GAAP
using ranks and decile ranks of the Cumulative Effect rather than using raw continuous values, 3)
controlling for year fixed effects, 4) controlling for year and industry fixed effects, and 5) controlling
for accounting standard and industry fixed effects. Although the statistical significance of the
regression coefficients drop when I simultaneously control for both industry and standard fixed effects,
and industry and year fixed effects, I find that the general tenor of my inferences are unchanged.
8. Conclusion
My main objective in this study is to investigate whether changes in financial accounting rules
affect managerial investment decisions and examine the mechanisms through which this economic
34
consequence manifests. Using a sample containing forty–nine changes in GAAP, I find robust
evidence that accounting changes affect investment decisions. Specifically, I show that changes in
accounting rules affect managerial investment in both physical and knowledge capital. In addition, I
propose a novel reason why changes in accounting rules might affect managerial investment; I argue
that accounting changes alter managers’ information sets, which affects the NPV estimates of their
investments and consequently the quantity and quality of their investment decisions. I provide
evidence consistent with my hypothesis.
I also examine whether changes in accounting rules affect managerial investment because
accounting numbers are used in contracts that do not fully accommodate changes in accounting rules
(Holthausen and Leftwich, 1983; Watts and Zimmerman, 1986). I show that firms with financial
covenants likely to be affected by accounting changes invest more (less) when the accounting change
increases (decreases) covenant slack; further, I find that this relation is stronger when firm performance
declines and renegotiation costs are likely to be high. This paper contributes to the literature on the
real effects of accounting by showing that financial accounting rules affect investment decisions and by
documenting specific mechanisms through which the relation manifests.
The findings in this paper might be of interest to managers and standard setters. Beatty (2007)
argues “that for some, changes in management seem like an obvious consequence of accounting
change, while for others the claims of behavioral changes are difficult, if not impossible, to prove.”
Beatty (2007) goes on to argue that there is even less consensus about the reasons for changes in
managerial behavior and whether such changes are welfare enhancing or not. This study provides
evidence that accounting changes do affect an important managerial decision and that some changes
can even improve the quality of managerial decisions. Whether standard setters should consider the
impact changes in GAAP have on economic behavior, and whether the improvement in managerial
investment decisions results in a net benefit after considering the costs of the accounting change is
beyond the scope of this paper. However, this study builds on our understanding of why accounting
changes affect managerial behavior and provides some evidence that they can be welfare enhancing
even when they do not improve financial reporting quality.
35
References Acharya, V., H. Almeida, and M. Campello, 2007, Is cash negative debt? A hedging perspective on
corporate financial policies, Journal of Financial Intermediation 16, 515-554. Adam, T., and V. Goyal, 2008. The investment opportunity set and its proxy variables. Journal of
Financial Research Spring, 41-63. Ai, C., and E. C. Norton. 2003. Interaction Terms in Logit and Probit Models. Economics Letters, 80(1):
12 3–29. Altamuro, J., A. Beatty, and J.P. Weber, 2005. The effects of accelerated revenue recognition on
earnings management and earnings informativeness: Evidence from SEC Staff Accounting Bulletin No. 101. The Accounting Review 80, 373-401.
Amir, E., 1993. The market valuation of accounting information: The case of postretirement benefits
other than pensions. The Accounting Review 68, 703–724. Armstrong C.S., W.R. Guay, and J.P. Weber. 2010. The Role of Information and Financial Reporting
In Corporate Governance and Debt Contracting. Journal of Accounting and Economics, forthcoming Ayers, B., 1998. Deferred tax accounting under SFAS No.109: An empirical investigation of its
incremental value-relevance relative to APB No.11.The Accounting Review 73, 195–212. Ball, R., 1980. Discussion of Accounting for Research and Development Costs: The Impact on
Research and Development Expenditures. Journal of Accounting Research 18 Supplement: 27–37. Ball, R., 2004. Corporate Governance and Financial Reporting at Daimler–Benz (Daimler Chrysler)
AG: From a ‘Stakeholder’ Toward a ‘Shareholder Value’ Model. The Economics and Politics of Accounting: International Perspectives on Research, Trends, Policy, and Practice, edited by A. Hopwood, C. Leuz, and D. Pfaff. Publisher Location: Oxford University Press, 103–43.
Balsam, S., I. Haw, and S.B. Lilien, 1995. Mandatory accounting changes and managerial discretion.
Journal of Accounting and Economics 20 (1), 3–29. Beatty, A., 1995. Fair value accounting: how fair is it? St. Louis Federal Review. Beatty, A., 2007. How does changing measurement change management behavior? A review of the
evidence. Accounting and Business Research Special Issue: International Accounting Policy Forum pp. 63–71.
Beatty, A., K. Ramesh, and J. Weber, 2002. The importance of accounting changes in debt contracts:
the cost of flexibility in covenant calculations. Journal of Accounting and Economics, 33(2):173–204. Beatty, A., and Weber, J., 2006. Accounting discretion in fair value estimates: an examination of SFAS
142 goodwill impairments. Journal of Accounting Research 44, 257–288.
36
Beaver, W., 1981. Financial Reporting: An Accounting Revolution, Englewood Cliffs, NJ: Prentice Hall. Bens, D. A. and S. J. Monahan. 2008. Altering investment decisions to manage financial reporting
outcomes: asset-backed commercial paper conduits and FIN 46. Journal of Accounting Research 46 (5):1017-1055.
Bens, D., V. Nagar, F. M.H. Wong, 2002. Real investment implications of employee stock option
exercises. Journal of Accounting Research 40, 359–393. Bhat, G., R. Frankel, and X. Martin, 2010. Panacea, Pandora’s Box, or Placebo: Feedback in Bank
Mortgage—based Security Holdings and Fair Value Accounting. Washington University working paper.
Biddle, G. and G. Hillary, 2006, Accounting quality and firm-level capital investment, The Accounting
Review 81, 963-982. Biddle, G., G. Hillary, and R. Verdi, 2009, How does financial reporting quality relate to investment
efficiency?, Journal of Accounting and Economics 48, 112-131. Brennan, M., 2003, Corporate investment policy. In G.M. Constantinides, M. Harris & R.M. Stulz,
eds., Corporate Finance, vol. 21, 1A of Handbook of the Economics of Finance, Elsevier, Amsterdam. Bushee, B. J. 1998, The influence of institutional investors on myopic R&D investment behavior. The
Accounting Review 73(3), 305–333. Bushman, R., Q. Chen, E. Engel., and A. Smith, 2004. Financial accounting information,
organizational complexity and corporate governance systems. Journal of Accounting and Economics 37, 167-201.
Cameron, A. C., J. B. Gelbach, and D. L. Miller, 2010, Robust inference with multi-way clustering.
Journal of Business & Economic Statistics. forthcoming Carey, M., and M. Hrycray, 1999, Credit flow, risk, and the role of private debt in capital structure,
Working paper, Federal Reserve Board. Chava, S. and M. Roberts, 2008. How does financing impact investment? The role of debt covenant
violations. Journal of Finance 63, 2085–2121. Choudhary, P., M. Venkatachalam, S. Rajgopal. 2009. Accelerated Vesting of Employee Stock Options
in Anticipation of FAS 123–R, Journal of Accounting Research 47(1): 105–146. Choudhary, P., 2010. Evidence on differences between recognition and disclosure: A comparison of
inputs to estimate fair values of employee stock options, Journal of Accounting and Economics, forthcoming.
37
Christensen, H.B., E. Lee, and M. Walker. 2009. Do IFRS reconciliations convey information? The effect of debt contracting. Journal of Accounting Research 47: 1167–1199
Christensen, H. B., and V. Nikolaev. 2009. Contracting on Mandatory Changes to GAAP: New
Practice and its Determinants. University of Chicago working paper. Cohen, D. A., R. Mashruwala, and T. Zach. 2009. The Use of Advertising Activities to Meet Earnings
Benchmarks: Evidence from Monthly Data. Review of Accounting Studies, Forthcoming. Collins, D. W., M. S. Rozeff and D. S. Dhaliwal, 1981, A cross-sectional analysis of the economic
determinants of market reaction to proposed mandatory accounting changes in the oil and gas industry, Journal of Accounting and Economics, March, 37-72.
Cragg, J.G., 1971. Some statistical models for limited dependent variables with applications to the
demand for durable goods. Econometrica 39, pp. 829–844. Dechow, P., and I. Dichev. 2002. The quality of accruals and earnings: The role of accrual estimation
errors. The Accounting Review 77 (Supplement): 35–59. Dechow, P., and D. Skinner, 2000. Earnings management: reconciling the views of accounting
academics, practitioners, and regulators. Accounting Horizons 14 (2), 235–250. Dechow, P., and R. Sloan, 1991. Executive incentives and the horizon problem: an empirical
investigation. Journal of Accounting and Economics 14, 51–89. Dichev, I. D., and D. Skinner, 2002, Large sample evidence on the debt covenant hypothesis, Journal of
Accounting Research 40, 1091–1123. Drury, C., and M. Tayles. 1997., Evidence on the Financial Accounting Mentality Debate: A Research
Note. British Accounting Review 29: 263–76. Durnev, A., and C. Mangen, 2009, Corporate investments: Learning from restatements, Journal of
Accounting Research 47, 679–720. Financial Accounting Standards Board (FASB). 1978. Statement of Financial Accounting Concepts No. 1:
Objectives of Financial Reporting by Business Enterprises. http://www.fasb.org/pdf/aop_CON1.pdf Financial Accounting Standards Board (FASB). 1990. Statement of Financial Accounting Standards
No. 106 Employers’ Accounting for Postretirement Benefits Other Than Pensions. http://www.fasb.org/pdf/fas106.pdf
Variable Interest Entities – an interpretation of ARB No. 51.. http://www.fasb.org/pdf/fin%2046.pdf
38
Financial Accounting Standards Board (FASB). 2005. Statement of Financial Accounting Standards No. 154 Accounting Changes and Error Corrections a replacement of APB Opinion No. 20 and FASB Statement No. 3. http://www.fasb.org/pdf/aop_FAS154.pdf
Fazzari, S. M., R. G. Hubbard, and B. C. Petersen, 1988. Financing Constraints and Corporate
Investment. Brookings Papers Econ. Activity, no. 1, pp. 141–95. Fields, T., T. Lys, L. Vincent, 2001. Empirical research on accounting choice. Journal of Accounting and
Economics 31, 255-308. Frankel, R.M., S.P. Kothari, and J.P. Weber, 2006. Determinants of the informativeness of analyst
research. Journal of Accounting and Economics 41, 29–54. Gaver, J.J. and K.M. Gaver, 1998. The relation between nonrecurring accounting transactions and
CEO cash compensation. The Accounting Review 73 (2), 235–253. Gow, I.D., G. Ormazabal., D.J. Taylor. 2010. Correcting for cross-sectional and time-series dependence
in accounting research. The Accounting Review 85, 483–512. Graham, J. R., and C. Harvey, 2001. The theory and practice of corporate finance: evidence from the
field. Journal of Financial Economics 60, 187–243. Graham, J. R., C. Harvey, and S. Rajgopal, 2005, The economic implications of corporate financial
reporting, Journal of Accounting and Economics 40, 3–73. Graham, J., M. Hanlon, and T. Shevlin., 2010. Real Effects of Accounting Rules: Evidence from
Multinational Firms' Investment Location and Profit Repatriation Decisions. Journal of Accounting Research, forthcoming.
Greene W., 2003. Econometric Analysis. Englewood Cliffs, NJ: Prentice-Hall. Healy, P. M., and J. M. Wahlen. 1999. A review of the earnings management literature and its
implications for standard setting. Accounting Horizons 13: 365–383. Hemmer, T. and E. Labro., 2008. On the Optimal Relation between the Properties of Managerial and
Financial Reporting Systems. Journal of Accounting Research, 46, 1209–1240. Hentschel, L. and S.P. Kothari, 2001. Are corporations reducing or taking risks with derivatives?
Journal of Financial and Quantitative Analysis 36, 93–118. Hodder, L., M. Kohlbeck, and M.L. McAnally. 2002. Accounting Choices and Risk Management:
SFAS 115 and U.S. Bank Holding Companies. Contemporary Accounting Research 19: 225– 270 Holthausen, R. and R. Leftwich, 1983. The economic consequences of accounting choice: implications
of costly contracting and monitoring. Journal of Accounting and Economics 5, 77–117.
39
Hopper, T., L. Kirkham, R. W. Scapens, and S. Turley., 1992. Does Financial Accounting Dominate Management Accounting? A Research Note. Management Accounting Research 307–11.
Hoshi, T., A. Kashyap, and D. Scharfstein. 1991. Corporate structure, liquidity and investment:
Evidence from Japanese industrial groups. The Quarterly Journal of Economics 106 (1): 33–60. Imhoff, E. and J. Thomas, 1988. Economic consequences of accounting standards: the lease disclosure
rule change. Journal of Accounting and Economics 10, 277–310. Jackson, S.B., X. Liu, and M. Cecchini. 2009. Economic consequences of firms’ depreciation method
choice: Evidence from capital investments. Journal of Accounting and Economics 48, 54–68. Johnson, H. T., and R. S. Kaplan. 1987. Relevance Lost: Rise and Fall of Management Accounting. Boston,
MA: Harvard Business School Press. Kahan, M. and B. Tuckman, 1993. Private vs. public lending: Evidence from covenants, Working
paper, Anderson Graduate School of Management, UCLA. Kanodia, C. 2007. Accounting disclosure and real effects, Foundations and Trends in Accounting, Now
Publishers Inc. ISBN 978-1-60198-062-5, vol. 1, no. 3, pp. ix, 95. Kaplan R. S., 1984. The Evolution of Management Accounting. The Accounting Review, 59, 390–418. Kothari, S.P., K. Ramanna, and D. Skinner, 2010, Implications for GAAP from an Analysis of Positive
Research in Accounting. Journal of Accounting and Economics, forthcoming. Lee, L. 2010. Incentives to inflate reported cash from operations using classification and timing.
Working paper, Boston College. Leftwich, R., 1981, Evidence on the impact of mandatory changes in accounting principles in
corporate loan agreements, Journal of Accounting and Economics 3, 3–36. Lys, T., 1984. Mandated accounting changes and debt covenants: the case of oil and gas accounting.
Journal of Accounting and Economics 9, 39–66. Maddala, G.S., 1991. A perspective on the use of limited–dependent variables models in accounting
research. The Accounting Review 66 (4), 788–807. Marquardt, C. and C. Wiedman 2007. Economic consequences of financial reporting changes: diluted
EPS and contingent convertible securities. Review of Accounting Studies 12: 487–523. McNichols, M. 2002. Discussion of the Quality of Accruals and Earnings: The Role of Accrual
Estimation Errors. The Accounting Review 77 (Supplement): 61-69. McNichols, M., and S. Stubben, 2008. Does earnings management affect firms’ investment decisions?
The Accounting Review 83 (6), 1571–1603.
40
Miller, G., and D. Skinner, 1998. Determinants of the valuation allowance for deferred tax assets
under SFAS No. 109. The Accounting Review 73, 213–233. Mittelstaedt, F., W. Nichols, and P. Regier, 1995. SFAS No. 106 and benefit reductions in employer–
sponsored retiree health care plans. The Accounting Review 70 (4),535–556. Mohrman, M.B., 1996. The use of fixed GAAP provisions in debt contracts. Accounting Horizons,
10:78–91. Murphy, K.J., and J.L. Zimmerman, 1993. Financial performance surrounding CEO turnover. Journal
of Accounting and Economics 16 (1/2/3), 273–315. Nini, G., D. Smith, and A. Sufi, 2009, Creditor control rights and firm investment policy, Journal of
Financial Economics 93, 159–184. Petersen, M. A., 2009, Estimating standard errors in finance panel data sets: Comparing approaches,
Review of Financial Studies 22, 435–480. Plantin, G., H. Sapra, and H.S. Shin, 2008. Marking—to—Market: Panacea or Pandora’s box? Journal of
Accounting Research 46 (2), 435—460. Powell, J.L., 1984. Least absolute deviations estimation for the censored regression model. Journal of
Econometrics 25, pp. 303–325. Ramanna, K., 2008. The implications of unverifiable fair-value accounting: Evidence from the political
economy of goodwill accounting. Journal of Accounting and Economics 45: 253-281. Ramanna, K., and R. Watts, 2010. Evidence from goodwill non-impairments on the effects of using
unverifiable estimates in financial reporting. Working Paper, Harvard Business School. Revsine, L., D. Collins, and W. B. Johnson. 1999. Financial Reporting and Analysis. Upper Saddle River,
NJ: Prentice Hall. Richardson, S., 2006, Over-investment of free cash flow. Review of Accounting Studies 11, 159–189. Roychowdhury, S. 2006, Earnings management through real activities manipulation. Journal of
Accounting and Economics 42(3), 335–370. Sapra, H., 2010. The Economic Trade–offs in the Fair Value Debate. Journal of Law, Economics, and
101. Washington, D.C.: Government Printing Office.
41
Simon, H. A., 1973. Applying Information Technology to Organization Design. Public Administration Review, 106, 467-482.
Sims, C., 2003. Implications of Rational Inattention. Journal of Monetary Economics 50(3), 665–90. Singh, L., 2001. Profiting from health-care cuts? CFO: Magazine for Senior Financial Executives. Smith, C., and J. Warner, 1979. On financial contracting: an analysis of bond covenants. Journal of
Financial Economics 7, 117–161. Sweeney, A. P., 1994, Debt covenant violations and managers’ accounting responses, Journal of
Accounting and Economics 17, 281–308. Tirole, J. 2006. The Theory of Corporate Finance. Princeton, NJ: Princeton University Press. Tobin, J. 1958. Estimation of Relationships for Limited Dependent Variables, Econometrica 26, 24-36. Verde, M., 1999. Loan preserve: The value of covenants, Fitch IBCA loan products special report,
available at www.fitchibca.com Watts, R.L. and J.L. Zimmerman, 1986, Positive accounting theory (Prentice Hall: Englewood Cliffs, NJ). Whited, T. M., 2006, External finance constraints and the intertemporal pattern of intermittent
investment, Journal of Financial Economics 81, 467-502. Wooldridge, J., 2002. Econometric Analysis of Cross Section and Panel Data. Cambridge, MA: MIT Press. Wurgler, J., 2000, Financial markets and the allocation of capital, Journal of Financial Economics 58, 187-
214. Zhang, J. 2009. Economic consequences of recognizing off-balance sheet activities. Working Paper. Zimmerman, J. L., 2009. Accounting for decision making and control (6th ed.). Irwin /McGraw Hill
Publishing Company, New York, NY.
42
Appendix A Identifying Changes in GAAP that are likely to inform Managers
Hypotheses 2a and 2b predict that some accounting changes can inform managers and facilitate their investment decisions. A crucial component of this test is identifying which changes in GAAP are more or less likely to inform managers. I discuss my identification choices for the thirteen standards that were adopted by at least 25 firms in my sample. Collectively, these thirteen standards comprise more than 95% of my sample. To identify standards more likely to inform managers, I examine whether the change in GAAP increased the amount of accrual accounting estimates and judgment that managers are required to make and I examine whether compliance with the standard is likely to require the services of an outside expert (e.g., actuary or appraiser). Managers require information to arrive at reasonable estimates of the numbers reported in public financial statements. Therefore, standards that increase the amount of judgment and estimation managers are required to make are more likely than others to require additional information collection and to inform managers.34
Reporting Rule Classification Discussion of the Accounting Standard Classification Choices
SFAS No. 106: Accounting for post retirement benefits
other than pensions Informative
SFAS 106 establishes accounting standards for employers’ accounting for postretirement benefits other than pensions. Prior to SFAS 106 accounting for postretirement benefits was primarily accounted for on a pay–as–you–go (cash) basis. SFAS 106 required firms to accrue the expected cost of providing future benefits to an employee over the years that the employee renders service. The change required firms to compute the expected duration for which an employee will serve the company, the future cost of providing promised benefits, the expected life of the employee postretirement, etc.35 These calculations likely provided managers with richer and more accurate information about the cost of promised benefits and more generally, the cost of an employee’s service. Any re–evaluation of employee costs is likely to have factored into investment decisions as it directly affects the net present value of the investment. Anecdotal evidence supports the argument managers hired outside experts and learned new information about the cost of post–retirement benefits. For example, a Business Week article entitled “First Thing We Do is Kill the Accountants” quotes FASB project manager Diana J. Scott, “[w]e are absolutely appalled. They [employers] honestly weren’t measuring this. In some cases they didn’t even know whom they were covering as dependents. Employers are finding they promised much more than they can give” (September 12, 1988, pg. 4).
SFAS No. 109: Accounting for income taxes
Informative
SFAS 109 required firms to recognize deferred tax liabilities (assets) for all taxable (deductible) temporary differences (and operating loss and tax credit carryforwards). Further, based on the available evidence, deferred tax assets should be reduced by a valuation allowance to amounts more likely than not to be realized in future tax returns. The realization of deferred tax assets depends primarily on the existence of sufficient taxable income of appropriate character. Such taxable income is generated from 1) reversal of existing taxable temporary differences, 2) any future taxable income exclusive of reversing temporary differences, 3) taxable income in carry back years, and 4) tax–planning strategies (see Miller and Skinner, 1998). Considering future economic events in assessing the likelihood of realizing the deferred tax asset is a unique provision of SFAS 109 and Ayers (1998) shows that this information is value–relevant to investors. The information necessary to estimate future tax consequences of current transactions could potentially provide managers with better estimates of marginal tax rates and hence, affect investment decisions.
34 I validate my classification procedure for changes in GAAP using a returns based test described in Section 3.4. 35 Amir (1993) shows that investors underestimated the full consequences of post retirement benefits promised by firms prior to the introduction of SFAS 106. He goes on to shows that disclosures required by SFAS 106 are value–relevant and they help investors compute a more accurate value of the cost of post retirement benefits.
43
SFAS No. 112: Accounting for post employment benefits
Informative
SFAS 112 establishes accounting standards for employers who provide benefits to former or inactive employees after employment but before retirement. This statement requires firms to recognize of the cost of postemployment benefits on an accrual basis (when it can be reasonably estimated). Prior to this Statement, employers’ accounting for the cost of postemployment benefits varied. Some employers accrued the estimated cost of those benefits over the related service periods of active employees, and other employers recognized the cost of postemployment benefits when they were paid (cash basis). Employers using the cash basis of accounting for post employment benefits likely required more information to obtain reasonable accrual estimates. Hence, this statement potentially created information for firms who used the cash basis of accounting for post employment benefits.36 The arguments parallel that for SFAS 106.
SFAS No. 115: Accounting for certain investments in
Debt and Equity Securities Not Informative
SFAS 115 addresses the accounting for investments in equity securities that have readily determinable fair values and for all investments in debt securities. This standard did not require the collection of any new information; rather, it required firms to classify securities into three groups – held–to–maturity, available–for–sale, and trading securities – depending on the intent of purchase.
EITF 97–13: Accounting for Consulting Contracts,
Business Process Reengineering & IT
Transformation
Not Informative
EITF 97–13 concerns accounting for costs incurred in connection with a consulting contract or an internal project that combines business process reengineering and information technology transformation. Prior to this rule, the reporting practices of various firms were mixed. Some firms capitalized the cost associated with business process reengineering while other firms expensed them. This accounting change required firms to expense the cost of business process reengineering activities as incurred. Since expensing the cost of an activity is unlikely to require information collection. Rather, in most cases, expensing an item that was previously capitalized simply amounts to removing the item from the balance sheet and including it in the income statement. Hence, the adoption of this rule is unlikely to generate decision facilitating information for managers.
SOP 98–5: Reporting on the Costs of Start-Up
Activities Not Informative
Prior to SOP 98–5 some companies were expensing start–up costs while other companies were capitalizing them, using a variety of periods over which to amortize the costs. The disparate treatment of these costs diminished the comparability of companies' financial statements. This standard sought to bring uniformity to the treatment of start–up and organization costs by dictating that these costs be expensed as incurred. Similar to reasoning discussed for EITF 97–13, expensing such costs is unlikely to provide managers with information to facilitate investment.
SAB 101: Revenue Recognition in Financial
Statements Not Informative
This statement required that revenue should not be recognized until it is realized or realizable and earned. For revenue to be realized or realizable and earned there should be persuasive evidence that an arrangement exists, delivery should have occurred or services should be rendered, the seller’s price to the buyer should be fixed or determinable, and collectability should be reasonably assured. The primary result of this statement was to postpone revenue recognition until a higher verifiability threshold had been met. Since managers are less likely to gain knowledge about the cash flow stream from a higher verifiability threshold, this standard is less likely to provide managers with new information. In fact, Altamuro et al. (2005) find that the association between earnings and future cash flows and, between unexpected earnings and earnings announcement period returns declined after the adoption of SAB 101 suggesting that there might have been a loss in earnings informativeness.
36 Firms already using the accrual basis of accounting for post employment benefits are likely to have smaller transition obligations from adopting this standard. Since I use the transition obligation to measure the impact of a standard on the firm, the fact that some firms already used the accrual method is unlikely to be a cause for concern.
44
SFAS No. 133/138: Accounting for Derivative Instruments and Hedging
Activities
Not Informative
This statement requires that an entity recognize all derivatives as either assets or liabilities in the statement of financial position and measure those instruments at fair value. If certain conditions are met, a derivative may be specifically designated as a hedge. When an entity applies hedge accounting, changes in the fair value of the derivative instrument can be offset with changes in the fair value of the asset/liability being hedged. Before the issuance of this Statement, many derivatives were “off–balance–sheet” because, unlike conventional financial instruments such as stocks and bonds, derivatives often reflect at their inception only a mutual exchange of promises with little or no transfer of tangible consideration. Although SFAS 133 and 138 substantially changed accounting for derivatives, I do not expect this rule change to provide managers with new information. First, derivative instruments often have readily available market prices that are used to determine the value of the derivative assets or liabilities and do not require managers to make any estimates. Further, choosing the appropriate derivative instrument, whether for speculation or for hedging, requires reasonable prior understanding of the associated risks and payoffs. Recognizing derivatives on financial statements is unlikely to change a manager’s ability to assess the risks and payoffs from investing in derivative instruments.
SFAS No. 142: Goodwill and Other Intangible Assets
Informative
This standard addresses accounting for acquired goodwill and other intangible assets. Prior to this standard goodwill and other intangibles were amortized over an arbitrary period with an arbitrary ceiling of 40 years even if the asset had an indefinite life. This standard required firms to do away with amortization of assets with indefinite lives and conduct impairment tests at least annually. Impairment tests require firms to compare the book value of net assets to the fair value of the related operations. To get a reasonable estimate of the fair value, firms are likely to need information about the expected future cash flows generated from the assets and the risk associated with those expected cash flows (as outlined in Statement of Financial Accounting Concepts 7, Using Cash Flow Information and Present Value in Accounting). Such an activity has the potential for providing managers with new information useful for evaluating investment decisions. Although number of studies show that managers use the discretion allowed by SFAS 142 opportunistically (e.g., Ramanna and Watts (2010), such behavior is not indicative of whether the internal estimates of the value of goodwill used by managers improved or worsened. To the extent manager fear litigation risk, they are more likely to back their estimates of the value of goodwill with more information after the adoption of SFAS 142 than before, even if they do not disclose the information in financial statements. Further, anecdotal evidence suggests that firms often hired appraisers to conduct impairment tests and comply with this standard.
SFAS No. 143: Accounting for Asset Retirement
Obligations Informative
SFAS 143 established accounting standards for the recognition and measurement of obligations attributable to the removal of assets as well as to their associated restoration costs. Since the obligation must be recorded at fair value and an active market for these obligations generally does not exist, the company must use the expected present value technique outlined in Statement of Financial Accounting Concepts 7, Using Cash Flow Information and Present Value in Accounting, which results in measuring the asset’s and related liability’s present value by using each company’s credit-adjusted rate. Inherent in the calculation of the obligation and its related asset cost are numerous assumptions and judgments, including the estimated life of the property to be retired, settlement amounts, inflation factors, credit–adjusted discount rates, timing of settlement, and changes in the legal, regulatory, and environmental landscapes. These assumptions and judgments require the assimilation of information that likely also helps firms re–evaluate investment decisions. And anecdotal evidence indicates that compliance with this standard likely requires the help of outside experts.
45
FIN 47: Accounting for Conditional Asset
Retirement Obligations Informative
This Interpretation clarifies the term conditional asset retirement obligation as used in SFAS 143. Many companies concluded that SFAS 143 did not apply to “conditional” Asset Retirement Obligations (AROs). “Conditional” is defined by the FASB as “the legal obligation to perform an asset retirement activity in which the timing and/or method of settlement is conditioned on a future event that may not be in the control of the entity.” FIN 47 was promulgated to clarify the term “conditional,” as used in SFAS 143. FIN 47 makes it clear that if a company has sufficient information to reasonably estimate the fair value of an ARO, it must so recognize at the time the liability is incurred, even if the timing for the retirement of the asset remains uncertain. For example, if a building is purchased by an entity that eventually must meet certain environmental cleanup regulations the entity must record those cleanup costs when the asset is acquired and as soon as the costs for cleanup may be estimated. Effectively, FIN 47 requires that companies disaggregate their environmental liabilities by placing these liabilities on the balance sheet before they become certainties, so shareholders can get a better sense of the company’s value. According to FIN 47, an asset is reasonably estimable if: (1) it is evident that the fair value of the obligation is embodied in the acquisition price of the asset; (2) an active market exists for the transfer of the obligation; or (3) sufficient information exists to apply an expected present value technique. There is “sufficient information” available to reasonably estimate the cost of an ARO when a settlement date is known or the date or method of settlement is reasonably estimable. If there is not sufficient information available, an ARO is not recognized, but the entity still must submit a report with its financial statement detailing why there is not sufficient information available. Given the amount of judgment and estimation required by this pronouncement, I classify this interpretation as providing information. In essence this statement expanded the scope of SFAS 143, and the arguments for why this statement might be informative to managers parallel those of SFAS 143.
FIN 46/46r: Consolidation of variable interest entities
Not Informative
Accounting Research Bulletin (ARB) 51 – Consolidated Financial Statements – requires that an enterprise’s consolidated financial statements include subsidiaries in which the enterprise has a controlling financial interest. That requirement usually has been applied to subsidiaries in which an enterprise has a majority voting interest, but in many circumstances the enterprise’s consolidated financial statements do not include variable interest entities with which it has similar relationships. This statement was issued because the voting interest approach is not effective in identifying controlling financial interests in entities that are not controllable through voting interests or in which the equity investors do not bear the residual economic risks. This statement spells out the conditions under which an entity should be consolidated. Since the specific criteria to consolidate do not require extensive information collection, managerial judgments, or estimates, I do not expect this standard to inform manager about investment.
SFAS No. 123r: Share–based payment (revised)
Not Informative
This Statement requires a public entity to measure the cost of employee services received in exchange for an award of equity instruments based on the grant-date fair value of the award (with limited exceptions). That cost is recognized over the period during which an employee is required to provide service in exchange for the award—the requisite service period (usually the vesting period). This Statement eliminates the alternative to use Opinion 25’s intrinsic value method of accounting that was provided in Statement 123 as originally issued. Under Opinion 25, issuing stock options to employees generally resulted in recognition of no compensation cost. Since SFAS 123 already required firms to disclose the fair value of equity based compensation, implementation of SFAS 123r is unlikely to provide managers with information to facilitate investment decisions. Choudhary (2010) argues that the manner in which fair value estimates of stock option expense are computed under SFAS 123 and SFAS 123r are very similar. Specifically she states that, “[t]he valuation method of fair value (Black Scholes) is applied consistently across both regimes...”
46
Appendix B Variable Definitions
Variable Name
Cumulative Effect
Capital Expenditure
R&D Expenditure
Tobin's Q
Growth
Ln(Age)
Ln(Market Value of Equity)
CFO
Cash
Leverage
Stock Returns
Information/No Information
Organizational Complexity Index
Δ Institutional Ownership
Δ Number of Analysts
The sum of the square of firm sales in each business segment divided by the square of total sales multiplied by minus one. Segment data areobtained from the Compustat Business Industry Segment file. Firms missing from the segment file are assumed to be single segment firms (i.e.,the complexity index is coded to -1).
Variable Definitions with Compustat or CRSP codes in paranthesis
Cash (CHE) is cash and all securities readily transferable to cash, deflated by average assets in period t and t–1.
Information is an indicator variable that takes on the value of one for observations in which the firm adopted an accounting standard that islikely to inform managers about current or future investment opportunities. It takes on the value of zero otherwise. The accounting standardsclassification is described in Appendix A. No Information is an indicator variable that takes on the value of one (zero) if Information equals zero(one).
Leverage is sum of short term debt (DLC) and long term debt (DLTT), deflated by average assets in period t and t–1.
Stock Returns (RET) in the total returns from investing in the stock of a company from period t–1 to period t.
The change in the number of analysts (NUMEST) following the firm as provided by IBES after the change in GAAP (i.e., change from t-1 tot). Analyst following is assumed to be zero if the firm is not covered by IBES.
The change in the percentage of firms' shares held by institutional investors after the change in GAAP (i.e., change from t-1 to t). InstitutionalOwnership is assumed to be zero if the data are missing. Ownership data are obtained from the Thomson-Reuter’s Institutional Holdings (13F)Database.
Growth is the change in total assets (AT) from period t–1 to period t scaled by total assets (AT) in period t–1.
Ln(Age) is the natural logarithm of the difference between the first year the firm enters Compustat and the current year.
Ln(Market Value of Equity) is the natural logarithm of the stock price (PRCC_F) times the number of shares outstanding (CSHO) measured atthe end of the fiscal year.
CFO (OANCF) is cash flows from operations reported in the statement of cash flows, deflated by average assets in period t and t–1.
Cumulative Effect (ACCHG) is the cumulative effect of an accounting change as reported in the income statement, deflated by average assets inperiod t and t–1. It represents effect of company adjustments due to accounting changes on prior period earnings.
Capital Expenditure (CAPX) is the cash outflow or the funds used for additions to the company's property, plant and equipment, excludingamounts arising from acquisitions, reported in the Statement of Cash Flows, deflated by average assets in period t and t–1.
R&D Expenditure (XRD) is the cost incurred during the year that relate to the development of new products or services, deflated by averageassets in period t and t–1. R&D Expenditure is coded to zero if it is missing.
Tobin’s Q is measured as the sum of market value of equity (PRCC_F x CSHO), short term debt (DLC) and long term debt (DLTT) divided bytotal assets (AT).
47
Appendix B Variable Definitions (continued)
Variable Name
Δ Financial Reporting Quality
Δ Capital Expenditure (Total Investment) Efficiency - Sales Growth
Δ Capital Expenditure (Total Investment) Efficiency - Q
Deal Scan
Covenant/No Covenant
Contracts with Fixed GAAP
Contracts with Hybrid GAAP
Contracts with Floating GAAP
Disclose Reconciliation
Floating GAAP/ No Floating GAAP
Deal Scan is an indicator variable that takes on the value of one (zero) if the firm has (does not have) data available in the Dealscan database foryear t.
Covenant is an indicator variable that takes on the value of one (zero) if the observation has (does not have) at least one financial covenant thatis likely to be affected by the cumulative effect of an accounting change. No Covenant is an indicator variable that takes on the value of one(zero) if Covenant equals zero (one).
Contracts with Fixed GAAP is an indicator variable that takes on the value of one (zero) if the debt contract is based on Fixed GAAP. The FixedGAAP practice excludes all changes to GAAP including mandatory accounting changes once the debt contract is signed.
Contracts with Hybrid GAAP is an indicator variable that takes on the value of one (zero) if the debt contract is based on Hybrid GAAP. TheHybrid GAAP gives lenders and borrowers a mutual option to freeze GAAP at any point in time.
Contracts with Floating GAAP is an indicator variable that takes on the value of one (zero) if the debt contract is based on Floating GAAP. TheFloating GAAP practice uses the most up-to-date version of GAAP to determine compliance with the terms of the contract.
Floating GAAP is an indicator variable that takes on the value of one if the debt agreement uses the Floating GAAP practice or requires thefirm to disclose reconciliations between the old and new accounting practice while renegotiating covenants to adjust for the change in GAAP.No Floating GAAP is an indicator variable that takes on the value of one (zero) if Floating GAAP equals zero (one).
Variable Definitions
The change in the Dechow and Dichev (2002) measure of reporting quality with the McNichols (2002) suggested modification, around thechange in GAAP. Specifically, I estimate a regression of current accruals on past, current, and future cash flows, the change in sales, and grossPP&E for each industry/year pool using all firms in Compustat and the Fama-French 30 industry classification scheme. The absolute value ofthe residual multiplied by minus one is my measure of reporting quality (for each firm-year). Since the Dechow-Dichev measure uses past andfuture cash flow data, I compute the change in reporting quality as reporting quality in period t+1 minus reporting quality in period t-Missing observations are assumed to have no change in reporting quality. However, my inferences are unchanged without this assumption.
Capital Expenditure (Total Investment) efficiency is the change in the absolute value of the residuals from a regression of capital expenditure(capital + R&D expenditure) in period t on sales growth in period t-1. The regression is estimated for each industry/year pool using all firms inCompustat and the Fama-French 30 industry classification scheme. The change in efficiency is the difference between the residual in periodt+1 and t-1; period t is the year of the accounting change. I multiply the measure by minus one so that a larger number indicates more efficientinvestment.
Capital Expenditure (Total Investment) efficiency is the change in the absolute value of the residuals from a regression of capital expenditure(capital + R&D expenditure) in period t on Tobin's Q in period t-1 and cash flows in period t. The regression is estimated for eachindustry/year pool using all firms in Compustat and the Fama-French 30 industry classification scheme. The change in efficiency is thedifference between the residual in period t+1 and t-1; period t is the year of the accounting change. I multiply the measure by minus one sothat a larger number indicates more efficient investment.
Disclose Reconciliation is an indicator variable that equals one (zero) if the debt contract requires the firm to reconcile and disclose differences infinancial ratios after changes in GAAP while renegotiating covenants.
48
Table 1 Sample Selection
No Obs. Dropped Obs. Remaining
--- 5,530
Less: Observations missing data to compute average assets 289 5,241Less: Regulated & financial firms (SIC's in the 4000's and 6000's) 1,338 3,903Less: Observations missing data to compute investment 110 3,793Less: Observations missing data to compute independent variables 320 3,473
Less:Observations missing 10K's or the cumulative effect of an accounting change the in 10K
447 3,026
Less:Observations where the cumulative effect of an accounting change in the 10K does not match that in Compustat
14 3,012
Voluntary Accounting Changes 217Mandatory Changes in GAAP 2,795
Less:Observations with covenants but missing debt contracts (which are needed to collect information about the type of GAAP i.e., fixed, floating, or hybrid)
281 2,514
Final Sample for analyses which use covenant data 2,514
Details
Observations in the intersection of CRSP and Compustat with fiscal years greater than 1990 and with non - zero values for the cumulative effect of an account change
Final Sample:
Notes: This table reports the observation selection process and the number of firm–year observations used in my empirical analysis.
49
Table 2 Descriptives details of the changes in GAAP, years of adoption, and method of adoption
Panel A – Descriptive details classified by the Major Changes in GAAP in my sample Standard Groups
Title InformationNumber of Obs.
Primary Years of Adoption
Mandatory Adoption DateMethod of
ImplementationMean Cum.
EffectEITF 18 different EITF's 0 78 -- -- -- -0.0199EITF 97-13 Accounting for Reengineering Costs 0 48 1997 - 1998 fiscal period containing Nov. 20, 1997 Catch Up -0.0044
FIN 44Accounting for Certain Transactions involving Stock Compensation
0 3 2000 July, 2000 Prospective and Catch Up 0.0341
FIN 46/46r Consolidation of Variable Interest Entities 0 51 2003 - 2004 first reporting period ending after March (Dec) 15, 2004
Catch Up or Retroactive Catch Up
-0.0046
FIN 47Accounting for Conditional Asset Retirement Obligations
1 87 2005 - 2006 fiscal years ending after Dec. 15, 2005 Catch Up -0.0011
Other Include FTB 90.1 and Practice Bulltin 13 0 3 1991, 1995 -- -- -0.0412SAB 92 Environmental Liabilities 0 1 1993 June, 1993 -- -0.0046SAB 101 Revenue Recognition 0 235 2000 - 2001 fiscal years beginning after 1999 Q1 Catch Up -0.0403
SFAS 106 Post Retirement Benefits 1 414 1992 - 1993 fiscal years beginning after Dec. 15, 1992Catch Up or Delayed recognition in NI
-0.0383
SFAS 109 Income Taxes 1 543 1992 - 1994 fiscal years beginning after Dec. 15, 1992 Catch Up 0.0090SFAS 112 Post Employment Benefits 1 96 1993 - 1995 fiscal years beginning after Dec. 15, 1993 Catch Up -0.0053
SFAS 115Accounting for Certain Investments in Debt and Equity Securities
0 27 1994 - 1995 fiscal years beginning after Dec. 15, 1993 Catch Up 0.0101
SFAS 121 Impairment of Long-Lived Assets 1 11 1995 - 1996 fiscal years beginning after Dec. 15, 1995 Catch Up -0.0006
SFAS 123r Expensing of Stock Options 0 112 2006 - 2007 first reporting period beginning after June (Dec) 15, 2005
Modified Prospective & Retrospective, Catch Up
0.0004
SFAS 133/138 Derivatives and Hedges accounting 0 141 2001 - 2002 fiscal years beginning after June 15, 2000Catch Up through NI or OCI
-0.0019
SFAS 141 Business Combinations 0 3 2002 combinations initiated after June 30, 2001 Catch Up 0.0076SFAS 142 Accounting for Goodwill 1 543 2002 - 2003 fiscal years beginning after March 15, 2001 Catch Up -0.0856SFAS 143 Asset Retirement Obligation 1 173 2003 fiscal years beginning after June 15, 2002 Catch Up -0.0007
SFAS 150Accounting for Instruments with Characteristics of Liabilities & Equity
0 7 2003 fin. instruments entered into/modified after May 31, 2003
Catch Up -0.0005
SFAS Other Includes SFAS 96, 116, 128, 152, and 159 0 10 -- -- -- 0.0064
SOP 00-2 Accounting by Producers or Distributors of Films 0 5 2000 fiscal years beginning after Dec. 15, 2000 Catch Up -0.0251
SOP 97-3Accounting by Insurance and Other Enterprises for Insurance Related Assessments
0 2 1998, 2000 fiscal years beginning after Dec. 15, 1998 Catch Up -0.0030
SOP 98-5 Reporting on the Costs of Start-Up Activities 0 199 1998 - 2000 fiscal years beginning after Dec. 15, 1998 Catch Up -0.0088SOP Other Includes SOP 93-6 and 04-2 0 3 1994, 2006 -- -- -0.0061 Notes: Panel A in this table reports the descriptive details of the major changes in accounting standards covered in my sample. Information is an indicator variable equal to one (zero) for standards likely to inform managers. Number of Obs. is the number of firms in my sample adopting the accounting rule. Method of Implementation represents the accounting treatment for transition to the new standard. Mean Cum. Effect is the average cumulative effect reported by firms adopting the standard, scaled by average assets.
50
Table 2 Descriptives details of the changes in GAAP, years of adoption, and method of adoption
Notes: Panel B in this table reports which accounting pronouncements were adopted each year, along with the number of observations and the mean cumulative effect of an accounting change for the year in my sample. The mean cumulative effect is the within standard average cumulative effect of an accounting change.
51
Table 3 Summary Statistics of Variables used in the Regression Analysis
Notes: This table presents descriptive statistics for the main variables used in my analyses. In the table above, Cumulative Effect (ACCHG) is the cumulative effect of an accounting change as reported in the income statement deflated by average assets in period t and t–1. It represents effect of company adjustments due to accounting changes on all prior period earnings. Capital Expenditure (CAPX) is the cash outflow or the funds used for additions to the company's property, plant and equipment, excluding amounts arising from acquisitions, reported in the Statement of Cash Flows deflated by average assets in period t and t–1. R&D Expenditure (XRD) is the cost incurred during the year that relate to the development of new products or services deflated by average assets in period t and t–1. R&D Expenditure is coded to zero if it is missing. Tobin’s Q is measured as the sum of market value of equity (PRCC_F x CSHO), short term debt (DLC) and long term debt (DLTT) divided by total assets (AT). Growth is the change in total assets (AT) from period t–1 to period t scaled by total assets (AT) in period t–1. Age [Ln(Age)] is [the natural logarithm of] the difference between the first year the firm enters Compustat and the current year. Market Value of Equity [Ln(Market Value of Equity)] is the [natural logarithm of the] stock price at the end of the year (PRCC_F) times the number of shares outstanding (CSHO). Cash Flows from Operations (OANCF) is the cash flows from operations reported in the statement of cash flows deflated by average assets in period t and t–1. Cash and Marketable securities (CHE) is cash and all securities readily transferable to cash deflated by average assets in period t and t–1. Leverage is sum of short term debt (DLC) and long term debt (DLTT) deflated by average assets in period t and t–1. Stock Returns (RET) in the total returns from investing in the stock of a company from period t–1 to period t. Δ Capital Expenditure Efficiency – Sales Growth (Δ Total Investment Efficiency – Sales Growth) is minus one multiplied by the change in the absolute value of the residuals from a regression of capital expenditure (capital + R&D expenditure) in period t on sales growth in period t–1. The regression is estimated for each industry/year pool using all firms in Compustat and the Fama–French 30 industry classification scheme. The change in efficiency is the difference between the residual in period t+1 and t–1; period t is the year of the accounting change. Δ Capital Expenditure Efficiency – Q (Δ Total Investment Efficiency – Q) is minus one multiplied by the change in the absolute value of the residuals from a regression of capital expenditure (capital + R&D expenditure) in period t on Tobin’s Q in period t–1 and Cash Flows from Operations in period t. The regression is estimated for each industry/year pool using all firms in Compustat and the Fama–French 30 industry classification scheme. The change in efficiency is the difference between the residual in period t+1 and t–1; period t is the year of the accounting change. All continuous variables are winsorized at the 1% and 99% of their empirical distribution.
52
Table 3 (continued) Summary Statistics of Variables used in the Regression Analysis
Variable Mean Stdev P1 P5 P50 P95 P99 N
CHANGE IN GOVERNANCE & FINANCIAL REPORTING QUALITY
Notes (continued): Δ Number of Analysts is the change in the number of analysts (NUMEST) following the firm as provided by IBES after the change in GAAP (i.e., change from t–1 to t). Analyst following is assumed to be zero if the firm is not covered by IBES. Δ Institutional Ownership is the change in the percentage of firms' shares held by institutional investors after the change in GAAP (i.e., change from t–1 to t). Institutional Ownership is assumed to be zero if the data are missing. Δ Financial Reporting Quality is the change in the Dechow and Dichev (2002) measure of reporting quality with the McNichols (2002) suggested modification, around the change in GAAP. Specifically, I estimate a regression of current accruals on past, current, and future cash flows, the change in sales, and gross PP&E for each industry/year pool using all firms in Compustat and the Fama–French 30 industry classification scheme. The absolute value of the residual multiplied by minus one is my measure of reporting quality (for each firm–year). Since the Dechow–Dichev measure uses past and future cash flow data, I compute the change in reporting quality as reporting quality in period t+1 minus reporting quality in period t–1. Missing observations are assumed to have no change in reporting quality. Information is an indicator variable equal to one for observations in which the firm adopted an accounting standard that is likely to provide managers with information; zero otherwise. The accounting standards classified as likely to provide information are described in Appendix A. Deal Scan is an indicator variable that takes on the value of one (zero) if the observation has (does not have) data available in the Dealscan database. Covenant is an indicator variable that takes on the value of one (zero) if the observation has (does not have) at least one financial covenant that is likely to be affected by the cumulative effect of an accounting change. Contracts with Fixed GAAP, Contracts with Hybrid GAAP, and Contracts with Floating GAAP are indicator variables that take on the value of one (zero) if the debt contract is based on Fixed, Hybrid, or Floating GAAP, respectively. Disclose Reconciliation is an indicator variable that equals one (zero) if the debt contract requires the firm to reconcile and disclose differences in financial ratios after changes in GAAP while renegotiating covenants. All continuous variables are winsorized at the 1% and 99% of their empirical distribution.
53
Table 4 Univariate Pearson Correlations of Continuous Variables used in the Regression Analysis
p-value 0.72 0.00 0.12 0.05 0.00 0.00 0.66 0.23 0.00 0.68 0.31 0.70 0.60 0.01 0.00 0.00 0.00 ---- Notes: This table reports the Pearson correlation coefficients for the main variables used in my analyses with two tailed p–values below the coefficients. See Table 3 or Appendix B for variable definitions. All continuous variables are winsorized at the 1% and 99% of their empirical distribution.
54
Table 5 Regression of Investment on the Determinants of Investment and the Cumulative Effect of an Accounting
Clustered Std. Errors Firm & Year Year Firm & Year YearIndustry Fixed Effects Yes Yes No NoAccounting Standard Fixed Effects No No Yes YesNumber of Observations 2,795 2,795 2,795 2,795Adj./Pseudo R-Square 0.59 0.91 0.57 0.90
Notes: This table presents the results from regressing investment on various determinants of investment and the Cumulative Effect. I use OLS to estimate the regression equations with Capital Expenditure as the dependent variable, and I use the Tobit model to estimate the regression equations with R&D Expenditure as the dependent variable. The table reports the coefficients for the Capital Expenditure regressions and the marginal effects for the R&D Expenditure regressions. The marginal effects reported represent the change in expected R&D Expenditure with respect to a change in the independent variable, conditioned on R&D Expenditure being greater than zero and the covariates, that is, ∂E(Y|X,Y>0)/∂X. The t–statistics are reported in parentheses. Refer to Appendix B or prior tables for variable definitions. All continuous variables are winsorized at the 1% and 99% of their empirical distribution. ***, **, and * denote statistical significance at the one (two) tailed 1%, 5%, and 10% levels when I (do not) have a directional prediction.
55
Table 6 Regression of Investment on the Determinants of Investment and the Cumulative Effect of an
Accounting Change with Accounting Changes Classified into two Groups Based its Likelihood of Providing Managers Information Relevant for Making Investment Decisions
Dependent Variable Predicted Sign Capital Expendituret R&D Expendituret
(t - statistic) (t - statistic)
Information x Cumulative Effectt + 0.053 *** 0.017 ***(4.23) (4.21)
No Information x Cumulative Effectt ? -0.012 0.009(-0.33) (0.58)
Tobin's Qt-1 0.005 *** 0.002 ***(8.10) (6.13)
CFOt 0.069 *** -0.012 *(3.86) (-1.83)
Casht-1 -0.007 * -0.002(-1.90) (-0.54)
Growtht-1 0.012 *** 0.003 ***(3.24) (3.40)
Ln(Aget) 0.000 0.000(-0.09) (0.99)
Leveraget 0.001 -0.008 ***(0.22) (-2.96)
Ln(Market Value of Equityt) -0.001 ** 0.001 ***(-2.26) (4.43)
Stock Returnst 0.005 ** 0.002(2.21) (1.46)
Informationt 0.000 0.000(0.09) (-0.70)
Capital Expendituret-1 0.623 *** ---(22.79)
R&D Expendituret-1 --- 0.342 ***(10.60)
Clustered Std. Errors Firm & Year YearIndustry Fixed Effects Yes YesNumber of Observations 2,795 2,795Adj./Pseudo R-Square 0.59 0.91
Notes: This table presents the results from regressing investment on various determinants of investment, Information, and the Cumulative Effect. I use OLS to estimate the regression equations with Capital Expenditure as the dependent variable, and I use the Tobit model to estimate the regression equations with R&D Expenditure as the dependent variable. The table reports the coefficients for the Capital Expenditure regressions and the marginal effects for the R&D Expenditure regressions. The marginal effects reported represent the change in expected R&D Expenditure with respect to a change in the independent variable, conditioned on R&D Expenditure being greater than zero and the covariates, that is, ∂E(Y|X,Y>0)/∂X. The t–statistics are reported in parentheses. Information is an indicator variable that takes on the value of one for observations in which the firm adopted an accounting standard that is likely to inform managers about current or future investment opportunities. It takes on the value of zero otherwise. The accounting standards classification is described in Appendix A. No Information is an indicator variable that takes on the value of one (zero) if Information equals zero (one). Refer to Appendix B or prior tables for variable definitions. All continuous variables are winsorized at the 1% and 99% of their empirical distribution. ***, **, and * denote statistical significance at the one (two) tailed 1%, 5%, and 10% levels when I (do not) have a directional prediction.
56
Table 7 Regression of Changes in Investment Efficiency on the Cumulative Effect of an Accounting Change, the Likelihood that the Accounting
Change Informs Managers, and the Change in other Monitoring Mechanisms
Industry Fixed Effects Yes Yes Yes YesClustered Std. Errors Firm & Year Firm & Year Firm & Year Firm & YearNumber of Observations 2,588 2,588 2,624 2,624R-Square 0.020 0.009 0.020 0.015
Information x Unsigned Cumulative Effectt
No Information x Unsigned Cumulative Effectt
Notes: This table presents the results from regressing changes in investment efficiency on the cumulative effect, and changes in other monitoring mechanisms. Δ Capital Expenditure Efficiency – Sales Growth (Δ Total Investment Efficiency – Sales Growth) is minus one multiplied by the change in the absolute value of the residuals from a regression of capital expenditure (capital + R&D expenditure) in period t on sales growth in period t–1. Δ Capital Expenditure Efficiency – Q (Δ Total Investment Efficiency – Q) is minus one multiplied by the change in the absolute value of the residuals from a regression of capital expenditure (capital + R&D expenditure) in period t on Tobin’s Q in period t–1 and Cash Flows from Operations in period t. These regressions are estimated for each industry/year pool using all firms in Compustat and the Fama–French 30 industry classification scheme. The change in efficiency is the difference between the residual in period t+1 and t–1; period t is the year of the accounting change. Refer to Appendix B or prior tables for variable definitions. The t–statistics are reported in parentheses. All continuous variables are winsorized at the 1% and 99% level. ***, **, and * denote statistical significance at the one (two) tailed 1%, 5%, and 10% levels when I (do not) have a directional prediction.
57
Table 8 Regression of Changes in Investment Efficiency on the Cumulative Effect of an Accounting Change, an Index for the Organization’s
Information Complexity, and the Change in other Monitoring Mechanisms
Industry Fixed Effects Yes Yes Yes YesClustered Std. Errors Firm & Year Firm & Year Firm & Year Firm & YearNumber of Observations 2,588 2,588 2,624 2,624R-Square 0.009 0.001 0.012 0.004
Unsigned Cumulative Effect x Organizational Complexity Indext
Notes: This table presents the results from regressing changes in investment efficiency on the cumulative effect, and changes in other monitoring mechanisms. Δ Capital Expenditure Efficiency – Sales Growth (Δ Total Investment Efficiency – Sales Growth) is minus one multiplied by the change in the absolute value of the residuals from a regression of capital expenditure (capital + R&D expenditure) in period t on sales growth in period t–1. Δ Capital Expenditure Efficiency – Q (Δ Total Investment Efficiency – Q) is minus one multiplied by the change in the absolute value of the residuals from a regression of capital expenditure (capital + R&D expenditure) in period t on Tobin’s Q in period t–1 and Cash Flows from Operations in period t. These regressions are estimated for each industry/year pool using all firms in Compustat and the Fama–French 30 industry classification scheme. The change in efficiency is the difference between the residual in period t+1 and t–1; period t is the year of the accounting change. Organizational Complexity Index is measured using a Herfindahl index for business segment diversification. It is the sum of the square of firm sales in each business segment divided by the square of total sales multiplied by minus one. Firms missing from the segment file are assumed to be single segment firms (i.e., the complexity index is coded to –1). Refer to Appendix B or prior tables for variable definitions. The t–statistics are reported in parentheses. All continuous variables are winsorized at the 1% and 99% level. ***, **, and * denote statistical significance at the one (two) tailed 1%, 5%, and 10% levels when I (do not) have a directional prediction.
58
Table 9 Regression of Investment on its Determinants, the Cumulative Effect, and Indicator Variables for Observations
with Financial Covenants in Debt Contracts and the Type of GAAP used in Debt Contracts
Control Variables Yes Yes Yes YesClustered Std. Errors Firm & Year Firm & Year Year YearNumber of Observations 2,795 2,514 2,795 2,514
Panel B: Regressions with Accounting Standard Fixed Effects
No Covenants x Cumulative Effectt
Predicted Sign
Covenants x Cumulative Effectt
Floating GAAP x Covenants x Cumulative Effectt
No Floating GAAP x Covenants x Cumulative Effectt
Panel A: Regressions with Industry Fixed Effects
Capital Expendituret R&D Expendituret
Covenants x Cumulative Effectt
Floating GAAP x Covenants x Cumulative Effectt
No Floating GAAP x Covenants x Cumulative Effectt
No Covenants x Cumulative Effectt
Notes: This table presents the results from regressing investment on various determinants of investment, Covenants, the type of GAAP used in contracts, and the Cumulative Effect. I use OLS (Tobit) to estimate the regression equations with Capital Expenditure (R&D Expenditure) as the dependent variable. The table reports the coefficients for the Capital Expenditure regressions and the marginal effects for the R&D Expenditure regressions. Covenant is an indicator variable that takes on the value of one (zero) if the observation has (does not have) at least one financial covenant that is likely to be affected by the cumulative effect of an accounting change. No Covenant is an indicator variable that takes on the value of one (zero) if Covenant equals zero (one). Floating GAAP is an indicator variable that takes on the value of one if the debt agreement uses the Floating GAAP practice or requires the firm to disclose reconciliations between the old and new accounting practice while renegotiating covenants to adjust for the change in GAAP. No Floating GAAP is an indicator variable that takes on the value of one (zero) if Floating GAAP equals zero (one). The t–statistics are reported in parentheses. Refer to Appendix B or prior tables for variable definitions. All continuous variables are winsorized at the 1% and 99% level. ***, **, and * denote statistical significance at the one (two) tailed 1%, 5%, and 10% levels when I (do not) have a directional prediction.
59
Table 10 Regression of Investment on its Determinants, the Cumulative Effect, and Financial Covenants Indicators, and the
Type of GAAP used in Debt Contracts conditioned on Past Performance
Control Variables Yes Yes Yes YesClustered Std. Errors Firm & Year Firm & Year Year YearNumber of Observations 1,375 1,138 1,375 1,138
Floating GAAP x Covenants x Cumulative Effectt
Panel B: Regressions with Accounting Standard Fixed Effects
Predicted Sign
Floating GAAP x Covenants x Cumulative Effectt
Panel A: Regressions with Industry Fixed Effects
Capital Expendituret R&D Expendituret
Notes: This table presents the results from regressing investment on various determinants of investment, Covenants, the type of GAAP used in contracts, and the Cumulative Effect conditioned on whether firm had positive or negative earnings growth. I use OLS (Tobit) to estimate the regression equations with Capital Expenditure (R&D Expenditure) as the dependent variable. The table reports the coefficients for the Capital Expenditure regressions and the marginal effects for the R&D Expenditure regressions. Δ in Earnings is the change in earnings before extraordinary item (IB) from year t—1 to t. Covenant is an indicator variable that takes on the value of one (zero) if the observation has (does not have) at least one financial covenant that is likely to be affected by the cumulative effect of an accounting change. Floating GAAP is an indicator variable that takes on the value of one if the debt agreement uses the Floating GAAP practice or requires the firm to disclose reconciliations between the old and new accounting practice while renegotiating covenants to adjust for the change in GAAP. The t–statistics are reported in parentheses. Refer to Appendix B or prior tables for variable definitions. All continuous variables are winsorized at the 1% and 99% level. ***, **, and * denote statistical significance at the one (two) tailed 1%, 5%, and 10% levels when I (do not) have a directional prediction.
60
Table 11 Additional Analysis – Investment Regressions where the Cumulative Effect of an Accounting Change is Split into Four Groups Capturing Firms with Financial Covenants and/or Firms Adopting Accounting Changes
(-0.93) (-0.22)Information x No Floating GAAP Covenantst 0.003 -0.001
(1.06) (-1.04)No Information x No Floating GAAP Covenantst 0.014 * -0.003
(1.96) (-1.44)Information x Floating GAAP Covenants x Cumulative Effectt + 0.030 * 0.047 ***
(1.75) (7.30)Information x No Floating GAAP Covenants x Cumulative Effectt + 0.057 *** 0.015 ***
(4.55) (4.18)No Information x Floating GAAP Covenants x Cumulative Effectt + -0.039 -0.029
(-0.19) (-0.23)No Information x No Floating GAAP Covenants x Cumulative Effectt ? 0.000 0.016
(-0.01) (0.86)
Joint signifcance of Information x Cumulative Effect (two tailed p-value) 0.000 0.000Joint signifcance of Floating GAAP Covenants x Cumulative Effect (two tailed p-value) 0.963 0.889
Control Variables Yes YesClustered Std. Errors Firm & Year YearIndustry Fixed Effects Yes YesNumber of Observations 2,514 2,514Adj./Pseudo R-Square 0.60 0.91
Predicted Sign
Notes: This table reports the results from regressing investment on the determinants of investment and the Cumulative Effect. The Cumulative Effect is split into four parts capturing all combinations of the variables: Information, No Information, Floating GAAP Covenants, and No Floating GAAP Covenants. Floating GAAP Covenants is an indicator variable that takes on the value of one if the firm has at least one financial covenant that is likely to be affected by the cumulative effect of an accounting change and the debt agreement uses the Floating GAAP practice or requires the firm to disclose reconciliations between the old and new accounting practice while renegotiating covenants to adjust for the change in GAAP. No Floating GAAP Covenants is an indicator variable that takes on the value of one (zero) if Floating GAAP Covenants equals zero (one). Information is an indicator variable that takes on the value of one for observations in which the firm adopted an accounting standard that is likely to inform managers about current or future investment opportunities. It takes on the value of zero otherwise. The accounting standards classification is described in Appendix A. No Information is an indicator variable that takes on the value of one (zero) if Information equals zero (one). I use OLS (Tobit) to estimate the regression equations with Capital Expenditure (R&D Expenditure) as the dependent variable. The table reports the coefficients for the Capital Expenditure regressions and the marginal effects for the R&D Expenditure regressions. The marginal effects reported represent the change in expected R&D Expenditure with respect to a change in the independent variable, conditioned on R&D Expenditure being greater than zero and the covariates, that is, ∂E(Y|X,Y>0)/ ∂X. The t–statistics are reported in parentheses. Refer to Appendix B or prior tables for variable definitions. The regressions include the control variables used in prior tables but the coefficients are suppressed. All continuous variables are winsorized at the 1% and 99% of their empirical distribution. ***, **, and * denote statistical significance at the one (two) tailed 1%, 5%, and 10% levels when I (do not) have a directional prediction.