International Journal of Social Science Studies Vol. 6, No. 1; January 2018 ISSN 2324-8033 E-ISSN 2324-8041 Published by Redfame Publishing URL: http://ijsss.redfame.com 107 Managerial Optimism Level and Investment Decision: Decision Tree Analysis Mohamed Ali Azouzi 1 & Anis Jarboui 2 1 Doctor and HDR Financial and Accounting, Assistant Professor in Finance and Accounting Methods, Faculty of Management Mahdia, Tunisia University of Monastir, Tunisia 2 Doctor and HDR Financial and Accounting, Associate Professor of Universities, Higher Institute of Business Administration (ISAAS) University of Sfax, Tunisia Correspondence: Mohamed Ali Azouzi, Doctor and HDR Financial and Accounting, Assistant Professor in Finance and Accounting Methods, Faculty of Management Mahdia, Tunisia University of Monastir, Tunisia. Received: October 12, 2017 Accepted: December 18, 2017 Available online: December 19, 2017 doi:10.11114/ijsss.v6i1.2694 URL: https://doi.org/10.11114/ijsss.v6i1.2694 Abstract This paper deals with the relationship existing between the emotional aspect and decision-making. More specifically, it examines the links between managerial optimism, and effectiveness of the investment decision. We introduce an approach based Decision Tree analysis with a series of semi-directive interviews. CEO optimism level was measured using a questionnaire with several items. As for the selected sample was composed of 100 Tunisian managers. The originality of this research paper is guaranteed since it traits the behavioral corporate policy choice in emergent markets. In the best of our knowledge, this is the first study in the Tunisian context that explores such area of research. Our results show that Tunisian optimistic leader who seeks the pioneering advantage for him and his company is encouraged to adjust its specific investment decision (investment, overinvestment or under-investment in the short term or long term ...) to ensure that advantage pioneer. Keywords: emotional bias, investment decision, optimism, assets specificity, decision tree 1. Introduction Company’s investment decision analysis is traditionally discussed in reference to concepts of financial, notably through concepts such as net present value and payback of capital invested. Now summarize the decision investment in a simple calculation to update or compare a disbursement immediate and future revenue may appear too simplistic a reality probably much more complex. In fact, the business environment becomes increasingly complex (flexibility and competitiveness) thus altering the forecast changes of activity and profitability. The development of literature devoted to the theory of investment focused on the restrictive impact that could exercise the phenomena of irreversibility and uncertainty. This phenomenon of irreversibility affects investment decisions by the leader. Moreover, the latest advances in psychology invite us to review the mechanisms decision through emotions. Indeed, emotional processes are involved one way or another, in those who govern the decision. Emotions allow us then to evaluate the desirability or otherwise of a decision. They finally allow processes to focus on solving problems, which they are most effective. The emotional states of the leader affect his preferences and its objectives cannot remain without consequences for their behaviors investment (Girard, 1997; Azouzi and Jarboui, 2012, 2013). Certainly, the current of behavioral finance market already provides central place individuals and not just the tools. As for corporate finance, she studied behavioral biases that leaders in terms of optimism or excessive confidence and leadership under the classical hypothesis of market efficiency and maximization of shareholder wealth so that the problem becomes that of traditional analysis of over or under investment. She says over and under investment by referring to the behavior and psychology of leaders. Thus, several studies have shown the effect of perceptions and preferences on leadership efficiency of investment (Fama, 1980). Recently, Felton et al (2003) and Gibson and Sanbonmatsu (2004) justify the choice sometimes risky investments by
Transcript
International Journal of Social Science Studies
Vol. 6, No. 1; January 2018
ISSN 2324-8033 E-ISSN 2324-8041 Published by Redfame Publishing
URL: http://ijsss.redfame.com
107
Managerial Optimism Level and Investment Decision:
Decision Tree Analysis
Mohamed Ali Azouzi1& Anis Jarboui
2
1Doctor and HDR Financial and Accounting, Assistant Professor in Finance and Accounting Methods, Faculty of
Management Mahdia, Tunisia University of Monastir, Tunisia
2Doctor and HDR Financial and Accounting, Associate Professor of Universities, Higher Institute of Business
Administration (ISAAS) University of Sfax, Tunisia
Correspondence: Mohamed Ali Azouzi, Doctor and HDR Financial and Accounting, Assistant Professor in Finance and Accounting Methods, Faculty of Management Mahdia, Tunisia University of Monastir, Tunisia.
Received: October 12, 2017 Accepted: December 18, 2017 Available online: December 19, 2017
This paper deals with the relationship existing between the emotional aspect and decision-making. More specifically, it
examines the links between managerial optimism, and effectiveness of the investment decision. We introduce an
approach based Decision Tree analysis with a series of semi-directive interviews. CEO optimism level was measured
using a questionnaire with several items. As for the selected sample was composed of 100 Tunisian managers. The
originality of this research paper is guaranteed since it traits the behavioral corporate policy choice in emergent markets.
In the best of our knowledge, this is the first study in the Tunisian context that explores such area of research. Our
results show that Tunisian optimistic leader who seeks the pioneering advantage for him and his company is encouraged
to adjust its specific investment decision (investment, overinvestment or under-investment in the short term or long term ...) to ensure that advantage pioneer.
Keywords: emotional bias, investment decision, optimism, assets specificity, decision tree
1. Introduction
Company’s investment decision analysis is traditionally discussed in reference to concepts of financial, notably through
concepts such as net present value and payback of capital invested. Now summarize the decision investment in a simple
calculation to update or compare a disbursement immediate and future revenue may appear too simplistic a reality
probably much more complex. In fact, the business environment becomes increasingly complex (flexibility and competitiveness) thus altering the forecast changes of activity and profitability.
The development of literature devoted to the theory of investment focused on the restrictive impact that could exercise
the phenomena of irreversibility and uncertainty. This phenomenon of irreversibility affects investment decisions by the leader.
Moreover, the latest advances in psychology invite us to review the mechanisms decision through emotions. Indeed, emotional processes are involved one way or another, in those who govern the decision.
Emotions allow us then to evaluate the desirability or otherwise of a decision. They finally allow processes to focus on
solving problems, which they are most effective. The emotional states of the leader affect his preferences and its
objectives cannot remain without consequences for their behaviors investment (Girard, 1997; Azouzi and Jarboui, 2012, 2013).
Certainly, the current of behavioral finance market already provides central place individuals and not just the tools. As
for corporate finance, she studied behavioral biases that leaders in terms of optimism or excessive confidence and
leadership under the classical hypothesis of market efficiency and maximization of shareholder wealth so that the
problem becomes that of traditional analysis of over or under investment. She says over and under investment by
referring to the behavior and psychology of leaders. Thus, several studies have shown the effect of perceptions and preferences on leadership efficiency of investment (Fama, 1980).
Recently, Felton et al (2003) and Gibson and Sanbonmatsu (2004) justify the choice sometimes risky investments by
International Journal of Social Science Studies Vol. 6, No. 1; 2018
108
optimism prone leaders to seek information and their willingness to solve a given problem without worrying about success of previous and similar projects.
Heaton (2002) and Hackbarth (2009) illuminate underinvestment by their leaders overconfidence related to the overestimation of the value of their business.
Based on these findings, the aim of this research is to show the impact of optimism leader on his choice for investment (asset specificity level and investment horizon).
2. Literature Review and Hypothesis
2.1 Managerial Optimism and Asset Specificity Choice
The choice of strategic investments may not result from the use of well-defined criteria, but rather the perception of the leaders of the future profitability of a particular opportunity and their own success at the head of their company.
Financial research highlights recently the role of optimism and / or overconfident managers on the investment policy.
This trend has its roots in psychological research demonstrating that an individual is more optimistic that invested heavily and believes control the outcome of the decision (Weinstein, 1980).
According Boot et al (2005), the investment decision is inseparable from the judgment of those who have been
delegated the evaluation. Shleiler and Vishny (1989) show that the risk of OPA encourages managers to invest on in
projects whose value depends directly on them to take root and become indispensable in the eyes of shareholders. Thus, an optimistic leader vis-à-vis the growth opportunities of the company is heavily invested in specific projects
(in human capital) to keep its place at the head of the management team.
Bolton and Heath (2004) add that the concept of pioneering advantage is the city in strategic management because it
refers to the mental patterns associated with success concept. Therefore, investment decisions result more media
overexposure leaders of the need to be the first choice as a reflection guided by logic procedural (Hawkins et al, 2001).
In other words, an optimistic leader who seeks the pioneering advantage for him and his company has an incentive to
innovate and choose investments that are more specific. The selection of specific investments by an optimistic leader
permits to erect barriers to entry to prevent the arrival of a new competitor. This investment is a key success factor that enhances the leader on the market leaders.
Bronwyn (1993), points out that company with very specific assets are taken under control than those with moderately
specific assets. An optimistic leader about his firm productive capacity to invest more in specific assets to transform power relations with its shareholders or partners of the company. It is now insured against the risk of takeover.
Hache (2005) shows that the profile of the leader affects its investment decision (active Specific or not). Thus, the
leader of an innovative company should be able anticipate needs, careful organization, control of time and cost. Must
have the spirit of initiative and enterprise, risk-taking, acceptance of the error. This optimistic leader about his company
will be inclined to increase investment in research and development as an investment in specific assets associate its image and reputation in the creation of new products / services.
Edlin and Stiglitz (1995) posit that leaders are trying to increase the uncertainty of activities and investments that lead to
make them more complex and difficult to undertake. Indeed, the optimistic manager uses specific risky investments to reduce the risk of takeover and preserve its place at the head of his company.
Therefore, leaders can appropriating the rents generated by innovation, increase managerial flexibility, enhance their
reputation and possibly develop a strategy for rooting. So an optimistic leader interest to increase the degree of specificity of the assets of the company.
Gervais et al (2002) point out that managerial optimism is positively correlated with motivation and involvement of
managers in their work. Thus, Fama (1980) added that the manager selects investments based on the impact on their
reputation in the work market. This optimistic leader opts for specific investments such as investment in research and development in order to increase the competitiveness of its business and ensure the creation of value.
Hong et al (2000) argue that most analysts are inexperienced and their strategy investment reflects the consensus in the
market. The same reasoning applies to leader. Thus, an inexperienced manager is aware of the low capacity productive
of his business. Therefore, he engages in risky activities and subsequently reduced the frequency of specific investments.
Malmendier and Tate (2005, 2008, and 2010) find that managers are invested in the project because of the holding of
stock options and their desire to preserve their reputation in the labor market. They tend to overestimate the control of
the project (specific investment). This implies that an optimistic leader opts for specific investments to develop its human capital and makes it difficult to replace.
International Journal of Social Science Studies Vol. 6, No. 1; 2018
109
Gervais and Odean (2001) conclude that the organizational mechanisms of incentives (financial and non-financial)
reinforce the sense of optimism among the manager. Thus, these leaders are optimistic about incentive to invest in
innovative and specific projects. They have specific information that will allow them direct access to critical resources
and to master the uncertainty and risk of technological innovation projects. As a result, the optimism of the leader
beyond the problem of managerial opportunism described by agency theory in specific projects (Azouzi and Jarboui, 2013).
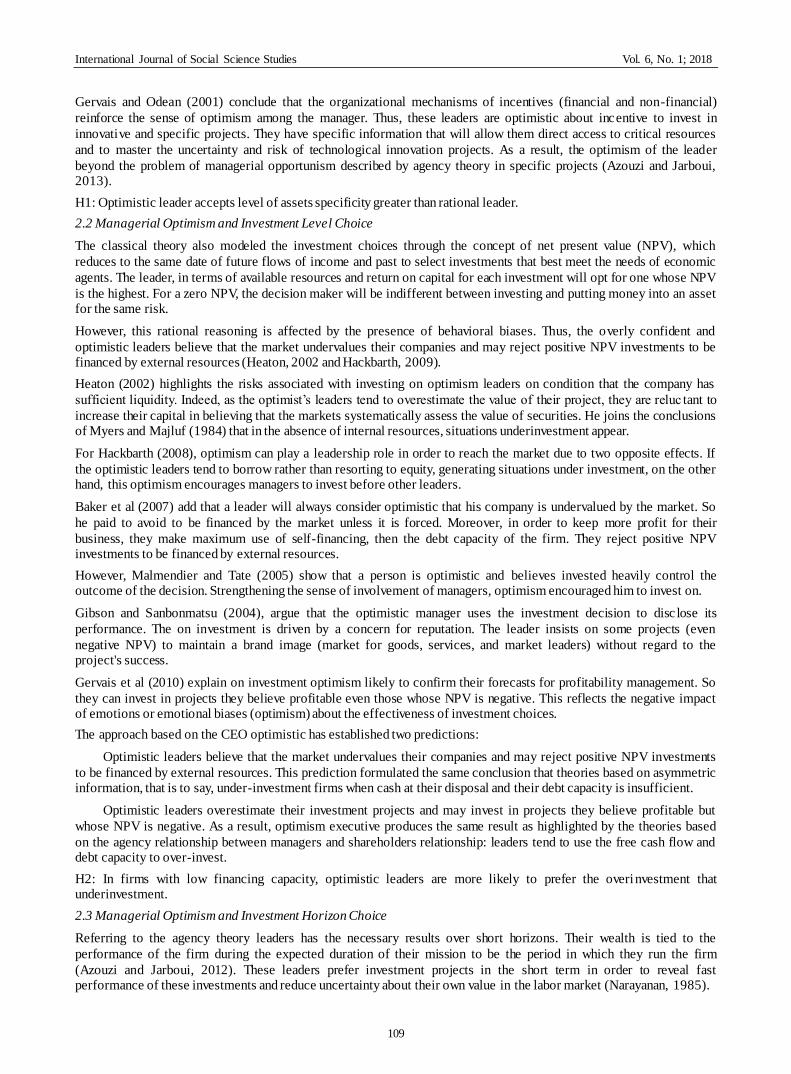
H1: Optimistic leader accepts level of assets specificity greater than rational leader.
2.2 Managerial Optimism and Investment Level Choice
The classical theory also modeled the investment choices through the concept of net present value (NPV), which
reduces to the same date of future flows of income and past to select investments that best meet the needs of economic
agents. The leader, in terms of available resources and return on capital for each investment will opt for one whose NPV
is the highest. For a zero NPV, the decision maker will be indifferent between investing and putting money into an asset for the same risk.
However, this rational reasoning is affected by the presence of behavioral biases. Thus, the overly confident and
optimistic leaders believe that the market undervalues their companies and may reject positive NPV investments to be financed by external resources (Heaton, 2002 and Hackbarth, 2009).
Heaton (2002) highlights the risks associated with investing on optimism leaders on condition that the company has
sufficient liquidity. Indeed, as the optimist’s leaders tend to overestimate the value of their project, they are reluc tant to
increase their capital in believing that the markets systematically assess the value of securities. He joins the conclusions of Myers and Majluf (1984) that in the absence of internal resources, situations underinvestment appear.
For Hackbarth (2008), optimism can play a leadership role in order to reach the market due to two opposite effects. If
the optimistic leaders tend to borrow rather than resorting to equity, generating situations under investment, on the other hand, this optimism encourages managers to invest before other leaders.
Baker et al (2007) add that a leader will always consider optimistic that his company is undervalued by the market. So
he paid to avoid to be financed by the market unless it is forced. Moreover, in order to keep more profit for their
business, they make maximum use of self-financing, then the debt capacity of the firm. They reject positive NPV investments to be financed by external resources.
However, Malmendier and Tate (2005) show that a person is optimistic and believes invested heavily control the outcome of the decision. Strengthening the sense of involvement of managers, optimism encouraged him to invest on.
Gibson and Sanbonmatsu (2004), argue that the optimistic manager uses the investment decision to disc lose its
performance. The on investment is driven by a concern for reputation. The leader insists on some projects (even
negative NPV) to maintain a brand image (market for goods, services, and market leaders) without regard to the project's success.
Gervais et al (2010) explain on investment optimism likely to confirm their forecasts for profitability management. So
they can invest in projects they believe profitable even those whose NPV is negative. This reflects the negative impact of emotions or emotional biases (optimism) about the effectiveness of investment choices.
The approach based on the CEO optimistic has established two predictions:
Optimistic leaders believe that the market undervalues their companies and may reject positive NPV investments
to be financed by external resources. This prediction formulated the same conclusion that theories based on asymmetric information, that is to say, under-investment firms when cash at their disposal and their debt capacity is insufficient.
Optimistic leaders overestimate their investment projects and may invest in projects they believe profitable but
whose NPV is negative. As a result, optimism executive produces the same result as highlighted by the theories based
on the agency relationship between managers and shareholders relationship: leaders tend to use the free cash flow and debt capacity to over-invest.
H2: In firms with low financing capacity, optimistic leaders are more likely to prefer the overinvestment that underinvestment.
2.3 Managerial Optimism and Investment Horizon Choice
Referring to the agency theory leaders has the necessary results over short horizons. Their wealth is tied to the
performance of the firm during the expected duration of their mission to be the period in which they run the firm
(Azouzi and Jarboui, 2012). These leaders prefer investment projects in the short term in order to reveal fast performance of these investments and reduce uncertainty about their own value in the labor market (Narayanan, 1985).
International Journal of Social Science Studies Vol. 6, No. 1; 2018
110
Bertrand and Schoar (2003) point out that older leaders seek to replace the stock performance indicators by accounting
indicators (ie short-term). This effect is even more important if the date of departure of the head of the company
coincides with his retirement, as reputation within the network of leaders is no longer a constraint. These pessimistic
leaders therefore do not have interest in investing skills to the company and hope to achieve significant gains in the long term. This implies that the leader optimism level affects its investment horizon preference.
Camerer (2003) says that a value is perceived as more important in the short and long term. Optimistic CEO uses
short-term investment in order to signal its performance. It avoids the use of long-term investments even if they offer future profitability better than short-term investments.
David et al (2001) add that leaders sometimes invest in projects with short term. They are unable to diversify their human capital and seem to prefer projects less risky to protect their compensation often coupled with their performance.
However, optimistic leaders who are interested in their future earnings firms (Bazerman, 2006) are choosing long-term investments. They trust to preserve their place at the head of the company.
Backer et al (2007) posit that the optimistic and overly confident leader is inclined believe have control over investment
projects. It will tend to overestimate its ability to control outcomes thinking that the risk can be reduced by good use of
his professional skills. It opted for long-term investment risk in order to align its interests with those of shareholders.
The decision maker is then overly optimistic about their ability to achieve far better results than those obtained by
short-term investment. This attitude will push the manager to select incompatible with the productive capacity of the business project.
Felton et al (2003) argue that leaders realize optimistic forecasts and seek to confirm its strategic levers. So they use the
decision Investment as a confirmation of the expected results. They opt for long-term investment risky and expensive that they hope the realization of an equivalent to their forecasts profitability.
H3: The preference of the manager for long-term investment projects increases the underestimation of the success of an operation to take control (a high level of optimism).
3. Method
3.1 Data
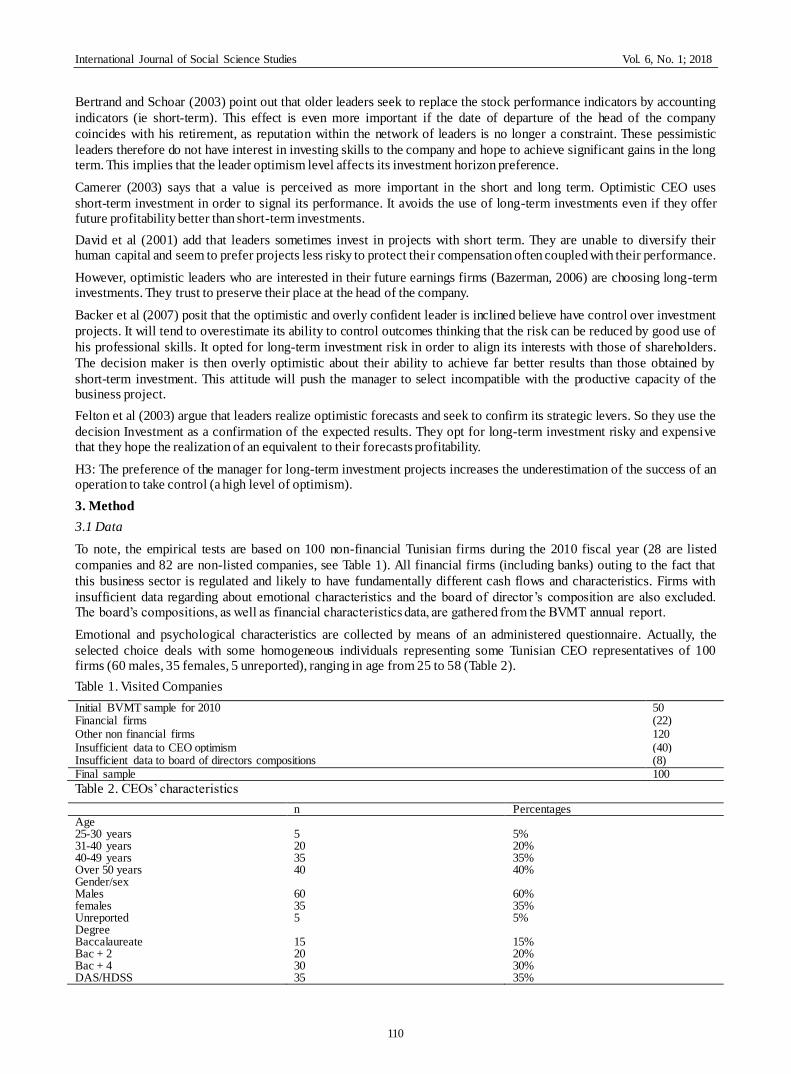
To note, the empirical tests are based on 100 non-financial Tunisian firms during the 2010 fiscal year (28 are listed
companies and 82 are non-listed companies, see Table 1). All financial firms (including banks) outing to the fact that
this business sector is regulated and likely to have fundamentally different cash flows and characteristics. Firms with
insufficient data regarding about emotional characteristics and the board of director’s composition are also excluded. The board’s compositions, as well as financial characteristics data, are gathered from the BVMT annual report.
Emotional and psychological characteristics are collected by means of an administered questionnaire. Actually, the
selected choice deals with some homogeneous individuals representing some Tunisian CEO representatives of 100 firms (60 males, 35 females, 5 unreported), ranging in age from 25 to 58 (Table 2).
Table 1. Visited Companies
Initial BVMT sample for 2010 50 Financial firms (22) Other non financial firms 120 Insufficient data to CEO optimism (40) Insufficient data to board of directors compositions (8) Final sample 100
Table 2. CEOs’ characteristics
n Percentages Age 25-30 years 31-40 years 40-49 years Over 50 years
5 20 35 40
5% 20% 35% 40%
Gender/sex Males females Unreported
60 35 5
60% 35% 5%
Degree Baccalaureate Bac + 2 Bac + 4 DAS/HDSS
15 20 30 35
15% 20% 30% 35%
International Journal of Social Science Studies Vol. 6, No. 1; 2018
111
Most questionnaires have been distributed by the method of door to door to ensure they are personally delivered to the person concerned; few among them have been mailed, for businesses located outside the Greater Tunis area.
It is worth noting, however, a broader sample that even if it had been envisaged to be studied and that more than 100
questionnaires had been distributed for this purpose, we would have received far fewer responses than expected (return
rate 44.84 per cent: although the number of distributed questionnaires reached 223, the responses received did not
exceeded 100 CEO). Indeed, many of the adduced have refused to respond to our questions on the ground of several reasons, namely, that:
They are too busy and have no time to devote to research;
They generally do not pay any interest to the questionnaires submitted by students and would return them to their assistants or other staff for a response (this has been the case of our officer-centred research); and
They perceive that the questionnaire is a sort of ‘‘control’’ damage to their private lives and that it is out of the question to answer.
Other encountered difficulties are mainly due to the administrative procedures and hierarchical procedures, which linger
questionnaires to the recoveries. Fortunately, the leaders who had been so kind as to cooperate and help us formulate and set up our sample eventually composed of 100 private company leaders, belonging mostly to the industrial sector.
3.2 Variables’ Measurement
The objective of this section is to determine the variables’ measurement.
3.2.1 Investment Decision
The purpose of this article is to show the impact of emotions on the firms’ investment decision (Investment nature, level and horizon). The appropriate measures in the literature to evaluate investment decision are:
3.2.1.1 Assets Specificity
In our study, we will use the degree of assets intangibility as a proxy of the specific investments. The degree of assets intangibility can be appreciated on many levels. The France Bank and Ministry of
Industry in studies devoted to the development of intangible investments in France has used the ratio often intangible /
tangible assets. In Tunisia, as in France, the intangible asset accounting record comes from the capitalization of such
expenses. However, the unavailability of information legitimizes the use of the amount of intangible assets is presented
in the balance sheet although this amount is usually surrounded by doubt as the result of discretionary choices
performed by the leaders. Akin to the French context, the measurement of intangible capital in the Tunisian context has
the same problems, which leads us to adopt accounting. Based on that discussion and the availability of data of Tunisian companies we offer the following indicator of the degree of activation of intangible expenses:
This measured is used by Cazavan-Jeny (2004), Moussu and Thibierge (1997), Thibierge (2001), Azouzi and Jarboui (2012, 2013, 2014)etc.
3.2.1.2 Investment Level
In this study, we will use the presence of free cash flow and growth opportunities as two indicators of over -investment
(low Future investment opportunities and free cash flow) or underinvestment (low free cash flow and Future investment
opportunities). The literature differs on how to measure the free cash flow as conceptualized by Jensen (1986). In
general, however, it is defined as operating income before depreciation interest expense and taxes, as well as dividends paid
(Lehn & Poulsen, 1989; Gul & Tsui, 1998; Jaggi & Gul, 1999) divided by book value of total assets to account for effects related to size (Lang et al., 1991).
Future investment opportunities are measured by Tobin's Q (Skinner, 1993). Tobin's Q is defined as the ratio of market
value of a firm to the replacement value of its assets (Lindenberg and Ross, 1981; Griliches, 1981; Cockburn and
Griliches, 1988; Megna and Klock, 1993; Skinner, 1993). A Tobin's Q greater than one then the company has signed a
profitable investment opportunities and vice versa. In our study, we will retain an approximation of Tobin's Q, calculated as follows (Chung & Pruitt, 1994):
(3)
International Journal of Social Science Studies Vol. 6, No. 1; 2018
112
MVS – market value of common and preferred shares; D – book value of debt, defined as current liabilities plus long-term debt plus inventories minus current assets; A – total assets.
3.2.1.3 Investment Horizon
Referring to the theory of agency leaders has an obligation of result on short horizons. Their wealth is tied to the
performance of the firm during the duration of their mission is the period during which they run the firm. These leaders
prefer investment projects in the short term to quickly reveal the performance of these investments and reduce uncertainty about their own value on the labor market.
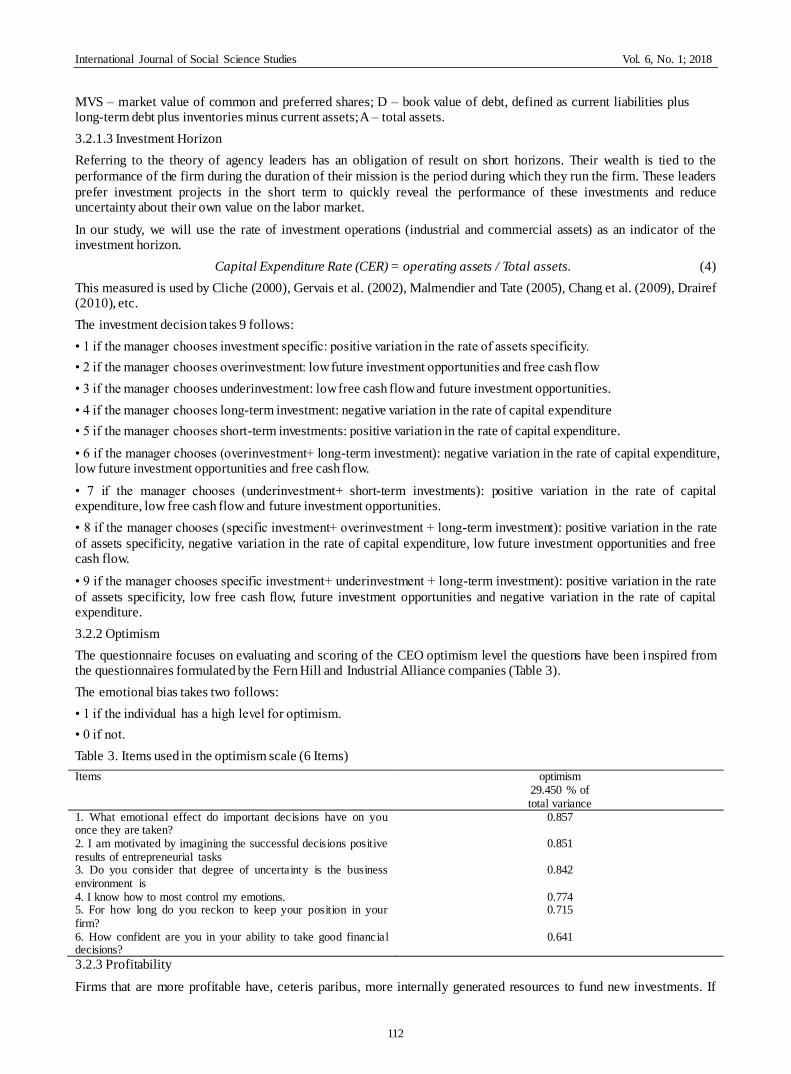
In our study, we will use the rate of investment operations (industrial and commercial assets) as an indicator of the investment horizon.
Capital Expenditure Rate (CER) = operating assets / Total assets. (4)
This measured is used by Cliche (2000), Gervais et al. (2002), Malmendier and Tate (2005), Chang et al. (2009), Drairef (2010), etc.
The investment decision takes 9 follows:
• 1 if the manager chooses investment specific: positive variation in the rate of assets specificity.
• 2 if the manager chooses overinvestment: low future investment opportunities and free cash flow
• 3 if the manager chooses underinvestment: low free cash flow and future investment opportunities.
• 4 if the manager chooses long-term investment: negative variation in the rate of capital expenditure
• 5 if the manager chooses short-term investments: positive variation in the rate of capital expenditure.
• 6 if the manager chooses (overinvestment+ long-term investment): negative variation in the rate of capital expenditure, low future investment opportunities and free cash flow.
• 7 if the manager chooses (underinvestment+ short-term investments): positive variation in the rate of capital expenditure, low free cash flow and future investment opportunities.
• 8 if the manager chooses (specific investment+ overinvestment + long-term investment): positive variation in the rate
of assets specificity, negative variation in the rate of capital expenditure, low future investment opportunities and free cash flow.
• 9 if the manager chooses specific investment+ underinvestment + long-term investment): positive variation in the rate
of assets specificity, low free cash flow, future investment opportunities and negative variation in the rate of capital expenditure.
3.2.2 Optimism
The questionnaire focuses on evaluating and scoring of the CEO optimism level the questions have been inspired from the questionnaires formulated by the Fern Hill and Industrial Alliance companies (Table 3).
The emotional bias takes two follows:
• 1 if the individual has a high level for optimism.
• 0 if not.
Table 3. Items used in the optimism scale (6 Items)
Items optimism
29.450 % of total variance
1. What emotional effect do important decisions have on you once they are taken?
0.857
2. I am motivated by imagining the successful decisions positive results of entrepreneurial tasks
0.851
3. Do you consider that degree of uncertainty is the business
environment is
0.842
4. I know how to most control my emotions. 0.774 5. For how long do you reckon to keep your position in your firm?
0.715
6. How confident are you in your ability to take good financial decisions?
0.641
3.2.3 Profitability
Firms that are more profitable have, ceteris paribus, more internally generated resources to fund new investments. If
International Journal of Social Science Studies Vol. 6, No. 1; 2018
113
their managers follow a pecking order, they will be less likely to seek external financing (Fama & French, 2002). Thus,
on average, these firms’ advantage ratios will be lower. In trade-off models, on the other hand, this relationship is
inverted. Firms that are more profitable are less subject to bankruptcy risks. Hence, their expected bankruptcy costs are
reduced and they can make more use of the tax shields provided by debt, thus choosing a position of greater advantage. We will keep the ratio of return on assets ROA to measure this variable:
ROA= Earnings before interest, tax, depreciation divided by total assets, lagged one year period (5)
3.2.4 Firm Size
Studies suggest that the probability of bankruptcy is lower in larger firms and that, therefore, their debt capacity is
higher than that of smaller ones, else equal. On the other hand, fixed transaction costs can make new stock issues
unattractive to small corporations, stimulating them to issue debt (Rajin & Zingales, 1995; Hovakimian et al., 2004;
Dufour & Molay, 2010). Indeed, most studies have applied total assets or turnover as a measure for firm size (Bujadi & Richardson, 1997). In this paper, it is measured through the log of the firm’s total assets (LNSIZE).
3.2.5 Control Variable
3.2.5.1 Debt Level
We observe several authors (Hovakimian and al, 2004) have selected a variety of variables that measure the level of
debt in the company.Measures suchas total debt service ratio. Other shave used the debt ratio in the medium and long
term (Myers, 2001). The debt ratio in the short term was also used by Titman (1984).As part of our analysis we propose to use the debt ratio as a measure of this variable. It should be noted that this ratio is calculated by:
Leverage ratios (LEV) = (total debt / total assets) (6)
This measure is also used by Koh (2003),Demaria and Dufour (2007), Jarboui and Olivero (2008), Ben Kraiem (2008)
and Sahut and Gharbi (2008) Azouzi and Jarboui (2012). To show that the manager uses debt or not, we can use the change in debt ratio. A positive change indicates the use of debt.
To note, theories regarding the board of directors, along with prior empirical researches and various recommendations
have suggested that some board characteristics have an influence on the quality of the financial report and on firms’ performance. Board characteristics are examined here: independence (Fama & Jensen, 1983).
The board’s independence
The different characteristics pertaining to the board’s independence are measured by the following variable:
BIND is defined as the percentage of the board members who are simultaneously independent and
non-executives which is equal to the number of outside directors divided by the total board members (Chtourou et al., 2001; Wright, 1996; Forker, 1992; Haniffa & Cooke, 2000 ).
BIND = number of outside directors /total board members. (8)
Table 4 presents the characteristics of boards of directors of the 100 Tunisian companies included in our study. Tunisian companies are run by independent boards, medium (seven directors) and not dominated by CEOs.
For simplification purposes, the summary of each variable extent range in the model, its name as well as its expected impact on the firm assets specificity choice are depicted in Table 5.
International Journal of Social Science Studies Vol. 6, No. 1; 2018
114
Table 5. Operational definitions of variables
Class : Phenomena : Mesure : Variables : Predictions :
Endogens variables :
Investment
decision
Assets
specificity
Asset Specificity Rate (ASR)
= intangible
assets / asset accounting.
AS
Investment level Free Cash Flow Rate (FCFR)
= Operating profit /
total assets.
and
it it
it
it
MVS D Q
A
INL
Investment
horizon
Capital Expenditure Rate
(CER) = operating assets /
Total assets
INH
Exogenous variables :
AS INL INH
Optimism
Directors
overestimate
capacity of their
firms
The questionnaire obtained
score
OP + + -
Profitability
Reports on
the company's
ability to meet
its commitments
ROA= Earnings before
interest, tax, depreciation
divided by total assets, lagged
one year period
PF + + -
Firm size Firms signaled
performance
Ln (total assets) LNSIZE + + +
Controls variables:
Debt level
Leverage ratios (LEV)= (total debt / total
assets)
Leverage ratios variation =
LEVN- LEVN-1 / LEVN-1
LEV - + +
Board Of
Directors
The presence of
independent
members in the
board
Number of outside
directors /total board
members.
BIND
-
+
+
3.3 Decision Tree Methods
A Decision tree is a flowchart-like tree structure where each internal node (non-leaf node) denotes a test on an attribute,
each branch represents an outcome of the test and each leaf node (terminal node) holds a class label. The topmost node in a tree is the root node.
International Journal of Social Science Studies Vol. 6, No. 1; 2018
115
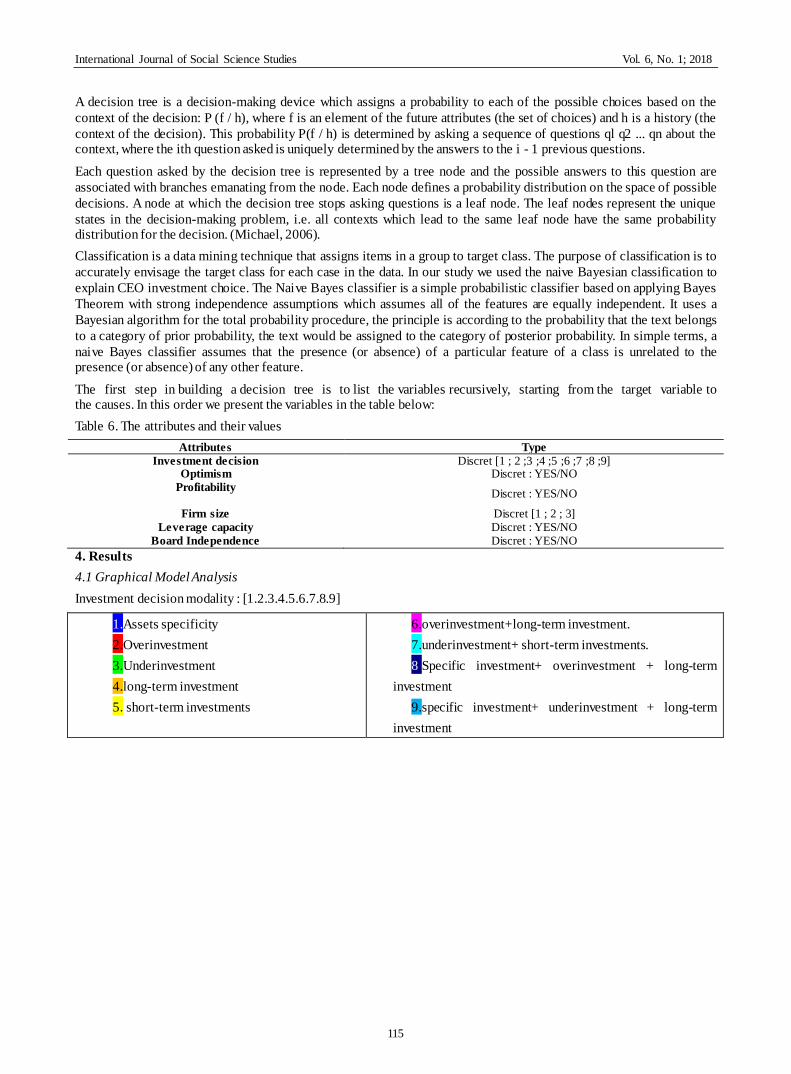
A decision tree is a decision-making device which assigns a probability to each of the possible choices based on the
context of the decision: P (f / h), where f is an element of the future attributes (the set of choices) and h is a history (the
context of the decision). This probability P(f / h) is determined by asking a sequence of questions ql q2 ... qn about the context, where the ith question asked is uniquely determined by the answers to the i - 1 previous questions.
Each question asked by the decision tree is represented by a tree node and the possible answers to this question are
associated with branches emanating from the node. Each node defines a probability distribution on the space of possible
decisions. A node at which the decision tree stops asking questions is a leaf node. The leaf nodes represent the unique
states in the decision-making problem, i.e. all contexts which lead to the same leaf node have the same probability distribution for the decision. (Michael, 2006).
Classification is a data mining technique that assigns items in a group to target class. The purpose of classification is to
accurately envisage the target class for each case in the data. In our study we used the naive Bayesian classification to
explain CEO investment choice. The Naive Bayes classifier is a simple probabilistic classifier based on applying Bayes
Theorem with strong independence assumptions which assumes all of the features are equally independent. It uses a
Bayesian algorithm for the total probability procedure, the principle is according to the probability that the text belongs
to a category of prior probability, the text would be assigned to the category of posterior probability. In simple terms, a
naive Bayes classifier assumes that the presence (or absence) of a particular feature of a class is unrelated to the presence (or absence) of any other feature.
The first step in building a decision tree is to list the variables recursively, starting from the target variable to the causes. In this order we present the variables in the table below:
Underinvestment+ short-term investments. 14 Specific investment+ overinvestment + long-term investment 12 specific investment+ underinvestment + long-term investment
9
Optimism 100 Yes :1 52 No : 0 48
Profitability 100 Yes :1 54 No : 0 46
Firm size 100 Small :1 66 Medium : 2 26 Big :3 8
Leverage capacity 100 Yes :1 75 No : 0 25
Board independency 100 Yes :1 69 No : 0 31
Note that the decision tree that has been built gives us information on the relevance of attributes about the target variable (investment decision preference):
International Journal of Social Science Studies Vol. 6, No. 1; 2018
117
The graphical model shows that the size is variable "is the first variable used; is called segmentation variable. This is the
most relevant in the analysis of investment preferences leader in (P = 0.14 for the choice of investment mode 7
Underinvestment + Short-term Investments). As it is composed of three terms {small, medium, and large}, so she produced three peaks children.
The first edge (the first leg), left, on the second level, is produced from the "average" category of the variable "size". The
resulting top cover 2 observation. It indicates the level of optimism leader {Yes / No}. The frequency distribution shows
that for a leader to midsize business and optimistic chosen investment mode 4 namely long-term investment with a probability of 23.1%.
The second ridge in the center corresponds to the "large" category of the segmentation variable "size"; the corresponding
vertex cover 2 observation. It shows the profitability level of the company {Yes/ No}. The frequency distribution shows
that for a large company is performing selected one of the investment terms are: asset specificity with a probability of 25.1%.
The third ridge, right, is the "small" category of the segmentation variable "size"; the corresponding vertex cover 2
observation. It indicates the degree of independence of the board {Yes / No}. The frequency distribution shows that, for
the Tunisian small businesses that their advice is independent, leaders prefer a combination of underinvestment + short-term Investments with a probability of 13.6%.
Let the third level of the tree to the left, we see that the variable optimism turns into a segmentation variable. As it is
composed of two modality {Yes / No}, we note the presence of two branches. Thus, the first edge on the left, on the third
level, is produced from the "no" category of the variable "optimism". The resulting top cover 2 observation. It indicates
the level of indebtedness of the company {Yes/ No}. The frequency distribution shows that the leaders of indebted firms
prefer short-term Investments with a probability of 27.3% due to their low levels of optimism. The second part is
produced from the modality "yes" to the variable "optimism". The resulting top cover 2 observation. It indicates the level
of indebtedness of the company {Yes / No}. The frequency distribution shows that the leaders of indebted firms prefer
long-term investment with a probability of 26.7% due to their high levels of optimism. Still remain on the third level to the
right of the tree, there is the variable of board independence as segmentation variable. As it is composed of two modality
{yes / no}, we note the presence of two branches. Thus, the first edge on the left, on the third level, is produced from the
modality "yes" to the variable "independent counsel." The resulting top cover 2 observation. It indicates the level of
profitability of the company {Yes / No}. The frequency distribution shows that the leaders of profitable enterprises with
independent advice and choose the short-term Investments with a probability of 14%. The second part is produced from
the "no" category of the variable "independent counsel." The resulting top cover 2 observation. It indicates the level of
profitability of the company {Yes/ No}. The frequency distribution shows the least profitable companies that their advice is independent opting for short-term underinvestment + Investments to probabilté 25%.
This process is repeated on each vertex of the tree until pure leaves. Thus, the pure or pure tree leaf in our study
corresponds to level 5. The right part of level 5 shows that companies, debt, cost, small size, and independent advice to
choose the assets specificity and short-term Investments with the following probabilities: 30% and 25% due to high level
optimism of their leaders. We also note that Tunisian companies small, profitable, less leveraged and independent advice
leaders have a low level of optimism. this low incentive to undertake long-term + overinvestment and underinvestment investment with probability of 100% and 50%.
Let the left of the pure tree parts, the results of our classification argue that optimistic leaders Tunisian midsize businesses,
profitable, debt opt for Specific Investment underinvestment + + long-term investment with a probability of 33.33%. They
use long-term investment with a probability of 50% if the profitability of their firms is low. Then these leaders realize the
optimistic underinvestment + short-term Investments with a probability of 50% when the level of board independence and
corporate debt levels are low. However, companies use short-term Investments with a probability of 66.7%. This choice is
justified by the low level of optimism leaders despite high profitability of these firms. Thus, this low level of CEO
optimism is explained by the presence of high debt ratios. not optimistic that uses the underinvestment leader with a probability of 50% due to the decrease in the profitability of its business.
4.2 Cross Validation Analysis
For measuring performance classification techniques the following parameters are taken. In Classification techniques, parameters to be examined are accuracy, sensitivity, precision, specificity and f-measure (table8).
International Journal of Social Science Studies Vol. 6, No. 1; 2018
Accuracy is the percent of correct classifications. Accuracy is the overall correctness of the model and is calculated as
the sum of correct classifications divided by the total number of classifications. We note that this ratio is low for 9 classes of investment decision (11%).
Sensitivity
Sensitivity is a measure of the ability of a prediction model to select instances of a certain class from a data set. It is
corresponds to the true positive rate. We note that the investment preferences of Tunisian companies are divided into the following 4 conditions:
- Assets specificity with a completion rate of 40%;
- Long-term -investment with a completion rate of 15.83%;
- Short -term- -investment with a completion rate of 33.33% and
- Specific investment underinvestment + + long-term investment with a completion rate of 11.11%.
The probability of the other classes (5 terms) is zero.
International Journal of Social Science Studies Vol. 6, No. 1; 2018
119
4.2.2 Specificity
specificity measures the proportion of negatives who are correctly identified (e.g. the percentage of well people who are
identified as not having the condition). In our study the specificity measures the percentage of companies that have not
chosen the investment mode. we note that this percentage between 70% and 90%. This is explained by the Tunisian leaders made that are not aware of the presence of these terms.
F- mesure
It corresponds to the margin of error around the exact solution. we note that the investment preferences of Tunisian companies are divided into the following 4 conditions with a low margin of error between 0.09 and 0.28:
- Assets specificity with an error rate of 27.59%;
- Long-term investment with an error rate of 13.33%;
- Short -term investment with an error rate of 21.62% and
- Specific investment+ underinvestment + long-term investment with an error rate of 9.52%.
We note that all the variables chosen for the analysis of preferences for investment managers (the size of the company,
the optimism of the leader, the level of indebtedness and the independence of the board) explain that the following 4 investment categories namely:
• Assets specificity: This result affirms our theoretical prediction (H1): Optimistic leader accepts level of asset
specificity greater than rational leader. Thus, these leaders are optimistic about firms performance (profitability and
leverage capacity) to invest in innovative and specific projects. They have specific information that will allow them
direct access to critical resources and to master the uncertainty and risk of technological innovation projects. As a result,
the optimism of the leader beyond the problem of managerial opportunism described by agency theory in specific projects (Azouzi and Jarboui, 2012;2013).
• Long- term investment: This result confirms our hypothesis (H3): The preference of the manager for long-term
investment projects increases the underestimation of the success of an operation to take control (a high level of
optimism ). Optimistic and overly confident leader is inclined believe have control over investment projects. It will tend
to overestimate its ability to control outcomes thinking that the risk can be reduced by good use of his professional skills. It opted for long-term investment risk in order to align its interests with those of shareholders.
• Short term investment: This result rejects our third hypothesis. Older leaders seek to replace the stock performance
indicators by accounting indicators (ie short-term). This effect is even more important if the date of departure of the head of the company coincides with his retirement as reputation within the network of leaders is no longer a constraint.
• The combination of specific investment +underinvestment+long term investment: Optimistic leaders believe that
the market undervalues their companies and may reject positive NPV investments to be financed by external resources.
This prediction formulated the same conclusion that theories based on asymmetric information, that is to say, under-investment firms when cash at their disposal and their debt capacity is insufficient.
5. Conclusion
This research examines the determinants of firms’ investment policy introducing a behavioral perspective. Theoretical analysis presented implications of managerial optimism to explain his preference for investment decision.
leader affected prefer asset specificity high level allowing. Thus, An optimistic leader about his firm productive capacity
to invest more in specific assets to transform power relations with its shareholders or partners of the company. It is now insured against the risk of takeover.
The managerial optimism analysis of Investment level suggested two predictions:
Optimistic leaders believe that the market undervalues their companies and may reject positive NPV investments
to be financed by external resources. This prediction formulated the same conclusion that theories based on asymmetric information, that is to say, under-investment firms when cash at their disposal and their debt capacity is insufficient.
Optimistic leaders overestimate their investment projects and may invest in projects they believe profitable but
whose NPV is negative. As a result, optimism executive produces the same result as highlighted by the theories based
on the agency relationship between managers and shareholders relationship: leaders tend to use the free cash flow and debt capacity to over-invest.
The relationship between investment horizon and optimism shows that CEO optimism level is positively correlated with
a preference for long term investment. leaders realize optimistic forecasts and seek to confirm its strategic levers. So
International Journal of Social Science Studies Vol. 6, No. 1; 2018
120
they use the decision Investment as a confirmation of the expected results. They opt for long-term investment risky and expensive that they hope the realization of a equivalent to their forecasts profitability.
Empirical analysis presenting survey CEO large private companies in Tunisia. Data analyses
revealed CEO optimism level importance in explaining his investment decision. the decision tree analysis of the
relationship between optimism level and investment policy confirm theoretical prediction. Thus, decision tree cross
validation analysis suggested that investment preferences of Tunisian companies are divided into the following 4 conditions with a low margin of error between 0.09 and 0.28:
- Assets specificity with an error rate of 27.59%;
- Long-term -investment with an error rate of 13.33%;
- Short -term- -investment with an error rate of 21.62% and
- Specific investment +underinvestment +long-term investment with an error rate of 9.52%.
Finally, this paper proposes a decision tree model for specifying the importance of CEO optimism level causing
investment decision analysis. Thus, decision tree model postulate that CEO investment decisions analysis by integrating
the behavioral dimension is consistent with the corporate financial theory (agency theory, transaction cost and
consolidation), the leader affected by behavioral biases (optimism) adjusts its investment choices based on their ability to assess alternatives to create of shareholder value and ensure its place at the head of the management team.
References
Azouzi, M. A., & Jarboui, A. (2014). Emotional intelligence CEO and firm financial policy Bayesian Network Method. Contemporary Economics, 8(1), 5-24. https://doi.org/10.5709/ce.1897-9254.128
Azouzi, M. A., & Jarboui, A. (2012). CEO Emotional Bias and Investment Decision, Bayesian Network Method. Management Science Letters, 2(4), 1259-1278. https://doi.org/10.5267/j.msl.2012.02.012
Azouzi, M. A., & Jarboui, A. (2013). Why Emotional Biases Affect Firm CEO Assets Specificity Bayesian Network Method Choice: The Evidence From Tunisia. Asian Journal of Empirical Research, 3(3), 329-350.
Baker, M., Richard, S. R., & Wurgler, J. (2007). Behavioral Corporate Finance. The Handbook of Corporate Finance, 1, 145-186. https://doi.org/10.1016/B978-0-444-53265-7.50018-4
Bazerman, M. H. (2006). Judgment in Managerial Decision Making , 6éme Ed.. Hoboken, NJ: John Wiley. Behavioral Economics, June.
Ben Kraiem, R. (2008), The influence of institutional investors on opportunistic earnings management», International
Journal of Accounting Auditing and Performance Evaluation, 5(1), 89-106. https://doi.org/10.1504/IJAAPE.2008.020195
Bertrand, M., & Schoar, A. (2003), Managing with style: the effect of managers on firm policies. Quarterly Journal of Economics, 118, 301-330. https://doi.org/10.1162/003355303322552775
Bolton, L., & Heath, C. (2004). Believing in first mover advantage , Working Paper, Wharton School. University of Pennsylvania, 1-47.
Boot, A. W., Milbourn, T., & Thakor A. (2005). Sunflower management and capital budgeting. Journal of Business, 78(2), 501-527. https://doi.org/10.1086/427636
Bronwyn, H. (1993). R&D Tax Policy in the Eighties: Success or Failure? Tax Policy and the Economy, 7, 1-36. https://doi.org/10.1086/tpe.7.20060628
Bujadi, M. L., & Richardson, A. J. (1997). A Citation Trail Review of the Uses of Firm Size in Accounting Research. Journal of Accounting literature, 16, 1-27.
Camerer, C. (2003). The behavioral challenge to economics: Understanding normal people, Federal Reserve of Boston meeting on “How Humans Behave”, 8-10 juin 2003.
Cazavan-Jeny, A. (2004). Le ratio market-to-book et la reconnaissance des immatériels- une étude du marché français. ComptabilitéContrôle Audit, 10(2). https://doi.org/10.3917/cca.102.0099
Chang, C., Lee, A. C., & Lee, C. F. (2009). Determinants of capital structure choice: A structural equation modeling approach. The Quarterly Review of Economics and Finance, 49, 197-213. https://doi.org/10.1016/j.qref.2008.03.004
Chtourou, S. Bédard, J., & Couteau, L. (2001). corporate governance and earning management. Working Paper, Laval University, (2001).
International Journal of Social Science Studies Vol. 6, No. 1; 2018
121
Chung, K. H., & Pruitt, S. W. (1994). A Simple Approximation of Tobin’s Q . Financial Management, 23(3), 70-74. https://doi.org/10.2307/3665623
Cliche, A. (2000). Les déterminants de la gestion des risques par les entreprises non financières : une revue de la littérature. Cahier de recherche, 1206-3290.
Cockburn, I., & Griliches, Z. (1988). Industry effects and appropriability measures in the stock marke t. American Economic Review, 78(2), 419-424.
David, P., Hitt, M. A., & ET Gimeno, I. J. (2001). the influence of activism by institutional investors on R&D. Academy of Management Journal, 44(1), 144-157. https://doi.org/10.2307/3069342
Draief, S. (2010). Structure Financière, Gestion Des Résultats Et Caractéristiques De La Firme. Comptabilité, contrôle , audit et institutions, halshs-00578113, version 1, 18 décembre.
Dufour, D., & Molay, E. (2010). La Structure Financière des PME Françaises: Une Analyse Sectorielle sur Données de Panel, Manuscrit auteur, publié dans Crises et nouvelles problématique de la valeur, Nice, hal-00479529, version 1.
Edlin, A., & Stiglitz, J. E. (1995). Discouraging Rivals: Managerial Rent-Seeking and Economic Inefficiencies.American Economic Review, 85(5), 1301-12. (Also NBER Working Paper 4145, 1992.).
Fama, E. F. (1980). Agency problems and the theory of the firm. Journal of Political Economy, 88(2), 288-307. https://doi.org/10.1086/260866
Fama, E. F., & French, K. R. (2002). Testing tradeoff and pecking order predictions about dividends and debt. Review of Financial Studies, 15, 1-33. https://doi.org/10.1093/rfs/15.1.1
Fama, E. F., & Jensen, M. C. (1983). Separation of ownership and control. Journal of Law and Economics, 26(2), 301-325. https://doi.org/10.1086/467037
Felton, J., Gibson, B., & Sanbonmatsu, D. (2003). Preference for Risk in Investing as a Function of Trait Optimism and Gender. The Journal of Behavioral Finance, 4(1), 33-40. https://doi.org/10.1207/S15427579JPFM0401_05
Forker, J. J. (1992) corporate governance and disclosure quality. Accounting and Business Research, 22, 111-121. Forker,
J. J. (1992) corporate governance and disclosure quality. Accounting and Business Research, 22, 111-121. https://doi.org/10.1080/00014788.1992.9729426
Gervais, S., & Odean, T. (2001). Learning to Be Overconfident. Review of Financial Studies, 14(1), 1-27. https://doi.org/10.1093/rfs/14.1.1
Gervais, S., Heaton, J. B., & Odean, T. (2002). The positive role of overconfidence and optimism in investment policy. Mimeo, University Of California, Berkeley.
Gervais, S., Heaton, J. B., & Odean, T. (2010). Overconfidence, compensation contracts, and capital budgeting. Journal of Finance, 3, 83-128.
Gibson, B., & Sanbonmatsu, D. (2004). The downside of optimism. Personality and Social Psychology, 30(1), 149-160. https://doi.org/10.1177/0146167203259929
Girard, B. (1997). Pourquoi les PME restent-elles PME ? Annales des Mines, Gérer et comprendre, 8, 3-4.
Griliches, Z. (1981). Market value, R&D and patents. Economic Letters, 7(2), 183-187. https://doi.org/10.1016/0165-1765(87)90114-5
Gul, F. A., & Tsui, J. S. L. (1998). A test of the free cash flow and debt monitoring hypotheses : Evidence from audit pricing. Journal of Accounting and Economics, 24, 219-237. https://doi.org/10.1016/S0165-4101(98)00006-8
Hache, J. (2005), Les enjeux des biotechnologies , EMS Management & Société 254. http://www.worldcat.org/
Hackbarth, D. (2008). Managerial Traits and Capital Structure Decisions. Journal of financial and quantitative analysis, 43(4), 843-882. https://doi.org/10.1017/S002210900001437X
Hackbarth, D. (2009). Determinants of corporate borrowing: A behavioral perspective. Journal of Corporate Finance, 15, 389-411. https://doi.org/10.1016/j.jcorpfin.2009.02.001
Haniffa, R., & Cooke, T. (2000, 28-30 August).Culture, corporate governance and disclosure in Malaysian corporations. Asian AAA World conference, Singapore.
Hawkins, S. A., Hoch, S. J., & Meyers-Levy, J. (2001), Low-involvement learning: Repetition and coherence in familiarity and belief. Journal of Consumer Psychology, 11, 1-11. https://doi.org/10.1207/S15327663JCP1101_1
Heaton, J. (2002). Managerial optimism and corporate finance. Financial Management, 31, 33-45.
International Journal of Social Science Studies Vol. 6, No. 1; 2018
122
https://doi.org/10.2307/3666221
Hong, H., Kubik, J., & ET Solomon, A. (2000). Security analysts' career concerns and herding of earnings forecasts. Rand Journal of Economics, 31(1), 121-144. https://doi.org/10.2307/2601032
Hovakimian, A., Hovakimian, G., & Tehranian, H. (2004). Determinants of target capital structure: The case of dual debt and equity issues. Journal of Financial Economics, 71, 517-540. https://doi.org/10.1016/S0304-405X(03)00181-8
Jaggi, B., & Gul, F. A. (1999). An analysis of joint effects of investment opportunity set, free cash flows and size on
corporate debt policy. Review of Quantitative Finance and Accounting, 12(4), 371-381. https://doi.org/10.1023/A:1008354509316
Jarboui, A., & Olivero, B. (2008). Le couple Risque/Horizon temporel des investissements est-il gouverné par les
institutionnels et les actionnaires dominants? [The couple risk/time horizon of the investment being governed by institutional and dominant shareholders?] Banque et Marchés [Bank and Markets], 93, 20-34.
Koh, P. S. (2003). On the association between institutional ownership and aggressive corporate earnings management in Australia. The British Accounting Review, 35, 105-128. https://doi.org/10.1016/S0890-8389(03)00014-3
Lang, L., Stulz, R. M., & Walkling, R. A. (1991). A test of free cash-flow hypothesis the cash of bidder return. Journal of Financial Economics, 29, 315-335. https://doi.org/10.1016/0304-405X(91)90005-5
Lehn, K., & Poulsen, A. B. (1989). Free Cash Flow and Stockholder Gains in Going Private Transactions. Journal of Finance, 44, 771-787. https://doi.org/10.1111/j.1540-6261.1989.tb04390.x
Lindenberg, E., & Ross S. (1981). Tobin's q ratio and industrial organization. Journal of Business, 54(1), 1-32. https://doi.org/10.1086/296120
Malmendier, U., & Tate, G. (2005). CEO overconfidence and corporate investment. Journal of Finance, 60(6), 2661-2700. https://doi.org/10.1111/j.1540-6261.2005.00813.x
Malmendier, U., & Tate, G. (2008). Who makes acquisitions?, CEO overconfidence and the market’s reaction. Journal of Financial Economics, 89, 20-43. https://doi.org/10.1016/j.jfineco.2007.07.002
Malmendier, U., Tate, G., & Yan, J. (2010). Managerial beliefs and corporate financial policies. Working Paper, n°105, UC Berkeley and UC Los Angeles, Faculty.fuqua.duke.edu.
Megna, P., & Klock, L. (1993). The impact of intangible capital on Tobin’s Q in the semiconductor industry. American Economic Review, 265-269.
Michael, N. (2006). Large database decision tree classifiers; Decision Trees & Data Mining, March 2006.
Moussu, C., & Thibierge C. (1997). Politique financière, opportunité d’investissement et actifs immatériels en Europe : théorie et étude empirique. Banque et marchés n°30, septembre- octobre, 6-21.
Myers, S. C. (2001) Capital structure. Journal of Economic Perspectives, 15, 81-102. https://doi.org/10.1257/jep.15.2.81
Myers, S. C., & Majluf, N. S. (1984). Corporate financing and investment decisions when firms have information that investors do not have. Journal of financial economics, 13, 187-221. https://doi.org/10.1016/0304-405X(84)90023-0
Narayanan, V. K. (1985), Managerial incentives for short-term results. Journal of Finance, 60, 1469-1484. https://doi.org/10.1111/j.1540-6261.1985.tb02395.x
Rajan, R., & Zingales, L. (1998). Power in a theory of the firm. Quarterly Journal of Economics, 133(2), 387-432. https://doi.org/10.1162/003355398555630
Sahut, J. M., & Gharbi, O. (2008), Investisseurs institutionnels et valeur de la firme, papier de travail, Université de Poitiers et Université Paul Cézanne.
Schleifer, A., & Vishny, R. W. (1989), Management entrenchment: the case manager-specific investments. Journal of Financial Economics, 25, 123-139. https://doi.org/10.1016/0304-405X(89)90099-8
Skinner, D. (1993). The investment opportunity set and accounting procedure choice: Preliminary evidence. Journal of Accounting and Economics, 16(4), 407-445. https://doi.org/10.1016/0165-4101(93)90034-D
Thibierge, C. (2001). Actifs immatériels, valorisation boursière et contrainte d'endettement : étude empirique sur les
marchés français et espagnol. Congrès international de l'Association Française de Finance, Namur, 28-30, http://www.fundp.ac.be/eco/affi2001/main.html
Titman, S. (1984). The effect of capital Structure on a firm’s liquidation decision. Journal of Financial Economics, 13, 137-151. https://doi.org/10.1016/0304-405X(84)90035-7
International Journal of Social Science Studies Vol. 6, No. 1; 2018
123
Weinstein N. D., (1980),Unrealistic optimism about future life events. Journal of Personality and Social Psychology, 39(5), 806-820. https://doi.org/10.1037/0022-3514.39.5.806
Wright, D. W. (1996) Evidence on the relation between corporate governance characteristics and the quality of financial reporting. Working Paper, University of Michigan.
Copyrights
Copyright for this article is retained by the author(s), with first publication rights granted to the journal.
This is an open-access article distributed under the terms and conditions of the Creative Commons Attribution license
which permits unrestricted use, distribution, and reproduction in any medium, provided the original work is properly cited.