36
Dr. Manu CARRICANO Director Pricing Center, EADA Business School Director Research, Pricing Solutions Europe
| Date post: | 17-Jul-2015 |
| Category: |
Documents |
| Upload: | manu-carricano-phd |
| View: | 90 times |
| Download: | 2 times |
Dr. Manu CARRICANODirector Pricing Center, EADA Business School
Director Research, Pricing Solutions Europe

THE RULE OF ALL RULES:“PRICING IS HIGHLY REWARDING”
Jan’00/Jun’11 analysis by
+ 90% (2000 – 2011)
+50% (2008 – 2011)
S&P 500 vs Pricing Virtuosos Weighted Index
Source: Compustat, F500 & S&P 500


Pluralitas non est ponenda sine necessitate
Plurality must never be posited
without necessityWilliam of Ockham

What is a rule?

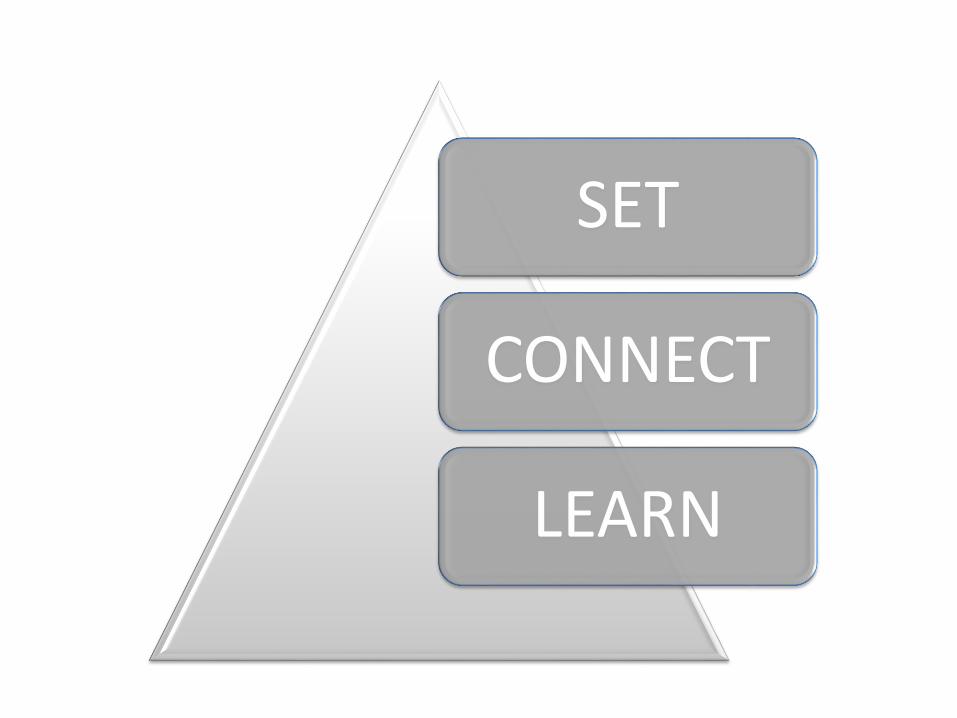
SET
CONNECT
LEARN

SET
CONNECT
LEARN

Rule #1:“Garbage in, Garbage out”

Transactional Data
Customer Data
Product Data
Transactional Must Have Data • Invoice Number/ Lines – Unique
identification Number
• Time (Year, month, day, time, etc.)
• Volume (Quantity)
• Price
• Levers
Customer Must Have Data• Customer number - Unique number
for each Customer
• Customer Name
• Segments (transactional)
• Geography (Country, Region, City, etc.)
• Related KPIs
Product Must Have Data• Product Number - Unique number for
each Product
• Product Name
• Segments (transactional)
• Brand
• Category
Start With Must Have Data…

… But do not forget scalability
ERP
Research
Socio-Market
Data
CRM
+
+Data from Pricing Optimization:• Predefined Calibrated Scenarios
• Optimal SO & Net Price points
• Competitive & Market DisruptionIntelligence
Transactional Pricing Analytics
Data from Value-Based Analytics:• Behavioral Segmentation
• Value Perception / Utilities
• Premium/ Elasticity / Market Response

Rule #2:“Granularity+Segmentation
= Visibility”.
.
. . .
.
..
.
.
.
.
.
.
.
.
.
.

Segmentation is Key

Rule #3 :“Describe patterns to create awareness”

What do you see?
$
%

Different segments, different conditions
$
%

$
%

What should we see?

What should we see?
$
%
Corridor Sell-out /
Mini Net Price
Sell-out vs
Mini Net Price
Trade-offs


Elasticity vs demand response curve accuracy
Optimal Price
Polynomial Regression (degree 6)
Q
P

SET
CONNECT
LEARN


Calibration: linking estimated price points to oberved price points
Premium
Premium
% V
olu
me
at
Ris
k%
Vo
lum
ea
t R
isk

Scenarios: Relate an optimal value at a certain stage
with dependent actions to be taken
Optimal
Condition 2
Optimal
Cost of Sales
Decided Sell-Out
Optimal
Condition 1
Optimal
Net Price
COGS
Gross Margin

Z (
Pro
fita
bili
ty)
Optimization: Identification of winning scenario among mutuallyexclusive / conjointly exhaustive options available

SET
CONNECT
LEARN
Rule #6 :“You can’t manage what you don’t measure”

Learn from controlled experiments: Execution as a source of data for optimization

Learn how to track & document disruptions: Variance analysis is at the heart of Pricing
-20%
-15%
-10%
-5%
0%
5%
10%
15%
20%
25%
30%
35%
40%
45%
50%
-250
-125
0
125
250
375
500
625
750
875
1000
Consolidated Crop Commodity Price Index ($/ton) BR Price variance without Gly (%)
SYN Price variance without BR and Gly (%)
t
Price Commodity Index
Price Variance BU 1
Price Variance BU 2
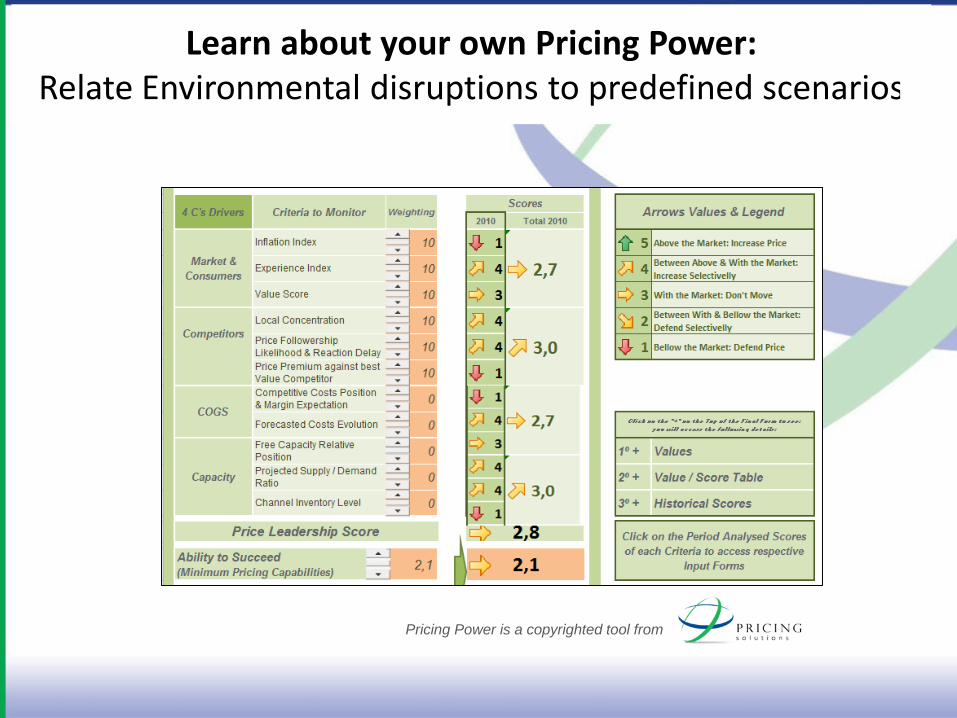
Learn about your own Pricing Power: Relate Environmental disruptions to predefined scenarios
Pricing Power is a copyrighted tool from

Learn how to Track Performance: Pricing Dashboards as a key element of change
ProfitabilityVolume
Gross Profit Margin
Net ProfitMargin
YTD Profit
Gross Profit Margin
Net ProfitMargin
$
SalesVariance
Gross SalesVariance
Net Sales Variance
PriceVariance
Gross PriceVariance
Net Price Variance
Pocket Margin
Variance
Other
MS
MixVariance
SoWSales Effectiveness
Premium
Price Volume
Elasticity
EfficiencyROI
PricingPower
Brand Equity
Competitiveness
PricingLeadership
Relative COGS

As a Wrap Up…

SET
LEARN
CONNECT
#3
Patterns
#6 Control


![[New Gpes]User Manual En](https://static.documents.pub/doc/80x56/55cf94dc550346f57ba4e346/new-gpesuser-manual-en.jpg)