55
Card Sort Test CogQuiz Neuropsychological Assessment Tests Figure 1 CONTENTS: 1) CogQuiz Card Sort Test…………………………...………...…. .3 2) A Brief History of Sorting Tasks…….………………………..…. 3 1
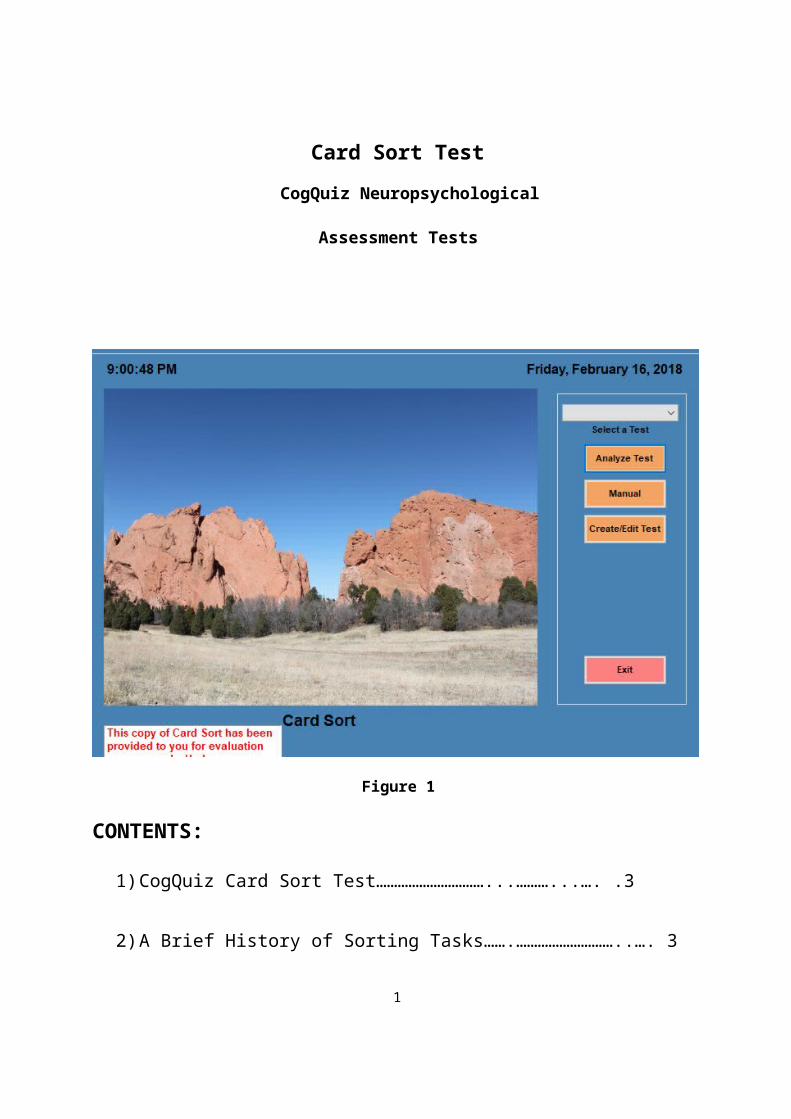
Card Sort TestCogQuiz Neuropsychological
Assessment Tests
Figure 1
CONTENTS:
1) CogQuiz Card Sort Test…………………………...………...…. .3
2) A Brief History of Sorting Tasks…….………………………..…. 3
1

3) Registering Your New Test………………………………………8
4) Executing a Card Sort Test…………………..………………….5
5) Analysis of Results………………………………….…………..12
6) Creating and Editing a Card Sort Test…..…….………………20
7) Normative Data………………………………………………….29
8) References………………………………………………….……36
2
Card Sort TestCogQuiz Neuropsychological Assessment Tests card sorting task provides considerable
flexibility in task definition. The number of stimulus cards can range from two to five and
the number of sort dimensions, from two to five. One of the categories can be user
defined, allowing for the definition of classes of stimuli. The card definition tool allows test
authors to create their own stimulus and response card definitions. Cards can display
alpha/numeric characters, any image that can be realized as a “dingbat” or words.
Response card decks can be of any size and their presentation can be controlled either
by the participant or the computer. Category (stage) shifts can be either signaled or
unsignaled. For example, in the Nelson (1976) Modified Card Sorting Test after
successfully completing a criterion run the participant is signaled that the matching
criterion will shift. All test messages and instructions can be tailored to meet the needs of
the test author. Participant response modalities include “point and click” and touch.
Tests can be analyzed using any one of three analysis protocols or the test user can print
a basic analysis sheet displaying basic participant performance for “hand” analysis. The
package comes with normative data collected on over 3000 participants grouped in age
cohorts from five to nine years, 10 to 14 years, 15 to 19 years and in 10 year groups from
the twenties through the eighties on the Card Sort Test. As Tien, et al., 1996, Feldstein, et
al., 1999, and Steinmetz, 2010 have all shown significant outcome differences between
manually administered card sorting tests and tests administered using a computer. This
normative data set on one of the six card sorting tests that comes with this highly flexible
set of computerized card sort tests represents a considerable step forward in computer
based card sorting tasks.
A Brief History of Sorting Tasks
The use of sorting tasks has a long history in the assessment of cognitive performance.
At the beginning of the last century the development of concepts by children was thought
to be governed by an “associative” process similar to ones described by Hume, Locke,
John Stuart Mill and later Bain and Wundt. Narziss Ach, however, was convinced that
mere association was not sufficient to account for the complexity of acquired concepts or
3
the interrelationships among those concepts (e.g., abstract properties, “hierarchal”
organization, etc.). He was also uneasy with the methodological
technique of “scientific introspection” (Wundt, 1873) then favored by “experimental
psychologists.” As part of his research program he developed a sorting task in which
subjects were asked to assign objects that varied in shape, size, color and weight to a
series of nonsense syllables that were assigned arbitrary meanings (e.g. “all pyramids,”
“all large, red, heavy balls”). Cards with these arbitrary syllables printed on them would be
placed at various locations on a table along with a collection of objects. The Subjects first
memorized the nonsense syllables and were then instructed to place the objects on the
card they thought named the characteristics of the object. They were given feedback
indicating whether they had correctly assigned an object to a card. The procedure
allowed Ach to observe directly the subject’s development of competency in making
assignments rather than depending on their “introspective” description of that
competency.
The use of sorting tasks in neuropsychology can be traced to the work of Gelb and
Goldstein (1920) in their work on color amnesia in head injured veterans of the First
World War. He used as his sorting task the Holmgren Test for Color Blindness
developed by Fithiof Holmgren (1831-1897) in 1876 and subsequently modified by
William Thomas. The test consisted of three differently colored, labeled standard stimuli
(small skeins of yarn), and forty labeled skeins of varying color. The Subject was first
asked to select ten skeins from the collection of forty that most closely matched the first
standard, next to select five skeins from the remaining thirty that most closely matched
the second standard and finally select five skeins from the remaining twenty-five that
most closely matched the third standard. Although this task was designed to detect color
blindness, it also proved useful in distinguishing neurological and psychiatric patients
(who were not color blind) from normal individuals. Normal individuals could select colors
that approximated the standard while impaired individuals could not (e.g. could not
classify a light green or a dark green as green when the standard was green). This
series of observations would lead Goldstein to formulate his distinction between
concrete and abstract attitudes; Unimpaired individuals can abstract the relevant
characteristics of the match, while impaired individuals continue to focus on its concrete
4
characteristics, precluding the proper selection of skeins that only approximately
matched the standard. Gelb and Goldstein continued to develop variations on this basic
color sorting test in their work with neurological patients.
While resident at the Institut zur Erforschung der Folgeerscheinungen von
Hirnverletzungen, an institute for the study of brain-injured soldiers, found in 1916, by
Goldstein in collaboration with Gelb, Egon Weigl (1901-1979) extended their work to
include the ability to shift classification categories. His work was first published in 1927 in
the German publication Zeitschrift Psychologie under the title “Zur Psychologie
sogenannter Abstraktionprozesse”, but because of its importance it was translated into
English and republished in 1942 (Weigl, 1942). Weigl was interested in the ability of
neurological patients to “shift” their sorting perspective from one dimension to another.
L.R., a patient with frontal lobe injury, exhibited the same inability to sort color samples
based on a standard color as had been seen earlier by Gleb and Goldstein in
neurological patients. In addition, L.R. was unable to “shift” between two possible sorting
dimensions on a relatively simple sorting task. Weigl presented L.R. with 12 cardboard
shapes (four equilateral triangles, four squares and four ovals). Each member of a shape
type was colored red, green, yellow or blue. The 12 colored shapes were randomly laid
out before R. and he was asked to arrange them into groupings that made sense to him.
L.R’s. solution was first to create a column with the red triangle at the top, the red oval
immediately below the triangle and the red square below the oval. L.R. then proceeded
to replicate this arrangement of shapes for each color, yellow then green and finally blue
in columns positioned immediately adjacent to the first column. When asked if he could
think of another way of sorting the colored shapes, he after some consideration swapped
the row containing the oval with the row containing the squares. He was not able to shift
to “shape” as the sorting category, although he was able to sort correctly on shape when
the 12 objects were turned over revealing a homogenous white surface. Normal subjects
tested by Weigl showed no difficulty in shifting between color and shape as the relevant
sorting dimension and with one exception simply piled the shapes together in the
relevant category. The one exception when sorting to color, organized the four groupings
in much the same way as L.R. Subsequent variations on this study and other studies
5
using three dimensional everyday objects produced similar outcomes which are
fascinating (particularly the ones with children who seem to classify on the basis of an
invented narrative rather than categories), but are beyond the scope of this discussion.
Harry Harlow’s (1905-1981) work with primates on “learning how to learn efficiently in the
situations the animal frequently encounters,” or “learning sets” in part set the context in
which Esta Berg developed a card sorting test. Harlow’s interest in learning sets grew out
of his concern that the study of learning as it was then pursued by “theoretical
psychologists” was conducted in such rigorously controlled conditions that obtained
experimental results had little or no utility in a world outside the laboratory. In a learning
set paradigm the subject is present with two (sometimes more) stimulus objects. Under
one of the objects is to be found a reinforcing stimulus (in the case of infra-human
primates a morsel of tasty food and in the case of humans either food or more likely
some desirable object). The stimulus objects can be arranged in several ways but the
reinforcer in the basic paradigm is always to be found under the same object. The
dependent variable of concern is the number of trials required to identify and reliably
choose the object concealing the reinforcer, and the change in the value of that variable
over a number of sequentially present problems (a problem is defined as a stimulus set).
Typically subjects show a decrease in the number of trials required to reliably identify the
object under which the reinforcer is hidden. A variation on this basic paradigm is to
sometimes consistently conceal the reinforcer under one of the objects in the object pair
(object–quality discrimination) and at other times conceal the reinforcer under the object
in a particular location (either left-position discrimination or right-position discrimination).
Zable and Harlow (1945) showed that monkeys (rhesus) could reliably learn both object-
quality and position discriminations and also learn to reliably shift between discrimination
types (object or positions) when the problem set changed. Settlage, Zable, & Harlow
(1947) extended those findings to rhesus monkeys following “bilateral removal of the
frontal areas” showing them to be capable but less efficient than normal animals on such
a shift task.
Harlow eager to extend his findings into the human realm approached his colleague,
David Grant. Together they designed the framework for extending the work of Harlow to
human subjects and then turned the project over to Esta Berg as the topic for her
6
master’s thesis (Eling, Derckx & Maes, 2008). The design of that study resulted in the
development of a 60 card deck (response cards), where each card contained from one
to four identical figures (stars, crosses, triangles, and circles) all identically colored in
one of four colors (red, yellow, blue, and green). Each card was unique in its
configuration of figure, figure color, and figure count. Four cards (one red triangle, two
green stars, three yellow crosses and four blue circles) were duplicated to serve as
stimulus cards. The stimulus cards were laid out in row such that from the subjects left to
right the one red triangle appeared to the far left of the row, the two green stars
immediately to its right, the three yellow crosses to the right of that, and the four blue
circles on the far right end of the row. The subjects were told to place “these cards [from
the response card deck] into four groups, underneath the ones lying on the table. I will
tell you whether you are ‘right’ or ‘wrong’.” The initial “correct” category was arbitrarily
chosen from among the three dimensions, figure, color, and count on which each card
varied. After sorting correctly five successive cards the “correct” category was shift to
one of the two remaining categories and then following five successive correct sorts to
that category the “correct” category was shifted to the remaining category. A new
category was then arbitrarily chosen and the procedure just outlined was followed again
and then followed for third time for a total of nine successive sorting categories. If the
subjected exhausted the response deck, the deck was shuffled and given back to the
subject for a second time.
Grant and Berg (1948) modified this procedure, extending the size of the response deck
to 64, allowing all combinations of figure, color, and count to appear exactly once. The
number of categories used was reduced from nine to six. Both the “arbitrary” order of
category selection and the randomized (“shuffled”) order of the response deck were
preserved. While Berg had recorded only response errors for each category, this study
introduced the concept of a “perseverative” response and divided errors into
“perseverative” and “non-perseverative”. The card sorting test also got its name in this
article: University of Wisconsin Card-Sorting Test.
7

The use of card sorting tasks similar to the Wisconsin Card-Sorting Test (WCST) did not
find their way into neuropsychological testing until Brenda Milner (1963) citing deficits of
“Weigl” style tests (“too easy a task for young adult subjects” and the
“disadvantage of yielding only dichotomous data”), “decided, instead, to use the
Wisconsin Card Sorting Test of Grant and Berg, which is based partly on the Weigl test
and partly on experimental techniques used successfully with lower primates [Harlow].”
Milner standardized the order of category presentation to color, figure, count and
enlarged the definition of a “perseverative” error to include responses in the first
category “as a continued response in terms of the patient’s initial preference.”
She, in a pre-, post-operative design, tested 71 patients using the WCST who underwent
unilateral cortical excisions to relieve epileptic seizures. In addition, she also tested 23
patients post surgically only. She found a marked increase in the errors committed and a
decrease in categories achieved when post-surgical test results were compared with
pre-surgical test results for dorsolateral frontal-lobe excisions, but no similar decrements
for patients whose excisions were more posterior. For the 23 patients tested post-
surgically only, the performance of patients with dorsolateral frontal-lobe excisions was
markedly inferior to patients with more posterior excisions.
In a recent review Nyhus and Barceló (2009) identified the WCST as “one of the most
distinctive tests of prefrontal function.” They go on to say, however, that “clinical
research and recent brain imaging have brought into question the validity and
specificity of this test as a marker of frontal dysfunction.”
Registering Your New Test
When first loaded, whether from an online download or a physical storage device,
execution of the installed program will prompt for the registration of the newly installed
CogQuiz software. This prompt will continue to appear each time the program is run until
the registration procedure is completed.
8

If the computer on which the software has been installed is connected to the Internet, the
software can be automatically registered by providing the information requested (i.e., the
name of the purchaser and the purchaser’s email address) and clicking the Register button.A Product Key Code will be sent to the email address provided within two working
days. After receipt of the Product Key Code, enter it in the provided fields and click the
Enter button to complete the registration procedure. (Note: Each time a program is
installed and executed for the first time it is issued a new Serial Number so each of the
two allowed installations will have its own unique combination of Serial Number and
Product Key Code.) Be sure to note both the Serial Number and Product
Registration Key as they may be required in subsequent interactions with CogQuiz
Neuropsychological Assessment Tests. Once registration is completed the Product
Registration screen will not appear again and the nags in the corners of the screen will
disappear. The software is fully functioning with nags prior to Registration and no data
will be lost following Registration.
Executing a Card Sort Test
On the WELCOME screen (see Figure 1), select a test from the pull down “Select a
Test” list. This will produce the SELECT PARTICIPANT window (Figure 2). Select a
participant from the “Select a Participant” pull down list. This assumes that the
participant has already been added to the Participant Database; if the participant has not
yet been added, then before proceeding you will need to return to the CogQuiz Menu
screen (by clicking the Cancel button) and add the participant to the database (see the
section on adding new participants). Once a participant has been selected there is an
option to then enter the tester’s name; if entered, the name of the person administering
the test will be added to the participant’s test record. After selecting the participant and,
optionally, adding the tester’s name, click the Run Test button.
9

Figure 2
The first display a participant will see is a set of instructions for the test. Figure 3 shows
a typical instruction display. Once the instructions have been read and understood the
test is initiated by clicking or touching the OK button. A display similar to one of the two
tests shown in Figure 4a and 4b will be displayed. The exact configuration of the display
depends on the definition of the selected test. The tests shown in Figure 4a and 4b are
for adults and children respectively.
10

Figure 3
Depending on whether the production of a Response Card is specified as ”Dealt” or
“Paced” (See Creating and Editing a Card Sort Test for an explanation of the
difference), the participant first clicks the single card at the bottom of the screen to
display a new Response Card (Dealt) and then clicks on the card immediately below the
chosen Stimulus Card displayed at the top of the screen. If “Dealt” is the specified option
the computer will automatically display a new Response Card at the appropriate time.
The participant then clicks the card under the chosen Stimulus Card. Following a
response the participant will be provided with either visual, auditory or both feedback on
the correctness of their response and the next trial will begin. At the end of the test the
participant will be thanked for their participation and control of the test will be returned to
the WELCOME screen.
Figure 4a and 4b
As with all CogQuiz tests, the Card Sort test can be terminated at any time by pressing
Ctrl x. On initiating this sequence the user will be asked to confirm the choice to
terminate the test; if the choice to terminate is affirmed, the test will be terminated and
no data from the test will be saved.
11

Analyzing a Card Sort Test
The Analysis Screen shown below has two components. On the left side is displayed
relevant participant information and the summary data for the test selected for analysis.
The right side provides for selecting a participant, the test to analyzed and the “event
record” of the test selected for analysis.
Figure 5
Analyze a test by first selecting a participant from the Get Participant pull-down list.
Selecting a participant name from the list (by clicking on the name) will populate the Card Sort Tests Taken with all of the Card Sort Tests taken by the selected participant. Select
a test for analysis by clicking on it. Doing this will result in the display of the event record
(more about the event record later) for the selected test and the appearance of a small
blue box at the bottom of the screen. Select an analysis protocol from the Select Analysis Protocol pull down list. There are four including Heaton et.al. (1993), Grant
and Berg (1948), Lezak (1995) and Basic Score Sheet only. Each of these protocols
define the 13 summary measures in different ways in some cases yielding different
values on a particular test in the summary data table.
Category: The ordinal value of the current category (stage).

Resp. Count: The total number of responses made in this category.
Avg. Resp. Time: The average latency of responses made in this category in
milliseconds (latency is calculated as the time from the initial display of the
response card until the selection of a stimulus card).
Correct Resp. Count: For the Lezack and Heaton protocols this is simply the
total number of correct responses made for this category. For the Grant protocol
it is the number of correct responses in excess of the correct responses making
up the final run in this category.
Avg. Correct Resp. Time: The average latency (as defined above) of correct
responses (as defined in “Correct Resp. Count”) in this category.
Error Resp. Count: For the Lezack and Heaton protocols this is simply the total
number of erroneous responses made for this category. For the Grant protocol it
is the number of erroneous responses made in this category excluding the first
error made following a category shift.
Avg. Error Resp. Time: The average latency (as defined above) of error
responses (as defined in “Error Resp. Count”) in this category.
Persev. Resp. Count: Grant & Berg define a perseverative response as “a
response to a new or shifted category which would have been correct for
the immediately preceding category” (Grant, et. al., 1948). For Heaton it is
defined as a response appropriate to the “perseverate-to-principle” (See
the Heaton scoring rules outlined below).
Avg. Persev. Resp. Time: The average latency of a perseverative response in
this category.
Persev. Error Count: Grant & Berg define a perseverative error response as a
response that would have been correct to the previous category. For Heaton it is
defined as an error response appropriate to the “perseverate-to-principle” (See
the Heaton scoring rules outlined below).

Avg. Persev. Error Resp. Time: The average latency of a perseverative error in
this category.
Unique Error Resp. Count: The number of responses where the stimulus card
and the response card did not match on any dimension.
Avg. Unique Error Resp. Time: The average latency of a Unique Error
Response.
Failure to Maintain Set: A count of the number of times a participant made a run
of consecutive correct responses greater than or equal to half the number of
consecutive correct responses required to initiate a shift to a new category, but
less than the number to initiate a shift to a new category.
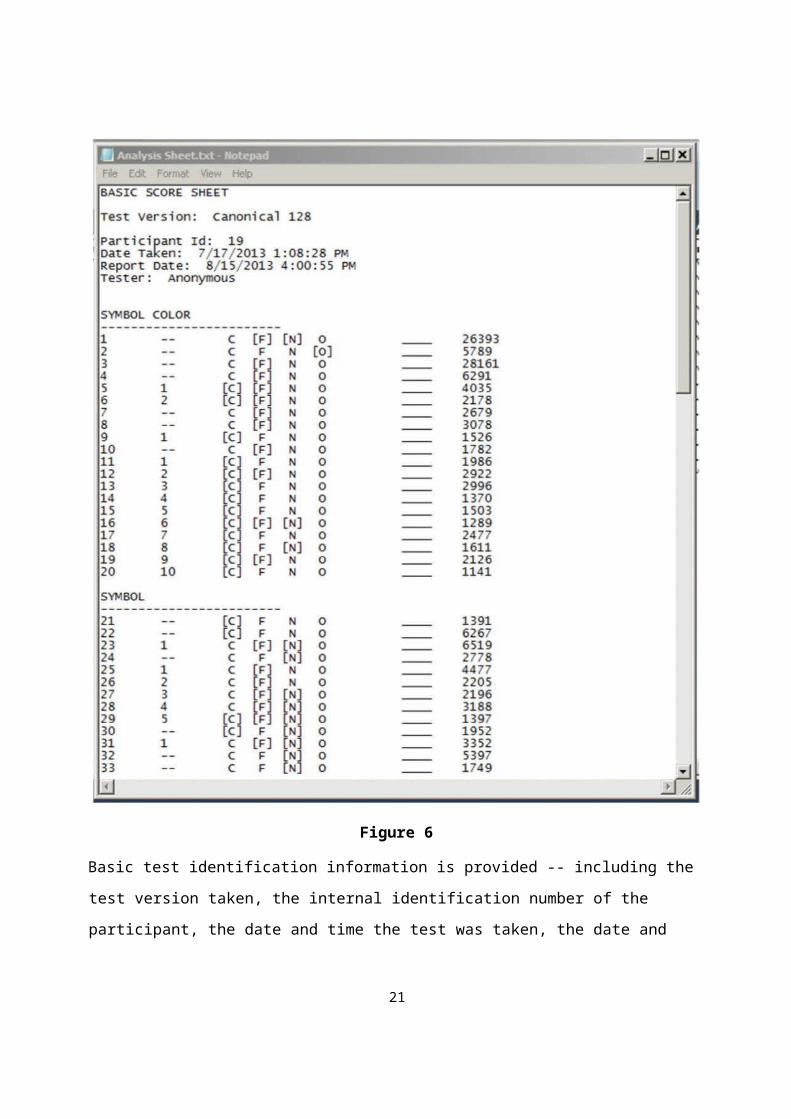
Basic Score Sheet: shown below is the output from selecting the “Basic Score Sheet
Only” option. No summary analysis is done, providing only a listing of the responses
made. This option has been provided in the event the test administrator wishes to score
the test manually or using a scoring protocol not captured by the three provided ones.
The score sheet can be either saved to a file or printed.
14

Figure 6
Basic test identification information is provided -- including the test version taken, the
internal identification number of the participant, the date and time the test was taken, the
date and time the score sheet was generated and the name of the person administering
the test.
15

The Category in effect is shown in capital letters and underlined. So for example, here the
first category of the displayed score sheet is SYMBOL COLOR. The characteristics of the
Participant’s responses are displayed in from seven to nine columns (depending on
selected parameters of the analyzed test). The first column is simply the response
number. The second column contains either - - indicating an error response or a number
indicating a correct response. The next several columns (between 2 and 4) display the
match dimensions used in the analyzed test. So in the example shown above three
dimensions Color C, Form F, and Number N were used. If Card Color had also been used
a fourth column B (for Back color) would also appear. The next column following the
match dimension columns contains an O for Other. If the current response card (a card
from the deck) matches the selected stimulus card on a particular dimension then that
dimension is bracketed. So, for example, the first card from the response card deck
matched the selected stimulus card on Form [F] and number [N] but not on color C. On
the second trial the selected stimulus card did not match the response card on any of the
match dimensions and has been scored as an Other [O]. It is not until trial five that the
stimulus card and response card match for Color [C]; it also, incidentally, matched on
Form [F]. The number, 1 is recorded indicating the first correct response in what might
potentially be a run of correct responses. The next column is simply a blank space
allowing for the recording of the response as “perseverative” according the criteria in use
by the investigator. The last column is the time in milliseconds between the presentation of
the response card and the selection of the stimulus card.
Lezak: The simplest protocol, described by Lezak (1995), counts total, perseverative and
unique (Other) errors. The total error count is simply the total number of errors made on
the test. A perseverative error is defined as an error response which would have been
correct for the previous category. A unique error is a response error where the response
card does not match the stimulus card on any match dimension (for example one green
triangle and three red stars).
The Lezak Score Sheet is similar to the Basic Score Sheet with two differences (see the
Heaton Score Sheet). The column displaying response latencies is now the third column
in the display and the column displaying blanks has been replaced with a column
16

displaying either a blank or a “P” for Perseverative, in the case of Lezak a perseverative
error.
Grant and Berg: The “Grant and Berg” protocol scores “Correct Responses” as the
number of correct responses made minus the number of consecutive correct responses
required to complete the current category. The column “Correct Resp. Count” in summary
data table is number of correct responses in excess of the number of consecutive correct
responses required to initiate a category shift. This protocol also does not count the first
error following a category shift as an error.
Heaton: The “Heaton” scoring protocol is based on TERMINOLOGY and SCORING
RULES as described by Flashman, et al. (1991). “A perseverative response is one that
would have been correct in the immediately preceding stage.” It is a response that
matches the Response Card with a Stimulus Card on the “perseverate-to principle,” that
is the stimulus dimension thought to be the relevant one in determining a correct match.
The “perseverate-to principle” is usually the stimulus dimension that was correct in the
immediately preceding stage, but not always as it can be modified by Rule #5, #6, and #7
(See below). “An unambiguous response is one that matches the stimulus cards on only
one criterion.” The following scoring rules coupled with the definitions given above were
used to define the “Heaton” scoring algorithm.
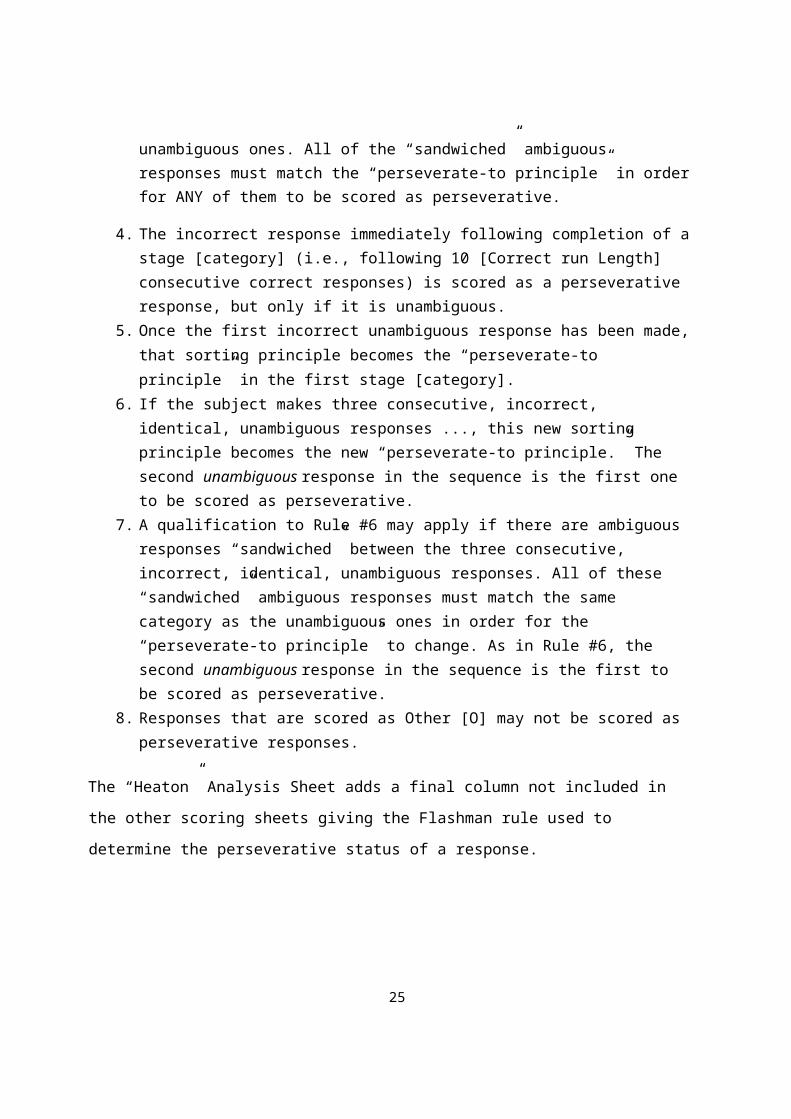
1. Any unambiguous response that matches the “perseverate-to principle” is considered a perseverative response, even if there are intervening responses that do not match this principle.
2. An ambiguous response may also be scored as perseverative, according to the“sandwich rule” (our terminology). If the ambiguous response matches the “perseverated-to principle,” and the closest unambiguous responses both preceding and following it are perseverative, it is scored as a perseverative response.
3. A qualification to Rule #2 may apply if there is more than one ambiguous response “sandwiched” between the two unambiguous ones. All of the “sandwiched” ambiguous responses must match the “perseverate-to principle” in order for ANY of them to be scored as perseverative.
4. The incorrect response immediately following completion of a stage [category] (i.e., following 10 [Correct run Length] consecutive correct responses) is scored as a perseverative response, but only if it is unambiguous.
17

5. Once the first incorrect unambiguous response has been made, that sorting principle becomes the “perseverate-to principle” in the first stage [category].
6. If the subject makes three consecutive, incorrect, identical, unambiguous responses ..., this new sorting principle becomes the new “perseverate-to principle.” The second unambiguous response in the sequence is the first one to be scored as perseverative.
7. A qualification to Rule #6 may apply if there are ambiguous responses “sandwiched” between the three consecutive, incorrect, identical, unambiguous responses. All of these “sandwiched” ambiguous responses must match the same category as the unambiguous ones in order for the “perseverate-to principle” to change. As in Rule #6, the second unambiguous response in the sequence is the first to be scored as perseverative.
8. Responses that are scored as Other [O] may not be scored as perseverative responses.
The “Heaton” Analysis Sheet adds a final column not included in the other scoring sheets
giving the Flashman rule used to determine the perseverative status of a response.
18

Figure 7
Event Recorder: All CogQuiz Neuropsychological Assessment Tests keep a “running”
event record of all salient events occurring during a test’s administration. This event
record, displayed in the upper right corner of the Analysis display, has four columns. The
first column displays the ordinal position of the event; the second column, the event
name, reflecting the nature of the event; the third column contains argument(s) describing
parameters of the event; and the fourth column contains a “timestamp” indicating in
milliseconds the time that has elapsed since the recorder was started (the start of the
test) when the computer detected the occurrence of the event.
19

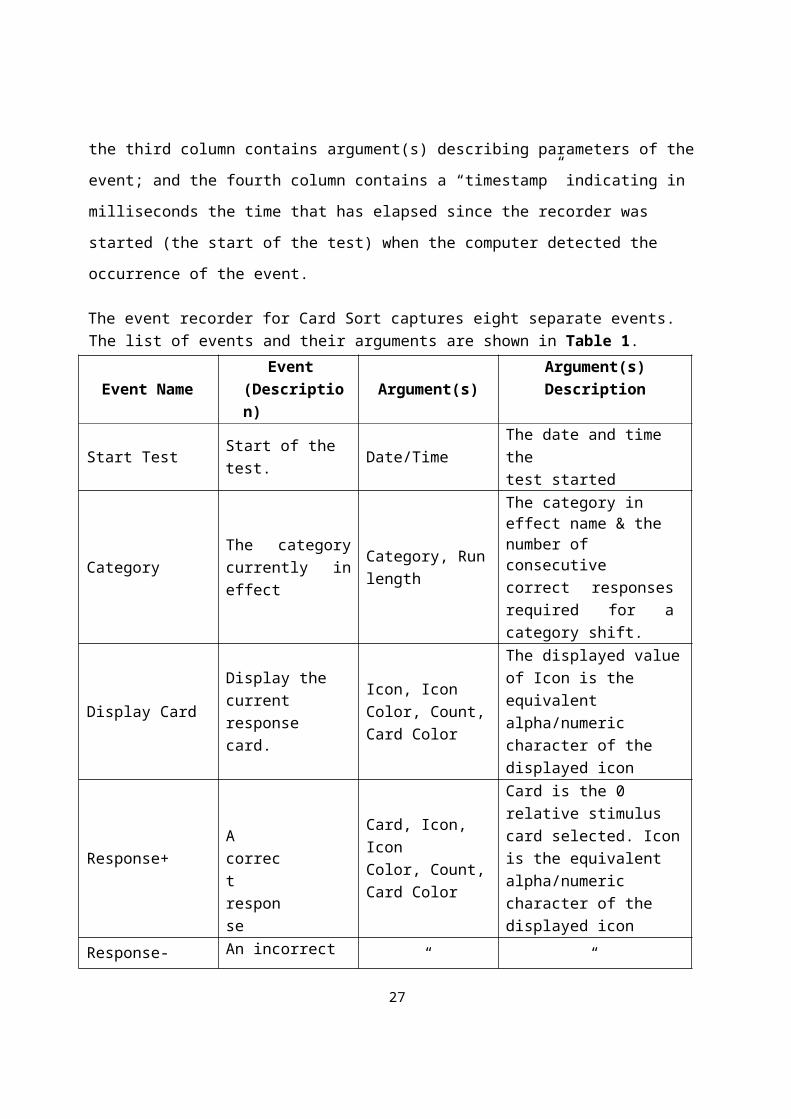
The event recorder for Card Sort captures eight separate events. The list of events and their arguments are shown in Table 1.
Event Name Event (Description) Argument(s) Argument(s)
Description
Start Test Start of the test. Date/Time The date and time thetest started
Category The category currently in effect
Category, Run length
The category in effect name & the number ofconsecutive correct responses required for a category shift.
Display CardDisplay the current response card.
Icon, Icon Color, Count, Card Color
The displayed value of Icon is the equivalent alpha/numeric character of the displayed icon
Response+A correct response
Card, Icon, IconColor, Count,Card Color
Card is the 0 relative stimulus card selected. Icon is the equivalent alpha/numeric character of the displayed icon
Response- An incorrect response “ “
CompleteSignals the completion of a category.
Category, Run length
The category in effect name & the number ofconsecutive correct responses required for a category shift.
TerminateSignals thetermination of thetest
Reason for termination
Test Complete (all categories achieved) Deck Exhausted (all response cards used)
End Test Signals test completion Date/Time The date and time the
test endedTable 1
Creating and Editing a Card Sort Test
Create a new or edit an existing Card Sort test by first clicking the Create/Edit Test button on the Welcome screen. Doing so will produce a test definition/edit screen similar
20
to one seen in Figure 8. The initial screen, unlike the one seen below will have only a few
fields defined with default values, which can, at the test author’s discretion be changed.
Create a New Test:
Begin creating a new test by clicking the Create New Test button. This will position the
cursor in the test name field located in the upper left corner of the screen. Provide a
unique name for the test and in the Test Author Name field the name of the test’s
author. Save the test by clicking the Save Test button.
Figure 8
Begin defining basic parameters for the test.
Response Mode: Select a mode of responding from the pull down list. Mouse is a
standard “point and click.” If the test is to be administered on a system (e.g. PC or
tablet) which utilizes a “touch screen then Touch can be selected as an option (Note:
The normative data supplied with this test was collected with a mouse, although we
(Feldstein et. al., 1999) have found little difference between the two options.)
21

Stimulus Count: Select the number of stimulus cards (two to five cards) to be used for
this test. The stimulus card display at the top of the screen will change to reflect the
number of cards chosen.
Presentation Mode: Response cards can be presented either by having the Participant
click on the response card deck to present the next card (Dealt) or the computer can
automatically present the next card (Paced) following the Participant’s response on the
previous card.
Pace Delay: Pace delay sets the delay between a Participant response and the
presentation of the next Response Card, if Paced has been selected as the Presentation
Mode.
Match Dimension: Response Cards can match a Stimulus Cards on any one of up to
five dimensions, symbol, symbol Count, symbol color, card color and category. Select the
dimension determining a match for this “stage” from the Match Dimension pulldown list.
Correct Run Length: Select from the pull-down list the number of continuous correct
responses to be used in determining when a stage shift is to be made. (Note: The
“Failure to Maintain Set” value will be set to either half of the selected value, if the
selected Correct Run Length is an even number, or the nearest whole number less than
half of the value if it is odd.)
If the shift from the current stage to the next stage is to be signaled, check the Signal Stage Shift box and enter the required shift message in the text box located directly
above it.
Once the Match Dimension and the Correct Run Length have been selected they can be
added to the list of stages by clicking the Add button, inserted immediately prior to the
currently displayed stage by clicking the Insert button, or they can replace the currently
displayed parameters by clicking the Replace button. Clicking the Delete button will
remove the currently displayed stage from the stage list.
Messages and Instructions:
22

Messages: The Card Sort test comes with a default set of Participant messages;
however, these can be changed to meet the test authors requirements (e.g. first
language of the Participant population). Do this by typing the desired message into the
appropriate field. Checking Use Icons replaces the textual messages with the
displayed icons.
Speech: If the computer system used for testing supports “text-to-speech” then
checking the Use Audio box will cause the system to read to the participant all
messages and instructions. If the Use Icons option has been selected the system will
still read the text messages as entered in the several message fields. Windows 7TM is
supplied with one voice, while Windows 8TM supports three. Other voices can be
purchased from third party vendors. In cases in which a system supports multiple
voices, the desired voice must be selected at the system level prior to running the Card
Sort program.
Instructions: The Instruction Editor allows the test author to write test instructions
specific to their needs. Clicking the Instructions button will open a window similar to the
one seen below. This editor is relatively simple, but it does allow the test author to select
the font(s) to be used in the instruction and the font size. It also provides access to a
small collection of colors for use in coloring the text, as well as access to bolding, Italic
and underlining. If more complex text construction is required, it is suggested that an
external editor be used, and the created file be imported into the editor by clicking the
Import From File button. The only restriction on an external editor is, it must be capable
of storing the created file in “Rich Text Format,” (.rtf). Clicking the OK button will commit
the displayed text to the test definition and close the window. Clicking the Cancel button
will abandon all changes to the text and close the window. Clicking the Read button
causes the currently displayed text to be read using the currently selected voice (See the
section of Speech).
23

Figure 9
Cards:
Cards used in generating a sorting test are maintained in a single “library” of card
definitions which is shared by all developed card sort tests. This library comes with a
preconfigured set of cards. However it can be enlarged to contain additional cards or the
existing cards can be edited using the Card Editor.
Card Browser: The card browser is used to assign cards cataloged in the library to
either a particular stimulus card position or a particular location in the response card
deck.
24
Assign a card definition to a Stimulus Card by clicking on the stimulus card to be
defined. This will open the Card Browser Dialog. Navigate using the four navigation
buttons immediately under the card display to the required card and then click the OK button. The specified card definition will be assigned to the selected stimulus card.
Located between the four navigation buttons is a box displaying the “catalogue” number
for the currently displayed card. That number was assigned to that card at the time it was
created. If you know the catalogue number of the required card, you can type that
number into the box, press the <Enter> key and move directly to the required card.
Add: Assign a new card to the Response Card deck by clicking the Add button
below Card Deck. Select a card to be added from the card library and click the
OK button.
Replace: If a card at a particular location in the Response Card deck needs to
be replaced, first navigate to the card position in the deck (the ordinal position of
the currently displayed card is shown in the box labeled Card Deck located
directly below the card deck display). Click the Replace button, opening the CardBrowser. Navigate to the needed card in the card library using the Card Browser and click the OK button. The newly selected card will replace the currently
displayed card in the card deck.
Insert: A new card can also be inserted into the deck by navigating to the card in
the Response Card deck immediately following the location where the new card
is to be insert and clicking the Insert button. Navigate to the card to be inserted
from the card library using the Card Browser and click OK to insert the card.
Delete: Navigate to the card in the Card Deck to be deleted and click the Delete button. The card will be deleted.
25

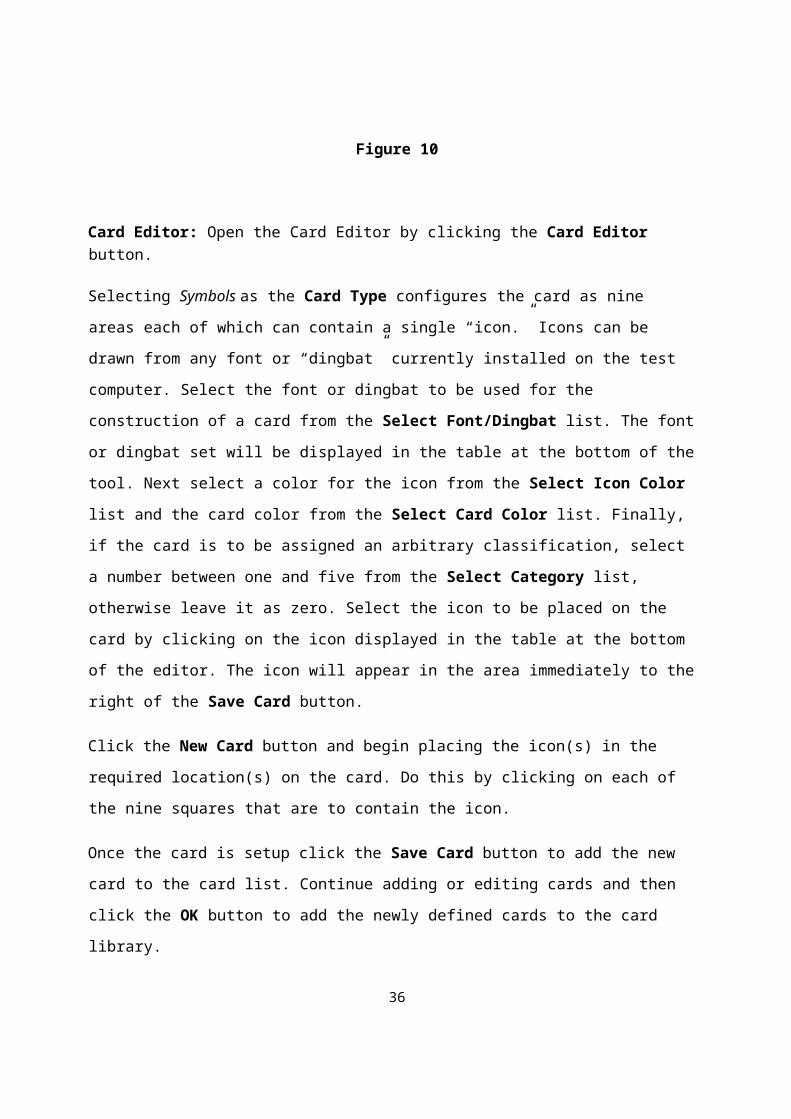
Figure 10
Card Editor: Open the Card Editor by clicking the Card Editor button.
Selecting Symbols as the Card Type configures the card as nine areas each of which
can contain a single “icon.” Icons can be drawn from any font or “dingbat” currently
installed on the test computer. Select the font or dingbat to be used for the construction of
a card from the Select Font/Dingbat list. The font or dingbat set will be displayed in the
table at the bottom of the tool. Next select a color for the icon from the Select Icon Color list and the card color from the Select Card Color list. Finally, if the card is to be
assigned an arbitrary classification, select a number between one and five from the
Select Category list, otherwise leave it as zero. Select the icon to be placed on the card
by clicking on the icon displayed in the table at the bottom of the editor. The icon will
appear in the area immediately to the right of the Save Card button.
Click the New Card button and begin placing the icon(s) in the required location(s) on the
card. Do this by clicking on each of the nine squares that are to contain the icon.
26
Once the card is setup click the Save Card button to add the new card to the card list.
Continue adding or editing cards and then click the OK button to add the newly defined
cards to the card library.
Alternatively the Card Type can be defined as Word. Defining the card type as word
allows a word of up to approximately ten characters to be entered for display on the card.
Figure 8 shows word cards from our Stroop Sort. Selecting the word option opens a
small text box. Create a word card by clicking the New Card button and then select a
font, a color for the word, a card color and if appropriate a category for the word. Type the
required word in the text box followed by [Enter]. Save the new card by clicking the Save Card button.
If a card needs to be redefined, select the card by first displaying it using the four
“navigation” buttons (˂˂, ˂, ˃, ˃˃) to navigate to the card. Click the Clear Card button to clear the card. Select the replacement card characteristics (i.e. font,
icon color, card color and icon) as outlined in the procedure for creating a new
card. Finally click the Save Card button to save the card in its new configuration.
(Note: all tests using the changed card will use the new card definition.) Finally,
a card can be removed from the card library by navigating to the card and
clicking the Delete Card button.
Warning: Be careful when doing this not to delete a card currently in use by a test as that test will not continue to function properly.
27

Figure 11Normative DataParticipants were recruited from a college student population, relatives of students, or
from a local senior center. Participants under 18 years of age received five dollars per
hour, and participants over 60 received ten dollars per hour. Participants between the
ages of 18 and 59 received extra course credit for their participation. Participants were
high functioning (see Demographic Characteristics of the Normative Sample), reporting
no head injuries, neurological diseases, or psychiatric illnesses that they believe would
affect their performance.
Test data was collected for the Card Sort Tet included in the software using the “Mouse”
option for Participant responses and the “Dealt” option for response card presentation.
28

Demographic Characteristics of the Participant Sample
Shown below are the demographic characteristics of the participant sample. Some
participants did not provide “Years of Education.” The collection of data for the card sort
test was imbedded in a larger collection effort scheduled over several sessions. In some
cases participants completed the card sort test but did not return for subsequent
sessions. Those that completed WAIS or WAIS-R did so either prior to taking the card
sort test or did return for subsequent testing sessions during which the WAIS of WAIS-R
was administered. We have found no significant differences on the card sort test
between the 61.5% of the sample for which we have WAIS or WAIS-R results and the
38.5% for which we do not. Finally, this sample was drawn from a high functioning
population (i.e. college students, their families and friends and a senior citizen population
that had to meet stringent criteria in order to participate).
29
30
N Mean
Std.
Deviation Std. Error
95% Confidence Interval for
Mean
Minimum Maximum
Lower
Bound Upper Bound
Years of
Education
5 to 9 212 2.08 1.405 .096 1.89 2.28 0 6
10 to 14 243 6.59 1.640 .105 6.38 6.80 2 14
15 to 19 601 12.65 1.519 .062 12.53 12.77 3 16
20s 854 14.72 1.125 .039 14.65 14.80 5 18
30s 259 15.01 1.319 .082 14.85 15.17 7 20
40s 224 15.04 1.704 .114 14.82 15.27 1 20
50s 196 15.33 1.983 .142 15.05 15.61 10 20
60s 239 15.06 2.175 .141 14.79 15.34 9 20
70s 287 14.75 2.639 .156 14.45 15.06 3 20
80s 159 14.88 2.417 .192 14.50 15.26 9 21
Total 3274 13.04 4.016 .070 12.90 13.17 0 21
subject age 5 to 9 223 7.29 1.345 .090 7.11 7.46 5 10
10 to 14 256 12.04 1.429 .089 11.86 12.21 10 19
15 to 19 614 18.07 1.441 .058 17.96 18.19 12 36
20s 869 22.80 2.775 .094 22.61 22.98 20 29
30s 267 33.98 3.067 .188 33.61 34.35 30 39
40s 226 44.15 2.783 .185 43.79 44.52 40 49
50s 196 53.81 2.676 .191 53.43 54.18 50 59
60s 244 64.83 2.776 .178 64.48 65.18 60 70
70s 292 74.25 3.000 .176 73.90 74.59 61 79
80s 161 83.11 2.580 .203 82.70 83.51 80 90
Total 3348 34.67 22.926 .396 33.90 35.45 5 90
WASI
Matrix
Reasoning
5 to 9 136 18.92 6.780 .581 17.77 20.07 2 30
10 to 14 147 27.33 3.733 .308 26.72 27.93 16 34
15 to 19 234 29.37 3.520 .230 28.91 29.82 19 48
20s 316 29.19 3.261 .183 28.83 29.55 11 35
30s 88 29.70 3.174 .338 29.03 30.38 12 35
40s 102 28.55 2.934 .290 27.97 29.13 19 34
50s 104 27.75 2.484 .244 27.27 28.23 20 32
60s 146 25.09 5.269 .436 24.23 25.95 7 32
70s 192 23.98 6.718 .485 23.02 24.94 2 69
80s 105 19.60 6.476 .632 18.35 20.85 4 28
Total 1570 26.38 5.865 .148 26.09 26.67 2 69
WCST
categories
completed
score_G/B
5 to 9 223 3.76 1.819 .122 3.52 4.00 0 6
10 to 14 256 4.98 1.479 .092 4.80 5.17 0 6
15 to 19 614 5.54 1.172 .047 5.45 5.64 0 6
20s 869 5.61 1.084 .037 5.53 5.68 0 6
30s 267 5.40 1.396 .085 5.24 5.57 0 6
40s 226 5.48 1.357 .090 5.30 5.66 0 6
50s 196 5.16 1.539 .110 4.94 5.38 0 6
60s 244 4.29 2.075 .133 4.03 4.55 0 6
70s 292 3.96 3.748 .219 3.52 4.39 0 57
80s 161 3.54 2.156 .170 3.20 3.88 0 6
Total 3348 5.03 1.905 .033 4.97 5.10 0 57
WCST total 5 to 9 223 48.36 23.796 1.594 45.22 51.50 4 97

31

Age
Age N Mean Std. Deviation
5 to 9 223 7.29 1.345
10 to 14 256 12.04 1.429
15 to 19 614 18.07 1.41
20s 869 22.80 2.775
30s 267 33.98 3.067
40s 226 44.15 2.783
50s 196 53.81 2.676
60s 244 64.83 2.776
70s 292 74.25 3.000
80s 161 83.11 2.580
Total 3348 34.67 22.926
% Female
Age N Mean Std. Deviation
5 to 9190
55.00 5.000
10 to 14 210 50.00 5.000
15 to 19 498 70.00 5.000
20s 737 74.00 4.000
30s 235 72.00 4.000
40s 203 77.00 4.000
50s 184 77.00 4.000
60s 221 71.00 5.000
70s 256 67.00 5.000
80s 144 62.00 5.000
Total 2878 69.00 5.000
Years of Education
Age N Mean Std. Deviation
5 to 9 182 2.06 1.430
10 to 14 206 6.55 1.547
15 to 19 491 12.66 1.461
20s 725 14.73 1.113
30s 228 14.95 1.291
40s 201 14.98 1.700
50s 184 15.30 1.979
60s 217 15.00 2.206
70s 253 14.68 2.619
80s 143 14.84 2.428
Total 2830 13.06 4.004
WAIS or WAIS-R Full Scale IQAge N Mean Std. Deviation
5 to 9 111 118.95 14.550
10 to 14 129 118.11 13.459
15 to 19 236 112.83 11.708
20s 365 111.73 12.283
30s 135 116.01 11.793
40s 137 116.48 11.055
50s 139 118.69 10.796
60s 179 116.91 13.293
70s 213 121.60 14.102
80s 127 120.26 15.879
Total 1771 116.36 13.252
30
Categories Completed
Age N Mean Std. Deviation Std. Error95% Confidence Interval for Mean Minimum Maximum
Lower BoundUpper Bound

5 to 9 190 3.82 1.777 .129 3.56 4.07 0 6
10 to 14 209 5.06 1.453 .101 4.86 5.26 0 6
15 to 19 499 5.53 1.191 .053 5.42 5.63 0 6
20s 734 5.60 1.091 .040 5.52 5.68 0 6
30s 235 5.41 1.382 .090 5.23 5.59 0 6
40s 203 5.58 1.197 .084 5.41 5.74 0 6
50s 184 5.18 1.525 .112 4.96 5.41 0 6
60s 221 4.41 2.002 .135 4.14 4.67 0 6
70s 256 3.82 2.074 .130 3.57 4.08 0 6
80s 144 3.53 2.171 .181 3.17 3.89 0 6
Total 2875 5.03 1.663 .031 4.97 5.09 0 6Unique Errors
Age N Mean Std. Deviation Std. Error95% Confidence Interval for Mean Minimum Maximum
Lower BoundUpper Bound
5 to 9 190 10.90 12.195 .885 9.15 12.64 0 58
10 to 14 209 6.50 10.285 .711 5.10 7.90 0 59
15 to 19 499 3.76 9.153 .410 2.96 4.57 0 92
20s 734 2.43 7.486 .276 1.89 2.98 0 89
30s 235 3.25 9.036 .592 2.09 4.42 0 61
40s 203 2.24 6.576 .463 1.33 3.15 0 55
50s 184 2.22 5.036 .371 1.48 2.95 0 37
60s 221 3.68 7.934 .534 2.63 4.74 0 55
70s 256 4.29 8.640 .540 3.23 5.36 0 56
80s 144 5.88 11.162 .930 4.04 7.72 0 56
Total 2875 3.99 8.949 .167 3.67 4.32 0 9231
Heaton (1993) Scoring ProtocolTotal Errors (Heaton)
Age N Mean Std. Deviation Std. Error95% Confidence Interval for Mean Minimum Maximum
Lower Bound Upper Bound
5 to 9 190 51.22 22.244 1.614 48.04 54.40 7 96
10 to 14 209 34.14 20.739 1.435 31.32 36.97 0 83
15 to 19 499 24.62 18.696 .837 22.97 26.26 3 102
20s 734 22.26 17.423 .643 20.99 23.52 4 90
30s 235 24.64 21.343 1.392 21.90 27.39 1 97
40s 203 22.66 17.773 1.247 20.20 25.11 3 102

50s 184 29.04 20.362 1.501 26.08 32.01 3 91
60s 221 39.33 23.912 1.608 36.16 42.50 6 96
70s 256 44.93 24.213 1.513 41.95 47.91 3 110
80s 144 49.56 23.638 1.970 45.67 53.46 8 102
Total 2875 30.80 22.663 .423 29.97 31.63 0 110
Total Corrects (Heaton)
Age N Mean Std. Deviation Std. Error95% Confidence Interval for Mean Minimum Maximum
Lower Bound Upper Bound
5 to 9 190 70.31 16.263 1.180 67.98 72.64 32 105
10 to 14 209 75.16 13.450 .930 73.33 77.00 0 106
15 to 19 499 71.66 11.876 .532 70.61 72.70 5 102
20s 734 69.79 12.720 .470 68.87 70.72 4 104
30s 235 66.06 17.712 1.155 63.79 68.34 2 103
40s 203 69.97 12.347 .867 68.26 71.67 6 98
50s 184 71.24 13.187 .972 69.32 73.16 4 98
60s 221 69.52 14.792 .995 67.56 71.48 4 97
70s 256 69.12 13.606 .850 67.44 70.79 18 103
80s 144 68.60 15.377 1.281 66.07 71.14 26 103
Total 2875 70.20 13.871 .259 69.69 70.71 0 10632
Perseverative Errors (Heaton)
Age N Mean Std. Deviation Std. Error 95% Confidence Interval for Mean Minimum Maximum
Lower Bound Upper Bound
5 to 9 190 23.91 14.816 1.075 21.79 26.03 2 91
10 to 14 209 14.97 9.112 .630 13.72 16.21 0 49
15 to 19 499 11.36 8.108 .363 10.65 12.08 0 51
20s 734 11.04 8.486 .313 10.42 11.65 0 52
30s 235 11.80 10.064 .656 10.51 13.10 1 58
40s 203 11.56 9.893 .694 10.19 12.93 0 63
50s 184 14.97 12.788 .943 13.11 16.83 1 118
60s 221 20.55 15.527 1.044 18.49 22.61 2 92
70s 256 23.71 15.052 .941 21.86 25.57 4 86
80s 144 25.65 13.890 1.158 23.36 27.94 4 63
Total 2875 15.17 12.326 .230 14.72 15.62 0 118Non-Perseverative Errors (Heaton)

Age N Mean Std. Deviation Std. Error95% Confidence Interval for Mean Minimum Maximum
Lower Bound Upper Bound
5 to 9 190 27.34 15.912 1.154 25.06 29.62 1 76
10 to 14 209 19.27 14.043 .971 17.36 21.19 0 60
15 to 19 499 13.20 12.490 .559 12.10 14.30 1 76
20s 734 11.22 10.323 .381 10.48 11.97 0 68
30s 235 12.52 13.067 .852 10.84 14.20 0 76
40s 203 11.04 9.591 .673 9.71 12.37 0 75
50s 184 14.84 11.628 .857 13.15 16.53 0 63
60s 221 18.77 13.296 .894 17.01 20.53 0 67
70s 256 21.35 13.836 .865 19.64 23.05 0 85
80s 144 23.90 15.700 1.308 21.31 26.48 3 83
Total 2875 15.66 13.503 .252 15.16 16.15 0 8533
Grant and Berg (1948) Scoring ProtocolExcess Correct (Grant and Berg)
Age N Mean Std. Deviation Std. Error95% Confidence Interval for Mean Minimum Maximum
Lower Bound Upper Bound
5 to 9 190 31.23 13.159 .955 29.34 33.11 2 68
10 to 14 209 22.87 13.813 .955 20.98 24.75 0 61
15 to 19 499 14.86 13.066 .585 13.71 16.00 0 64
20s 734 12.96 12.868 .475 12.03 13.89 0 71
30s 235 13.17 13.549 .884 11.43 14.92 0 61
40s 203 12.72 13.219 .928 10.89 14.55 0 62
50s 184 18.24 16.958 1.250 15.78 20.71 0 65
60s 221 25.30 18.177 1.223 22.89 27.71 0 78
70s 256 30.02 18.371 1.148 27.76 32.28 0 86
80s 144 32.12 17.540 1.462 29.23 35.01 0 75
Total 2875 18.98 16.263 .303 18.39 19.58 0 86
Total Errors (Grant and Berg)
Age N Mean Std. Deviation Std. Error95% Confidence Interval for Mean Minimum Maximum
Lower Bound Upper Bound
5 to 9 190 47.67 23.492 1.704 44.31 51.03 2 96
10 to 14 209 29.84 21.499 1.487 26.91 32.77 0 81
15 to 19 499 19.94 19.442 .870 18.23 21.65 0 102
20s 734 17.59 17.967 .663 16.29 18.89 0 88
30s 235 19.90 21.799 1.422 17.10 22.70 0 97
40s 203 17.75 18.180 1.276 15.23 20.26 0 93
50s 184 24.82 21.190 1.562 21.73 27.90 1 91
60s 221 35.24 25.272 1.700 31.89 38.59 0 96
70s 256 41.20 25.320 1.583 38.09 44.32 0 110
80s 144 46.24 25.103 2.092 42.10 50.37 3 102
Total 2875 26.43 23.605 .440 25.57 27.29 0 11034
Perseverative Errors (Grant and Berg)
Age N Mean Std. Deviation Std. Error95% Confidence Interval for Mean Minimum Maximum
Lower Bound Upper Bound
5 to 9 19022.1
5 15.540 1.127 19.93 24.38 0 86
10 to 14 20914.2
4 11.120 .769 12.73 15.76 0 47
15 to 19 499 9.07 9.587 .429 8.22 9.91 0 54
20s 734 8.41 9.691 .358 7.70 9.11 0 55
30s 235 8.46 10.435 .681 7.12 9.80 0 59
40s 203 8.06 9.912 .696 6.69 9.43 0 60
50s 18411.7
4 11.544 .851 10.06 13.42 0 60
60s 22116.0
8 15.101 1.016 14.08 18.08 0 87
70s 25619.3
3 15.466 .967 17.42 21.23 0 85
80s 14419.9
4 14.292 1.191 17.58 22.29 0 65
Total 287512.1
9 12.692 .237 11.72 12.65 0 87
Non-Perseverative Errors (Grant and Berg)
Age N
Mean
Std. Deviation Std. Error95% Confidence Interval for Mean Minimum Maximum
Lower BoundUpper Bound
5 to 9 19025.29 19.344
1.403 22.52
28.06 0
96

10 to 14 209
15.59 13.655
.945 13.73
17.46 0
77
15 to 19 499
10.85 13.289
.595 9.68
12.02 0
102
20s 7349.19 10.793
.398 8.41
9.98 0
87
30s 23511.43 15.630
1.020 9.42
13.43 0
97
40s 2039.67 11.623
.816 8.06
11.27 0
93
50s 18413.09 13.259
.977 11.16
15.02 0
91
60s 22119.00 19.863
1.336 16.37
21.63 0
96
70s 25622.07 20.356
1.272 19.57
24.58 0
110
80s 14426.32 23.887
1.991 22.38
30.25 1
102
Total2875
14.23 16.364
.305 13.63
14.83 0
110
35
ReferencesBerg, E. A. (1948). A simple objective for measuring flexibility in thinking. Journal of
General Psychology, 39, 15-22.
Eling, P., Derckx, K., & Maes, R. (2008). On the historical and conceptual background of the Wisconsin Card Sorting Test. Brain and Cognition, 67, 247-253.
Flashman, L. A., Horner, M. D., Freides, D. (1991). Note on scoring perseveration on the Wisconsin Card Sorting Test. The Clinical Neurologist, 5, 2, 190-194.
Feldstein, S. N., Keller, F. R., Portman, R. E., Durham, R. L., Klebe, K. J., Davis, H. P. (1999). A comparison of computerized and standard versions of the Wisconsin Card Sorting Test. The Clinical Neurologist, 13, 3, 303-313.
Goldstein, K., & Gelb, A. (1918). Psychologische Analysen hirnpathologischer Falle auf Grund von Untersuchungen Hirnverletzer. Zeitschrift fur die gesamte Neurologie und Psychiatrie, 41, 1-142.
Goldstein, K. & Scheerer, M. (1941). Abstract and concrete behavior: An experimental study with special tests. Psychological Monographs, 53, 1-151.

Grant, D. A., & Berg, E. (1948). A behavioral analysis of degree of reinforcement and ease of shifting to new responses in a Weigl-type card-sorting problem. Journal of Experimental Psychology, 38, 404-411.
Milner, B. (1963). Effects of different brain lesions on card sorting: The role of the frontal lobes. Archives of Neurology, 12, 100-110.
Marotta, J. J., & Behrmann, M. (2004). Patient Schn: has Goldstein and Gelb’s case withstood the test of time? Neurpsychologia, 42, 633-638.
Nelson, H. E. (1976). A modified card sorting test sensitive to frontal lobe defects. Cortex, 12, 313-324.
Nyhus E., & Barceló F. (2009).The Wisconsin Card Sorting Test and the cognitive assessment of prefrontal executive functions: a critical update. Brain and Cognition, 71(3), 437-451.
Settlage, P., Zable, M., & Harlow, H. F. (1948). Problem solution by monkeys following bilaterial removal of the prefrontal areas: VI Performance on tests requiring contradictory reactions to similar and to identical stimuli. Journal of Experimental Psychology, 38, 50-65.
Weigl, E. (1942). On the psychology of so-called processes of abstraction. Journal of Abnormal and Social Psychology, 36, 319-342.
36Zable, M. & Harlow, H. F. (1945). The performance of rhesus monkeys on series of
object-quality and positional discriminations and discrimination reversals. Journal of Comparative Psychology, 39, 13-23.

37


