Manufacturer of Flow32, FLGS-TDP, & SapIP Wireless Sap Flow Systems, HPFM, DEX, and Sensors US Representative for Delta-T Devices, Ltd. US Representative for Gill sonic anemometers US Representative for ForceA Systems Integrator for Campbell Scientific A Primary Source for Plant Science Research Equipment
Transcript
Manufacturer of Flow32, FLGS-TDP, & SapIP Wireless Sap Flow Systems, HPFM, DEX, and Sensors
US Representative for Delta-T Devices, Ltd.
US Representative for Gill sonic anemometers
US Representative for ForceA
Systems Integrator for Campbell Scientific
A Primary Source for Plant Science Research Equipment
Introducing SapIP
Remote Sensor Logger &
Agrisensors.NET
All water transpired moves via Sap Flow through the trunk, branches, and stems where it may be measured by sap flow
sensors
Sap flow sensors wrap completely around the branch or stem
(Qf)
Heat balance sensors heat the stem using a heater strip with constant power. Measure
the heat loss to the ambient (Qr). The remaining heat is carried by the sap (Qf)*
(Qr)
HOW?
Measure the temperature increase (+) and convert the heat to a flow rate based on the cooling effect of water (Specific Heat = Cp).
Heater Strip
Temp Sensor (-)
Temp Sensor (+)
* Stem Heat Balance Method (S.H.B.)
Agrisensors.NET Remote Logging Network
Internet Protocol
Application Server
User’s Record Manager
Network Server
Gateway
SapIP – Network Loggers
SapIP Advantages •Data on the spot with wireless mesh radio network
•Remote access from anywhere with Internet
•Remote Control and Monitoring Status
•“Real-Time” Data updated in minutes
•Reduce cable cost and travel costs
•Improve data storage capacity and multi-point access
•Logger storage and automatic network storage
•NO user programming required – all systems preconfigured
•Password protected data access
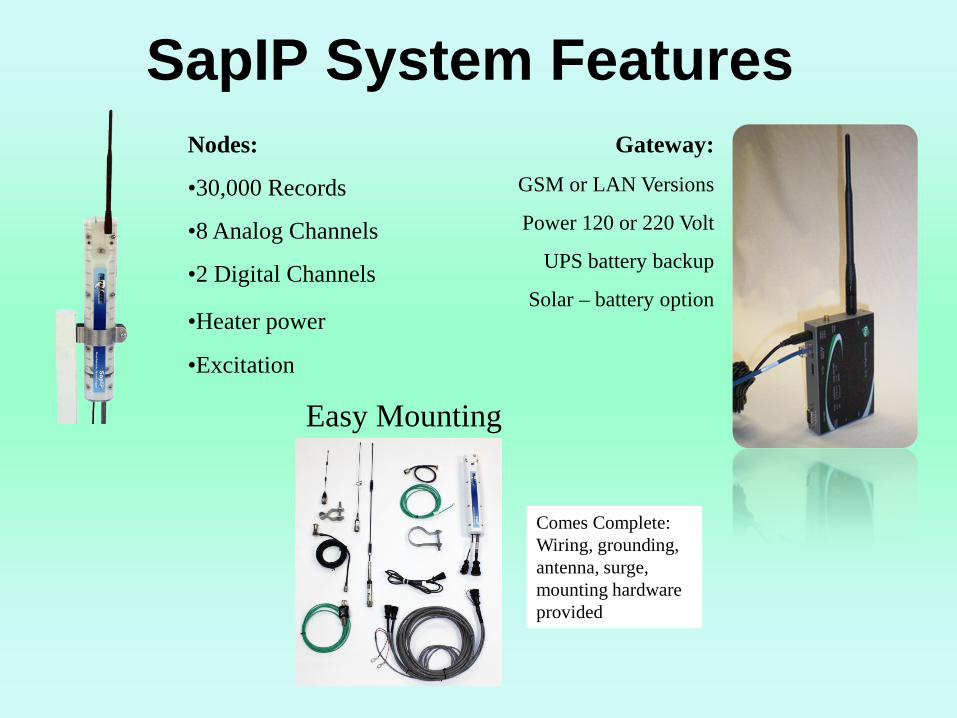
SapIP System Features
Easy Mounting
Comes Complete: Wiring, grounding, antenna, surge, mounting hardware provided
Gateway: GSM or LAN Versions
Power 120 or 220 Volt
UPS battery backup
Solar – battery option
Nodes:
•30,000 Records
•8 Analog Channels
•2 Digital Channels
•Heater power •Excitation
SapIP Nodes
Sap Flow or TDP Micro-Climate Kit Weather Parameters, ET
Soil Moisture Node w/ Soil Moisture Profile
SapIP REP Repeater
700 m hops to SapIP Nodes
2.4 Ghz High Gain - 500 m Range
900 Mhz High Gain – 1000 m Range
SapIP Loggers for Different Purposes
What is a Mesh?
Data Paths
Mesh is like a net, with many points interconnect.
Relay Node
SapIP Logger Node
5 Hops Max
Platform Included
LAN - anywhere
Completely Developed Cloud
Computing Platform !
Cellular MODEM Gateway - GSM
• Customized Dynamax Gateways
• Platform Server Provided
• International Support
•1-5 yr license available
WEB Access Data Agrisensors.NET
Dynamax Server
Access & Data Security
Control SapIP Devices
Start & Stop Devices
Modify Setup
Download Data
Report Data Integrity
Locate on Satellite Map
Agrisensors Server for SapIP
Complete logging & control
User specified graphics
Download or upload data remotely
Records configuration changes
On-Line support services!
Get Status Report from individual SapIP nodes View Sensors, Channels, and Configuration
Compare ET & Plant Water Use
Daily Sap Flow of Tangerine
Grams or Gallons per Hour
Accumulated Sap Flow of Tangerine
September 2015
Download Raw Data and Calculated Results
Basic Data Collection Sap flow data & actual plant water use Accumulated daily total water use Weather Data - ETo Plant water use
comparisons Soil Moisture profiles, 4 or 6 levels Weekly irrigation schedule Chill Portion, Frost Warnings Growing Degree Day
Agrisensors site data
Dynamax Inc 2014
Select the Reports Tab and select the SapIP SITE 1 7/4 TO 7/9 1-6 days shows the quarter hourly sap flow readings. (g/hr). CIMIS data from Fresno State reported below.
7/4 To 7/9 ETo (mm)
0
0.1
0.2
0.3
0.4
0.5
0.6
0.7
0.8
0.9
1
100 700 1300
1900 100 700 1300
1900 100 700 1300
1900 100 700 1300
1900 100 700 1300
1900 100 700 1300
1900
Time
mm ETo (mm)
Sap Flow data Weather data, ETp Calculate Kc on wet days, Ks on dry days Two Kinds – Crop Water Stress Index CWSI = (Etm- Eta)/Etm (Textbook definition) Water “Stress Factor” CWSF = Ks/Kc So if Stress Factor = 0.75
Transpiration is 75 % of maximum T New terminology, but simple for sap flow
Plant Stress Data Analysis
Ratio of Sap Flow / ETo= Stress Factor
Dynamax Inc 2014
0
2
4
6
8
10
12
Sap Flow vs ETo CIMIS FSU Campus(mm) 12.7 mm = 1/2 in
Eto -Cimis
Eta -SF
Kc = 1.0 to 1.05
Note that the 28th and the 30th are low ET days. Cooler weather are not normally days to set Kc for July.
Ks after stress induced – 7 days before shaking 10 hrs @ Aug 5 7 hrs @ Aug 8
Sap Flow Ks is highly correlated to Stem Water Potential
Simple Data Presentation • Plant water use curves, hourly water use
• Total daily water use - extrapolated to whole plants
• Stress Factor bar chart
• Growers need only decide how much plant stress can be tolerated before irrigating
• Growers also know about how much water should be applied
• Water can be conserved if irrigation schedule is reduced and Stress Factor remains at 1.0
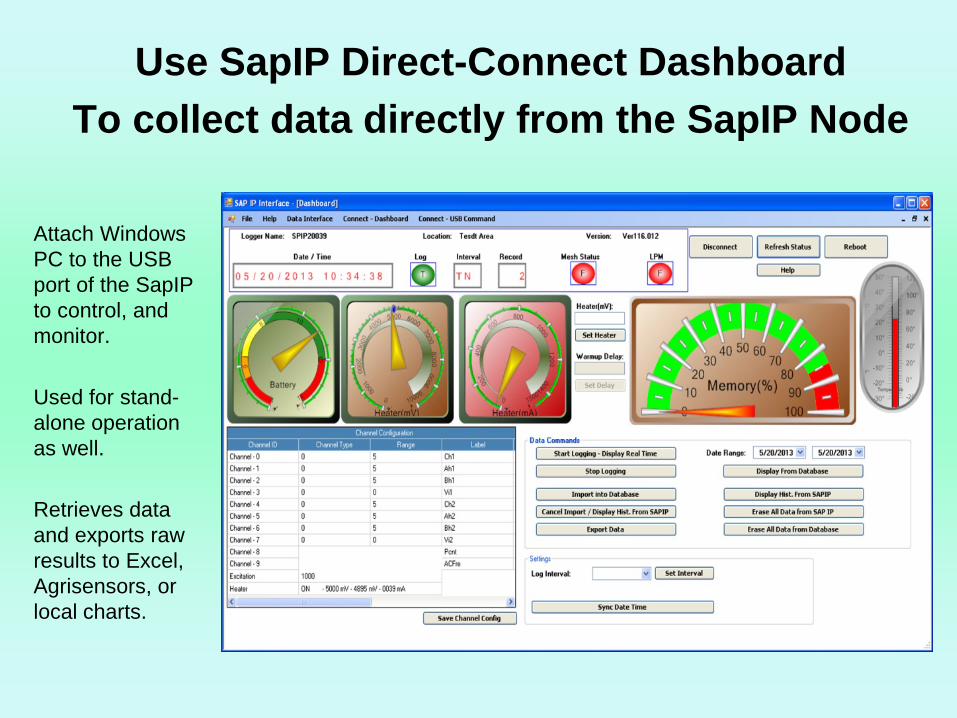
Use SapIP Direct-Connect Dashboard To collect data directly from the SapIP Node
Attach Windows PC to the USB port of the SapIP to control, and monitor. Used for stand-alone operation as well. Retrieves data and exports raw results to Excel, Agrisensors, or local charts.
SapIP Benefits • Using the plant to determine crop water use and
stress levels • Irrigation scheduling using “Stress Factor” • Water conservation • Monitor sap flow, soil moisture, and weather, all
through one network • Agrisensors.NET data graphs and charts
SapIP Applications • Irrigation Scheduling
• Works on - Almond, Grape, Citrus, Pecan, Peach, Plum, Pistachio, Corn, Cotton, Soybean, Sunflower, Walnut, and many more crops and trees
• Stress management
• Scalable to cover large areas
• Water balances
• Soil moisture or weather station networks
• Phytoremediation and Water Balances
• Drought tolerance evaluation
IRT – IR Leaf Temp System
• Wireless IR Temperature • Leaf temperature • Plant stress measurement • Irrigation scheduling • For center pivot or other
irrigation systems • Uses low-cost Zigbee
coordinators • Developed with USDA-ARS
Dynamax IRT Sensors • Measure IR temperature +/- 0.5 C • 10 degree Field of View • Leaf temperature relates to plant stress • Wireless, Analogue, & SDI versions • Compare to CWSI or other Stress Model • Excellent for use with drip or center pivot
irrigation systems • For use on crops where sap flow will not
work, or on moving platforms
XBIB Coordinator • XBIB Coordinator connected to PC • “IRT Watcher” Software • Will handle up to (10) IRT Sensors or
Repeaters • 300 to 500 meter “Line of Sight” • Use Repeaters to add distance, 500 meters • Up to (25) IRT possible with Repeaters
IRT-SALH Data Loggers • Monitors up to (25) IRT • Stress Accumulator Software • ZB Link Transmitter • Memory for 65,000 records • SD Card Slot for Data • WiFi for data collection, 20-50 ft • Webpage data access, Mapping