BUSHOR-1138; No. of Pages 10 Manufacturing outsourcing, onshoring, and global equilibrium David Owen Kazmer Department of Plastics Engineering, University of Massachusetts Lowell, 1 University Avenue, Lowell, MA 01854, U.S.A. 1. Manufacturing matters Manufacturing embodies the creation of wealth through the literal conversion of lower-cost materials to higher-valued products. Manufacturing industries have historically provided a variety of skilled and unskilled positions with relatively high salaries that contribute to a prosperous middle class. Contrary to public perception, manufacturing wages have not declined over the last few decades; rather, the aver- age hourly earnings of U.S. manufacturing employees increased to $24.27 by April 2013, according to Federal Reserve Economic Data. Manufacturing thus Business Horizons (2014) xxx, xxx—xxx Available online at www.sciencedirect.com ScienceDirect www.elsevier.com/locate/bushor KEYWORDS Employment; Forecasting; Manufacturing; Multinationals; Onshoring; Outsourcing Abstract Manufacturing is now a national strategy for many countries to combat slow economic growth, and positively viewed with the current trend of onshoring foreign manufacturing operations. We develop a cross-country regression model that predicts manufacturing employment as a function of population growth, foreign direct investment, and purchasing power parity. Results through the year 2100 suggest that manufacturing is trending toward a global equilibrium with higher levels of manufacturing outputs but much lower levels of manufacturing employment. The reason is that countries tend to evolve from having little manufacturing to commodity manufacturing at large scale and low wages. As infrastructure and human capital develop, there is the tendency to pursue advanced manufacturing in support of higher valued goods. The manufacture of commodity products is then outsourced to those countries with lower costs justified by their less-developed infrastructure and human capital, and so the virtuous cycle continues. While this model suggests that current efforts in revitalization of domestic manufacturing would lead to an increase in wealth in the United States, the bad news is that these gains are unlikely to be sustainable in the long term. However, the good news is that manufacturing acts as a rising tide that raises all nations and our global quality of life. # 2014 Kelley School of Business, Indiana University. Published by Elsevier Inc. All rights reserved. E-mail address: [email protected]http://dx.doi.org/10.1016/j.bushor.2014.03.005 0007-6813/# 2014 Kelley School of Business, Indiana University. Published by Elsevier Inc. All rights reserved.
Transcript
BUSHOR-1138; No. of Pages 10
Manufacturing outsourcing, onshoring, and globalequilibrium
David Owen Kazmer
Department of Plastics Engineering, University of Massachusetts Lowell, 1 University Avenue, Lowell,MA 01854, U.S.A.
Abstract Manufacturing is now a national strategy for many countries to combatslow economic growth, and positively viewed with the current trend of onshoringforeign manufacturing operations. We develop a cross-country regression model thatpredicts manufacturing employment as a function of population growth, foreigndirect investment, and purchasing power parity. Results through the year 2100 suggestthat manufacturing is trending toward a global equilibrium with higher levels ofmanufacturing outputs but much lower levels of manufacturing employment. Thereason is that countries tend to evolve from having little manufacturing to commoditymanufacturing at large scale and low wages. As infrastructure and human capitaldevelop, there is the tendency to pursue advanced manufacturing in support of highervalued goods. The manufacture of commodity products is then outsourced to thosecountries with lower costs justified by their less-developed infrastructure and humancapital, and so the virtuous cycle continues. While this model suggests that currentefforts in revitalization of domestic manufacturing would lead to an increase inwealth in the United States, the bad news is that these gains are unlikely to besustainable in the long term. However, the good news is that manufacturing acts as arising tide that raises all nations and our global quality of life.# 2014 Kelley School of Business, Indiana University. Published by Elsevier Inc. Allrights reserved.
1. Manufacturing matters
Manufacturing embodies the creation of wealththrough the literal conversion of lower-cost materialsto higher-valued products. Manufacturing industries
http://dx.doi.org/10.1016/j.bushor.2014.03.0050007-6813/# 2014 Kelley School of Business, Indiana University. Pub
have historically provided a variety of skilled andunskilled positions with relatively high salaries thatcontribute to a prosperous middle class. Contrary topublic perception, manufacturing wages have notdeclined over the last few decades; rather, the aver-age hourly earnings of U.S. manufacturing employeesincreased to $24.27 by April 2013, according toFederal Reserve Economic Data. Manufacturing thus
continues to be of significant economic and politicalinterest, as evidenced by recent federal initiativesrelated to advanced manufacturing (Wessner &Wolff, 2012). Such advanced manufacturing empha-sizes the creation of highly valued products such assolar cells, hybrid vehicles, and pharmaceuticalsover commodity products such as toys and bolts(Hausmann, 2013).
A real issue in the United States is the fact thatmanufacturing employment peaked at 19.6 million inMay 1979, and has since fallen to just under 12 millionas of April 2013. The decline is even more significantwhen viewed in proportion to the size of the work-force, with manufacturing employment decliningfrom 30.9% in 1979 to 7.7% in 2013. Manufacturingemployment has declined even further when viewedas a fraction of the total population.
The reduction in the manufacturing workforce isdue to a number of factors, including internationaloutsourcing and productivity gains, which are lateranalyzed in some detail. First, however, consider thedata provided in Figure 1, which plots manufacturingemployment along with the publication frequencyof terms including ‘manufacturing,’ ‘globalization,’and ‘outsourcing.’ It is apparent that the publicationfrequency of the term ‘manufacturing’ generallyfollows the level of manufacturing employment.
The notable exception is the significant peak in thepublication frequency of ‘manufacturing’ around1990, after which there was a very significant declinein both the publication frequency of ‘manufacturing’as well as the level of manufacturing employment.Around this same time, there were significant in-creases in the publication frequency of the terms‘globalization’ and ‘outsourcing.’ Both these terms
Figure 1. Historical manufacturing employment andpublication frequency of related terms
seem to have peaked by 2008. It is interesting to notethat the term ‘advanced manufacturing’ is a currentbuzzword in some political and technical circles. Itlast peaked in 1990, a time of recession, at a rate of0.21 occurrences per million published words beforedeclining to less than 0.04 occurrences per millionpublished words in 2008; however, the current rate issurely higher.
Reflecting on the data of Figure 1, we hypothesizethat significant structural changes have occurredin manufacturing due to globalization; perhaps aplateau in manufacturing employment will be ob-tained. The current effort seeks to model the mostsignificant contributing factors. By understandingthe dynamics of manufacturing employment, wecan predict future employment levels.
2. Outsourcing and onshoring
The decision to outsource, either to foreign ordomestic suppliers, has significant ramificationson the long-term structure and capability of a firm(Coase, 1937). It is a widely held belief among thepublic that labor costs are primarily responsible foroutsourcing (Garrett, 2004), but in actuality, com-petitive strategy and accompanying supply chaindesigns are driven by many factors. Table 1 listssome of the decision factors, grouped by whetherthey are related to increased revenues, reducedcosts, or other factors. A detailed discussion of thesefactors is beyond the scope of this article, but somerelevant references are indicated in Table 1 forperusal by the interested reader.
The author believes that the rise in foreign out-sourcing and corresponding decline in domesticmanufacturing employment were enabled by de-creasing transaction costs related to informationand transportation that increased access to eco-nomical overseas suppliers. For example, in 1990the author was an engineer at General Electric,where he participated in a teleconference via sat-ellite with colleagues in Japan. Both sites had theirown internal videoconferencing facility but the sat-ellite rental still cost $3,000/hour–—in 1990 dollars!Today, of course, a higher quality connection can beprocured at negligible cost, directly from eachpeer’s electronic device. Similar, if less pronounced,productivity gains in containerized shipping havealso facilitated the development of robust interna-tional trade (Gouvernal & Slack, 2012).
There is anecdotal evidence–—of which the U.S.Federal Reserve is aware (Kliesen & Tatom, 2013)–—that some manufacturers are returning part or all oftheir foreign production to domestic facilities,an action that has been termed onshoring. Rising
BUSHOR-1138; No. of Pages 10
Table 1. Some determinants of outsourcing decisions with those factors included in the current model markedwith an asterisk
To increase revenues To reduce costs Other factors
Manufacturing outsourcing, onshoring, and global equilibrium 3
overseas costs appears to be a primary motivationfor onshoring. However, there are other strategicconcerns: intellectual property, domestic goodwill,risk management, and taxes, among others. Anoverview of multinational manufacturing strategiesis described elsewhere (e.g., Deng, 2007; Kogut &Kulatilaka, 1994; Ramamurti, 2012). The impact ofoutsourcing and onshoring at the level of individualfirms is not the focus of this article, though thepresented results may suggest changes in manu-facturing strategy.
3. A rising tide model
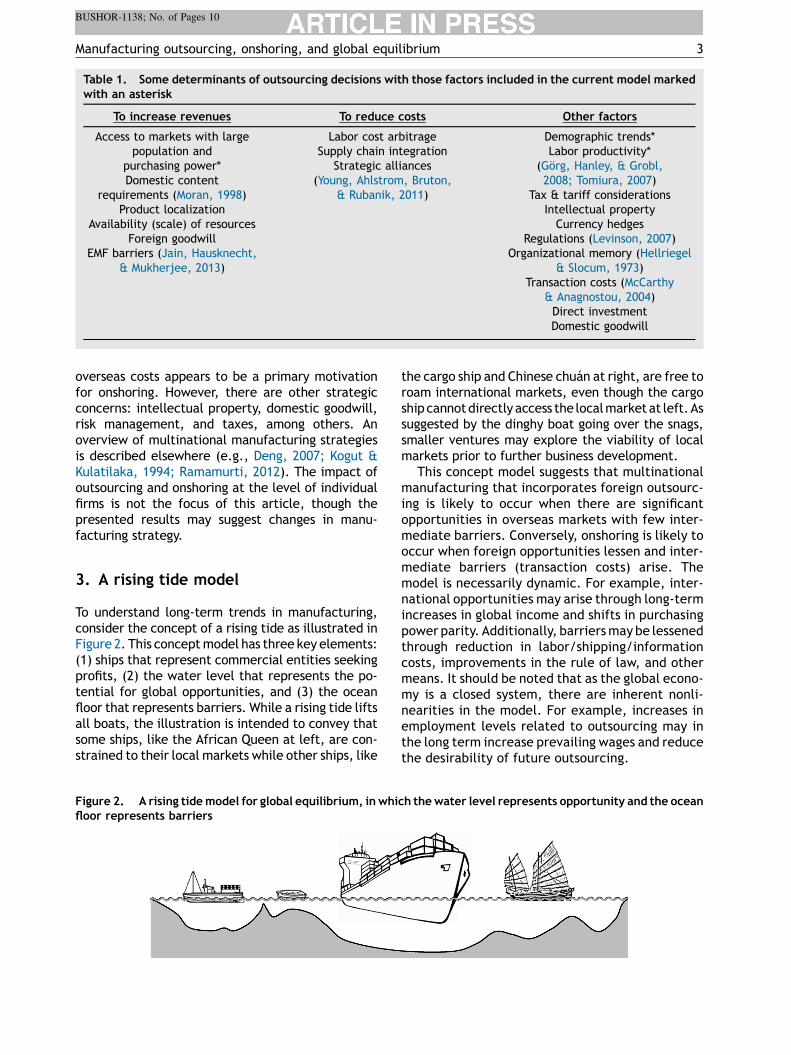
To understand long-term trends in manufacturing,consider the concept of a rising tide as illustrated inFigure 2. This concept model has three key elements:(1) ships that represent commercial entities seekingprofits, (2) the water level that represents the po-tential for global opportunities, and (3) the oceanfloor that represents barriers. While a rising tide liftsall boats, the illustration is intended to convey thatsome ships, like the African Queen at left, are con-strained to their local markets while other ships, like
Figure 2. A rising tide model for global equilibrium, in whifloor represents barriers
the cargo ship and Chinese chuan at right, are free toroam international markets, even though the cargoship cannot directly access the local market at left. Assuggested by the dinghy boat going over the snags,smaller ventures may explore the viability of localmarkets prior to further business development.
This concept model suggests that multinationalmanufacturing that incorporates foreign outsourc-ing is likely to occur when there are significantopportunities in overseas markets with few inter-mediate barriers. Conversely, onshoring is likely tooccur when foreign opportunities lessen and inter-mediate barriers (transaction costs) arise. Themodel is necessarily dynamic. For example, inter-national opportunities may arise through long-termincreases in global income and shifts in purchasingpower parity. Additionally, barriers may be lessenedthrough reduction in labor/shipping/informationcosts, improvements in the rule of law, and othermeans. It should be noted that as the global econo-my is a closed system, there are inherent nonli-nearities in the model. For example, increases inemployment levels related to outsourcing may inthe long term increase prevailing wages and reducethe desirability of future outsourcing.
ch the water level represents opportunity and the ocean
BUSHOR-1138; No. of Pages 10
Figure 3. Historical manufacturing employment andpublication frequency of related terms
We next develop a cross-country regression modelto forecast the long-term macroeconomic trends inmanufacturing employment. The factors included inthe model are indicated with an asterisk in Table 1and were chosen based on their availability andmacroeconomic significance. Many of the other fac-tors in Table 1 are not considered due to the com-plexity associated with their model implementation,as well as significant quantitative uncertainties. Theanalysis proceeds in the spirit of a model developedby Borensztein, De Gregorio, and Lee (1998) to de-scribe how foreign direct investment (FDI) affectseconomic growth. The foreign direct investment isreported as part of the national accounts for allcountries and represents the net annual inflows ofinvestment such as the sum of equity capital; otherlong-term capital; and short-term capital, includingparticipation in management, joint-venture, trans-fer of technology, and expertise.
Borensztein et al. (1998) found that FDI contrib-uted relatively more to growth than domesticinvestment but requires a minimum threshold stockof human capital to be productive. By ‘humancapital,’ we mean the literal investment in humancapability through education and training as inves-tigated by Mincer (1958) and Becker (1964). Wehypothesize that FDI is more productive than do-mestic investment since it provides an avenue forthe transfer of knowledge and technology thatwould otherwise be slow to develop organically.Our subsequent findings agree with those ofBorensztein et al., which indicate that the accumu-lation of FDI is a key enabler of human capital andindustry capability.
4. The nitty gritty
Our model considers four different data streamsthat are available for a number of countries (c)and a number of years (t). The four data streamswe consider with their originating sources are:
1. human population statistics/forecasts, Hc2[1,230],
t2[1950,2100] (‘‘World Population,’’ 2011);
2. purchasing power parity (PPP) per capita,rgdplc2[1,189],t2[1950,2010] (Heston, Summers, &Aten, 2002);
4. foreign direct investment, FDI c2[1,213],t2[1970,2011](‘‘Foreign Direct Investment,’’ 2013).
The availability of the data varies by country andtime, as indicated by the set notation provided witheach index.
We acknowledge that the data was somewhatsparse and, at times, aggregated across multiplesources. Specifically, extensive manufacturingemployment data was available (‘‘InternationalLabor,’’ 2013) for 19 countries between 1950 and2010, but only provided relative to 2002 employ-ment levels. As such, this relative data was scaledwith the International Labor Organization (ILO)manufacturing employment data (‘‘LABORSTA,’’2012). The resulting manufacturing employmentdataset was finally augmented with the remainingavailable data for 99 other countries between 1979and 2008 from the ILO; the resulting dataset formanufacturing employment had a density of 59%. Bycomparison, the FDI and PPP data were quite com-plete with a density around 78%, with historical dataincreasingly becoming available for less-populouscountries as a function of time. Human populationforecasts were perfectly complete, though of courseuncertain.
To provide some intuition into the data, a scatterplot of the total foreign direct investment as afunction of the purchasing power parity per capitais provided in Figure 3 for the largest 33 countriestotaling just over 80% of the global population. Inthis figure, the countries are identified with a three-letter country code, and the area of each circlerepresents that country’s population. There is asignificant correlation between the FDI and thePPP as shown by two regression models of similarquality. Those countries above the regression lineare attracting more foreign direct investment thanwould be expected based on purchasing power pari-ty and population alone. In 2010, China was the most
BUSHOR-1138; No. of Pages 10
Manufacturing outsourcing, onshoring, and global equilibrium 5
significant positive outlier while Japan was the mostsignificant negative outlier.
Figure 3 provides a snapshot of the relationshipsbetween foreign direct investment and purchasingpower parity in 2010. Historically, foreign direct in-vestment has risen from less than 1% of gross worldproduct (GWP) in 1980 to a peak of 5% of GWP in 2008,and remained around 3% of GWP in 2012. Foreigndirect investment at the individual country level ishighly cyclical due to many factors; such cyclic be-havior cannot be reliably forecast. Accordingly, thefirst regression model of FDI provided in Figure 3 isadopted here. Specifically, we consider the amount offoreign direct investment as a sole function of the sizeof each country’s human population (H) and purchas-ing power parity (PPP) according to the function:
where FDI is in 2010 US$, PPP is in 2010 US$, and H isin thousands of people. The resulting model has acoefficient of determination, R2, of 69%, which isconsidered reasonable given model simplicity andthe high variability of FDI and many other determin-ing factors at play.
Figure 4 plots the foreign direct investment for115 countries as a function of their gross domesticproduct (GDP) between 1971 and 2010. As indicatedearlier, significant variations are observed, with FDItypically ranging from negative 5% to nearly 50% ofGDP. Countries with very high FDI exceeding 30% ofGDP include Belgium in 2007, Hong Kong in 1999,Hungary in 2007, Iceland in 2006, and Ireland in 2008.However, FDI can quickly be pulled back as someof these and other countries also had negativeFDI (meaning divestiture), with the minimum being
Figure 4. Historical and forecast foreign directinvestment
-12.5% of GDP for Hungary in 2009. Generally, FDI inthe United States is more consistent but tracks wellwith the economic downturns of 2001 and 2008.
Figure 4 also provides foreign direct investmentforecasts through the year 2100 according to themodel of equation (1); the implemented growthmodels cannot forecast the cyclic behavior histori-cally observed given the stability of their input datastreams. Overall, the total FDI across the 109 coun-tries is forecast to be valued at 2.6% of the globalworld production in the year 2100. It is emphasizedthat each country’s FDI is scaled relative to GDP. Assuch, it may appear that the forecast FDI is decliningfor some countries, such as indicated for China.However, these countries’ FDI is actually increasingand only decreasing relative to their GDP, given thesignificant growth forecast in their GDP, as discussednext.
The forecast of the manufacturing employment ismodeled as a function of annual productivity gainsand foreign direct investment. Borensztein et al.(1998) suggest that due to maintenance costs asso-ciated with implemented operations, growth in FDIis required to motivate growth in manufacturingemployment. Following a model form similar to thatof Borensztein et al., we implement an empiricalmodel whereby the change in the manufacturingemployment (M) is proportional to productivitygains and the change in foreign direct investment:
dM
dt¼ ap þ aFDI
dFDI
dt(2)
where M is in thousands of workers and FDI is in 2010US$. The coefficient aP, which is typically negative,represents the relative change in employment due toannual productivity gains. The coefficient aFDI, typi-cally positive, represents the relative change in em-ployment associated with changes in FDI such that ifFDI declines, so will manufacturing employment.These model coefficients are characterized usinghistorical manufacturing data as described later.
The model relies on closure of FDI through equa-tion (1), based on human population and purchasingpower parity (PPP). Human population forecasts havehigh fidelity in the near future and are reasonablyreliable through 2100. To forecast purchasing powerparity, a growth model is applied having the form:
dPPP
dt¼ aG þ aM
dðM=HÞdt
(3)
where PPP is measured in 2010 US$, M is measured inthousands of workers, and H is measured in thou-sands of population. Equation (3) states that pur-chasing power parity will tend to increase due toother organic growth in the economy, as well as
BUSHOR-1138; No. of Pages 10
6 D.O. Kazmer
increased manufacturing employment as a propor-tion of the human population in a given country.Here, the coefficient aG, typically positive, repre-sents the relative annual change in purchasing pow-er parity not associated with manufacturingemployment, while aM, typically positive, repre-sents the relative change in purchasing power parityassociated with changes in manufacturing employ-ment as a fraction of the human population (M/H).
The implemented model has only five variables(M, H, PPP, FDI, and t) and seven coefficients. Of thecoefficients, the three coefficients in equation (1)were derived from regression of 2010 FDI data acrossthose countries having the 30 largest economies,together representing over 80% of the global worldproduction. This model is considered somewhatreasonable since the regression was repeated forthose countries with the 156 largest economies,representing over 99.9% of GWP, and found to besimilar. Of course, this empirical model is onlyindicative of the 2010 market behavior.
The other four coefficients for equations (2) and(3) were found by nonlinear optimization by com-paring model predictions against historical data.Specifically, an objective function (O) was definedbased on the sum of squared normalized error acrossc countries and t time observations:
O ¼Xc
Xt
MPrec;t � MObs
c;t
MObsc;t
!2
þPPPPre
c;t � PPPObsc;t
PPPObsc;t
!2
(4)
Figure 5. Correlation of observations and predictions ba
0 2 4 6 8 10
5
10
15
20
Pre dicted Manu facturing E
Obs
erve
d (%
Pop
ulat
ion)
0 10 20 30
10
20
30
40
50
60
Predicted Pur chasing Pow
Obs
erve
d (2
010
US
$100
0)
where MObs and MPre are the observed and predictedmanufacturing employment and PPPObs and PPPPre
are the observed and predicted purchasing powerparity. The model was developed in Matlab to handlemissing data, and the optimization was performedto minimize O with the Matlab function fmincon to aconvergence tolerance of 10-8%.
Figure 5 plots the correlation of the observationsand predictions for manufacturing employmentand purchasing power parity for the resulting mod-els fit to historical data between 1971 and 2010.Some significant variances are observed. For exam-ple, the manufacturing employment has some data-sets for which manufacturing employment ispredicted to vary but the observed employmentis constant. These cases typically correspond tosmaller countries having a high proportion ofmanufacturing employment that is uncertain. Evenso, the correlations provided in Figure 5 indicate thatthe models provide reasonable fidelity and may beuseful for forecasting the future equilibrium ofmanufacturing.
5. Manufacturing employmentequilibrium
One might expect that manufacturing employmentwill generally decline due to productivity gains,especially since the models are derived based onhistorical data. This expectation is readily observedin Figure 6, which plots the historical and forecast
sed on 1990—2010 data
0 12 14 16 18 20mployment (% Pop ulation)
Data (2,038 po ints)
MObs=0.91*MPre; R2=0.86
0 40 50 60er Par ity (2010 US$10 00)
Data (2 ,172 po ints)
PPPObs=1.05*PPPPre; R2=0.94
BUSHOR-1138; No. of Pages 10
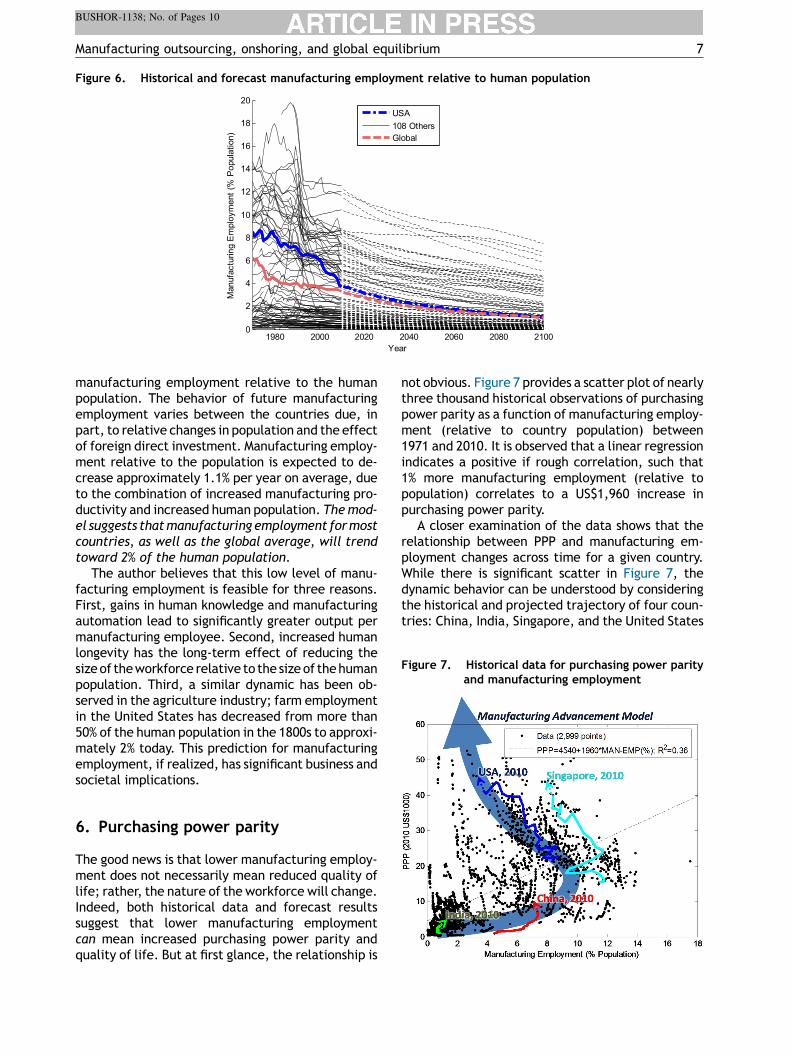
Figure 6. Historical and forecast manufacturing employment relative to human population
1980 2000 202 0 2040 2060 208 0 210 00
2
4
6
8
10
12
14
16
18
20
Yea r
Man
ufac
turin
g E
mpl
oym
ent (
% P
opul
atio
n)
USA108 OthersGlobal
Figure 7. Historical data for purchasing power parityand manufacturing employment
Manufacturing outsourcing, onshoring, and global equilibrium 7
manufacturing employment relative to the humanpopulation. The behavior of future manufacturingemployment varies between the countries due, inpart, to relative changes in population and the effectof foreign direct investment. Manufacturing employ-ment relative to the population is expected to de-crease approximately 1.1% per year on average, dueto the combination of increased manufacturing pro-ductivity and increased human population. The mod-el suggests that manufacturing employment for mostcountries, as well as the global average, will trendtoward 2% of the human population.
The author believes that this low level of manu-facturing employment is feasible for three reasons.First, gains in human knowledge and manufacturingautomation lead to significantly greater output permanufacturing employee. Second, increased humanlongevity has the long-term effect of reducing thesize of the workforce relative to the size of the humanpopulation. Third, a similar dynamic has been ob-served in the agriculture industry; farm employmentin the United States has decreased from more than50% of the human population in the 1800s to approxi-mately 2% today. This prediction for manufacturingemployment, if realized, has significant business andsocietal implications.
6. Purchasing power parity
The good news is that lower manufacturing employ-ment does not necessarily mean reduced quality oflife; rather, the nature of the workforce will change.Indeed, both historical data and forecast resultssuggest that lower manufacturing employmentcan mean increased purchasing power parity andquality of life. But at first glance, the relationship is
not obvious. Figure 7 provides a scatter plot of nearlythree thousand historical observations of purchasingpower parity as a function of manufacturing employ-ment (relative to country population) between1971 and 2010. It is observed that a linear regressionindicates a positive if rough correlation, such that1% more manufacturing employment (relative topopulation) correlates to a US$1,960 increase inpurchasing power parity.
A closer examination of the data shows that therelationship between PPP and manufacturing em-ployment changes across time for a given country.While there is significant scatter in Figure 7, thedynamic behavior can be understood by consideringthe historical and projected trajectory of four coun-tries: China, India, Singapore, and the United States
BUSHOR-1138; No. of Pages 10
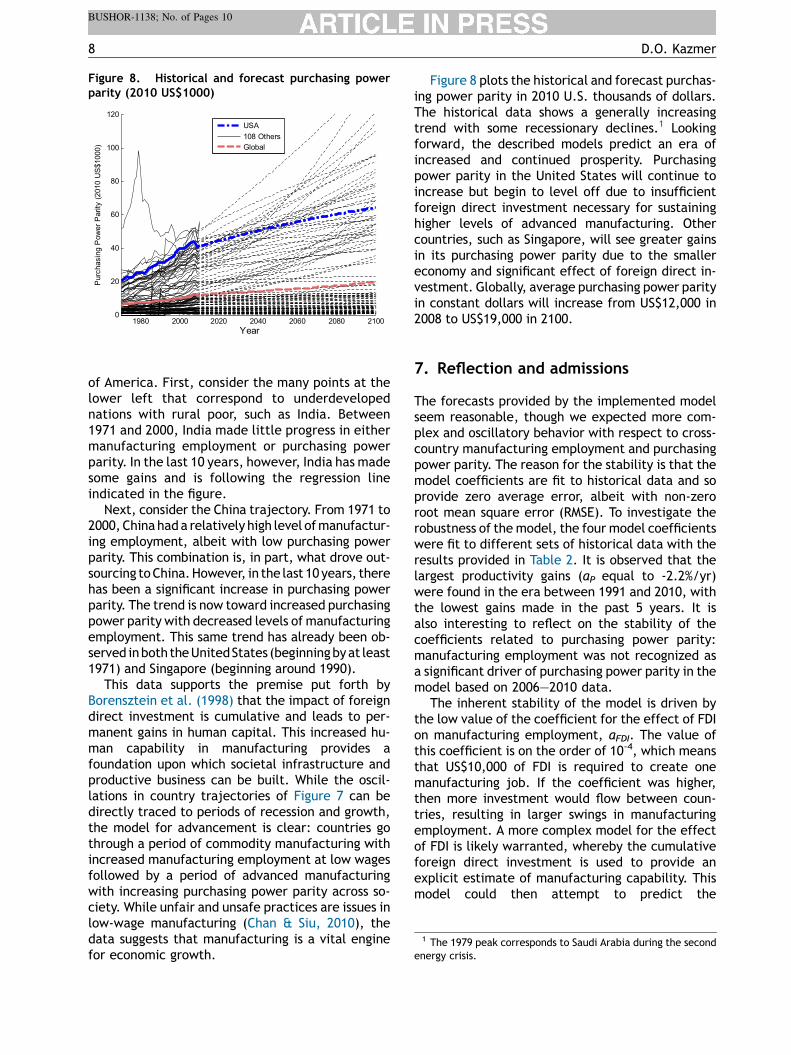
Figure 8. Historical and forecast purchasing powerparity (2010 US$1000)
1980 2000 202 0 2040 2060 208 0 210 00
20
40
60
80
100
120
Yea r
Pur
chas
ing
Pow
er P
arity
(20
10 U
S$1
000)
USA108 OthersGlobal
1 The 1979 peak corresponds to Saudi Arabia during the secondenergy crisis.
8 D.O. Kazmer
of America. First, consider the many points at thelower left that correspond to underdevelopednations with rural poor, such as India. Between1971 and 2000, India made little progress in eithermanufacturing employment or purchasing powerparity. In the last 10 years, however, India has madesome gains and is following the regression lineindicated in the figure.
Next, consider the China trajectory. From 1971 to2000, China had a relatively high level of manufactur-ing employment, albeit with low purchasing powerparity. This combination is, in part, what drove out-sourcing to China. However, in the last 10 years, therehas been a significant increase in purchasing powerparity. The trend is now toward increased purchasingpower parity with decreased levels of manufacturingemployment. This same trend has already been ob-served in both the United States (beginning by at least1971) and Singapore (beginning around 1990).
This data supports the premise put forth byBorensztein et al. (1998) that the impact of foreigndirect investment is cumulative and leads to per-manent gains in human capital. This increased hu-man capability in manufacturing provides afoundation upon which societal infrastructure andproductive business can be built. While the oscil-lations in country trajectories of Figure 7 can bedirectly traced to periods of recession and growth,the model for advancement is clear: countries gothrough a period of commodity manufacturing withincreased manufacturing employment at low wagesfollowed by a period of advanced manufacturingwith increasing purchasing power parity across so-ciety. While unfair and unsafe practices are issues inlow-wage manufacturing (Chan & Siu, 2010), thedata suggests that manufacturing is a vital enginefor economic growth.
Figure 8 plots the historical and forecast purchas-ing power parity in 2010 U.S. thousands of dollars.The historical data shows a generally increasingtrend with some recessionary declines.1 Lookingforward, the described models predict an era ofincreased and continued prosperity. Purchasingpower parity in the United States will continue toincrease but begin to level off due to insufficientforeign direct investment necessary for sustaininghigher levels of advanced manufacturing. Othercountries, such as Singapore, will see greater gainsin its purchasing power parity due to the smallereconomy and significant effect of foreign direct in-vestment. Globally, average purchasing power parityin constant dollars will increase from US$12,000 in2008 to US$19,000 in 2100.
7. Reflection and admissions
The forecasts provided by the implemented modelseem reasonable, though we expected more com-plex and oscillatory behavior with respect to cross-country manufacturing employment and purchasingpower parity. The reason for the stability is that themodel coefficients are fit to historical data and soprovide zero average error, albeit with non-zeroroot mean square error (RMSE). To investigate therobustness of the model, the four model coefficientswere fit to different sets of historical data with theresults provided in Table 2. It is observed that thelargest productivity gains (aP equal to -2.2%/yr)were found in the era between 1991 and 2010, withthe lowest gains made in the past 5 years. It isalso interesting to reflect on the stability of thecoefficients related to purchasing power parity:manufacturing employment was not recognized asa significant driver of purchasing power parity in themodel based on 2006—2010 data.
The inherent stability of the model is driven bythe low value of the coefficient for the effect of FDIon manufacturing employment, aFDI. The value ofthis coefficient is on the order of 10-4, which meansthat US$10,000 of FDI is required to create onemanufacturing job. If the coefficient was higher,then more investment would flow between coun-tries, resulting in larger swings in manufacturingemployment. A more complex model for the effectof FDI is likely warranted, whereby the cumulativeforeign direct investment is used to provide anexplicit estimate of manufacturing capability. Thismodel could then attempt to predict the
BUSHOR-1138; No. of Pages 10
Table 2. Coefficients for models fit to different historical data
HistoricalData
Annual productivityeffect, aP
Annual FDIeffect, aFDI
Annual PPPeffect, aG
Annual PPP/Meffect, aM
ModelRMSE
1971—2010 -0.0111 0.00096000 0.00035 0.0230 10.8%
1991—2010 -0.0222 -0.00000044 0.00036 0.1700 8.9%
2001—2010 -0.0051 0.00001400 0.01600 0.1200 1.4%
2006—2010 -0.0025 0.00011000 0.02000 -0.0012 0.5%
Manufacturing outsourcing, onshoring, and global equilibrium 9
manufacturing advancement behaviors observed inFigure 7, as well as more complex and oscillatorybehaviors in manufacturing employment forecasts.In tuning this FDI model, the fitting algorithm couldconsider multiple years of historical data ratherthan just the regression to the 2010 data, as re-ported here.
8. Past performance and futureresults
This article is based on past macroeconomic obser-vations. The described models are a highly simpli-fied representation of the global economy, and soimproperly ascribe past market performance solelyto manufacturing employment.
Still, the results of these simple models suggestsome important business trends on the horizon.First, there is currently significant interest in revi-talizing and advancing manufacturing in the UnitedStates. These efforts are well intentioned and, ifimplemented on a large scale, would lead to anincrease in wealth. However, the results suggestthat markets are efficient such that the continua-tion and integration of foreign direct investmentwill lead to increased technological capabilityoverseas and foreign outsourcing of advancedmanufacturing in the long term. In other words,the onshoring of U.S. manufacturing is unlikely tobe sustainable without additional incentives extrin-sic to the models developed here.
The primary conclusion of this work is that a globalmanufacturing equilibrium is likely in the long term,and perhaps even inevitable. Countries first evolvefrom having little manufacturing to commoditymanufacturing at large scale and low wages. Asinfrastructure and human capital develop, there isthe tendency to pursue more advanced manufactur-ing in support of higher wages. Companies, in turn,will seek to outsource the manufacture of commodityproducts to those countries with lower costs justifiedby their less-developed infrastructure and humancapital. The virtuous cycle continues as these poorercountries will subsequently advance through theirown accumulation of foreign direct investment. As
a closed system with a limited number of poor coun-tries, cross-country manufacturing will trend towardequilibrium.
The dynamics predicted here suggest that theequilibration is slow, beyond the scale of a lifetime.As such, many opportunities remain for businessadvancement with respect to multinationalmanufacturing strategy and global supply chain op-timization. However, the models and results pre-sented here can quickly diverge from reality due topressing strategic concerns that currently include:(1) human capital advances facilitated by the com-bination of big data and on-line learning, (2) driversfor foreign direct investment and cash flow relatedto global financial stability, and (3) extrinsic eventssuch as war, which sink even the best-laid plans.
References
Becker, G. S. (1964). Human capital: A theoretical and empiricalanalysis, with special reference to education. Chicago: Uni-versity of Chicago Press.
Borensztein, E., De Gregorio, J., & Lee, J-W. (1998). How doesforeign direct investment affect economic growth? Journal ofInternational Economics, 45(1), 115—135.
Chan, A., & Siu, K. (2010). Analyzing exploitation: The mecha-nisms underpinning low wages and excessive overtime inChinese export factories. Critical Asian Studies, 42(2),167—190.
Coase, R. H. (1937). The nature of the firm. Economica, 4(16),386—405.
Cobet, A. E., & Wilson, G. A. (2002). Comparing 50 years of laborproductivity in U.S. and foreign manufacturing. Monthly LaborReview, 6, 51—65.
Deng, P. (2007). Investing for strategic resources and its rationale:The case of outward FDI from Chinese companies. BusinessHorizons, 50(1), 71—81.
Foreign direct investment, net inflows (BoP). (2013). The WorldBank. Accessible at http://data.worldbank.org/indicator/BX.KLT.DINV.CD.WD/countries/1W?display=graph
Garrett, G. (2004). Globalization’s missing middle. ForeignAffairs, 83(6), 84—96.
Gorg, H., Hanley, A., & Strobl, E. (2008). Productivity effects ofinternational outsourcing: Evidence from plant-level data.Canadian Journal of Economics/Revue Canadienne d’Econo-mique, 41(2), 670—688.
Gouvernal, E., & Slack, B. (2012). Container freight rates andeconomic distance: A new perspective on the world map.Maritime Policy and Management, 39(2), 133—149.
Hausmann, R. (2013). Manufacturing is order, intelligently ap-plied. Scientific American Magazine, 308(5), 36—51.
Hellriegel, D., & Slocum, J. W., Jr. (1973). Organizational design:A contingency approach: A model for organic managementdesign. Business Horizons, 16(2), 59—68.
Heston, A., Summers, R., & Aten, B. (2002). Penn world table.Center for International Comparisons at the University ofPennsylvania. Accessible at https://pwt.sas.upenn.edu/php_site/pwt_index.php
International labor comparisons: Productivity and unit laborcosts. (2013). Washington, DC: United States Department ofLabor, Bureau of Labor Statistics.
Jain, N. K., Hausknecht, D. R., & Mukherjee, D. (2013). Locationdeterminants for emerging market firms. Management Deci-sion, 51(2), 396—418.
Kliesen, K. L., & Tatom, A. (2013). US manufacturing and theimportance of international trade: It’s not what you think.Federal Reserve Bank of St. Louis Review, 95(1), 27—49.
Kogut, B., & Kulatilaka, N. (1994). Operating flexibility, globalmanufacturing, and the option value of a multinational net-work. Management Science, 40(1), 123—139.
LABORSTA 2F paid employment in manufacturing. (2012). Gene-va, Switzerland: International Labor Office.
Levinson, A. (2007). Technology, international trade, and pollu-tion from US manufacturing. Cambridge, MA: National Bureauof Economic Research.
McCarthy, I., & Anagnostou, A. (2004). The impact of outsourcingon the transaction costs and boundaries of manufacturing.International Journal of Production Economics, 88(1), 61—71.
Mincer, J. (1958). Investment in human capital and personalincome distribution. The Journal of Political Economy,66(4), 281—302.
Moran, T. H. (1998). Foreign direct investment and development:The new policy agenda for developing countries and economies-in-transition. Washington, DC: Peter G Peterson Institute forInternational Economics.
Ramamurti, R. (2012). Competing with emerging market multi-nationals. Business Horizons, 55(3), 241—249.
Tomiura, E. (2007). Foreign outsourcing, exporting, and FDI: Aproductivity comparison at the firm level. Journal of Interna-tional Economics, 72(1), 113—127.
Wessner, C. W., & Wolff, A. W. (2012). Rising to the challenge: USinnovation policy for global economy. Washington, DC: Na-tional Academies Press.
World population prospects: The 2010 revision. (2011). New York:United Nations Population Division, Department of Economicand Social Affairs.
Young, M. N., Ahlstrom, D., Bruton, G. D., & Rubanik, Y. (2011).What do firms from transition economies want from theirstrategic alliance partners? Business Horizons, 54(2), 163—174.