011-0795 MANUFACTURING STRATEGY AND TECHNOLOGY INTERACTION: FIT LINE & IMPACT César H. Ortega Jiménez (1) & (2) [email protected]Phone: 504-2391849 José A. D. Machuca (2) [email protected]Phone: 34- 954557627 Pedro Garrido Vega (2) [email protected]Phone: 34- 954556968 José Luis Pérez Díez de los Ríos (2) [email protected]Phone: 34- 954557627 (1) Universidad Nacional Autónoma de Honduras, IIES Edificio 5, Planta Baja, Tegucigalpa, Honduras (2) Universidad de Sevilla Ave. Ramon y Cajal, 1, 41018 – Sevilla, SPAIN POMS 20th Annual Conference Orlando, Florida U.S.A. May 1 to May 4, 2009
Transcript
011-0795
MANUFACTURING STRATEGY AND TECHNOLOGY INTERACTION:
Cost Per-unit production cost Market price, product price Quality Quality control costs, reprocessing
costs Products as per specifications
Delivery Production execution time On-time delivery, cycle time, fast delivery Flexibility Lead-time Flexibility in changing product mix, flexibility in
changing volume
Cost. For many authors, the most important of all the operational performance dimensions is
cost performance (e.g. Schroeder and Flynn, 2001; Slack and Lewis, 2002; Hallgren, 2007). This
research focuses on Per-unit production cost.
Quality. Although quality is a multifaceted term, in production/operations the most influential
dimension is conformity, as this refers to the process’ ability to manufacture products in accordance
with predefined reliability and consistency specifications (Ward et al. 1996; Slack and Lewis, 2002;
Hallgren, 2007). This research therefore focuses on product conformance with specifications.
Delivery. The two fundamental delivery dimensions are reliability and speed (Ward et al., 1996;
Hallgren, 2007). This study focuses on both, on the former by way of on-time delivery, or the
ability to make the delivery as planned, and the second through speed of delivery.
Flexibility. Flexibility has many dimensions, but the two most influential in the operations area
are the ability to adjust volume and product mix (Olhager, 1993; Hallgren, 2007; Hutchison and
Das, 2007), and both are included in our study.
3.2. Manufacturing strategy
More and more companies are recognizing the production function as a potential source for
gaining a competitive advantage and as a way of differentiating themselves from competitors.
Despite the recognized importance of defining and clearly implementing manufacturing strategy,
there is still a long way to be over with documenting such research in POM literature (and even less
10
in the international HPM research) which, with a broad empirical base, deals with the impact of
manufacturing strategy on plant performance.
There are clear signs that manufacturing strategies play a fundamental role in the assessment of
new technologies (Bates et al., 1995; Pretorius and Wet, 2000), as an analysis of appropriate
technology can eliminate many risks, given that world-class technology is a key factor in global
competitiveness.
In other regards, taking the classic conception defined in strategy literature that distinguishes
between processes and content (e.g. Swamidass and Newell, 1987; Weir et al., 2000; Dangayach
and Deshmukh, 2001), it can be said that the formal strategic planning process is key to the
formulation of manufacturing strategy, which should successfully align it with the business strategy.
The alignment of the external coupling (market) and the internal coupling (technology and
organization) through a strategy is so important that the literature suggests that a company can only
survive if the correct production and company advantages are connected to each other (Bates et al.,
1995; 2001; Sun and Hong, 2002). The formal planning perspective is clearly distinguished from
the conception of strategy solely as a model (guideline) for decision-making based on past actions.
The manufacturing strategy must be communicated to the plant personnel for it to be used as a
guide in decision-making, as this is crucial to it being successfully implemented (Bates et al., 1995).
In this way, the production function is capable of providing appropriate support to business strategy.
Consequently, a properly implemented and well-aligned manufacturing strategy in a plant should
contain dimensions such as the anticipation of new technology, and a link between manufacturing
strategy and business strategy, a formal strategic planning process that involves the plant
management, communication of the manufacturing strategy to plant personnel and a robust or
influential strategy in the plant.
On the basis of the above, we shall consider the following four manufacturing strategy
dimensions in this study (Bates et al., 1995; 2001; Pretorius and Wet, 2000; Sun and Hong, 2002):
11
anticipation of new technologies, communication of manufacturing strategy, business strategy-
manufacturing strategy link, and formal strategic planning.
3.3. Technology
There is a general trend towards an increased use of technology in production plants due to the
hypothesis that its use will result in improvements in some performance measures (e.g. reductions
in costs or human resources, improved quality or flexibility). Unfortunately these investments are
often criticized for not bringing about the desired results. For this to be understood it is necessary to
take into account that the interconnection between technology and performance is influenced by a
number of factors, some of which can be controlled, and others which cannot, and that they are
important for the final result.
Thus, this work agrees with Maier and Schroeder (2001) when affirming that in this context
“technology” is concerned not only with its concrete aspects (equipment/hardware), but also with its
entire context: production/process technology, product technology and information technology (IT).
Only when integrating these three technological aspects and adjusting them to the plant and to its
other manufacturing practices can there be a better technological adaptation on the path towards
high performance. Furthermore it can be said that in international HPM research an even more open
definition of technology is assumed, not only including its technological aspects, but also of human
and organizational aspects of the way the company operates. However, for the purpose of this study
we will consider only several aspects of product and production technology
3.3.1. Product technology
International HPM research (Schroeder and Flynn, 2001, McKone and Schroeder, 2002)
considers some relevant dimensions that are used to develop product technology, such as
1 In an equilibrium state there is a congruency/selection fit, which means no significant variations in performance and thus no interaction fit.
17
Two interaction forms, difference/matching (residual analysis or deviation score) and
multiplicative form, seem to dominate the contingency literature (Pennings, 1992). The interaction
of difference may be summarized as seeing how close the equivalent values of MS and technology
are. Hence, the causal relationship is between this type of fit and performance. Multiplicative
interaction exists when the impact on performance of both independent variables differs for
different values of either independent variable. Unlike the difference model, the multiplicative form
always produces increments/decrements in performance, although the relative effectiveness of
either independent variable does not necessarily change.
Both forms of interaction are used to perform a more complete analysis of fit, mindful from the
start that both forms represent different theoretical positions on interaction. Mathematically
speaking, difference explains interaction as changes of functions of curvilinear performance, while
the multiplicative form describes interaction as slopes altered by functions of linear performance.
Therefore, in theory both interaction perspectives may not be true at the same time and for the same
contingent factor. Hence, the choice of either or both of these two perspectives is important.
However, the intention of this paper is not to contrast both interaction forms to verify a possible
opposition; on the contrary, both forms may complement thus evaluating the interrelation studied
from dual perspectives. Therefore, taking such differences this paper focuses on both forms, based
on the theoretical suppositions that are proposed next.
4.2. Proposals
In the specialised literature (e.g. Brownell, 1983), there exists a tendency to relate interaction
almost exclusively to the use of moderation (Figure 2), even to the point of identifying the
contingency perspective only with this perspective (Chenhall, 2003). Moderation simultaneously
examines the link amongst three variables: when the impact that an independent variable (predictor,
e.g. Manufacturing Strategy, MS) has on the dependent variable (outcome, e.g. performance) is
influenced by the level of a third, independent variable, it is said that this last variable is the
18
moderator (e.g. Technology, T) of the relationship between the other two variables. However, this
moderator is not related to either MS or performance (e.g. Allison, 1977; Arnold, 1982, 1984; Stone
and Hollenbeck, 1989). In other words, the moderator (T) does not have influence on the dependent
variable (performance) in the absence of the predictor (MS), as well as having no influence on the
predictor: its influence only operates to change the effect of the predictor on the dependent variable
(Sharma et al., 1981; Luft and Shields, 2003). Furthermore, the matter of which of two independent
variables is labelled as moderator and which as predictor is more of a theoretical than a statistical
question (Ortega et al., 2008b).
Figure 2: Moderation fit
Thus, moderation fit involves certain problems, especially statistical ones. In fact, these
statistical discrepancies are one of the reasons why the moderation model will not be used here.
Instead, to make interaction fit operational, the model used here is what the literature (Luft and
Shields, 2003; Roca and Bou 2006) calls “independent variable” or “combined effect” (Figure 3)
interaction. With this type of fit, a moderator does not exist; instead there are two independent
variables (e.g. Manufacturing Strategy & Technology), each one having a causal influence on the
dependent variable (e.g. performance). The form in which and the extent to which one of the
independent variables affects the outcome depends on the value of the other independent variable
and vice versa (Roca and Bou, 2006). Although these two interaction models theoretically
represent different causal relationships, there is no difference between the statistical analysis of one
19
and the statistical analysis of the other in the literature (they both use the same one: combined effect
interaction), thus presenting a problem for the moderation fit (Ortega et al., 2008b).
Figure 3: Interaction Fit: Combined Effect
Thus, the combined effect fit concept may explain why different practices may affect specific
performance measures. For example, if the objective of a plant is the reduction of its costs, a certain
group of these dimensions and techniques may be best. On the other hand, if a plant wants to
pursue high quality, a different group of dimensions and techniques may be preferable. Commonly,
the co-alignment complexity between factors makes it difficult to foresee the nature of the specific
connections between them. Besides, the fit concept is not sufficiently developed in Operations
Management in order to prescribe exactly what combinations of dimensions/techniques will lead to
low costs, or to any other performance measure.
However, as already indicated, the international study of HPM has found that to achieve higher
performance, manufacturing practices should be linked in their implementation in some way.
Hence, when a plant seeks to capitalize on the implementation of either of the practices in question
(technology or MS), it is submitted that benefits will be maximized when the plant also implements
basic techniques from the other of these practices. So, with the fit concept (Van de Ven and Drazin,
1985; Venkatraman, 1989), MS and technology will be examined within linked theoretical
frameworks in order to be able to study the effects of their combined implementation, as well as
their possible differential effects on performance. More specifically, when different dimensions and
20
essential techniques of MS and technology are implemented in a combined way, it presupposes a
greater level of operational performance.
Therefore, it is submitted that manufacturing plants that have implemented dimensions of both
MS and technology, rather than a single practice only, may be classified as high performers. This
means that the simultaneous and interactive implementation of these two practices results in a
higher performance than the implementation of dimensions of either practice in isolation. When the
two practices are implemented in a synchronized way, this may result in higher performance.
4.2.1. Difference Interaction Fit
The difference perspective will be first used to test how MS and technology fit each other in a
state of disequilibrium. This supplementary model is conceptually defined as the effective
combination of (coexistence between) two variables and although it does not specifically relate to
an outcome, its effect on the latter may be examined. Together these optimal combinations form a
fit line, where outcome is assumed to be maximized when both predictors fit each other, and thus
the fit line should coincide with an outcome line denoting maximal outcome at each level of the
predictors. Hence the causal relationship is between such fit and outcome. Thus, performance is
assumed to be maximized when MS fits with T, and thus the fit line (see Figure 1, Table A) should
coincide with a performance line denoting maximal performance at each level of either MP’s
(Donaldson 2003). As an example, it may be assumed iso-performance, where all fits on the fit line
yield about the same performance. When iso-performance is assumed, incremental changes in MS/T
do not necessarily affect a firm’s performance negatively, provided that measures are taken by the
firm in adjusting the corresponding MP (T/MS) accordingly. Drawing on Schoonhoven (1981),
difference is an interaction form where performance increases when MS matches the equivalent
value of T (Table 2).
21
Table 2. Difference Fit (Adapted from Venkatraman, 1989)
T level High Misfit
Low performance Fit High performance
Low Fit High performance
Misfit Low performance
Low High MS level
The model may be validated if, in a state of disequilibrium, it can be demonstrated that plants
using an MS that is fitted to (or coincides with) technology achieve higher performance, while
plants with a MS that is misfitted to technology have lower performances. To test the focus of
interaction, we use multiple regression with an extra term added to the joint MP regression model.
As already stated, if differences exist due to MP misfit, this term measures the direction and/or the
force of the relationship between the independent and dependent variables. Thus, using deviation
score (Venkatraman 1989), the hypothesis that the deviation between Manufacturing Strategy (MS)
and Technology (T) has an impact on operational performance (P) is set out in equation 1, which
supposes: a) that correspondence exists between the deviation score and performance; b) that the
value of MS at which higher performance occurs depends on T and/or the value of T at which
higher performance occurs depends on MS; and c) that there is a detectable level of selection forces
(a degree of congruency) between MS and T.
P = a0 + a1MS + a2T + a3 │MS – T │ (1)
P will be maximized when MS comes close to T (although the term is not defined for a situation
when MS=T). As value of MS changes, the value of P decreases provided the value of T is not
adjusted accordingly. Thus, “for each level of the MS variable there is a corresponding level of T
variable, that is the fit (i.e. yields the highest performance)” (Donaldson 2003, p 187). In a
difference model, all fits are assumed to be equally good, i.e. they are assumed to produce the same
performance (Donaldson 2003, p 192). Therefore, in this model, the focus is on the combined effect
of│MS–T│, where the additive form of this term is a linear function. If there are differences in
22
performance due to a misfit, the interaction effect is measured by a3: if it differs significantly from
zero, this confirms that operational performance is a function of the difference fit between MS and
technology.
The functional form of difference is curvilinear since this kind of interaction is mathematically
studied as curved-linear functions (inverted U or V form as in Figure 4). In a difference model,
MP22 improves performance for some levels of MP12 and reduces it for others, thereby shifting the
performance function. Figure 4 illustrates interaction in a difference model by displaying
performance as a function of MP1 at different values of perceived MP2. High values of MP1 may
be understood as high levels of implementation while low values denote low levels. A reduction in
MP2, i.e. a decrease in MP2 with one unit (e.g. from MP2=5 to MP2=4) reduces MP1’ positive
effect on performance when MP1 = 5, but increases the positive effect when MP1<5. The result is a
shift of the curve and a new maximum position is established. In a difference model, MP2 always
results in new maximum positions. Thus, MP2 affects relations between MP1-performance
individually in different directions.
Figure 4. MP1 performance at different values of MP2 (difference)
(Adapted from Chenhall and Morris, 1986)
The difference model is a realistic fit model, which theoretically attenuates possible multi-
collinearity problems. Moreover, only the interaction term is added to the regression equation.
In other regards, according to the results obtained by Ortega et al. (2008) in which a high degree
of congruency/selection was found between the two MP’s, it can be anticipated that conditions for
2 It could be either MS or T.
23
disequilibrium in performance which would not allow the difference fit to measure significant
differences in performance do not exist. This does not mean that differences in performance
between the two plant groups (High Performers/World Class and Standard Performers) do not exist
in real terms or that there is no interrelationship between the MP’s, but rather that there might be an
adaptation fit between the two, with possible differences in the effort made to implement the MP’s
in the two plant groups to achieve this.
Therefore, taking all of this into account and assuming that there is no difference interaction fit,
where each value of MS cannot assumed to be optimal at a certain value of T, the following
hypothesis is suggested:
H1: Each Manufacturing Strategy value is not adapted to a unique Technology value in all
plants due to an interaction fit line.
To make this model operative, analysis of deviation score, residual analysis and analysis of sub-
group (based on performance) may be used. As stated previously, the present study will centre on
an analysis of deviation score using two procedures:
a. Finding the deviation score as the residual value of the regression of MS on T and/or vice-
versa.
b. Regression of the deviation score for operational performance.
On the basis of the congruency model result in Ortega et al. (2008) we do not anticipate there
being differences in performance and so it is expected that the result for the term │MS–T│ from
equation 1 will be non-significant.
However, it is both critically important and beneficial to study the interrelationships of
manufacturing practices using multiple perspectives (e.g. Venkatraman, 1989; Gerdin and Greve,
2004), especially where research in this area is not yet conclusive in rejecting such theories. This
paper seeks to examine the proposed relationships by using multiple statistical tests within the same
24
data set. Thus, we investigate whether difference interaction is appropriate with the consideration of
multiple methods.
The difference view may help to test for adjustment of fit lines between both manufacturing
practices (Figure 5). For a sub-group analysis, the sample may be split into two of the organisational
performance sub-groups: standard and high performers. Then correlation and ANOVA may be used
as follows.
Figure 5. Fit Line
Therefore, in order to determine whether MS and technology show interaction, this work uses
not only the fit concept of difference by regression, but also the alternative methods of sub-group
analysis:
a) Correlation Sub-group Analysis: this analysis for the purposes of interaction may be based on
the findings of Miles and Snow (1978), and Abernethy and Brownell (1999). Interaction fit is
supported if there are significant differences in the sub-group correlation coefficients. After the
two sub-groups have been separated, the predictors are then correlated with each other within
each sub-group, looking at small differences in correlation between high and low performers. In
this way, it can be shown whether states of fit are related to the achievement of higher
performance than are states of very small misfit. This form of analysis also reveals some
information on how much the predictor combinations affect performance. Thus, there is an
analysis of differences in strength.
b) Variance Sub-group Analysis: this second method involves a sample of plants, units or similar
being split into a number of sub-groups and their features then being compared. A test is
25
performed to find whether the performance of ‘fit’ plants is greater than that of ‘non-fit’ plants.
(Abernethy and Brownell, 1999). Here, with the sub-groups consisting of high and low
performers, it is possible to show that levels of both predictors are higher in the high
performers’ sub-group than that of the low performers. This technique allows it to be
demonstrated that smaller deviations from the optimal combination of both predictors are
related to higher performance than are larger deviations. In addition, it reveals the nature of the
relationship between both predictors.
The results of the difference model are set out in section 5.
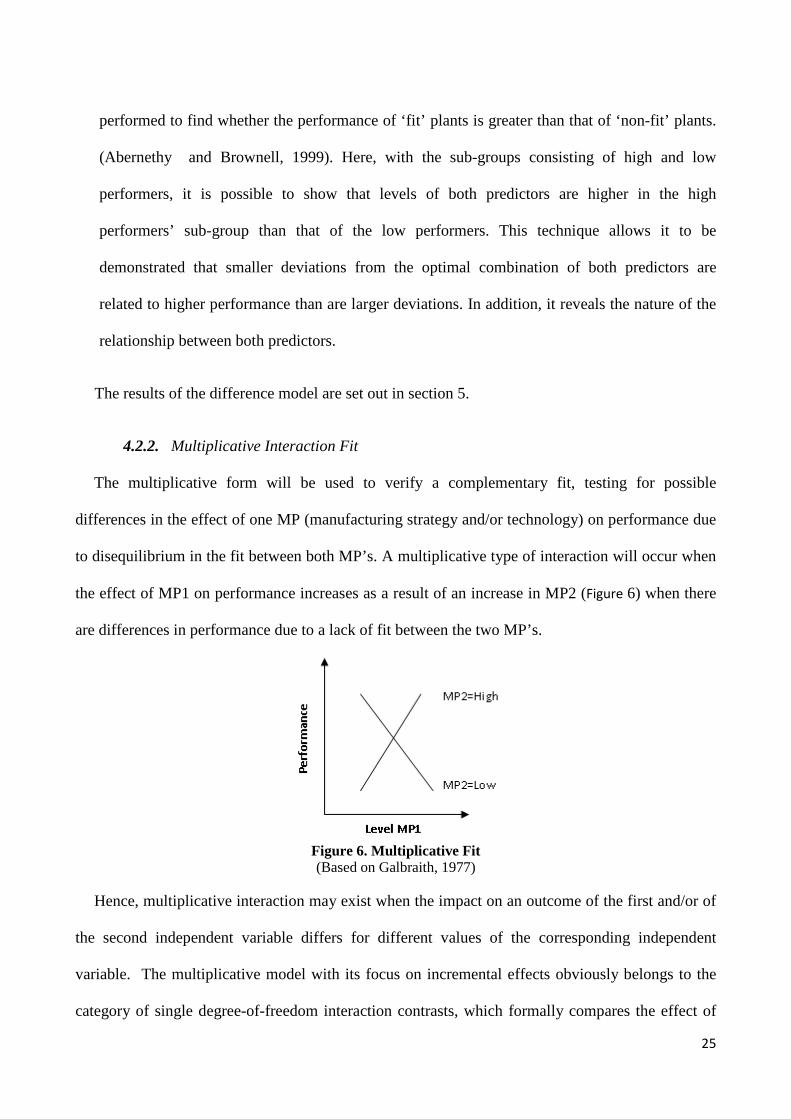
4.2.2. Multiplicative Interaction Fit
The multiplicative form will be used to verify a complementary fit, testing for possible
differences in the effect of one MP (manufacturing strategy and/or technology) on performance due
to disequilibrium in the fit between both MP’s. A multiplicative type of interaction will occur when
the effect of MP1 on performance increases as a result of an increase in MP2 (Figure 6) when there
are differences in performance due to a lack of fit between the two MP’s.
Figure 6. Multiplicative Fit (Based on Galbraith, 1977)
Hence, multiplicative interaction may exist when the impact on an outcome of the first and/or of
the second independent variable differs for different values of the corresponding independent
variable. The multiplicative model with its focus on incremental effects obviously belongs to the
category of single degree-of-freedom interaction contrasts, which formally compares the effect of
26
an independent variable (either MS or T) on a dependent variable (performance) at one level of a
second independent variable (the corresponding T or MS) with that at another level of this last one
(Jaccard and Turissi 2003, p 7). Therefore, if it is assumed that maximal performance would vary in
the multiplicative model, there may be evidence of hetero-performance.
In this study, we shall model the multiplicative form with the following regression equation
(Venkatraman 1989; Parthasarthy and Sethi, 1993; Ahmad et al., 2003):
P = β0 + β1MS + β2T + β3 (MS×T) + ε (2)
where the β’s are the fit coefficients associated with their respective variables and ε is the error.
Using equation 2 we tested the interaction between manufacturing strategy and technology to
analyze whether operational performance (P) is not only affected by possible simple effects but also
by the effect of linking manufacturing strategy (MS) and technology (T). Consequently, the focus of
the multiplicative model is on the effect associated with the product of MS×T, which is a
multiplicative term and, therefore, a curvilinear function. If there is a difference in performance due
to a misfit, the effect of the interaction is measured by β3: the proposal regarding the interaction
effect is validated if factor β3 is significantly different from zero, which confirms that operations
management might be a function of the multiplicative interaction between the two MP’s.
While one of the MP’s in a difference model affects the relationship between the other MP and
performance individually in different directions, the same first MP in a multiplicative model
operates in a more straightforward way (i.e. as different angles in linear performance functions). It
may be compared with an amplifier that either increases or reduces the general effect that the other
MP has on performance. Figure 7 illustrates the way two MP’s (e.g. MP1 & MP2) may operate in a
multiplicative model. When MP2=5, MP1 generally has a significant positive effect on
performance. Even minor changes in MP1 (e.g. from MP1=5 to MP1=4) have considerable effects
on performance. When MP2=4, the effect of MP1 on performance is weaker; and when MP2=3,
performance is not affected at all by MP1. Finally, when MP2 is low, MP1 will have a weak
27
(MP2=2) or strong (MP2=1) negative impact on performance. Therefore, unlike the difference
model, the multiplicative form always produces increments/decrements in performance (except
when MP2=3), although the relative effectiveness of either MP does not necessarily change. In
order to make this model operative, regression analysis, ANOVA, and subgroup analysis (based on
either predictor) may be used.
Figure 7. MP1-related performance for different MP2 values (multiplicative)
(Based on Chenhall and Morris, 1986)
Therefore, there is a linear correspondence in the functional fit form between the MP1
(manufacturing strategy or technology) and the dependency (operational performance), with the
angle of inclination being determined on the basis of the MP2 (technology or manufacturing
strategy), depending on the direction in which the measurement is to be taken. This means that the
effect of the MP2 on the MP1 is more direct, increasing or decreasing the effect the MP1 has on
performance. As a result, the interaction can be explained mathematically as inclinations changed
into functions of linear performance.
The strengths of the multiplicative focus are the simplicity of the procedure and the fact that only
a single term (β3E×T) is added to the regression.
Finally, as said in section 4.2.2, according to the results obtained by Ortega et al. (2008), in
which a high degree of congruency was found between the two MP’s, it can be anticipated that
conditions for disequilibrium in performance do not exist, and as such this would not allow the
multiplicative fit to measure significant differences in performance. Thus, if taking the
multiplicative model, we put forward the following hypothesis:
28
H2: There are no significant differences in performance due to a lack of interaction fit between
manufacturing strategy and technology.
To test this we use multiple regression with an extra term added to the regression model of the
two MP’s together (equation 2). As previously stated, should differences exist in performance due
to a misfit between the MP’s3, this terms measures the direction and/or the force of the relationship
between the independent and dependent variables.
As an alternative to the regression model analysis we use two sub-group analysis methods (sub-
groups comprising high and low implementation levels of manufacturing strategy and technology,
alternatively): difference in correlation coefficients and difference in averages (variation analysis).
The first of these two methods has frequently been used in interaction (Miles and Snow, 1978;
Simons, 1987; Merchant, 1981, 1984; Albernethy and Lillis, 1995; Albernethy and Brownell,
1999). Interaction fit is supported by showing that significant differences exist between the sub-
groups’ correlation coefficients. The second method involves a sample of the plants or sub-units
being split according to the sub-groups, and their features then being compared. What is tested is
whether the performance of the plants that are in fit is better than that of those that are not in fit
(Abernethy and Brownell, 1999).
The results of the multiplicative model are set out below.
5. METHODOLOGY AND RESULTS
It was proposed that the propositions mentioned in the previous sections be tested by means of a
survey of the automotive supplier sector in ten countries across Asia, Europe and North America.
The questionnaires incorporated matters that allowed participants to answer not only the research
questions outlined in this study, but also issues relevant to the whole HPM context, so as to
establish a body of knowledge and to develop theories through the observation of phenomena from
3 On the basis of the congruency model result in Ortega et al. (2008) we do not anticipate there being differences in performance and so it is expected that the result for the term will be non-significant.
29
the area of POM that have not been empirically tested. Although it is true that the questionnaires
had to be drawn up on the basis of prior bibliographical analysis, it must be borne in mind that the
research presented here is part of an international research project that has been ongoing for several
years, so that before this study commenced, the questionnaires had already been designed and used.
Therefore, these questionnaires had been broadly tested for reliability and validity. Nevertheless,
during this study the original questionnaires were the object of review with regard to each national
context, so as to take into account potential contextual influences. The questionnaires contained
close to one thousand items, distributed over almost two thousand questions.
The different scales of measurements and objective questions were arranged in a total of 12
questionnaires directed to as many employment positions inside each plant as possible and the
questionnaires were returned to a total of 21 informants. Many of the scales were included in at
least two different questionnaires, with the aim of triangulating information by making comparisons
between the different groups of interviewees (for example between managers and plant workers and
supervisors) and likewise of minimizing the variability resulting from the differences between
individuals, thus obtaining a higher degree of reliability. The items that relate to each scale were
rearranged within each questionnaire, with the idea that it should not be obvious which item
belonged to each scale or even that such scales were being used. Once the questions and the scales
were defined by the international HPM project, they were assigned to the questionnaires.
The surveys and interviews applied to the plants in this sample follow below. Firstly, plants of at
least 100 employees from a stratified sampling were asked to take part. Up to 60% of the plants
contacted submitted data for the study. This relatively high response rate was ensure by the use of
personal contact with the plants (which was comprised of three means in all cases: telephone calls,
presentations and letters) and by the promise that they would receive a plant profile by means of
which they could compare themselves with the other plants in their sector.
30
Besides the data obtained by means of the questionnaires, when it was deemed necessary, the
additional qualitative data was collected through guided visits to the plants in the sample, as well as
through structured interviews with managers from different departments (human resources, quality,
process, etc.) The interviews thus served as a foundation for future research and the resultant
construction of theories. This additional information was also very useful for developing a deeper
and more complete interpretation of the results obtained through the analysis of the quantitative
data.
5.1. Description of the Sample
The sample that was eventually obtained was composed of 90 plants from the international auto
supplier sector with an average size of 867 workers. Table 3 presents some other key characteristics
of the plants in the study sample.
Table 3. Other contextual variables
Variable Ave. Plant size (number of persons employed-per hour and permanent staff) 867 Average percentage of plant capacity use (%) 84.45 Percentage degree of product customisation • Ad hoc design activities (%) • Customised manufacture (%) • Customised assembly (%) • Customised delivery (%) • Standardised products (%)
27 28 23 10 12
Types of manufacturing processes in plants • Projects (model) (%) • Small lots (%) • Large lots (%) • Repetitive/lines (%) • Continual (%)
7 17 28 26 22
Types of equipment and processes used in plants • Standardised equipment purchased from suppliers (%) • Equipment from suppliers modified for own use (%) • Patented equipment designed by own company (%) • Equipment patented, designed and manufactured by own company (%)
40 30 20 10
Length of time equipment in service in plants • 2 years or under (%) • 3 - 5 years (%) • 6 - 10 years (%) • 11 - 20 years (%) • Over 20 years (%)
14 25 32 21 8
31
In keeping with the international HPM project (Schroeder et al., 2005) the plants were analysed
using four objective performance measures (cost, quality, delivery and flexibility). A cluster
analysis was then used to determine whether there were plants that were better than others regarding
both cost and another dimension at the same time. If this proposal were correct, it would be possible
to identify a minimum of one cluster of plants that could be labelled high performers, and a second
cluster with the remaining plants. However, once this had been done it was clear that the cost
dimension was a key factor in establishing the group classification. Further analyses were therefore
carried out to distinguish between the two plant types and to discover the positions that the plants
occupied in each of the performance dimensions. On this basis we had a criterion which, while not
as powerful, was nonetheless valid, and which led us to consider plants with high productivity rates
(in the upper quartile) and that were strong in some other performance dimension (in the upper
quartile) as high performance plants. Productivity rate was used due to possible differences in
product types and their respective manufacturing costs. With regard to the other dimensions, the
following measures were used: quality (customer satisfaction measure and percentage of products
passing final inspection without reprocessing), delivery (percentage of orders dispatched on time)
and flexibility (product customisation). An analysis of the objective data used for said analysis
allowed a group of ten plants to be identified as high performers.
Once the high performers had been distinguished from the others the data analysis continued
with a series of tests aimed at linking either of the two manufacturing practices with plant
performance. Thus, the fact that the present study entails examining the relationships between a
manufacturing practice and operational performance allowed the focus to be placed on the
performance links that exist between these practices separately, apart from studying the HPM model
as a whole.
The analysis was done using two multivariate techniques (multiple regression and subgroup
analysis) which have been used previously in earlier analyses of other issues in HPM research in
32
other countries. These types of techniques are especially useful for our study given the possible
multi-collinearity of the variables involved.
5.2. Data Measurement
As was previously stated, in the framework of the international HPM project a number of scales
and objective and subjective measures have been developed over time to assess several aspects of
performance and of all the advanced production processes included in the project, on the basis of
both objective and perceptual items. Those same items that are assembled in the questionnaires
aimed at different management and operational staff members. As stated in section 3, a sub-group
of said scales was used to measure manufacturing strategy, technology and performance.
Although some of the data are objective measures (e.g. the contextual variables), most are
perceptual scales. For this reason, the reliability and validity of manufacturing strategy and
technology were checked for the data analysis in such a way that the items loaded on a second
factor or scale were eliminated. As a result, the following scales were withdrawn: “communication
of manufacturing strategy” (part of manufacturing strategy) and “simplicity of product design” (part
of technology), because their items did not meet the required prerequisites in their measures. A
reliability analysis was conducted at the plant level for each scale to evaluate internal consistency.
Reliability was measured by Cronbach’s alpha. Following Nunnally (1967), we used a score of 0.6
or more as a criterion for a reliable scale. All scales used in the analysis exceeded this criterion
level.
Therefore, both MS and technology are conceptualised and defined as multidimensional
constructs. Each dimension (scale) represents one facet of these broad constructs (super-scales) and
all pertinent dimensions together define a super-scale as a whole. After the scales were checked for
reliability and validity, the next step was to aggregate (average) them into super-scales or bundles to
represent the two broader concepts mentioned above.
33
Therefore, following Hunter and Gerbing (1982), a second-order factor analysis was performed
for each of the two super-scales to ascertain that the set of scales formed corresponding
unidimensional measures, as follows: three scales were used to measure MS practices according to
the definition of MP practices described earlier (all but Communication of MS). These three scales
were factor analysed to ascertain that they were measuring a common construct as shown here. The
factor loadings of the scales were much higher than the cut-off value of ± 0.40 (Hair et al., 1998). In
addition, the reliability of the super-scales was found to be 0.83, as shown here. Thus, the super-
scale measuring MS is reliable and unidimensional with all of its scales contributing significantly its
formation. A similar procedure was used to construct the technology super-scales (all but Product
Design Simplicity). Table 4 sets out the results of the reliability and unidimensionality analyses
obtained from these tests. The Table also shows that the composite performance measure is reliable
and unidimensional. Plants implement MP to achieve goals which encompass all of the typical
operations competitive priorities such as cost, quality, delivery and flexibility (Groenevelt, 1993;
Primrose, 1992; Crawford et al., 1988; Ahmad et al., 2003). A composite measure reflecting a
plant’s achievement in these four dimensions was constructed in order to observe effectiveness.
Operationally, plant managers were asked to compare their plants with the competition in their
industry in terms of (i) per-unit production cost; (ii) quality of product conformance; (iii) on-time
delivery performance; (iv) fast delivery; (v) flexibility in changing product mix; and (vi) flexibility
in changing volume. The Table also summarises the way the measures that were finally used in the
study were distributed by position (or by group of positions) in the plant. The numbers in the body
of the Table indicate the number of responses for each category in each plant.
34
Table 4.Study scales and measures in questionnaires
Variable/Dimension PD PM PRM PE SU Load Factor Cronbach’s Alpha Manufacturing strategy • Anticipation of new technologies • MS-BS link • Formal strategic planning
These results support the fact that both MP’s mutually impact upon their relationships with
performance. However, it can be seen that the impact of MS on Technology-Performance is greater
than the impact of Technology on the relationship MA-Performance.
In other regards, an interesting aspect is that there are lower levels of technology technique
implementation compared to the levels to which strategy techniques are implemented (although this
does not necessarily affect performance).
6. CONCLUSIONS AND FINAL CONSIDERATIONS
Two interaction models were proposed in order to avert the inflexibility of the congruency model
(Ortega et al., 2008), which does not allow a conditional association of two or more independent
variables with a dependent result. Nevertheless, its application not only corroborated the results of
the congruency model in their study, but also provided some details regarding the non-significant
differences in the adaptation fit in the interrelationship under study that could not be detected by the
congruency model due to its previously stated inflexibility.
This type of fit may be understood to be a positive impact on performance due to certain
combinations of the MP’s. For this reason a state of disequilibrium can be understood to exist due to
a lack of fit, where high and low performance companies can exist as a result of more or less
successful MP combinations. Our research aimed to explain these differences in performance on the
basis of the effects of the interaction between the MP’s under study, using two models: difference
and multiplicative fit.
On the basis of the data analysed in the difference model it can be concluded that an
interrelationship does exist between manufacturing strategy (MS) and technology (T), which
41
confirms a fit between them, i.e. that at high level of a given MP, performance is maximised at a
high value for the other MP (working as a the fit line).
Furthermore, the results of the three statistical analysis methods used demonstrate that some
kind of iso-performance exists between both manufacturing practices, with no significant
differences between the two plant types (HP and SP). In the first of the methods used, multiple
regression, the coefficient for the │MS-T│ term was not significant and if we had not had the
results from the other methods, this could have led us to conjecture differently. However, the results
of the other tests were able to confirm why such a result was arrived at and allowed a better vision
of the fit to be gained. On the one hand, the correlation analysis shows that the high and standard
performance groups have coefficients that do not differ significantly, supporting a possible
congruency fit. However, they also show that the standard performance group has the lowest degree
of coefficient, which might indicate that a greater relative effort is made to fit the manufacturing
practices in this group of plants. Meanwhile, the last method used, variation analysis, can also help
it to be seen that that there are no significant differences within the plant groups with regard to the
implementation of the practices analysed and performance, which indicates a certain homogeneity
between the groups (the slight difference that does exist is to the benefit of the HP group).
Moreover, these last two methods lead us to believe that there is a strong congruency
interrelationship which is not observed in the interaction perspective regression model as there is no
disequilibrium in performance deriving from a significant misfit between the two manufacturing
practices.
It might be added that, in general terms, the use of the two alternative sub-group models
(correlation analysis and variation analysis) for the interaction perspective has provided much more
information than the regression analysis method. On the one hand, the sub-group correlation
analysis examined the differences in potency in the relationship by splitting the sample into high
and standard performance groups and then correlating MS and technology within the groups. On the
42
other hand, the sub-group variation analysis showed that the fact that there was no statistically
significant difference between the groups in the performance averages might be due to the
manufacturing practices’ states of fit being related to high performance rather than states of misfit.
The fact that there are no states of misfit might mean that a fit exists as a result of congruency.
Should this be the case, the state of misfit could lead to the plant disappearing from its industrial
environment.
The two sub-group analysis methods support the hypothesis that there is a positive relationship
between practices and performance, despite the fact that the degree to which they are implemented
and performance are so similar in both the high performance and standard performance groups of
plants. Furthermore, the small differences found between the two plant groups confirm that the HP
plants have a small differential of less effort and resource implementation in the two practices
examined, which allows them to focus on other areas of the plant. This might indicate that the
difference in MS and technology implementation between the high performance and standard
performance plants lies in efficiency rather than effectiveness: improved competitiveness leads to a
reduction in effort or makes it routine.
Difference interaction model starts with the presupposition of an organising disequilibrium,
where the states of fit between the MP’s are more effectively related to high performance than the
states of misfit (i.e. the greater the deviation in the relationship between the MP’s, the greater the
misfit and, therefore, the lower the performance). However, results seem to demonstrate that said
disequilibrium between MS and technology (interaction model) is not possible. On the contrary, the
results of the two alternative difference model methods have shown that there are no significant
differences between the two plant groups, which confirms the existence of iso-performance instead
and possible congruency between both practices, when the degree of fit between the practices does
not show significant variations in performance.
43
It was also our aim to systematically research the relationship between the MP’s and plant
performance from the multiplicative focus using the interaction model. This interaction focus was
intended to help an understanding to be gained of the fact that the interconnection between the MP’s
needs to be established for there to be synergy between them resulting in better plant performance.
It is thus seen whether interconnection is critical for the MP’s to be successfully implemented.
Multiplicative interaction exists when the impact of one independent variable is different for
different values of the other variable (complementary relationship). To test this model we used
regression analysis, correlation analysis and variation analysis, and all three confirmed the previous
results. The first multiplicative model method, as with difference model, allowed confirmation that
there is no difference in performance when there is a lack of fit, as the corresponding MS×T
regression term was not significant. This goes some way to confirming the difference model as both
(difference and multiplicative) entail interaction and, unlike the congruency model (Ortega et al.,
2008), require there to be a disequilibrium in the fit between the plants for this to be measured.
The other two multiplicative model methods provide a more detailed view of what is occurring
between the two MP’s from the point-of-view of their respective degrees of implementation. On the
one hand, the correlation analysis showed that in the relationship between manufacturing strategy
and technology with regard to the influence of the latter on performance did not significantly differ
between the high and low strategy implementation groups. An analysis of the very small differences
would seem to show that in order for technology to have slightly more influence on performance,
slightly more manufacturing strategy resources are required in plants with a low level of said MP
implementation (upping the degree of technology implementation would decrease performance
unless the degree of strategy implementation were also increased slightly to support the increase in
technology). Similarly, the high and low technology implementation groups have a relationship
with strategy with regard to the influence the latter has on performance that showed correlations
with a very slight difference. It would seem that the groups are at a very similar level with regard to
44
the influence of technology on the effect strategy has on performance, as it can be seen that in order
for manufacturing strategy to have a slightly greater influence more or less the same technology
resources are required in both groups. This method, which examines the degree of implementation
of one MP compared to the other, confirmed that both MP’s mutually impact on each other, but that
this causes no significant variation in performance. This confirms what was previously stated, that
there is homogeneity between the two groups of plants (HP and SP) in the interrelationship under
study that reflects a state of equilibrium characteristic of a congruency fit, especially when the
degree of implementation of technology is the discriminating factor.
In other regards, the ANOVA test showed that both technology and strategy impact mutually on
their respective relationships with performance, although a smaller variation can be seen between
the performances of the two plant groups (HP and SP) when technology is the discriminating factor.
This result might lead us to conclude that technology is implemented to a very similar degree in
both HP and SP plants, thus resulting in a smaller relative difference regarding its influence on the
manufacturing strategy-performance relationship.
Therefore, despite the few differences found between the plants, the last two methods applied
(correlation analysis and ANOVA) provided greater details of the relationships between the two
practices with regard to the impact between them due to their degree of implementation. On the one
hand it can be confirmed that technology influences manufacturing strategy in such a way that the
latter achieves better performance and vice-versa. On the other hand, the very slight differences
would seem to indicate that technology has slightly less influence on the manufacturing strategy-
performance relationship. This is most likely due to the fact that technology is implemented to a
much more similar degree in the different plants than strategy. This similarity in technology in the
two types of plants (HP and SP) would also seem to be one of the reasons why said MP has no
influence on performance in the universal model (Ortega et al., 2008a). Furthermore, we believe
45
further research should be done along the lines of these differences, especially with regard to
technology
With regard to the interaction perspective in general, there is no analytical difference regarding
the direction of the relationship between the independent variables, but when the sub-groups were
analyzed to confirm the effects of interaction, said methods threw up some interesting conclusions.
We therefore think it is necessary to clarify which of the dependencies is causal in these types of
models when the interrelationships between MP’s are analyzed. In our opinion, any possible effect
of interaction can be interpreted in widely different ways as a result of assumptions regarding causal
relationships. Despite this, few studies refer to the significant implications of the effect of causal
relationships in MP interaction. This led us to consider issues regarding their effect on the analysis
of a given MP’s individual dimensions with a second MP’s dimensions for future studies.
6.1. Complementing view: two perspectives & multiple statistical tests
Both forms of interaction address different research tasks: 1) a difference model aims to identify
a fit line and to verify it by testing against performance; and 2) a multiplicative model aims to
measure how structures impact on performance changes as an effect of contextual changes.
Regardless of this, they may find a common ground for testing and complementing both views
(i.e., one method as confirmatory of the other) by using sub group analysis – difference method
based on performance and multiplicative method based on either predictor. Measuring with metric
scales and later arranged into groups, where group belonging is determined by values on two
Manufacturing Practices (MP’s), enables the utilization of ANOVA and Correlation when testing
hypotheses. Since these sub group analytical techniques are being proposed as confirmatory to
others previously done (e.g. regression), problems due to the grouping such as throwing away
valuable information about incremental changes, or having results with less statistical power or
even false should not be the main concern, but whether sub group analysis complement the former
analysis. In a case where two different models (each with many methods) support a proposition, it
46
may be that the main effect is no longer a general effect but a conditional one. Besides, if results
converge through multiple statistical tests of fit, an evidence of robustness may be provided.
The use of a confirmatory model not only corroborates results of previous model, but it may also
throw light about details the other model cannot show. Thus, it would be possible to make a more
complete evaluation of the link between any two manufacturing practices. If only one of either
model was applied, we may simply get a partial view of the interaction. Hence, the main purpose of
this research was to share this sort of methodology with POM researchers in what could be an
important finding for obtaining a more complete view of the interaction between any two
manufacturing practices by reconciling two different perspectives of interaction fit.
Thus, this paper determined that it is possible for difference and multiplicative perspectives to
complement each other, by proposing multiple tests of fit within the same data set, where each
technique has an implicit bias. The starting point is the literature showing that it is both critically
important and profitable to study the interrelationship between different predictors (e.g. MP’s) using
multiple perspectives (e.g. Venkatraman, 1989; Gerdin and Greve, 2004; Gerdin, 2006). In addition,
comparative evaluation of different models to test fit and the relationship between results and
characteristics of the same sample may help to develop medium range theories about which
approach to take.
This paper therefore considered two opposing models to investigate whether difference and
multiplicative fits may complement each other, especially where research in this area has not yet
conclusively rejected said models. Hence, this paper sought to examine complementarities between
bivariate fit relationships in two ways: 1) two concepts (difference and multiplicative forms); and 2)
multiple statistical tests from each concept within the same data set, taking as a common ground the
sub group analysis.
From Section 5, it can therefore be concluded that the difference form may be complemented by
multiplicative methods in order to detect possible impacts of one MP on another MP-performance,
47
which cannot be found by the former. Likewise, multiplicative form may be complemented by
difference methods in order to test for fit lines, which cannot be detected when testing for
multiplicative interaction between two manufacturing practices.
In more detail, this research proposes that these two approaches may complement each other in a
single study, testing alternatively multiplicative and difference interaction by means of using and
discussing two statistical techniques (subgroup analysis) from each approach. Each individual
statistical technique proposed here partially tests assumptions of fit (e.g. a different fit perspective).
Thus, when testing with more than one technique, a more complete view of interaction between any
two manufacturing practices is obtained.
Even when a high degree of congruency fit was present (Ortega et al., 2008) reflecting
conditions of equilibrium in performance, not allowing the regression methods of both difference
and multiplicative models to test interaction. However, when the two subgroup methods were used
in both interaction forms, it was possible to make a more detailed appraisal of the interrelationship
which allowed very small positive variations in HP-plant performance to be seen. Both models are
therefore complementary as the type of interaction corroborated the congruency perspective results.
One the one side of the coin, the use of the difference interaction model meant that even with a
fit line not due to interaction but congruency fit, reflected by a non significant difference term from
the regression method and by some small differences in both subgroup analyses. In correlation
subgroup analysis, it becomes clear whether states of slightly higher levels of fit are more related to
demonstrably higher performance than states of slightly lower levels of fit. It also reveals some
information on how much the predictor combinations affect performance. Thus, there is an analysis
of differences in strength. ANOVA allows demonstrating that smaller deviations from the optimal
combination of both MP’s are related to higher performance than are larger deviations. It shows that
no statistical significant difference in performance mean exists between subgroups in higher and
lower level of MP’s tests for some kind of iso-performance (i.e. at each level of one MP,
48
performance is maximized at a single value of another MP, meaning that it is on the congruency fit
line). One possible scenario may be that different interaction fits between both MP’s are equally
effective and that there is an appropriate level of one MP for low, as well as for high levels of the
other MP (e.g. explaining the fit line between two MP’s and even iso-performance). In addition, it
reveals the nature of the relationship between both MP’s.
On the other side of the same coin, the use of the multiplicative interaction model meant that the
small differences in the impact that one MP has on the relationship that the other MP has on
performance, and vice-versa, could be seen. We can also state that, in general terms, the use of the
two alternative sub-group methods (correlation analysis and variation analysis) contributed to much
greater information being provided than by the regression analysis method (interaction term not
significant). Correlation analysis demonstrates that for some values of one MP, the other MP`s
attribute in question may be positively related to performance, and for other slightly lower values, it
may be slightly less positively related. Therefore, this view is primarily focused on the strength of
the relationship. Whereas the sub-group variance analysis demonstrates that higher-level states of fit
are related to perceptibly higher performance than are lower level states, thus revealing the nature of
the relationship between both MP’s (e.g. higher levels of one MP impact slightly higher on the
relationship of the other MP with performance).
As with any empirical research, the results and conclusions of the field study should be
welcomed, with the caution demanded by the limitations of the techniques employed. Thus,
considering that this research is sectorial, the sample being empirically analyzed is understood to be
plants that undertake their activity exclusively in the automotive supplier sector. This circumstance
means that the results may enjoy a high inferential capacity for the population analyzed, but further
sample analysis may very possibly be needed in order to test the interrelationship in another
population.
49
On the other hand, this work leaves the dimensions of IT aside for future research, since this
practice was beyond the scope of this paper. Furthermore, many other factors may influence
operational performance. Besides MS and technology, there exist infrastructure practices, other
manufacturing initiatives and the environment, etc. The identification of all of these factors and
their elimination from this research is not possible due to the limitations of the data. This paper did
not intend to make a study of such factors.
Finally, the definitions of the bivariate perspective of fit tend to focus on how one manufacturing
practice (MP) affects another and how these factors may interact in pairs to explain performance.
This reductionism assumes that the manufacturing practice area of a plant can be split into elements
(MP’s and their dimensions), which are then individually examined. The knowledge that is
obtained from each element may be aggregated in order to understand the manufacturing practice
department. However, for a wider vision of the interrelationships involved, it is necessary to
complete such a study with a systemic perspective of the plant. These limitations thus provide an
opportunity for future research using possible natural extensions of the bivariate fit perspective, one
of which can be added by trying the systemic perspective that allows a broader holistic view of the
plants.
Thus, considering the limitations in this paper, its empirical results support the link foundation
from the HPM model, specifically the interrelationship between manufacturing strategy and
technology from a congruency perspective. Furthermore, small differences found between both
plant types confirmed that high performers have a small differential of probably less effort and
resources in the implementation of both MP’s, which allows them to focus in other areas of the
plant. This may indicate that the implementation difference between high and standard performers
lies more in the efficiency than in the effectiveness: when competiveness is improved the efforts are
reduced or they become routine.
50
Acknowledgement: The present work has been developed in the framework of the projects of
scientific research and technological development of the National Program of Industrial Design of
the Ministry of Education and Science of Spain (DPI-2006-05531, (HPM Project-Spain: Proyecto
para la manufactura de alto rendimiento (High Performance Manufacturing)) and Excellence
Projects of the PAIDI (Plan Andaluz de Investigación, Desarrollo e Innovación de la Junta de
Andalucía-Spain).
REFERENCES
Ahmad, S., Schroeder, R. and Sinha, K. (2003): “The role of infrastructure practices in the effectiveness of JIT practices: implications for plant competitiveness”, Journal of Engineering and Technology Management, 20, pp. 161–191.
Abernethy, A. and Brownell, P. (1999): “The role of budgets in organizations facing strategic change: an exploratory study”, Accounting, Organizations and Society, 24, pp. 189-204.
Abernethy, M.A., and Lillis, A.M. (1995): “The Impact of Manufacturing Flexibility on Management Control System Design”, Accounting, Organizations and Society, 20, pp. 241-258.
Aldrich, H. (1979): Organizations and Environments, Prentice-Hall, Englewood Cliffs, NJ. Allison, P.D. (1977): "Testing for interaction in multiple regression", American Journal of
Sociology, 83, pp.144-53. Arnold, H. J. (1982): “Moderator variables: A clarification of conceptual, analytic, and
psychometric issues”, Organizational Behavior and Human Performance, 29, pp. 143-174. Arnold, H. J. (1984): “Testing moderator variables hypotheses: A reply to Stone and Hollenbeck”,
Organizational Behavior and Human Performance, 34, pp. 214-224. Bates, K, Blackmon, K., Flynn, E. and Voss C. (2001): “Manufacturing Strategy: Building
Capability for Dynamic Markets”, in Schroeder and Flynn (Eds.), High Performance Manufacturing-Global Perspectives. New York: John Wiley & Sons, Inc, pp. 42-72.
Bates, K., S. Amundson, W. Morris, Schroeder, R. (1995): “The Crucial Interrelationship between Manufacturing Strategy and Organizational Culture”, Management Science, 41, no. 10.
Bergeron F. and Raymond L. (1995): “The contribution of IT to the bottom line: a contingency perspective of strategic dimensions,” Proceedings of the 16th International Conference on Information Systems, Amsterdam, pp. 167-181.
Bisbe, J. & Otley, D. (2004): “The effects of the interactive use of management control systems on product innovation”, Accounting, Organizations and Society, 29, pp.709-737.
Brownell, P. (1983): “Leadership style, budgetary participation and managerial behaviour,” Accounting, Organizations and Society, 8, p.307–321.
Brownell, P. & K. A. Merchant (1990): “The budgetary and performance influences of product standardization and manufacturing process automation”, Journal of Accounting Research, 28, pp. 388-397.
Bruning, J. L., & Kintz, B. L (1987): Computational handbook of statistics, Scott-Foresman Glenview, IL.
Chenhall, R.H. (2003): “Management control systems design within its organizational context: findings from contingency-based research and directions for the future”, Accounting, Organizations and Society, 28, pp. 127–168.
51
Chenhall, R.H. and Morris, D. (1986): “The impact of structure, environment and interdependencies on the perceived usefulness of management accounting systems”, Accounting Review, 61, pp. 16–35.
Crawford, K.M., Blackstone Jr., J.H. and Cox, J.F. (1988): “A study of JIT implementation and operating problems”, International Journal of Production Research, 26 (9), pp. 1561–1568.
Cronbach, L.J. (1951): “Coefficient alpha and the internal structure of tests”, Psychometrika, 16, pp. 297-334.
Cua, K., McKone, K. and Schroeder, R. (2001): “Relationships between implementation of TQM, JIT, and TPM and manufacturing performance”, Journal of Operations Management, 19, pp. 675–694.
Dangayach, G and Deshmukh, S. (2001): “Manufacturing strategy. Literature review and some issues”, International Journal of Operations & Production Management, 21 (7), pp. 884-932.
Dean, J.W. Jr and Snell, S.A. (1996): “The strategic use of integrated manufacturing: an empirical examination”, Strategic Management Journal, Vol. 17 (6), pp. 459-80.
Delery, J. and Doty, D. (1996): “Modes of theorizing in strategic human resource management: Tests of universalistic, contingency, and configurational performance predictions”, Academy Management Journal, 39(4), pp. 802–835.
Donaldson, L. (1994): Contingency theory, Aldershot, UK: Dartmouth. Drazin, R., and Van de Ven, A. H. (1985): “Alternative forms of fit in contingency theory”,
Administrative Science Quarterly, 30, pp. 514-539. Dunk, A. (1993): “The effects of budget emphasis and information asymmetry on the relation
between budgetary participation and slack”, The Accounting Review, 2, pp. 400–410. Ferdows, K. and DeMeyer, A. (1990): “Lasting Improvements in Manufacturing Performance: In
Search of New Theory”, Journal of Operations Management, 9(2), pp. 168-184. Foster, R. (1986): “Working the S-Curve—Assessing Technological Threats”, Research
Management, 29, pp.17–20. Galbraith, J. (1977): Organizations Design, Addison-Wesley, Reading, MA. Gerdin, J. (2006): “Conceptualizations of contingency fit in management accounting research –
correspondence between statistical models used and core contingency theory assumptions”, working paper, Orebro University, Orebro, Sweden.
Gerdin, J. and Greve, J. (2004): “Forms of contingency fit in management accounting research—a critical review”. Accounting, Organizations and Society, 29, pp. 303–326.
Groenevelt, H. (1993): “The Just-In-Time system,” in: Graves, S.C., et al. (Eds.), Handbooks in Operations Research and Management Science, 4, Elsevier, New York, NY.
Gul F. A., y Chia, Y. M. (1994): “The effects of management accounting systems, perceived environmental uncertainty and decentralization on managerial performance: a test of three-way interaction”, Accounting, Organizations and Society, 19, pp. 413–426.
Hallgren M. (2007): “Manufacturing Strategy, Capabilities and Performance”, PhD Thesis, Linköping University.
Hair, J.F., Anderson, R.E., Tatham, R.L., Black, W.C. (1998): Multivariate Data Analysis, Prentice-Hall, Upper Saddle River, New Jersey,
Hambrick, D., MacMillian, I. C., and Barbosa, R. R. (1983): “Business Unit Strategy and Changes in Product R&D Budget”, Management Science, 2, pp. 757–760.
Hayes R. H. (1985): “Strategic planning - forward in reverse?”, Harvard Business Review, 63, pp. 67-77.
Hayes, R.H. and Wheelwright, S.C. (1984): Restoring Our Competitive Edge: Competing Through Manufacturing, Wiley, New York.
Hofer, C. W., and Schendel, D. (1978): Strategy Formulation: Analytical Concepts, West Publishing, St. Paul, MN.
52
Hunter, J.E., Gerbing, D.W. (1982): “Unidimensional measurement, second order factor analysis, and causal models”, Research in Organizational Behavior, 4, pp. 267–320.
Hutchison, J. and Das, S.R. (2007): “Examining a firm’s decisions with a contingency framework for manufacturing flexibility”, International Journal of Operations and Production Management, 27(2), pp. 159-180.
Itami, H., and Numagami, T. (1992): “Dynamic Interaction Between Strategy and Technology”, Strategic Management Journal, 13, pp. 119–136.
Jaccard, J. and Turrisi, R. (2003): Interaction effects in multiple regression, (2nd Edition), Sage Publications, Newbury Park, California.
Joyce,W., Slocum, J. W., & von Glinov, M. A (1982): “Person-Situation interaction: competing models of fit”, Journal of Occupational Behavior, 3, pp. 265-280
Ketokivi, M and Schroeder, R. G. (2004): “Manufacturing practices, strategic fit and performance. A routine-based view”, International Journal of Operations & Production Management, 24(2), pp. 171-191.
Lee, J., Miranda, S. y Kim, Y. (2004): “IT Outsourcing Strategies: Universalistic, Contingency, and Configurational Explanations of Success”, Information Systems Research, 15 (2), pp. 110–131. 7, 8
Maidique, M. A. and Patch, B. J. (1988): “Corporate Strategy and Technology Policy”, in Tushman, and Moore (Eds), Readings in Management of Innovation (2nd ed), Ballinger, Cambridge, MA, pp. 236–248.
Maier, F. (1997): “Competitiveness of German manufacturing industry-an international comparison”, 28th Annual Meeting of the Decision Science Institute.
Maier, F. and Schroeder, R. (2001): “Competitive Product and Process Technology”, in Schroeder and Flynn (Eds.), High Performance Manufacturing-Global Perspectives. New York: John Wiley & Sons, Inc., pp. 74-114.
Matsui, Y. (2002): “Contribution of manufacturing departments to technology development: An empirical analysis for machinery, electrical and electronics, and automobile plants in Japan”, International Journal of Production Economics 80, pp. 185–197.
McKone, K. E. and Schroeder, R. G. (2002): “A plant’s technology emphasis and approach. A contextual view”, International Journal of Operations & Production Management, 22 (7), pp. 772-792.
Meilich, O. (2006): “Bivariate Models of Fit in Contingency Theory. Critique and a Polynomial Regression Alternative”, Organizational Research Methods, 9(2), pp. 161-193.
Merchant, K.A. (1981): “The design of the corporate budgeting system: influences on managerial behavior and performance”, The Accounting Review, 56 (4), pp. 813–829.
Merchant, K. A. (1984): “Influences on departmental budgeting: an empirical examination of a contingency model”, Accounting, Organizations and Society, 9, pp. 291–307.
Miles, R. E., and Snow, C.C. (1978): Organizational strategy, structure, and process, McGraw-Hill, New York.
Morita, M., and Flynn, E.J. (1997): “The Linking among Management Systems, Practices and Behavior in Successful Manufacturing Strategy”, International Journal of Operations and Management, 17(10), pp. 967-993.
Neter, J., Kutner, M.H., Nachtsheim, C.J. and Wasserman, W. (1996): Applied Linear Statistical Models, 4th ed. Richard D. Irwin, Burr Ridge, IL.
Nunnally, J.C. (1967): Psychometric Theory, McGraw-Hill, New York. Olhager, J. (1993): “Manufacturing flexibility and profitability”, International Journal of
Production Economics, 30(31), p. 67-78. Ortega, C.H., D.Machuca, J.A., Garrido, P. and Perez J. (2008): “Congruency Between
Manufacturing Strategy and Technology in the Automotive Component Sector”, Manufacturing Fundamentals: Necessity and Sufficiency (Proceedings de la 3rd World Conference on POM,
53
POM Tokyo 2008), 3rd World Conference on Production and Operations Management (3), Num. 3. Tokyo (Japon).
Ortega, C.H., D.Machuca, J.A., Garrido, P. and Perez J. (2008a): “A Look At Technology and Manufacturing Strategy in the Automotive Supplier Sector”, Manufacturing Fundamentals: Necessity and Sufficiency (Proceedings de la 3rd World Conference on POM, POM Tokyo 2008), 3rd World Conference on Production and Operations Management (3), Num. 3, Tokyo (Japon).
Ortega, C.H., D. Machuca, J.A and Garrido, P. (2008b): “Multiplicative Interaction: More Appropriate for Combined Effect than for Moderation Fit”, 6th LACCEI (International Latin American and Caribbean Conference for Engineering and Technology).
Parker, A. (2000): “Impact on the Organizational Performance of the Strategy-Technology Policy Interaction”, Journal of Business Research, 47, pp. 55–64.
Parthasarthy, R. and Sethi, S. (1993): “Relating strategy and structure to flexible automation: a test of fit and performance implications”, Strategic Management Journal, 14, pp. 529–549.
Pennings J.M., (1992): “Structural contingency theory: a reappraisal”, Research in Organizational Behavior, 14, pp. 267-309.
Perera, S., Harrison, G., y Poole, M. (1997): “Customer-Focused Manufacturing Strategy and the Use of Operations-Based Non-Financial Performance Measures: a Research Note”, Accounting, Organizations and Society, 22, pp. 557-572.
Porter, M. E. (1983): “The Technological Dimension of Competitive Strategy”, in Rosenbloom R. S. (Ed.), Research on Technological Innovation, Management, and Policy. Jai, Greenwich, CT., pp. 1–33.
Porter, M. E. (1985): Competitive Advantage—Creating and Sustaining Superior Performance, Free Press, New York.
Pretorius, M and Wet, G. (2000): “A model for the assessment of new technology for the manufacturing enterprise”, Technovation, 20, pp. 3–10.
Primrose, P.L. (1992): “Evaluating the introduction of JIT”, International Journal of Production Economics, 27, pp. 9–22.
Roca, V. and Bou, J. C. (2006): “El concepto de ajuste en dirección de empresas: definición, metodología e hipótesis”, Investigaciones europeas de dirección and economía de la empresa, 12 (3), pp. 41-62.
Sahin, F. (2000): “Manufacturing competitiveness: Different systems to achieve the same results”, Production and Inventory Management Journal, 41(1), pg. 56.
Schoonhoven, C. B., (1981): “Problems with contingency theory: Testing assumptions hidden with the language of contingency theory”, Administrative Science Quarterly, 26, pp. 349-377.
Schroeder, R. G., Flynn, B. and Flynn, E. (2005): “The High Performance Manufacturing Project”, University of Minnesota, Wake Forest University.
Schroeder, R. G. and Flynn, B. (Eds.) (2001): High Performance Manufacturing-Global Perspectives. New York: John Wiley & Sons, Inc.
Simons, R. (1987): “Accounting Control Systems and Business Strategy: an Empirical Analysis”, Accounting, Organizations and Society, 12, pp. 357-374.
Skinner, W. (1969): Manufacturing - Missing Link in Corporate Strategy”, Harvard Business Review, May-June, pp. 136-145.
Slack, N. and Lewis, M. (2002): Manufacturing strategy, Pearson Education Limited, Harlow, Essex.
Sun, H. and Hong, C. (2002): “The alignment between manufacturing and business strategies: its influence on business performance”, Technovation, 22, pp. 699–705.
Swamidass, P. and Newell, T. (1987): “Manufacturing strategy, environmental uncertainty and performance: A path analytic model”, Management Science, 33(4), pp. 509-524.
54
Van de Ven, A.H. and Delbecq (1974): “A task contingent model of work-unit structure”, Administrative Science Quarterly, 192 pp. 183-197.
Van de Ven, A.H. and Drazin, R. (1985): “The concept of fit in contingency theory”, in Staw, B.M. and Cummings, L.L. (Eds.), Research in Organizational Behavior. JAI Press, Greenwich, CT.
Venkatraman, N. (1989): “The concept of fit in strategy research: toward verbal and statistical correspondence”, Academy of Management Review, 14, pp. 423–444.
Venkatraman, N. and Prescott, J.E., (1990): “Environment-strategy coalignment: an empirical test of its performance implications,” Strategic Management Journal, 11 (1), pp. 1–23.
Ward, P.T., Bickford, D.J. and Leong, G.K. (1996): “Configurations of manufacturing strategy, business strategy, environment and structure”, Journal of Management, 22(4), pp. 597-626.
Weill, P. and Olson, M. (1989): “An assessment of the contingency theory of management information systems,” Journal of Management Information Systems, 6(1), pp. 59-85.
Weir, K., Kochhar, A., Lebeau, S. and Edgeley, D. (2000): “An Empirical Study of the Alignment between Manufacturing and Marketing Strategies”, Long Range Planning, Vol. 33(6), pp. 831-848.
Wheelwright S. C. and Bowen H. K. (1996): “The Challenge of Manufacturing Advantage”, Production and Operations Management, 5, pp. 59-77.
Woodward, J. (1965): Industrial organization: Theory and Practice, Oxford University Press, London.