J. Adhesion Sci. Technol. , Vol. 17, No. 16, pp. 2141–2156 (2003) Ó VSP 2003. Also available online - www.vsppub.com Mapping of adhesion forces on soil minerals in air and water by atomic force spectroscopy (AFS) F. L. LEITE 1;2 , A. RIUL, JR. 3 and P. S. P. HERRMANN 1;¤ 1 EMBRAPA Agricultural Instrumentation, Rua XV de Novembro 1452, CEP 13560-970, São Carlos, São Paulo, Brazil 2 Instituto de Física de São Carlos, Universidade de São Paulo (USP), CEP 13560-970, São Carlos, São Paulo, Brazil 3 Departamento de Física, Biologia e Química, FCT - Universidade Estadual Paulista (UNESP), CEP 19060-900, Presidente Prudente, São Paulo, Brazil Received in nal form 23 September 2003 Abstract —The adhesion force between an atomic force microscope (AFM) tip and sample surfaces, mica and quartz substrates, was measured in air and water. The force curves show that the adhesion has a strong dependence on both the surface roughness and the environmental conditions surrounding the sample. The variability of the adhesion force was examined in a series of measurements taken at the same point, as well as at different places on the sample surface. The adhesion maps obtained from the distributionof the measured forces indicated regions contaminated by either organic compounds or adsorbed water. Using simple mathematical expressions we could quantitatively predict the adhesion force behavior in both air and water. The experimental results are in good agreement with theoretical calculations,where the adhesion forces in air and water were mostly associated with capillary and van der Waals forces, respectively. A small long-range repulsive force is also observed in water due to the overlapping electrical double-layers formed on both the tip and sample surfaces. Keywords: Atomic force spectroscopy; atomic force microscopy; adhesion forces; soil minerals. 1. INTRODUCTION Atomic force microscopy [1] (AFM) is a powerful tool for the investigation of the surface morphology of polymers [2], biological materials [3], as well as in the study of magnetic [4], frictional [5] and adhesion forces [6– 9] and surface charges [10] of solid materials. More recently, Atomic Force Spectroscopy (AFS) has been shown to be useful to measure the interaction force (e.g. adhesion force) and chemical properties of sample surfaces [11, 12]. Measurements of surface– surface ¤ To whom correspondence should be addressed at EMBRAPA. Phone: (55-16) 274-2477. Fax: (55-16) 272-5958. E-mail: [email protected]
Transcript
J Adhesion Sci Technol Vol 17 No 16 pp 2141ndash2156 (2003)Oacute VSP 2003Also available online - wwwvsppubcom
Mapping of adhesion forces on soil minerals in airand water by atomic force spectroscopy (AFS)
F L LEITE 12 A RIUL JR 3 and P S P HERRMANN 1curren
1 EMBRAPA Agricultural InstrumentationRua XV de Novembro 1452 CEP 13560-970 Satildeo CarlosSatildeo Paulo Brazil
2 Instituto de Fiacutesica de Satildeo Carlos Universidade de Satildeo Paulo (USP) CEP 13560-970 Satildeo CarlosSatildeo Paulo Brazil
3 Departamento de Fiacutesica Biologia e Quiacutemica FCT - Universidade Estadual Paulista (UNESP)CEP 19060-900 Presidente Prudente Satildeo Paulo Brazil
Received in nal form 23 September 2003
AbstractmdashThe adhesion force between an atomic force microscope (AFM) tip and sample surfacesmica and quartz substrates was measured in air and water The force curves show that the adhesionhas a strong dependence on both the surface roughness and the environmental conditions surroundingthe sample The variability of the adhesion force was examined in a series of measurements taken atthe same point as well as at different places on the sample surface The adhesion maps obtained fromthe distributionof the measured forces indicated regions contaminatedby either organic compounds oradsorbed water Using simple mathematical expressions we could quantitativelypredict the adhesionforce behavior in both air and water The experimental results are in good agreement with theoreticalcalculationswhere the adhesion forces in air and water were mostly associated with capillary and vander Waals forces respectively A small long-range repulsive force is also observed in water due to theoverlapping electrical double-layers formed on both the tip and sample surfaces
Keywords Atomic force spectroscopy atomic force microscopy adhesion forces soil minerals
1 INTRODUCTION
Atomic force microscopy [1] (AFM) is a powerful tool for the investigation of thesurface morphology of polymers [2] biological materials [3] as well as in thestudy of magnetic [4] frictional [5] and adhesion forces [6ndash9] and surface charges[10] of solid materials More recently Atomic Force Spectroscopy (AFS) hasbeen shown to be useful to measure the interaction force (eg adhesion force) andchemical properties of sample surfaces [11 12] Measurements of surfacendash surface
currenTo whom correspondence should be addressed at EMBRAPA Phone (55-16) 274-2477 Fax(55-16) 272-5958 E-mail herrmanncnpdiaembrapabr
2142 F L Leite et al
interactions at the nano-scale [13ndash15] are important because many materials havechanged properties in this range [16ndash20] Generally in air the tipndashsample surfaceinteraction is a result of the superimposition of the van der Waals electrostatic andcapillary forces [11 21] On the other hand two surfaces can interact in waterthrough an electric double-layer van der Waals and hydration forces [22]
Adsorbed water plays an important role in adhesion measurements since it isresponsible for the capillary force between the AFM tip and sample surface Inparticular with muscovite mica the adsorbed water is so strongly bound to themica surface that it is impossible to remove it by simply lsquooutgassingrsquo under UHVconditions or through a gentle heating of the sample [23] Muscovite mica is idealfor studying a variety of surface phenomena since it is an aluminosilicate that can beeasily cleaved yielding an atomically planar surface It is well known that organicions and simple compounds are picked up by clays (similarly to inorganic ions) andsurface spectroscopy studies indicate the presence of carbon on the surface of air-cleaved mica [24] The carbon is undoubtedly from organic origin although thereare evidences from surface reactivity with carbon dioxide [25] Quartz on the otherhand has a much rougher surface than mica which is readily re ected in the forcespectroscopy results
The formation of a water lm on the surface of materials mainly on soilminerals is an important feature because it is related to many physical chemicaland biological processes occurring in soils [26ndash28] The investigation of capillaryphenomenon by AFM represents a new way of characterizing the dynamics ofaggregates The tip sample interaction in such different materials can be graphicallyrepresented by AFS [29 30] which is used here to show how the adhesion (pull-off force) between the AFM tip and solid surfaces varies with both substratemorphology and the environment Adhesion maps were used to illustrate sampleregions that had been contaminated with organic compounds This paper focuses onthe importance of both the local curvature and contamination of the sample surfaceon adhesion measurements In addition we note that the force spectroscopy is auseful tool to observe the in uence of repulsive forces acting in liquid media
2 EXPERIMENTAL
Muscovite mica and quartz plates were used as samples Mica can be easily cleavedin laboratory air to yield an atomically planar surface as shown in Fig 1 (surfaceroughness frac14 01 nm) The mica used here was kindly donated by Dr JaneFrommer from IBM Almaden Research Center (San Jose CA USA) This materialis important for biological studies [30] and to investigate the fundamental principlesof adhesion [31 32] friction [33] vapor adsorption [34] contact angles [35] andsurface forces involving gas vapor and liquid systems [36 37] Quartz substrateswere cleaned with a piranha solution as the surface cleaning agent according to theexperimental procedures described in Ref [38]
Mapping of adhesion forces on soil minerals AFS 2143
Figure 1 Topographic view at the atomic level of the mica muscovite surface showing theperiodicity of the K atoms
All measurements were carried out on a Topometrix TMX 2010 DiscovererAtomic Force Microscope operating in contact mode The cantilevers have aspring constant k D 013 sect 001 Nm and tip curvature radius R D 23 sect 5 nmThe values of length (L) width (W ) and thickness (t) of the cantilever and thetip radius (Fig 2) were measured with a Philips model XL30-FEG ScanningElectron Microscope (SEM) The cantilever elastic constant was calculated usingthe following equation [39]
k D EWt3=4L3 (1)
where E (approx 73pound1010 Nm2) is the Young modulus of the cantilever materialThe piezoscanner is normally liable to display a behavior that departs from
linearity between the force and the piezoscanner displacement In order to checkthe accuracy of the measurements subsidiary experiments were performed with aTopometrix standard grade silicon (Si) coated with quartz (average height 240 nmand pitch 150 sup1m) The errors in length measurements were lower than thoseexpected for the standard grade [40] being 25 and 01 for average height andpitch respectively The scanner used in the experiments has maximum scan rangesof 7 sup1m in both x and y direction
The force curves (cantilever de ection versus sample displacement) were ob-tained by measuring the vertical displacement of the sample mdash driven by thepiezoscanner mdash and the de ection of the cantilever with respect to its position atrest The curves were acquired in ambient conditions with 47 sect 3 relative humid-ity and 25 sect 1plusmnC temperature Adhesion forces were measured in Milli-Qreg waterwith a special cell developed by Topometrix consisting of a glass support with twoori ces for the inlet and outlet of liquids and an O-ring for sealing it Force curveswere digitally acquired at 100 points equally spaced from each other over the sam-ple surface scanned area Each force curve was comprised of a row of a maximum
2144 F L Leite et al
(a)
(b)
Figure 2 SEM micrographs of the silicon tip (a) and silicon cantilever (b) used
250 data points acquired during the vertical movements of approach and retractionof the cantilever Statistical software (StatSoft 1999 version) was used to create theadhesion maps
Mapping of adhesion forces on soil minerals AFS 2145
The adhesion forces on mica were examined by measuring the pull-off forcesbetween the tip and the sample surface in the equipment calibration mode Allmeasurements were performed in both gas (air) and liquid (water) environmentsThe pull-off force detected at ambient conditions is comprised of both van der Waalsand capillary forces Since the effect from the capillary component is eliminated inwater the measured force in a liquid system is mainly attributed to the van derWaals interaction Unfortunately van der Waals forces are not the only forcesin water In the approach curve just before the attractive van der Waals regionthere is a repulsive force that raises the force curve over the zero line which is theelectric double-layer force arising from charging of both sample and tip surfaces inliquids [41]
3 RESULTS AND DISCUSSION
Figure 3a shows typical force curves for mica in air As the piezoscanner extendsupward approaching the tip from 1 to 2 the tip is pulled down by the attractive forceand jumps to contact with the surface at 2 As the piezoscanner continues to extendthe cantilever bends upward as the tip presses onto the surface In this case from 2to 3 the slope of the forcendashdistance curve provides information on the elasticity ofthe sample When the tip reaches position 3 the piezoscanner retracts from the tipand the cantilever relaxes As the sample continues to retract the cantilever beginsto bend downward points 3 and 4 due to the adhesion force until reaching thebreak point 4 at which the cantilever rebounds sharply upward to 5
The adhesion force measured between points 4 and 5 can be expressed as
Fadhes D kplusmnmax (2)
where Fadhes is the adhesion force (nN) k and plusmnmax are the elastic constant and themaximum de ection of the cantilever respectively
For mica (Fig 3b) the force curves in water are similar to those in air except thatthe noise in this case is much higher due to uctuations in density andor viscosityof the liquid and the piezoscanner approach speed [41] This is indeed the reasonwhy force curves cannot be obtained in some liquids Besides the adhesion force ismuch lower in a liquid responsible for the behavior between points 4 and 5 as willbe explained further
Because the adhesion force is an important parameter for the surface properties ofmaterials we have investigated the accuracy of the measurements Using equation(1) we estimated the adhesion forces from 30 measurements in air and water tobe respectively 30 sect 3 nN and 12 sect 1 nN showing that the environment haspractically no effect on the data scatter The 10 variation in the data obtained atthe same point might be related to the fact that in 30 measurements the tip touchesthe sample surface at different points within what we referred to as the criticalvariability radius av The de nition of this critical variability radius is given inFig 4 where the dark circle below the tip corresponds to the tipndashsample contact
2146 F L Leite et al
(a)
(b)
Figure 3 Typical force curves for mica in air (a) and in water (b)
area The white circle corresponds to the maximum area of interaction between thetip and the sample surface (Av D frac14a2
v ) as the piezoscanner retracts and approachesin pull-off force measurements This critical variability radius depends on theprevious history of the piezoscanner (creep non-linearity hysteresis age etc) and
Mapping of adhesion forces on soil minerals AFS 2147
Figure 4 Critical variability radius av associated with the maximum variation of positioning of thepiezoscanner in the measured force curves
Table 1Average values of adhesion force to freshly cleavedmica in air and water and the variabilityassociatedwith them
Points Average value of the Variabilityadhesion force 1F ()F (nN)
on the mechanical and electronic factors of the equipment such as vibration thermalstability feed-forward control and noise level (data not shown)
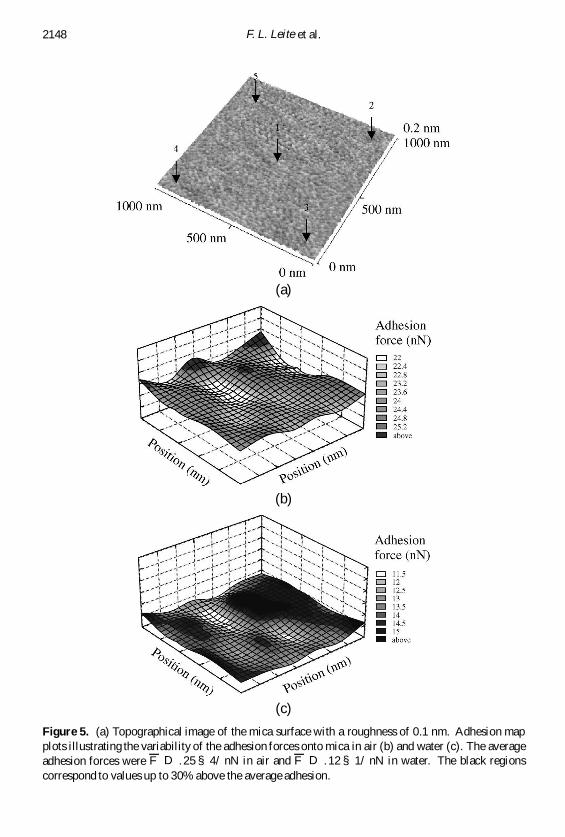
Figure 5a shows the topography of the muscovite mica freshly cleaved inair onto which force curve measurements were taken in ve different regionsFigure 5b and 5c illustrates the corresponding adhesion map plots in air and waterrespectively Each point represents 10 force curve measurements In Fig 5b and 5cthe z-axis depicts the adhesion force magnitude while the xy plane corresponds tothe sample surface The variation in adhesion force F ad is given in Table 1 rangingfrom 9 to 14 depending on the region scanned during measurements in air orwater This con rms the statement in the previous paragraph that the environmenthas no signi cant effect on the adhesion variability There is a 52 decrease inadhesion due to the meniscus removal which is responsible for the capillary effectin the force curves in air The adhesion shown in Fig 5c is attributed mostly to vander Waals forces while the capillary component dominates the adhesion forces inair (Fig 5b)
2148 F L Leite et al
(a)
(b)
(c)
Figure 5 (a) Topographical image of the mica surface with a roughness of 01 nm Adhesion mapplots illustrating the variability of the adhesion forces onto mica in air (b) and water (c) The averageadhesion forces were F D 25 sect 4 nN in air and F D 12 sect 1 nN in water The black regionscorrespond to values up to 30 above the average adhesion
Mapping of adhesion forces on soil minerals AFS 2149
(a)
(b)
Figure 6 (a) Histogram illustrating how the adhesion to quartz varies (b) Schematic diagramshowing the interaction between the AFM tip and the sample surface and its in uence on themagnitude of the measured adhesion force (adapted from Ref [50])
In order to con rm the importance of surface roughness adhesion forces weremeasured on quartz samples which had a higher surface roughness (gt1 nm) fora scanned area of 1 sup1m2 Such high value compared with that on mica leads to alarger variation in the adhesion force as the area is scanned as shown in Fig 6aThe adhesion force varied within 16 on smoother regions and 29 on rougherareas The increased adhesion in smoother areas is consistent with the literature[42ndash45] as the surface properties at the nano-scale level such as adhesion arestrongly in uenced by the topography of the sample surface Moreover even asmall surface roughness decreases signi cantly the adhesion force [46]
2150 F L Leite et al
A commonly used representation of the tip sample surface system is to considerthe tip as a sphere of radius R and the sample surface as a plane [47 48] as itwas considered here Figure 6b shows how the sample topography in uences theadhesion force The maximum adhesion force is reached when the tip is in region3 where there is a larger contact area than those in regions 1 and 4 since a largepart of the tip is in contact with the sample surface The minimum adhesion force ismeasured in region 2 where the contact area is reduced and the effective bending isminimum Therefore adhesion maps are able to reveal differences in the topographyof the samples Willing et al [49] studied adhesion based on the use of a colloidalprobe in conjunction with the force-volume technique where the spatial variationof the adhesion was visualized by analyzing the force-volume data with a softwareto create adhesion area maps
Figure 7 shows three adhesion maps acquired in different regions of mica after2 h of air exposure with constant humidity The adhesion map in region A(Fig 7a) indicates a decrease of approximately 33 in the adhesion force Thedifference in roughness between regions A B (Fig 7b) and C (Fig 7c) is small andtherefore the maximum deviation in the adhesion force due to roughness shouldbe smaller than 17 (regional variability Table 1) for a mica sample Thus the33 decrease in region A is assumed to arise from organic contamination since themica becomes hydrophobic after air exposure [50 51] The observed differencesin force-curve measurements have been attributed to the adsorbed layer formed onmica surfaces cleaved in laboratory air This adsorbed layer has often been referredto as lsquoorganicrsquo because of the presence of organic carbon detected by surfacespectroscopic techniques such as SSIMS [52] and XPS [53] The thickness andcomposition of this adsorbed layer on mica will vary depending on the laboratoryatmosphere and the experimental procedures used
The adhesion force is in uenced by the sample conditions Considering that partof this force is caused by adsorbed water it is important to clarify the contaminationeffect in the pull-off force measurements The presence of an organic contaminantlayer onto a solid surface changes the contact angle thus in uencing the adsorptionof a water layer over the sample surface Consequently changes in adhesion will beobserved The adhesion maps will show how the spatial variations of the samplendash tipinteractions depend on the surface conditions
The regions B and C illustrated in Fig 7 have a thin water layer as will be shownlater The capillary force is given by [54]
F aircap D 2frac14Rdeglvcos micro1 C cos micro2 (3)
where degLV is the liquidndash vapor interfacial free energy R is the radius of the AFMtip and micro1 and micro2 are the contact angles of water for the mica surface and the tiprespectively For freshly cleaved mica the water contact angle is frac140plusmn and foroxidized silicon tip (exposed to air) the contact angle is frac1479plusmn (data not shown)Contact angle measurements were made with an optical microscope with a digitalcamera by measuring the angle between the surface and the tangent drawn on the
Mapping of adhesion forces on soil minerals AFS 2151
(a)
(b)
(c)
Figure 7 Adhesion maps onto mica (a) region A (R D 13 Aring F D 16 sect 3 nN) (b) region B(R D 11 Aring F D 23 sect 3 nN) and (c) region C (R D 11 Aring F D 24 sect 4 nN) Each adhesion mapcorresponds to a scanning area of 1 sup1m2 The black regions correspond to values up to 30 abovethe average adhesion
2152 F L Leite et al
water droplet image ( ve measurements were made on each surface of mica) Thesurface free energy of the adsorbed water layer is deglv D 720 mJm2
The resultant capillary adhesion force due to the presence of adsorbed water is15 sect 3 nN from equation (3) with an estimated scatter of 20 due to errors in themeasurements of contact angle and radius of curvature of the tip This theoreticalvalue is lower than that in Fig 7 for regions B and C because the contribution fromvan der Waals forces (FvdW) to adhesion was not taken into account in the theoreticalcalculation The equation that relates the van der Waals forces (contact adhesion inthe condensate FvdW) and capillary forces is given by [32]
F airadhes D 2frac14Rdeglvcos micro1 C cos micro2 C FvdW (4)
where the second term on the right-hand side of equation (4) is the contact adhesionfrom the van der Waals forces [55] One may eliminate capillary forces bymeasuring adhesion with both sample and AFM tip in the water allowing one toestimate the contribution from the van der Waals forces only
The force measured on the AFM cantilever in a liquid environment can beestimated using the Derjaguinndash MullerndashToporov (DMT) [56] theory as
F watervdW D 2frac14R$132 (5)
where R is the AFM tip radius and $132 is the work of adhesion per unit areabetween the AFM Si tip (subscript 2) and the sample surface (subscript 1) in a liquidenvironment (subscript 3) The DMT equation applies to rigid systems with lowadhesion and small radii of curvature but it can underestimate the true contact areaEquation (5) is correct for a spherical tip in contact with a planar surface valid forlong-ranged attraction around the periphery of the contact area with the tipndashsamplegeometry being constrained to remain Hertzian [57] In other words the DMTtheory is the Hertzian theory with an offset due to surface forces and no hysteresisbetween loading and unloading However Beach et al [58] showed that the pull-offforces were not very sensitive to the maximum applied load suggesting that the useof continuum elastic contact mechanics in the analysis of measured force curves wasnot as straightforward as usually assumed in the literature In our case the work ofadhesion (Si tipndashwaterndashmica) is $132 D 011 Jm2 resulting in an adhesion forceof 16 sect 2 nN in water From equation (4) it is possible to obtain the theoreticalvalue of the adhesion force in air on freshly cleaved mica which is 31 sect 5 nNThe adhesion force results in air presented in Fig 7b and 7c Fadhes D 23 sect 3and Fadhes D 24 sect 4 nN respectively demonstrate that the experimental data areconsistent with the calculated values
In order to separate the adhesion force fractions from each other the pull-offforces were measured under two conditions in the same experimental assemblyFigure 8 shows a comparative plot between theoretical and experimental results inair and water Histogram A shows a good agreement between the experimental pull-off forces in air and the theoretical results using equation (4) with the differenceswithin the expected variation This histogram represents the sum of the capillary
Mapping of adhesion forces on soil minerals AFS 2153
Figure 8 Histogram illustrating the theoretical and experimental variations of the adhesion forcecomponents in air and water
and van der Waals interaction forces ie F airadhes D Fcap C FvdW Histogram B shows
the experimental and theoretical (equation (5)) results in water It can be seem thatthe error bars do not overlap indicating that the differences are no more than the22 estimated error con rming the existence of the repulsive force due to doublelayer This histogram represents the adhesion effect caused mainly by the van derWaals interaction between the tip and the sample ie F water
adhes D FvdW Histogram Cshows the capillary force component obtained from equation (3) and the differencebetween the experimental pull-off forces in air and water ie F air
adhes iexclF wateradhes D Fcap
The difference between the theoretical (16 sect 2 nN) and experimental (12 sect 1 nN)values for water presented in Histogram B comes from the repulsive forcesbetween the tip and the mica surface When immersed in a polar liquid mediumlike water surface charges are induced on both the tip and the sample surfacedue to ionization dissociation or spontaneous adsorption of charged species Tokeep the electrical neutrality opposite ionic species are held together closer to thetip sample surface forming an electric double-layer When mica is placed in waterthe mechanism of the double-layer formation is attributed to the KC dissolution aswell as ionic exchange between KC and H3OC (or HC) [59] The existence of theelectrical double-layer is con rmed by the force curves as shown in Fig 9 wherean upward trend appears before the attractive van der Waals interaction Toikkaet al [60] showed that the double layer decreases the adhesion force and that theapparent adhesion force depends on the pH of the solution The authors con rmed
2154 F L Leite et al
Figure 9 Typical force curve for mica under water The upward trend pointed in the gure isindicativeof the double-layer effect The zero line represents that part the force curve in which the tipexerts no force on the sample ie when the tip and sample are far apart and the tip does not de ect
the existence of this phenomenon by measuring adhesion forces in different pHsolutions between an iron sample and silica colloidal probe
The interaction between electric double-layers from different surfaces may be ei-ther attractive or repulsive having different magnitudes depending on the surface-charge properties of the tip and sample materials concentration of ionic con-stituents ionic strength pH and temperature The effects of the electric double-layer forces on adhesion force measurements are only now beginning to be explored[60] and the results presented here might provide a better understanding on soilmineral interactions
Adhesion maps obtained from force spectroscopy have shown clearly how surfacecontamination roughness and the environmental conditions in uence the adhesionforces Little attention however is paid to the use of AFS for application inagricultural and colloidal science
4 CONCLUSIONS
The force curves obtained on some soil mineral particles (mica and quartz) showclearly that the adhesion force is sensitive to both the surface roughness and theenvironmental conditions
The magnitude of adhesion depends on the roughness and local curvature of thesample surface with a slight increase in the adhesion force in smoother regions Wehave shown that adhesion forces estimated from several measurements taken at the
Mapping of adhesion forces on soil minerals AFS 2155
same place on the sample surface vary within 13 on mica and 29 on the muchrougher quartz substrate
The scatter in the measured curvature radius and elastic constant of the tipprovides an error source to the adhesion force of typically 20 and 8 respectively
The adhesion maps made from hundreds of measurements at different points allowone to obtain information on heterogeneities in sample topography and on organiccontamination For example carbon contamination on mica possibly from humancontact or carbon dioxide from air affects the force curves This was corroboratedby the good agreement between the theoretical and experimental adhesion valuesobtained in both air and water With the adhesion maps for samples in air and inwater a distinction can be made between capillary and van der Waals componentsof the adhesion force
Acknowledgements
The authors are grateful to CNPq the nanobiotechnology network (CNPqMCT)for the nancial support and to Prof Osvaldo N Oliveira Jr for useful discussionsand revision of this manuscript
REFERENCES
1 G Binnig C F Quate and Ch Gerber Phys Rev Lett 56 930ndash 933 (1986)2 R F Lobo M A Pereira-da-Silva M Raposo R M Faria and O N Oliveira Jr Nanotech-
nology 14 101ndash 108 (2003)3 I Penegar C Toque S D A Connell J R Smith and S A Campbell in Proceedings of the
10th International Congress on Marine Biofouling Melbourne Australia (1999)4 Y Martin and H K WickramasingheAppl Phys Lett 50 1455ndash 1457 (1987)5 R Erlandsson G Hadziioannou C M Mate G M McClelland and S Chiang J Chem Phys
89 5190ndash 5193 (1988)6 C Jacquot and J Takadoum J Adhesion Sci Technol 15 681ndash687 (2001)7 H K Christenson and P M Claesson Adv Colloid Interface 91 391ndash436 (2001)8 L H G Segeren B Siebum F G Karssenberg J W A van den Berg and G J Vancso
J Adhesion Sci Technol 16 793ndash828 (2002)9 A Ata Y Rabinovich and R K Singh J Adhesion Sci Technol 16 337ndash 346 (2002)
10 C Schonenberger and S F Alvarado Phys Rev Lett 65 3162ndash3164 (1990)11 L Sirghi N Nakagiri K Sugisaki H Sugimura and O Takai Langmuir 16 7796ndash 7800 (2000)12 A Mendez-Vilas M L Gonzalez-Martin L Labajos-Broncano and M J Nuevo J Adhesion
Sci Technol 16 1737ndash1747 (2002)13 S Fujisawa E Kishi Y Sugawara and S Morita Phys Rev B 51 7849ndash7857 (1995)14 D M Taylor Thin Solid Films 331 1ndash7 (1998)15 A Torii M Sasaki K Hane and S Okuma Sensors Actuators A Phys 40 71ndash76 (1994)16 R Garciacutea and R Peacuterez Surf Sci Rep 47 197ndash301 (2002)17 M Binggeli and C M Mate J Vac Sci Technol B 13 1312ndash1315 (1995)18 M Scherge X Li and J A Schaefer Tribol Lett 6 215ndash 220 (1999)19 Q Ouyang K Ishida and K Okada Appl Surf Sci 169 644ndash 648 (2001)20 H A Mizes K-G Loh R J D Miller S K Ahuja and E F Grabowski Appl Phys Lett 59
2901ndash 2903 (1991)
2156 F L Leite et al
21 F Mugele T Becker R NikopoulosM Kohonen and S HerminghausJ Adhesion Sci Technol16 951ndash954 (2002)
22 L Sirghi N Nakagiri H Sugimura and O Takai Jpn J Appl Phys 40 1420ndash1424 (2001)23 H K Christenson J Phys Chem 97 12034ndash12041 (1993)24 K G Bhattacharyya J Electron Spectrosc Relat Phenom 63 289ndash306 (1993)25 K G BhattacharyyaLangmuir 5 1155ndash1162 (1989)26 G E Brown Jr A L Foster and J D Ostergren Proc Natl Acad Sci USA 96 3388ndash3395
(1999)27 D R Nielsen J W Hopmans and K Reichardt Scale Dependence and Scale Invariance in
Hydrology Cambridge University Press Cambridge (1988)28 R Wiesendanger Scanning Probe Microscopy and Spectroscopy mdash Methods and Applications
Cambridge University Press Cambridge (1994)29 G A Willing and R D Neuman Langmuir 18 8370ndash8374 (2002)30 H H P Fang K-Y Chan and L-C Xu J Microbiol Methods 40 89ndash97 (2000)31 R G Horn J N Israelachvili and F J Pribac J Colloid Interface Sci 115 480ndash 492 (1987)32 H K Christenson J Colloid Interface Sci 121 170ndash178 (1988)33 A M Homola J N Israelachvili M L Gee and P M McGuiggan Trans ASME J Tribology
111 675ndash 682 (1989)34 D Beaglehole and H K Christenson J Phys Chem 96 3395ndash3403 (1992)35 J Schultz K Tsutsumi and J-B Donnet J Colloid Interface Sci 59 272ndash276 (1977)36 J N Israelachvili Intermolecularand Surface Forces 2nd edn Academic Press New York NY
(1991)37 H K Christenson J Dispersion Sci Technol 9 171ndash206 (1988)38 C E Borato P S P Herrmann L A Colnago O N Oliveira and L H C Mattoso Braz J
Chem Eng 14 367ndash373 (1997)39 D Tabor Gases Liquids and Solids and Other States of Matter 3rd edn Cambridge University
D 25 (standard grade)41 B Cappella P Baschieri C Frediani P Miccoli and C Ascoli IEEE Eng Med Biol 16 58ndash65
(1997)42 T Stifter E Weilandt O Marti and S Hild Appl Phys A 66 S597ndashS605 (1998)43 K L Johnson Tribology Int 31 413ndash418 (1998)44 R Jones H M Pollock J A S Cleaver and C S Hodges Langmuir 18 8045ndash 8055 (2002)45 E R Beach G W Tormoen J Drelich and R Han J Colloid Interface Sci 247 84ndash89 (2002)46 K N G Fuller and D Tabor Proc R Soc London A 345 327ndash342 (1975)47 J N IsraelachviliSurf Sci Rep 14 109ndash 159 (1992)48 T Stifter O Marti and B Bhushan Phys Rev B 62 13667ndash 13673 (2000)49 G A Willing T H Ibrahim F M Etzler and R D Neuman J Colloid Interface Sci 226
185ndash188 (2000)50 B Cappella and G Dietler Surf Sci Rep 34 1ndash104 (1999)51 J Hu X-D Xiao D F Ogletree and M Salmeron Surf Sci 344 221ndash236 (1995)52 M G Dowsett R M King and E H C Parker J Vac Sci Technol 14 711ndash717 (1977)53 L Xu and M Salmeron Langmuir 14 5841ndash 5844 (1998)54 Y Ando Wear 238 12ndash19 (2000)55 T Eastman and D M Zhu Lagmuir 12 2859ndash 2862 (1996)56 B V Derjaguin V M Muller and Yu P Toporov J Colloid Interf Sci 53 314ndash 326 (1975)57 J Hertz Reine Angew Math 92 156ndash171 (1881)58 E R Beach G W Tormoen and J Drelich J Adhesion Sci Technol 16 845ndash868 (2002)59 E F Souza G Ceotto and O Teschke J Mol Catal A 167 235ndash243 (2001)60 G Toikka R A Hayes and J Ralston Langmuir 12 3783ndash 3788 (1996)
2142 F L Leite et al
interactions at the nano-scale [13ndash15] are important because many materials havechanged properties in this range [16ndash20] Generally in air the tipndashsample surfaceinteraction is a result of the superimposition of the van der Waals electrostatic andcapillary forces [11 21] On the other hand two surfaces can interact in waterthrough an electric double-layer van der Waals and hydration forces [22]
Adsorbed water plays an important role in adhesion measurements since it isresponsible for the capillary force between the AFM tip and sample surface Inparticular with muscovite mica the adsorbed water is so strongly bound to themica surface that it is impossible to remove it by simply lsquooutgassingrsquo under UHVconditions or through a gentle heating of the sample [23] Muscovite mica is idealfor studying a variety of surface phenomena since it is an aluminosilicate that can beeasily cleaved yielding an atomically planar surface It is well known that organicions and simple compounds are picked up by clays (similarly to inorganic ions) andsurface spectroscopy studies indicate the presence of carbon on the surface of air-cleaved mica [24] The carbon is undoubtedly from organic origin although thereare evidences from surface reactivity with carbon dioxide [25] Quartz on the otherhand has a much rougher surface than mica which is readily re ected in the forcespectroscopy results
The formation of a water lm on the surface of materials mainly on soilminerals is an important feature because it is related to many physical chemicaland biological processes occurring in soils [26ndash28] The investigation of capillaryphenomenon by AFM represents a new way of characterizing the dynamics ofaggregates The tip sample interaction in such different materials can be graphicallyrepresented by AFS [29 30] which is used here to show how the adhesion (pull-off force) between the AFM tip and solid surfaces varies with both substratemorphology and the environment Adhesion maps were used to illustrate sampleregions that had been contaminated with organic compounds This paper focuses onthe importance of both the local curvature and contamination of the sample surfaceon adhesion measurements In addition we note that the force spectroscopy is auseful tool to observe the in uence of repulsive forces acting in liquid media
2 EXPERIMENTAL
Muscovite mica and quartz plates were used as samples Mica can be easily cleavedin laboratory air to yield an atomically planar surface as shown in Fig 1 (surfaceroughness frac14 01 nm) The mica used here was kindly donated by Dr JaneFrommer from IBM Almaden Research Center (San Jose CA USA) This materialis important for biological studies [30] and to investigate the fundamental principlesof adhesion [31 32] friction [33] vapor adsorption [34] contact angles [35] andsurface forces involving gas vapor and liquid systems [36 37] Quartz substrateswere cleaned with a piranha solution as the surface cleaning agent according to theexperimental procedures described in Ref [38]
Mapping of adhesion forces on soil minerals AFS 2143
Figure 1 Topographic view at the atomic level of the mica muscovite surface showing theperiodicity of the K atoms
All measurements were carried out on a Topometrix TMX 2010 DiscovererAtomic Force Microscope operating in contact mode The cantilevers have aspring constant k D 013 sect 001 Nm and tip curvature radius R D 23 sect 5 nmThe values of length (L) width (W ) and thickness (t) of the cantilever and thetip radius (Fig 2) were measured with a Philips model XL30-FEG ScanningElectron Microscope (SEM) The cantilever elastic constant was calculated usingthe following equation [39]
k D EWt3=4L3 (1)
where E (approx 73pound1010 Nm2) is the Young modulus of the cantilever materialThe piezoscanner is normally liable to display a behavior that departs from
linearity between the force and the piezoscanner displacement In order to checkthe accuracy of the measurements subsidiary experiments were performed with aTopometrix standard grade silicon (Si) coated with quartz (average height 240 nmand pitch 150 sup1m) The errors in length measurements were lower than thoseexpected for the standard grade [40] being 25 and 01 for average height andpitch respectively The scanner used in the experiments has maximum scan rangesof 7 sup1m in both x and y direction
The force curves (cantilever de ection versus sample displacement) were ob-tained by measuring the vertical displacement of the sample mdash driven by thepiezoscanner mdash and the de ection of the cantilever with respect to its position atrest The curves were acquired in ambient conditions with 47 sect 3 relative humid-ity and 25 sect 1plusmnC temperature Adhesion forces were measured in Milli-Qreg waterwith a special cell developed by Topometrix consisting of a glass support with twoori ces for the inlet and outlet of liquids and an O-ring for sealing it Force curveswere digitally acquired at 100 points equally spaced from each other over the sam-ple surface scanned area Each force curve was comprised of a row of a maximum
2144 F L Leite et al
(a)
(b)
Figure 2 SEM micrographs of the silicon tip (a) and silicon cantilever (b) used
250 data points acquired during the vertical movements of approach and retractionof the cantilever Statistical software (StatSoft 1999 version) was used to create theadhesion maps
Mapping of adhesion forces on soil minerals AFS 2145
The adhesion forces on mica were examined by measuring the pull-off forcesbetween the tip and the sample surface in the equipment calibration mode Allmeasurements were performed in both gas (air) and liquid (water) environmentsThe pull-off force detected at ambient conditions is comprised of both van der Waalsand capillary forces Since the effect from the capillary component is eliminated inwater the measured force in a liquid system is mainly attributed to the van derWaals interaction Unfortunately van der Waals forces are not the only forcesin water In the approach curve just before the attractive van der Waals regionthere is a repulsive force that raises the force curve over the zero line which is theelectric double-layer force arising from charging of both sample and tip surfaces inliquids [41]
3 RESULTS AND DISCUSSION
Figure 3a shows typical force curves for mica in air As the piezoscanner extendsupward approaching the tip from 1 to 2 the tip is pulled down by the attractive forceand jumps to contact with the surface at 2 As the piezoscanner continues to extendthe cantilever bends upward as the tip presses onto the surface In this case from 2to 3 the slope of the forcendashdistance curve provides information on the elasticity ofthe sample When the tip reaches position 3 the piezoscanner retracts from the tipand the cantilever relaxes As the sample continues to retract the cantilever beginsto bend downward points 3 and 4 due to the adhesion force until reaching thebreak point 4 at which the cantilever rebounds sharply upward to 5
The adhesion force measured between points 4 and 5 can be expressed as
Fadhes D kplusmnmax (2)
where Fadhes is the adhesion force (nN) k and plusmnmax are the elastic constant and themaximum de ection of the cantilever respectively
For mica (Fig 3b) the force curves in water are similar to those in air except thatthe noise in this case is much higher due to uctuations in density andor viscosityof the liquid and the piezoscanner approach speed [41] This is indeed the reasonwhy force curves cannot be obtained in some liquids Besides the adhesion force ismuch lower in a liquid responsible for the behavior between points 4 and 5 as willbe explained further
Because the adhesion force is an important parameter for the surface properties ofmaterials we have investigated the accuracy of the measurements Using equation(1) we estimated the adhesion forces from 30 measurements in air and water tobe respectively 30 sect 3 nN and 12 sect 1 nN showing that the environment haspractically no effect on the data scatter The 10 variation in the data obtained atthe same point might be related to the fact that in 30 measurements the tip touchesthe sample surface at different points within what we referred to as the criticalvariability radius av The de nition of this critical variability radius is given inFig 4 where the dark circle below the tip corresponds to the tipndashsample contact
2146 F L Leite et al
(a)
(b)
Figure 3 Typical force curves for mica in air (a) and in water (b)
area The white circle corresponds to the maximum area of interaction between thetip and the sample surface (Av D frac14a2
v ) as the piezoscanner retracts and approachesin pull-off force measurements This critical variability radius depends on theprevious history of the piezoscanner (creep non-linearity hysteresis age etc) and
Mapping of adhesion forces on soil minerals AFS 2147
Figure 4 Critical variability radius av associated with the maximum variation of positioning of thepiezoscanner in the measured force curves
Table 1Average values of adhesion force to freshly cleavedmica in air and water and the variabilityassociatedwith them
Points Average value of the Variabilityadhesion force 1F ()F (nN)
on the mechanical and electronic factors of the equipment such as vibration thermalstability feed-forward control and noise level (data not shown)
Figure 5a shows the topography of the muscovite mica freshly cleaved inair onto which force curve measurements were taken in ve different regionsFigure 5b and 5c illustrates the corresponding adhesion map plots in air and waterrespectively Each point represents 10 force curve measurements In Fig 5b and 5cthe z-axis depicts the adhesion force magnitude while the xy plane corresponds tothe sample surface The variation in adhesion force F ad is given in Table 1 rangingfrom 9 to 14 depending on the region scanned during measurements in air orwater This con rms the statement in the previous paragraph that the environmenthas no signi cant effect on the adhesion variability There is a 52 decrease inadhesion due to the meniscus removal which is responsible for the capillary effectin the force curves in air The adhesion shown in Fig 5c is attributed mostly to vander Waals forces while the capillary component dominates the adhesion forces inair (Fig 5b)
2148 F L Leite et al
(a)
(b)
(c)
Figure 5 (a) Topographical image of the mica surface with a roughness of 01 nm Adhesion mapplots illustrating the variability of the adhesion forces onto mica in air (b) and water (c) The averageadhesion forces were F D 25 sect 4 nN in air and F D 12 sect 1 nN in water The black regionscorrespond to values up to 30 above the average adhesion
Mapping of adhesion forces on soil minerals AFS 2149
(a)
(b)
Figure 6 (a) Histogram illustrating how the adhesion to quartz varies (b) Schematic diagramshowing the interaction between the AFM tip and the sample surface and its in uence on themagnitude of the measured adhesion force (adapted from Ref [50])
In order to con rm the importance of surface roughness adhesion forces weremeasured on quartz samples which had a higher surface roughness (gt1 nm) fora scanned area of 1 sup1m2 Such high value compared with that on mica leads to alarger variation in the adhesion force as the area is scanned as shown in Fig 6aThe adhesion force varied within 16 on smoother regions and 29 on rougherareas The increased adhesion in smoother areas is consistent with the literature[42ndash45] as the surface properties at the nano-scale level such as adhesion arestrongly in uenced by the topography of the sample surface Moreover even asmall surface roughness decreases signi cantly the adhesion force [46]
2150 F L Leite et al
A commonly used representation of the tip sample surface system is to considerthe tip as a sphere of radius R and the sample surface as a plane [47 48] as itwas considered here Figure 6b shows how the sample topography in uences theadhesion force The maximum adhesion force is reached when the tip is in region3 where there is a larger contact area than those in regions 1 and 4 since a largepart of the tip is in contact with the sample surface The minimum adhesion force ismeasured in region 2 where the contact area is reduced and the effective bending isminimum Therefore adhesion maps are able to reveal differences in the topographyof the samples Willing et al [49] studied adhesion based on the use of a colloidalprobe in conjunction with the force-volume technique where the spatial variationof the adhesion was visualized by analyzing the force-volume data with a softwareto create adhesion area maps
Figure 7 shows three adhesion maps acquired in different regions of mica after2 h of air exposure with constant humidity The adhesion map in region A(Fig 7a) indicates a decrease of approximately 33 in the adhesion force Thedifference in roughness between regions A B (Fig 7b) and C (Fig 7c) is small andtherefore the maximum deviation in the adhesion force due to roughness shouldbe smaller than 17 (regional variability Table 1) for a mica sample Thus the33 decrease in region A is assumed to arise from organic contamination since themica becomes hydrophobic after air exposure [50 51] The observed differencesin force-curve measurements have been attributed to the adsorbed layer formed onmica surfaces cleaved in laboratory air This adsorbed layer has often been referredto as lsquoorganicrsquo because of the presence of organic carbon detected by surfacespectroscopic techniques such as SSIMS [52] and XPS [53] The thickness andcomposition of this adsorbed layer on mica will vary depending on the laboratoryatmosphere and the experimental procedures used
The adhesion force is in uenced by the sample conditions Considering that partof this force is caused by adsorbed water it is important to clarify the contaminationeffect in the pull-off force measurements The presence of an organic contaminantlayer onto a solid surface changes the contact angle thus in uencing the adsorptionof a water layer over the sample surface Consequently changes in adhesion will beobserved The adhesion maps will show how the spatial variations of the samplendash tipinteractions depend on the surface conditions
The regions B and C illustrated in Fig 7 have a thin water layer as will be shownlater The capillary force is given by [54]
F aircap D 2frac14Rdeglvcos micro1 C cos micro2 (3)
where degLV is the liquidndash vapor interfacial free energy R is the radius of the AFMtip and micro1 and micro2 are the contact angles of water for the mica surface and the tiprespectively For freshly cleaved mica the water contact angle is frac140plusmn and foroxidized silicon tip (exposed to air) the contact angle is frac1479plusmn (data not shown)Contact angle measurements were made with an optical microscope with a digitalcamera by measuring the angle between the surface and the tangent drawn on the
Mapping of adhesion forces on soil minerals AFS 2151
(a)
(b)
(c)
Figure 7 Adhesion maps onto mica (a) region A (R D 13 Aring F D 16 sect 3 nN) (b) region B(R D 11 Aring F D 23 sect 3 nN) and (c) region C (R D 11 Aring F D 24 sect 4 nN) Each adhesion mapcorresponds to a scanning area of 1 sup1m2 The black regions correspond to values up to 30 abovethe average adhesion
2152 F L Leite et al
water droplet image ( ve measurements were made on each surface of mica) Thesurface free energy of the adsorbed water layer is deglv D 720 mJm2
The resultant capillary adhesion force due to the presence of adsorbed water is15 sect 3 nN from equation (3) with an estimated scatter of 20 due to errors in themeasurements of contact angle and radius of curvature of the tip This theoreticalvalue is lower than that in Fig 7 for regions B and C because the contribution fromvan der Waals forces (FvdW) to adhesion was not taken into account in the theoreticalcalculation The equation that relates the van der Waals forces (contact adhesion inthe condensate FvdW) and capillary forces is given by [32]
F airadhes D 2frac14Rdeglvcos micro1 C cos micro2 C FvdW (4)
where the second term on the right-hand side of equation (4) is the contact adhesionfrom the van der Waals forces [55] One may eliminate capillary forces bymeasuring adhesion with both sample and AFM tip in the water allowing one toestimate the contribution from the van der Waals forces only
The force measured on the AFM cantilever in a liquid environment can beestimated using the Derjaguinndash MullerndashToporov (DMT) [56] theory as
F watervdW D 2frac14R$132 (5)
where R is the AFM tip radius and $132 is the work of adhesion per unit areabetween the AFM Si tip (subscript 2) and the sample surface (subscript 1) in a liquidenvironment (subscript 3) The DMT equation applies to rigid systems with lowadhesion and small radii of curvature but it can underestimate the true contact areaEquation (5) is correct for a spherical tip in contact with a planar surface valid forlong-ranged attraction around the periphery of the contact area with the tipndashsamplegeometry being constrained to remain Hertzian [57] In other words the DMTtheory is the Hertzian theory with an offset due to surface forces and no hysteresisbetween loading and unloading However Beach et al [58] showed that the pull-offforces were not very sensitive to the maximum applied load suggesting that the useof continuum elastic contact mechanics in the analysis of measured force curves wasnot as straightforward as usually assumed in the literature In our case the work ofadhesion (Si tipndashwaterndashmica) is $132 D 011 Jm2 resulting in an adhesion forceof 16 sect 2 nN in water From equation (4) it is possible to obtain the theoreticalvalue of the adhesion force in air on freshly cleaved mica which is 31 sect 5 nNThe adhesion force results in air presented in Fig 7b and 7c Fadhes D 23 sect 3and Fadhes D 24 sect 4 nN respectively demonstrate that the experimental data areconsistent with the calculated values
In order to separate the adhesion force fractions from each other the pull-offforces were measured under two conditions in the same experimental assemblyFigure 8 shows a comparative plot between theoretical and experimental results inair and water Histogram A shows a good agreement between the experimental pull-off forces in air and the theoretical results using equation (4) with the differenceswithin the expected variation This histogram represents the sum of the capillary
Mapping of adhesion forces on soil minerals AFS 2153
Figure 8 Histogram illustrating the theoretical and experimental variations of the adhesion forcecomponents in air and water
and van der Waals interaction forces ie F airadhes D Fcap C FvdW Histogram B shows
the experimental and theoretical (equation (5)) results in water It can be seem thatthe error bars do not overlap indicating that the differences are no more than the22 estimated error con rming the existence of the repulsive force due to doublelayer This histogram represents the adhesion effect caused mainly by the van derWaals interaction between the tip and the sample ie F water
adhes D FvdW Histogram Cshows the capillary force component obtained from equation (3) and the differencebetween the experimental pull-off forces in air and water ie F air
adhes iexclF wateradhes D Fcap
The difference between the theoretical (16 sect 2 nN) and experimental (12 sect 1 nN)values for water presented in Histogram B comes from the repulsive forcesbetween the tip and the mica surface When immersed in a polar liquid mediumlike water surface charges are induced on both the tip and the sample surfacedue to ionization dissociation or spontaneous adsorption of charged species Tokeep the electrical neutrality opposite ionic species are held together closer to thetip sample surface forming an electric double-layer When mica is placed in waterthe mechanism of the double-layer formation is attributed to the KC dissolution aswell as ionic exchange between KC and H3OC (or HC) [59] The existence of theelectrical double-layer is con rmed by the force curves as shown in Fig 9 wherean upward trend appears before the attractive van der Waals interaction Toikkaet al [60] showed that the double layer decreases the adhesion force and that theapparent adhesion force depends on the pH of the solution The authors con rmed
2154 F L Leite et al
Figure 9 Typical force curve for mica under water The upward trend pointed in the gure isindicativeof the double-layer effect The zero line represents that part the force curve in which the tipexerts no force on the sample ie when the tip and sample are far apart and the tip does not de ect
the existence of this phenomenon by measuring adhesion forces in different pHsolutions between an iron sample and silica colloidal probe
The interaction between electric double-layers from different surfaces may be ei-ther attractive or repulsive having different magnitudes depending on the surface-charge properties of the tip and sample materials concentration of ionic con-stituents ionic strength pH and temperature The effects of the electric double-layer forces on adhesion force measurements are only now beginning to be explored[60] and the results presented here might provide a better understanding on soilmineral interactions
Adhesion maps obtained from force spectroscopy have shown clearly how surfacecontamination roughness and the environmental conditions in uence the adhesionforces Little attention however is paid to the use of AFS for application inagricultural and colloidal science
4 CONCLUSIONS
The force curves obtained on some soil mineral particles (mica and quartz) showclearly that the adhesion force is sensitive to both the surface roughness and theenvironmental conditions
The magnitude of adhesion depends on the roughness and local curvature of thesample surface with a slight increase in the adhesion force in smoother regions Wehave shown that adhesion forces estimated from several measurements taken at the
Mapping of adhesion forces on soil minerals AFS 2155
same place on the sample surface vary within 13 on mica and 29 on the muchrougher quartz substrate
The scatter in the measured curvature radius and elastic constant of the tipprovides an error source to the adhesion force of typically 20 and 8 respectively
The adhesion maps made from hundreds of measurements at different points allowone to obtain information on heterogeneities in sample topography and on organiccontamination For example carbon contamination on mica possibly from humancontact or carbon dioxide from air affects the force curves This was corroboratedby the good agreement between the theoretical and experimental adhesion valuesobtained in both air and water With the adhesion maps for samples in air and inwater a distinction can be made between capillary and van der Waals componentsof the adhesion force
Acknowledgements
The authors are grateful to CNPq the nanobiotechnology network (CNPqMCT)for the nancial support and to Prof Osvaldo N Oliveira Jr for useful discussionsand revision of this manuscript
REFERENCES
1 G Binnig C F Quate and Ch Gerber Phys Rev Lett 56 930ndash 933 (1986)2 R F Lobo M A Pereira-da-Silva M Raposo R M Faria and O N Oliveira Jr Nanotech-
nology 14 101ndash 108 (2003)3 I Penegar C Toque S D A Connell J R Smith and S A Campbell in Proceedings of the
10th International Congress on Marine Biofouling Melbourne Australia (1999)4 Y Martin and H K WickramasingheAppl Phys Lett 50 1455ndash 1457 (1987)5 R Erlandsson G Hadziioannou C M Mate G M McClelland and S Chiang J Chem Phys
89 5190ndash 5193 (1988)6 C Jacquot and J Takadoum J Adhesion Sci Technol 15 681ndash687 (2001)7 H K Christenson and P M Claesson Adv Colloid Interface 91 391ndash436 (2001)8 L H G Segeren B Siebum F G Karssenberg J W A van den Berg and G J Vancso
J Adhesion Sci Technol 16 793ndash828 (2002)9 A Ata Y Rabinovich and R K Singh J Adhesion Sci Technol 16 337ndash 346 (2002)
10 C Schonenberger and S F Alvarado Phys Rev Lett 65 3162ndash3164 (1990)11 L Sirghi N Nakagiri K Sugisaki H Sugimura and O Takai Langmuir 16 7796ndash 7800 (2000)12 A Mendez-Vilas M L Gonzalez-Martin L Labajos-Broncano and M J Nuevo J Adhesion
Sci Technol 16 1737ndash1747 (2002)13 S Fujisawa E Kishi Y Sugawara and S Morita Phys Rev B 51 7849ndash7857 (1995)14 D M Taylor Thin Solid Films 331 1ndash7 (1998)15 A Torii M Sasaki K Hane and S Okuma Sensors Actuators A Phys 40 71ndash76 (1994)16 R Garciacutea and R Peacuterez Surf Sci Rep 47 197ndash301 (2002)17 M Binggeli and C M Mate J Vac Sci Technol B 13 1312ndash1315 (1995)18 M Scherge X Li and J A Schaefer Tribol Lett 6 215ndash 220 (1999)19 Q Ouyang K Ishida and K Okada Appl Surf Sci 169 644ndash 648 (2001)20 H A Mizes K-G Loh R J D Miller S K Ahuja and E F Grabowski Appl Phys Lett 59
2901ndash 2903 (1991)
2156 F L Leite et al
21 F Mugele T Becker R NikopoulosM Kohonen and S HerminghausJ Adhesion Sci Technol16 951ndash954 (2002)
22 L Sirghi N Nakagiri H Sugimura and O Takai Jpn J Appl Phys 40 1420ndash1424 (2001)23 H K Christenson J Phys Chem 97 12034ndash12041 (1993)24 K G Bhattacharyya J Electron Spectrosc Relat Phenom 63 289ndash306 (1993)25 K G BhattacharyyaLangmuir 5 1155ndash1162 (1989)26 G E Brown Jr A L Foster and J D Ostergren Proc Natl Acad Sci USA 96 3388ndash3395
(1999)27 D R Nielsen J W Hopmans and K Reichardt Scale Dependence and Scale Invariance in
Hydrology Cambridge University Press Cambridge (1988)28 R Wiesendanger Scanning Probe Microscopy and Spectroscopy mdash Methods and Applications
Cambridge University Press Cambridge (1994)29 G A Willing and R D Neuman Langmuir 18 8370ndash8374 (2002)30 H H P Fang K-Y Chan and L-C Xu J Microbiol Methods 40 89ndash97 (2000)31 R G Horn J N Israelachvili and F J Pribac J Colloid Interface Sci 115 480ndash 492 (1987)32 H K Christenson J Colloid Interface Sci 121 170ndash178 (1988)33 A M Homola J N Israelachvili M L Gee and P M McGuiggan Trans ASME J Tribology
111 675ndash 682 (1989)34 D Beaglehole and H K Christenson J Phys Chem 96 3395ndash3403 (1992)35 J Schultz K Tsutsumi and J-B Donnet J Colloid Interface Sci 59 272ndash276 (1977)36 J N Israelachvili Intermolecularand Surface Forces 2nd edn Academic Press New York NY
(1991)37 H K Christenson J Dispersion Sci Technol 9 171ndash206 (1988)38 C E Borato P S P Herrmann L A Colnago O N Oliveira and L H C Mattoso Braz J
Chem Eng 14 367ndash373 (1997)39 D Tabor Gases Liquids and Solids and Other States of Matter 3rd edn Cambridge University
D 25 (standard grade)41 B Cappella P Baschieri C Frediani P Miccoli and C Ascoli IEEE Eng Med Biol 16 58ndash65
(1997)42 T Stifter E Weilandt O Marti and S Hild Appl Phys A 66 S597ndashS605 (1998)43 K L Johnson Tribology Int 31 413ndash418 (1998)44 R Jones H M Pollock J A S Cleaver and C S Hodges Langmuir 18 8045ndash 8055 (2002)45 E R Beach G W Tormoen J Drelich and R Han J Colloid Interface Sci 247 84ndash89 (2002)46 K N G Fuller and D Tabor Proc R Soc London A 345 327ndash342 (1975)47 J N IsraelachviliSurf Sci Rep 14 109ndash 159 (1992)48 T Stifter O Marti and B Bhushan Phys Rev B 62 13667ndash 13673 (2000)49 G A Willing T H Ibrahim F M Etzler and R D Neuman J Colloid Interface Sci 226
185ndash188 (2000)50 B Cappella and G Dietler Surf Sci Rep 34 1ndash104 (1999)51 J Hu X-D Xiao D F Ogletree and M Salmeron Surf Sci 344 221ndash236 (1995)52 M G Dowsett R M King and E H C Parker J Vac Sci Technol 14 711ndash717 (1977)53 L Xu and M Salmeron Langmuir 14 5841ndash 5844 (1998)54 Y Ando Wear 238 12ndash19 (2000)55 T Eastman and D M Zhu Lagmuir 12 2859ndash 2862 (1996)56 B V Derjaguin V M Muller and Yu P Toporov J Colloid Interf Sci 53 314ndash 326 (1975)57 J Hertz Reine Angew Math 92 156ndash171 (1881)58 E R Beach G W Tormoen and J Drelich J Adhesion Sci Technol 16 845ndash868 (2002)59 E F Souza G Ceotto and O Teschke J Mol Catal A 167 235ndash243 (2001)60 G Toikka R A Hayes and J Ralston Langmuir 12 3783ndash 3788 (1996)