48
Geog 205: Gateway to Geography Topic 02: Geographic Representations

Geog 205:
Gateway to Geography
Topic 02:
Geographic Representations
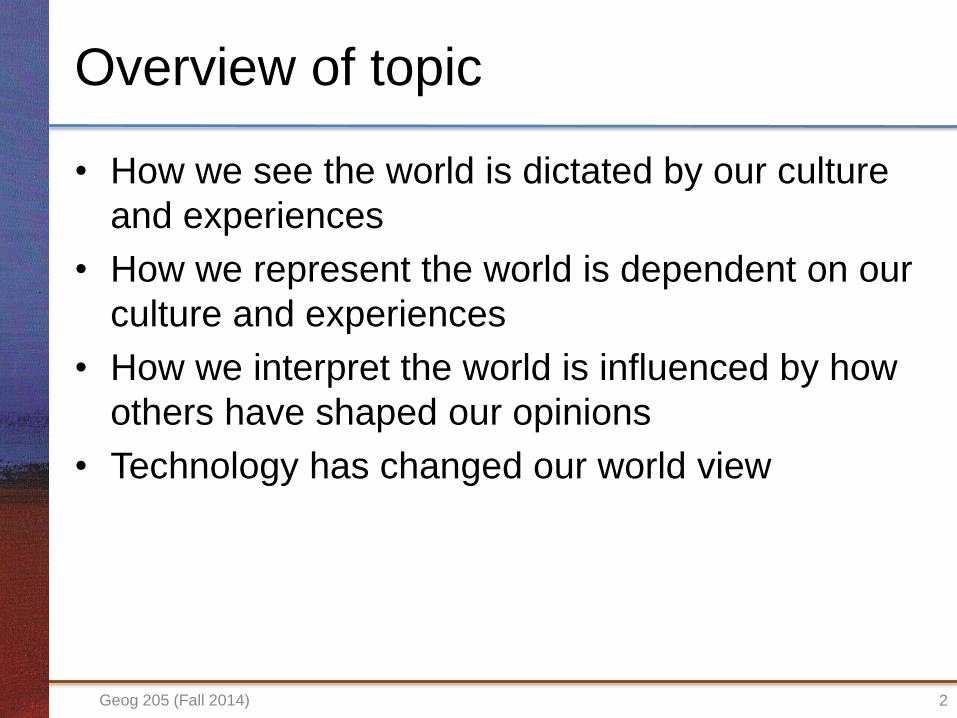
Overview of topic
• How we see the world is dictated by our culture
and experiences
• How we represent the world is dependent on our
culture and experiences
• How we interpret the world is influenced by how
others have shaped our opinions
• Technology has changed our world view
Geog 205 (Fall 2014) 2
Part I:
Introduction to Geographic
Representations
Geog 205 (Fall 2014) 3

Representations
System of symbols and images that enable
communication (sharing of meaning) and
understanding.
4Geog 205 (Fall 2014)

Geographic Representations
• Among the oldest and most important forms of human
knowledge
– graphical (maps and pictures)
– verbal (oral or written)
• Key issues:
1. What to represent
2. How to represent it
• Problems can be approached from different perspectives
• Knowledge is power
5Geog 205 (Fall 2014)

…con’t
• Maps/oral/written representations are not
objective forms of knowledge
– Hidden agendas and meanings – sometimes
unintentional, sometimes not
“… read between the lines of the map...to discover the
silences and contradictions that challenge the apparent
honesty of the image. We begin to learn that cartographic
facts are only facts within a specific cultural perspective.”
Harley (1989, 3)
6Geog 205 (Fall 2014)

Imperfect knowledge
• We do not know everything!
– Our universe is infinitely complex and we have
imperfect knowledge
• Scientific knowledge is a “work in progress”
– Often many ideas compete
– Disagreement/debate necessary for progress
– Constant change – cultural perspectives and
approaches
• Seldom can we establish who, or what, is
“correct”
– New information is often needed to resolve issues
7Geog 205 (Fall 2014)

Part II:
Distortions of Space
8Geog 205 (Fall 2014)

Map Scale
• The amount of reduction from a globe the same
size as the Earth
– Cartographic scale – how much a map is reduced
from the original (how much zoom)
– Geographic scale – how big something is
• The distinction is important
• A small scale map is used to show large scale
features
9Geog 205 (Fall 2014)

Spatial elements distorted on maps
• Shape and angles
– conformal
• Area
– equal area
• Distances
• Location
• Detail
– linked to map scale
– choice of cartographer
– “place distortions”
• Not possible to
preserve area and
shape on a flat map
(except a globe)
10Geog 205 (Fall 2014)

1:50,000 1:25,000
Map scale, areal coverage and detail
1:12,500
Large scale map – shows smaller area with more detail
Small scale map – shows larger area with less detail
Choice of scale depends on purpose and technology
Choice of scale determines the amount of generalization (distortion)
11Geog 205 (Fall 2014)

Scale and symbology
12
Modified from Heywood et al (2006), Fig 2.11
Geog 205 (Fall 2014)

Latitude and Longitude
• Latitude
– Reference is equator
– Ranges from 0-90 degrees N and S
• Longitude– No natural reference point
– Reference (prime meridian) at the Royal
Observatory at Greenwich England (0° Long)
– Ranges from 0 - 180 degrees E and W
• Graticule
– Arrangement of lines of latitude and longitude
on a map
Slo
cu
m e
t a
l. (
20
04
), F
ig 7
.313Geog 205 (Fall 2014)

Google earth image
showing Alaska
Google earth image
showing Brazil
Brazil8 500 000 km2
Alaska1 700 000 km2
14
Source: Robin Poitras
Which is larger?
Geog 205 (Fall 2014)
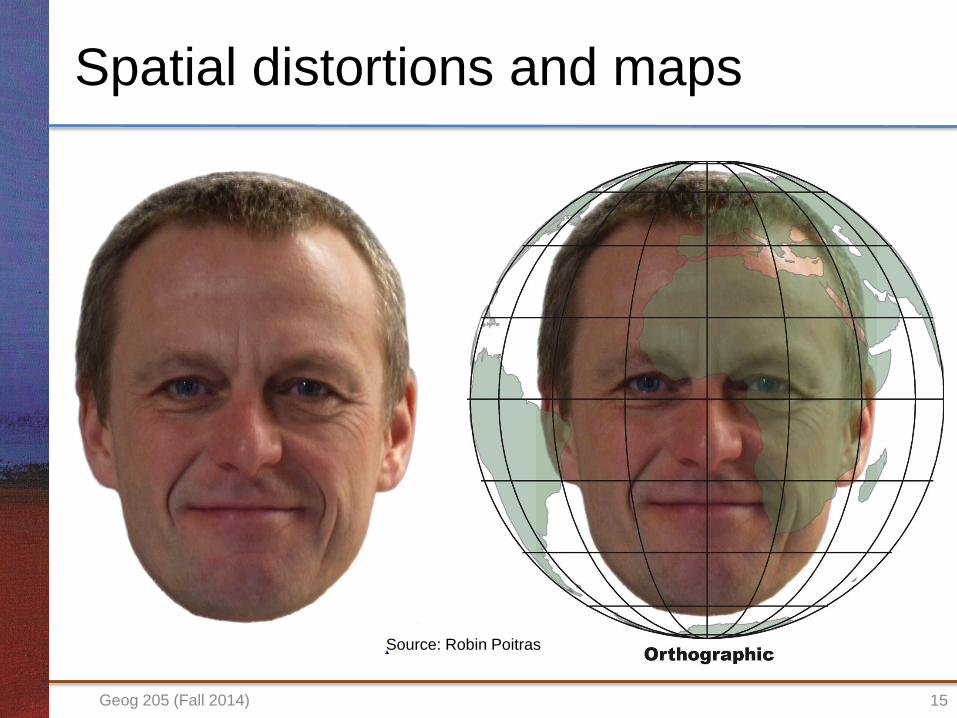
Spatial distortions and maps
15
Source: Robin Poitras
Geog 205 (Fall 2014)

Source: Robin Poitras
16
Mercator (and variants)
• commonly used
projections
• Conformal
• Basis for most
topographic maps
Geog 205 (Fall 2014)

Source: Robin Poitras
17Geog 205 (Fall 2014)
Part III:
Distortions of Place
18Geog 205 (Fall 2014)
It is all about perspective
“Luke, you're going to find that many of the
truths we cling to depend greatly on our own
point of view.”Obi Wan Kenobi - Starwars: Episode VI - Return of the Jedi (1983)
19Geog 205 (Fall 2014)

What is your view of the world?
Photo: D. Sjogren
20Geog 205 (Fall 2014)

Mental maps
• Everyday notions about spatial location
• Based on our sensory experience and memory
• Google maps and streetview
– merging personal sensory experience with technology
• We navigate the world at ground level (our
experience)
– informed (or misinformed) by technological advances
– Who controls the representations?
21Geog 205 (Fall 2014)

Cognition and representations
• Cognition/cognitive processes– Perception, thought process, prior experience and
memory
• Cognitive bias and representations– Attaching importance
• proximity or familiarity
– Cultural biases• how we interpret information
• choice of how to represent – choice of words or map type
– Why do certain symbols work on maps?• culturally significant – know your audience
22Geog 205 (Fall 2014)

Symbols that work – know your audience
Slocum et al. (2004), Fig 4.4
23Geog 205 (Fall 2014)

Politics of representation
• Place filtered through representation
– Media / popular culture
– Personal / cultural interpretations
• Challenges
– Authorship
• Who makes representations
• In whose interests – what is their agenda
– New ways of seeing (awareness)
– New ways of acting
24Geog 205 (Fall 2014)

Part IV:
Technology and our “Global View”
25Geog 205 (Fall 2014)

Data/information/misinformation
• Online access to a plethora of geographic data
– Raw and manipulated data in data repositories
– Interactive sites for mapping
– Navigation
• Communication systems enable near real-time
reporting (informal and formal)
– Dramatically changing our ability to learn about other
places and people
• But, it comes at a price
– Who controls the information flow?
– What are we not being told?
26Geog 205 (Fall 2014)

Questions for the critical user
1. What is the information you are accessing?
– Where did it originate?
2. What were the objectives/biases of the creator?
– How has it been manipulated, and why?
– Who benefits?
3. Is the data “correct” or “current”?
4. What technology is working behind the scene
and what are its limitations?
– What are limitations of data collection?
– Statistical manipulation/classification techniques –
appropriate?
27Geog 205 (Fall 2014)

Google Maps on smartphone
• What information is
necessary for this to work?
1. Location information for the
traveler
2. Image that shows the
landscape
3. Data about the location of
roads and how they are
connected
4. Destination address and
location
A. Global Positioning System
B. Remote Sensing
C. Geographic Information
Systems
28Geog 205 (Fall 2014)
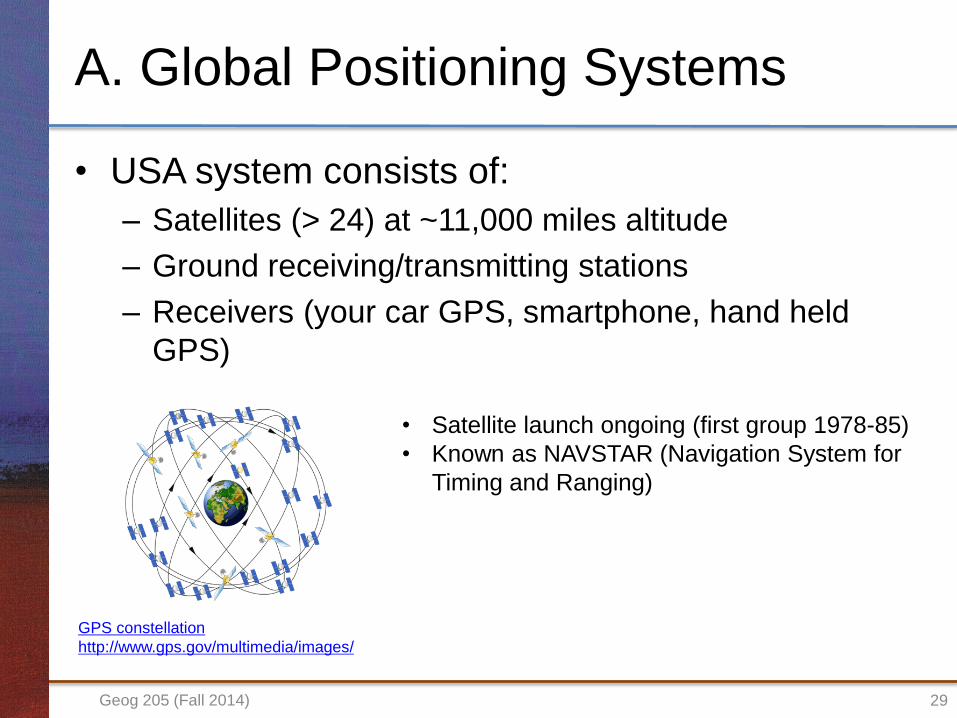
A. Global Positioning Systems
• USA system consists of:
– Satellites (> 24) at ~11,000 miles altitude
– Ground receiving/transmitting stations
– Receivers (your car GPS, smartphone, hand held
GPS)
GPS constellation
http://www.gps.gov/multimedia/images/
• Satellite launch ongoing (first group 1978-85)
• Known as NAVSTAR (Navigation System for
Timing and Ranging)
29Geog 205 (Fall 2014)

How it works in a nutshell
• Satellites broadcast a
time coded signal
• The times it takes for the
signals to reach receiver
are used to determine
distance from the
satellites
• Distance from satellites is
converted to location
(latitude and longitude)
http://www8.garmin.com/aboutGPS/waas.html
http://neethutv.wordpress.com/
30Geog 205 (Fall 2014)
Help! My car is lost!
• Errors caused by:
1. Clock errors
2. Atmosphere
3. Multipath
4. Orbit errors
5. # satellites available
6. Satellite location in sky
7. User error
• Intentional
1. USA government *
31Geog 205 (Fall 2014)
Other Navigation systems
• Russia – GLONASS
– Satellites launched after 1982
• European Union – Galileo
– Operational after 2018
• India - Navigational Satellite System
– Operational by 2014
• China - Compass Navigation System
– Satellite launches are ongoing
32Geog 205 (Fall 2014)

B. Geographic Information System (GIS)
• A GIS is a computer system
used for storage, retrieval,
mapping and analysis of
geographic data
• Involves extension of
database systems to
accommodate spatial
information analysis and
queries
• Primary system used to
manage geospatial
informationSource: unknown, showing different data
layers in a GIS
33Geog 205 (Fall 2014)

Some capabilities of GIS
• Input, conversion and display spatial information
– Various data is all referenced in the same geographic
space for further analysis
• Analyze geometry and spatial relationships
– Many applications in transportation and environmental
fields
• Cartographic and Geovisualization
– By integrating different types of information into maps
and digital representations help make informed
decisions
• Use for modeling and forecasting
34Geog 205 (Fall 2014)

GIS – two data formats
• Both can be used to
represent geographic
features
• Vector data:– stored as points, lines, and
polygons
– to each feature, attach a
table of attributes
• Raster data:– Stored as pixels
– Attributes (e.g. colour) stored
as values of the raster grid
Heywood et al. (2006), Fig 3.9
35Geog 205 (Fall 2014)

Resolution
• Spatial Resolution
– Smallest thing that can be
identified (resolved)
– In images usually refers to the
“pixel” size
• Dependent on the sensor
and the distance from object
• Resolution and scale are
closely linked, but they
are not the same thingHeywood et al. (2006), Fig 3.10
36Geog 205 (Fall 2014)

Cartographic v. Geographic Scale
37Geog 205 (Fall 2014)

C. Remote sensing
• Definition:
– “the science and art of obtaining
information about an object, area, or phenomenon through the analysis of data acquired by a device that is not in contactwith the object, area, or phenomenon under investigation.” Lillesand & Kieffer
– AKA Earth Observation (EO)
• Passive
– System records energy that comes to it
• Active
– System sends out energy and records
what comes back
http://hosting.soonet.ca/eliris/remotesensin
g/bl130lec13.html
Source: unknown (shows Passive remote sensing)
38Geog 205 (Fall 2014)

The Electromagnetic (EMR) Spectrum
• Electric and magnetic fields traveling at ~ 3 x 10⁸ m/s
• Emitted by all objects above ~ -273°C
• Basis for remote sensing – sensors measure EMR
http://bc1.lbl.gov/CBP_pages/educational/WoB/index1.htm
39Geog 205 (Fall 2014)

Orbit types
• Sun-synchronous
– Typical of satellites with environmental applications
– Examples: Landsat series, Terra, Aqua
• Geostationary
– Typical of meteorological and communication
satellites
– These orbits allows a satellite to pass over a
section of the Earth at the same time of day
– Examples: GOES series, Anik series
• Near Polar Orbiting
– This allows the satellite to see virtually every part
of the Earth as the Earth rotates underneath it
40Geog 205 (Fall 2014)

Types and applications of EO imagery
• Different spatial resolutions for different problems
– Low resolution used for large areas – high resolution
used for small areas
• Different sensors detect different parts of the
EMR spectrum
– give different/complementary information
• Some problems require specific combinations of
resolution and wavelength
41Geog 205 (Fall 2014)

GeoEye-1 – Yushu, China (15 Apr 2010) Post Earthquake (0.5 m resolution)
http://geoeyemediaportal.s3.amazonaws.com/assets/images/gallery/ge1/hires/yushu_china_04_15_10.jpg
42Geog 205 (Fall 2014)

IKONOS - Natori, Japan (12 Mar 2011)Post Earthquake (1 m resolution)
http://geoeyemediaportal.s3.amazonaws.com/assets/images/gallery/ge1/hires/natori_japan_03_12_11.jpg
43Geog 205 (Fall 2014)

Landsat 5 – Calgary (early 1990s)Colour Infrared (30 m resolution)
44
Data source: Landsat TM – processed by D. Sjogren
Geog 205 (Fall 2014)

GOES 11 – East USA (26 Aug 2011)Hurricane Irene (1 – 4 km resolution)
http://goes.gsfc.nasa.gov/goescolor/goeseast/hurricane2/color_lrg/latest.jpg
45Geog 205 (Fall 2014)
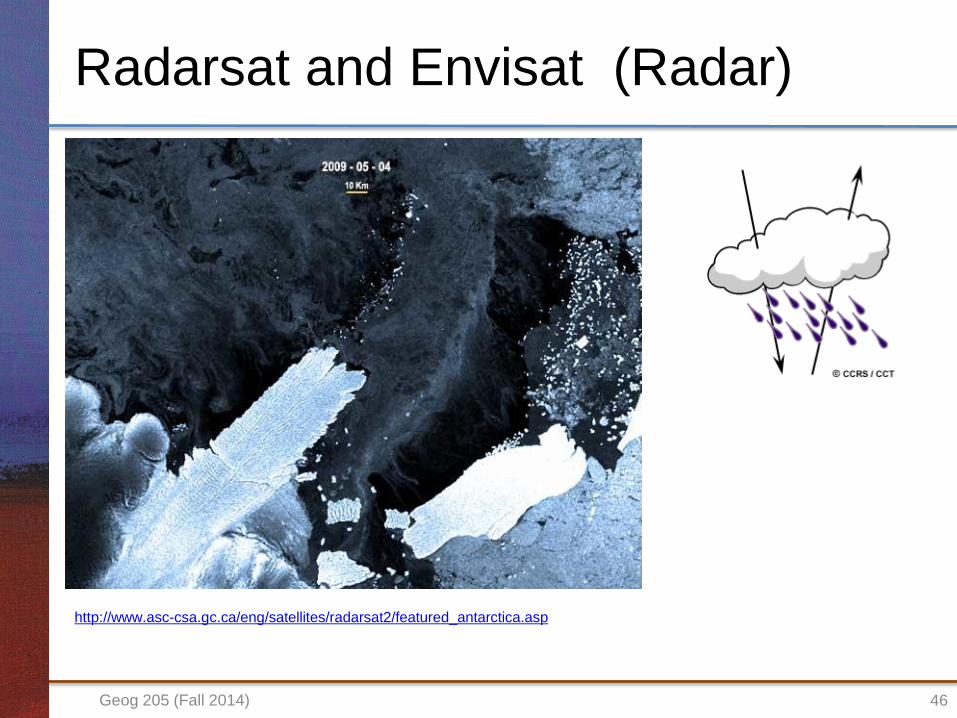
Radarsat and Envisat (Radar)
http://www.asc-csa.gc.ca/eng/satellites/radarsat2/featured_antarctica.asp
46Geog 205 (Fall 2014)

Representations – dangerous waters!
• Geographic representations
– Human decisions on what and how
– Human choices are always accompanied by bias
• Cultural undercurrents
• Agendas not always obvious (intentional or not)
• Technology and representations
– Creates a false sense of “accuracy” or “correctness”
– The same limitations apply even if the representation
came out of a computer
Lesson: Don’t take anything at face
value, read between the lines.47Geog 205 (Fall 2014)

Applications in our Geospatial Revolution
Geog 205 (Fall 2014) 48
Episode 1 http://www.youtube.com/watch?v=poMGRbfgp38
Episode 2 http://www.youtube.com/watch?v=GXS0bsR0e7w
Episode 3 http://www.youtube.com/watch?v=OePOK6nzcaY
Episode 4 http://www.youtube.com/watch?v=9F7z9LLYxf8


![Making maps, many maps! [What is GIS?]](https://static.documents.pub/doc/80x56/568154c6550346895dc2cbe3/making-maps-many-maps-what-is-gis.jpg)


