CENTER FOR ECONOMIC AND COMMUNITY DEVELOPMENT Marcellus Shale and Local Economic Activity: What the 2012 Pennsylvania State Tax Data Say KIRSTEN HARDY AND TIMOTHY W. KELSEY NOVEMBER 13, 2013 CECD RESEARCH PAPER SERIES - STRENGTHENING PENNSYLVANIA’S COMMUNITIES – The Pennsylvania State University, 103 Armsby Building, University Park, PA http://aese.psu.edu/research/centers/cecd
Transcript
CENTER FOR ECONOMIC AND COMMUNITY DEVELOPMENT
Marcellus Shale and Local Economic Activity: What the 2012 Pennsylvania
State Tax Data Say
KIRSTEN HARDY AND TIMOTHY W. KELSEY
NOVEMBER 13, 2013
CECD RESEARCH PAPER SERIES - STRENGTHENING PENNSYLVANIA’S COMMUNITIES –
The Pennsylvania State University, 103 Armsby Building, University Park, PA http://aese.psu.edu/research/centers/cecd
Marcellus Shale & Local Economic Activity: What the 2012 Pennsylvania State Tax Data Say
Center for Economic & Community Development http://aese.psu.edu/research/centers/cecd 2
Marcellus Shale and Local Economic Activity: What the 2012 Pennsylvania State Tax Data Say
Development of Marcellus shale has brought many changes to parts of the Commonwealth. Drilling and related activity began in earnest in 2007 in several Pennsylvania counties, and has continued and expanded into many more counties since then. It is clear from experience and past research that the shale gas development activity impacts local economies through several means, including the lease and royalty income paid to mineral right owners, increased local employment and earnings, and greater activity at locally owned businesses. It is relatively common in these communities to hear some residents express concern that many of the jobs are going to outsiders, whether they be Texans or Oklahomans, or Pennsylvanians from other counties. The implication behind such statements is that much of the benefit of shale gas development is not staying within the counties where drilling is occurring. The Pennsylvania Department of Revenue has several data series which focus on county residents, and thus allow examining the economic impact of Marcellus shale development on residents themselves in the counties where drilling activity is occurring. The Department releases aggregate Personal Income Tax data at the county level, which is compiled directly from personal income tax returns filed by taxpayers who self-identify as being a resident of that specific county. Non-resident workers, including Pennsylvanians from elsewhere in the Commonwealth, and out-of-state workers, are not included in the county totals. The data thus allows focusing solely on how much of the income resulting from Marcellus shale development stays within the county where drilling activity is occurring. In addition, the Department of Revenue releases data on state sales tax and realty transfer tax collections within each county. The information provides additional insights on how Marcellus shale development is affecting local economies. This Fact Sheet provides basic analysis of state tax information between the years of 2004-2012 as reported in the Department of Revenue’s ‘Pennsylvania Tax Compendium.’ The Fact Sheet updates similar analysis conducted in 2011 using 2009 data (Costanzo and Kelsey, 2011) and in 2012 using 2010 data (Costanzo and Kelsey, 2012), and provides a more current perspective on Marcellus shale activity and state taxes. The data continue to show distinct differences between counties with Marcellus Shale gas drilling and those without. I. Method of Analysis Counties were categorized by the number of Marcellus shale wells drilled during the study years, using Pennsylvania Department of Environmental Protection data. Changes in income reported on tax returns and state tax collections within each county were calculated using the Department of Revenue data, adjusting for inflation using 2007 dollars, and then the average change within each category of counties was calculated. Data presented here reflects the averages for each of the category groups based on the number of Marcellus wells drilled to date; the individual data for each county may differ from the average shown in this Fact Sheet (the latter individual county data appears in the Appendices). Due to differences in data availability, the tax analysis had to be conducted for different comparison years for some taxes. The most recent currently available Personal Income Tax data is from calendar year 2010, while the most recent currently available state Sales and Realty Transfer Tax data is from the 2011/2012 fiscal year (June 1 through July 30). For analysis of the Personal Income Tax analysis, we grouped counties by those with more than 90 Marcellus wells between 2007 and 2010; 10 to 89 Marcellus wells; 1 to 9 Marcellus wells; and no Marcellus (see Appendix A for a complete listing of the counties). For the Sales Tax and Realty Transfer Tax analysis, we grouped counties by those with 150 or more Marcellus wells, 10 to 149 Marcellus wells, 1 to 9 Marcellus wells, and no Marcellus wells drilled between July 1, 2004, and June 30, 2012. These categories were selected based upon how the counties clustered by well counts. The number of counties in each of the four groupings by wells changed from year to year and this is noted in our data tables and analysis.
Marcellus Shale & Local Economic Activity: What the 2012 Pennsylvania State Tax Data Say
Center for Economic & Community Development http://aese.psu.edu/research/centers/cecd 3
To see how tax collections are changing over time, we compared these results to previous years’ analysis. We chose to take a closer look at the percent change in state Sales Tax and Realty Transfer Tax from the years 2004 to 2012 to observe long term trends in Marcellus shale development. Additionally we calculated the changes in Personal Income Tax data from 2004 to 2010 on a per tax return basis as well as percent change over time. It is important to note that the data reflect tax collections by the state government within each county; county governments cannot levy these taxes. In addition, the Earned Income tax available to municipalities and school districts is much narrower than the state Personal Income Tax analyzed in this study, only including wage and salary, and net profit income. The analysis thus should not be viewed as reflecting what is occurring with tax collections by local governments and school districts.
II. Taxable Personal Income of County Residents The Commonwealth’s Personal Income Tax is a levy on personal income, including wages and salaries, interest, investment income, and leasing and royalty income. Social Security and pension income are exempt from the tax, so such income is not reported by the Department of Revenue. Data on the tax is released by the Department of Revenue separately from sales, realty, and other state tax information, with the release typically lagging a year behind information on these other taxes. The most up-to-date Personal Income Tax data at the time of this writing is for the 2010 tax year, which is two years older than data on the other taxes. Because the Department of Revenue reports this data by the residence of the taxpayer, tax returns reflect the earnings of county residents (not of workers who commute into the county, or whose legal residence is outside of Pennsylvania). In addition to total personal income, it is important to consider how specific types of income have changed relative to Marcellus shale activity, because this helps clarify the distribution of benefits from the natural gas development activity. We thus further analyzed changes in the three types of income subject to the personal income tax which are most likely to be affected by Marcellus drilling activity: Gross Compensation (e.g. wages and salaries); Rents, Royalties, Patents and Copyrights income; and Net Profits income.
A. Total Personal Income The number of Personal Income Tax returns filed by residents statewide declined an average of 2.7 percent at the county level between 2007 and 2010, but in counties with the most Marcellus shale activity, the average decrease was less (see Table 1). Counties with 90 or more wells on average experienced a 1.2 percent decrease in the number of state tax returns filed. Other counties with less Marcellus shale activity on average had larger decreases in the number of tax returns than the state and counties without Marcellus activity. Total taxable income reported in the counties with the most Marcellus activity similarly outperformed the state average when adjusted for inflation, increasing an average of 6 percent compared to a 5 percent average decrease in taxable income statewide at the county level. Of the top eight Marcellus counties however, just half showed positive changes in taxable income, although in three of those counties the increases were very large. Bradford, Tioga, and Susquehanna counties far surpassed the group average during this time period with increases of 19.1 percent, 21.6 percent, and 16 percent in total taxable income, respectively. In Fayette, Lycoming, Washington and Westmoreland counties, total taxable income declined from 2007 to 2010 (see Appendix B), though the declines in the latter three were less than the statewide average decline.
Marcellus Shale & Local Economic Activity: What the 2012 Pennsylvania State Tax Data Say
Center for Economic & Community Development http://aese.psu.edu/research/centers/cecd 4
Table 1. Average Change in Taxable Income Subject to the Personal Income Tax, by Drilling Activity, 2007 to 2010
Level of Marcellus Activity in County
Percent Change (number of counties at level of Marcellus activity)
Average Change in Taxable Income
Adjusted for Inflation
Average Change in Number of Returns from County
Residents
More than 90 Marcellus wells 6% (8) -1.2% (8)
10 to 89 Marcellus wells -0.5% (14) -3.4% (14)
1 to 9 Marcellus wells -9% (13) -4.5% (13)
No Marcellus wells -8.1% (32) -2% (32)
State Average at the County Level -5% (67) -2.7% (67)
Sources: PA DEP; PA Dept. of Revenue, Personal Income Tax Statistics
Long term trends are difficult to discern due to the national economic downturn in 2008 and 2009 (see Charts 1a and 1b). The state tax data does however reflect the counties’ ability to survive the recession and bounce back after. Counties with 90 or more Marcellus wells suffered the smallest average decrease in both number of returns and taxable income during the recession, and counties with 10 or more wells had higher percent changes in both number of returns and taxable income amount after the recession. This suggests that the taxpayers in these counties with Marcellus activity on average experienced smaller economic losses due to the recession than did taxpayers elsewhere in the Commonwealth.
-4.0%
-2.0%
0.0%
2.0%
4.0%
6.0%
Av
era
ge
Pe
rce
nt
Ch
an
ge
Chart 1a. Average County Level Percent Change in Number of Tax Returns with Taxable Income
More than 90Marcellus wells
10 to 89Marcellus wells
1 to 9 Marcelluswells
No Marcelluswells
Marcellus Shale & Local Economic Activity: What the 2012 Pennsylvania State Tax Data Say
Center for Economic & Community Development http://aese.psu.edu/research/centers/cecd 5
Source for Charts 1a and 1b: PA Dept. of Revenue, Personal Income Tax Statistics
B. Gross Compensation (wages and salaries) Pennsylvania state tax on gross compensation is a tax on all reported wages and salaries. Between the years of 2007 and 2010, total gross compensation to residents in counties with 90 or more Marcellus wells on average increased more when adjusting for inflation than in those counties with fewer or without wells (see Table 2). For example, gross compensation increased an average of 1.5 percent between 2007 and 2010 in counties with more than 90 Marcellus wells, compared to an average 3.2 percent decrease in counties with no Marcellus wells. Such an increase in gross compensation could occur due to rising wage rates, by people working many more hours at the same wages they had previously, or a combination of both. The number of tax returns reporting such income (e.g. wages and salaries) declined slightly in the counties with the most drilling (down 0.3 percent), while counties without Marcellus shale wells averaged a decline of 1.7 percent. This means high drilling counties on average experienced smaller losses in total employment of county residents than did those counties without Marcellus activity. That gross compensation in high drilling counties on average increased while the number of returns reporting such income decreased suggests that Marcellus shale development has a larger effect on the total wages and salaries received by county residents than it does on the number of county residents who are employed. Such a change could occur if the demand for labor exceeds the local supply, driving up local wages or hours worked.
Table 2. Percent Change in Gross Compensation, by Drilling Activity
Level of Marcellus Activity in County
2007 to 2010
Average Change in Gross Compensation Adjusted for Inflation (number of counties)
Average Change in Number of Returns
Reporting this Income
More than 90 Marcellus wells 1.5% (8) -0.3%
10 to 89 Marcellus wells -2.5% (14) -2.7%
1 to 9 Marcellus wells -4.8% (13) -3.9%
No Marcellus wells -3.2% (32) -1.7%
State Average at the County Level
-2.8% (67) -2.2%
Sources: PA DEP; PA Dept. of Revenue, Personal Income Tax Statistics
-12.0%
-8.0%
-4.0%
0.0%
4.0%
8.0%
12.0%
Av
era
ge
Pe
rce
nt
Ch
an
ge
, a
dju
ste
d f
or
infl
ati
on
Chart 1b. Average County Level Percent Change in Taxable Income ($) in 2007 Dollars
More than 90Marcelluswells10 to 89Marcelluswells1 to 9MarcelluswellsNo Marcelluswells
Marcellus Shale & Local Economic Activity: What the 2012 Pennsylvania State Tax Data Say
Center for Economic & Community Development http://aese.psu.edu/research/centers/cecd 6
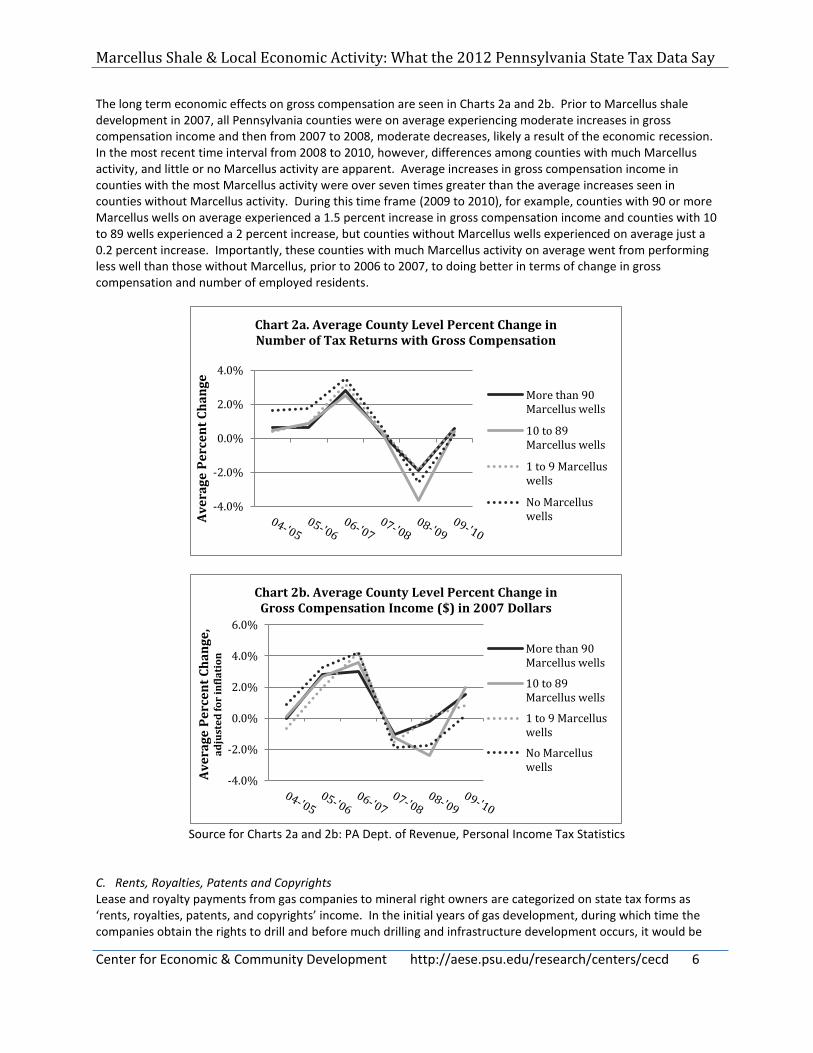
The long term economic effects on gross compensation are seen in Charts 2a and 2b. Prior to Marcellus shale development in 2007, all Pennsylvania counties were on average experiencing moderate increases in gross compensation income and then from 2007 to 2008, moderate decreases, likely a result of the economic recession. In the most recent time interval from 2008 to 2010, however, differences among counties with much Marcellus activity, and little or no Marcellus activity are apparent. Average increases in gross compensation income in counties with the most Marcellus activity were over seven times greater than the average increases seen in counties without Marcellus activity. During this time frame (2009 to 2010), for example, counties with 90 or more Marcellus wells on average experienced a 1.5 percent increase in gross compensation income and counties with 10 to 89 wells experienced a 2 percent increase, but counties without Marcellus wells experienced on average just a 0.2 percent increase. Importantly, these counties with much Marcellus activity on average went from performing less well than those without Marcellus, prior to 2006 to 2007, to doing better in terms of change in gross compensation and number of employed residents.
Source for Charts 2a and 2b: PA Dept. of Revenue, Personal Income Tax Statistics
C. Rents, Royalties, Patents and Copyrights Lease and royalty payments from gas companies to mineral right owners are categorized on state tax forms as ‘rents, royalties, patents, and copyrights’ income. In the initial years of gas development, during which time the companies obtain the rights to drill and before much drilling and infrastructure development occurs, it would be
-4.0%
-2.0%
0.0%
2.0%
4.0%
Av
era
ge
Pe
rce
nt
Ch
an
ge
Chart 2a. Average County Level Percent Change in Number of Tax Returns with Gross Compensation
More than 90Marcellus wells
10 to 89Marcellus wells
1 to 9 Marcelluswells
No Marcelluswells
-4.0%
-2.0%
0.0%
2.0%
4.0%
6.0%
Av
era
ge
Pe
rce
nt
Ch
an
ge
, a
dju
ste
d f
or
infl
ati
on
Chart 2b. Average County Level Percent Change in Gross Compensation Income ($) in 2007 Dollars
More than 90Marcellus wells
10 to 89Marcellus wells
1 to 9 Marcelluswells
No Marcelluswells
Marcellus Shale & Local Economic Activity: What the 2012 Pennsylvania State Tax Data Say
Center for Economic & Community Development http://aese.psu.edu/research/centers/cecd 7
expected that lease dollars will exceed royalties. As the development matures and most mineral rights have been leased, more wells are drilled and start producing, the proportion of royalty dollars would increase and the share of leasing dollars would drop. Changes in the number of tax returns reporting rents, royalties, patents, and copyrights income varied substantially between the counties (see Table 3). In counties with 90 or more Marcellus wells, the number of returns reporting royalty income increased 64.8 percent between 2007 and 2010, and taxable income on average increased 460.8 percent. Counties without any Marcellus wells on average also experienced growth in both the number of returns and income, but this growth was less than in the counties with Marcellus wells (7.3 percent increase in returns, and 15 percent increase in total taxable income).
Table 3. Percent Change in Rents, Royalties, Patents and Copyrights, by Drilling Activity
Level of Marcellus Activity In County
2007 to 2010
Average Change in Rents, Royalties Income
Adjusted for Inflation (number of counties)
Average Change in Number of Returns
Reporting this Income
More than 90 Marcellus wells 460.8% (8) 64.8%
10 to 89 Marcellus wells 274.7% (14) 34.1%
1 to 9 Marcellus wells 38.9% (13) 10.4%
No Marcellus wells 15% (32) 7.3%
State Average at the County Level
127.1% (67) 20.4%
Sources: PA DEP; PA Dept. of Revenue, Personal Income Tax Statistics
Some of the royalty income increase in non-Marcellus counties likely is related to Marcellus activity, because land being developed for Marcellus includes second home and recreational land owned by Pennsylvanians living outside of the Marcellus counties, and land owned by the Commonwealth. In addition, several counties in the southwest region of Pennsylvania have a history of coal mining and shallow natural gas drilling, during which time many of the mineral rights were separated from the surface landowners. These subsequently have been passed down through the generations, with some owners moving out of the county. Most of the Marcellus counties in the north lack much past history of coal and gas development, so mineral rights are more likely to be owned by the surface landowners. The result is wide variation in the lease and royalty income changes between counties with similar levels of drilling activity (see Appendix B).
Marcellus Shale & Local Economic Activity: What the 2012 Pennsylvania State Tax Data Say
Center for Economic & Community Development http://aese.psu.edu/research/centers/cecd 8
Source for Charts 3a and 3b: PA Dept. of Revenue, Personal Income Tax Statistics
Counties with more drilling activity on average had larger percentage increases in rents, royalties, patents and copyrights income (see Charts 3a and 3b). Such income in counties with 90 or more wells increased an average of 178 percent between 2007 and 2008, the years when leasing activity was particularly robust. Counties with 10 to 89 wells experienced an average increase of 78.2 percent and counties with 1 to 9 wells experienced an average increase of 35.2 percent during that time frame. The increase in counties with no Marcellus wells, in contrast, on average increased just 8.6 percent. D. Net Profits Net profits are the profits from the operation of a business, owned by a resident taxpayer. The state tax data similarly indicates that net profits income on average increased more in high drilling counties from 2007 to 2010 than in counties with no Marcellus drilling activity (see Table 4). Net profits income in counties with 90 or more Marcellus wells increased an average of 14.4 percent between 2007 and 2010 whereas such income in counties with no wells decreased an average of 5.4 percent. The higher average net profits income in the high drilling counties occurred across fewer local businesses, however; the data indicates that these high drilling counties averaged a loss of 2.2 percent of taxpayers reporting net profit income, compared to only a 0.9 percent decline of such taxpayers in counties with no Marcellus wells.
-10.0%
0.0%
10.0%
20.0%
30.0%
40.0%
Av
era
ge
Pe
rce
nt
Ch
an
ge
Chart 3a. Average County Level Percent Change in Number of Tax Returns with Rents, Royalties, Patents
and Copyrights Income
More than 90Marcellus wells
10 to 89 Marcelluswells
1 to 9 Marcelluswells
No Marcellus wells
-50.0%
0.0%
50.0%
100.0%
150.0%
200.0%
Av
era
ge
Pe
rce
nt
Ch
an
ge
, a
dju
ste
d f
or
infl
ati
on
Chart 3b. Average County Level Percent Change in Rents, Royalties, Patents, and Copyrights Income ($) in
2007 Dollars
More than 90Marcellus wells
10 to 89 Marcelluswells
1 to 9 Marcelluswells
No Marcellus wells
Marcellus Shale & Local Economic Activity: What the 2012 Pennsylvania State Tax Data Say
Center for Economic & Community Development http://aese.psu.edu/research/centers/cecd 9
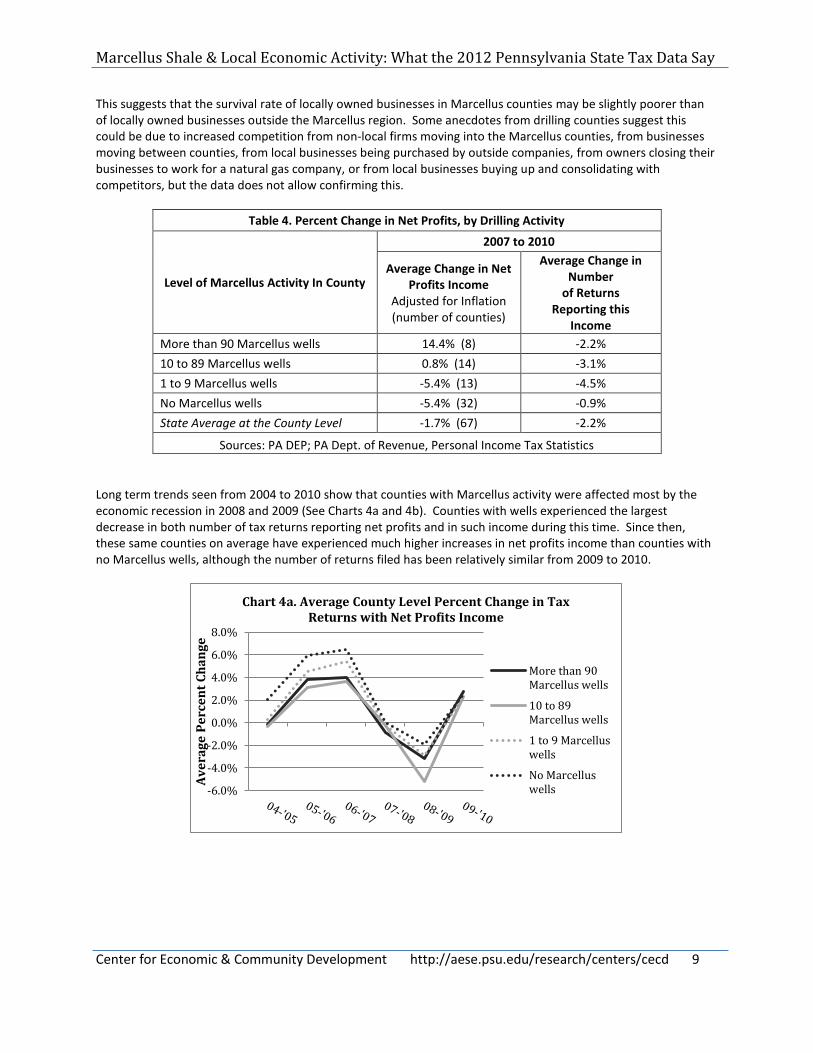
This suggests that the survival rate of locally owned businesses in Marcellus counties may be slightly poorer than of locally owned businesses outside the Marcellus region. Some anecdotes from drilling counties suggest this could be due to increased competition from non-local firms moving into the Marcellus counties, from businesses moving between counties, from local businesses being purchased by outside companies, from owners closing their businesses to work for a natural gas company, or from local businesses buying up and consolidating with competitors, but the data does not allow confirming this.
Table 4. Percent Change in Net Profits, by Drilling Activity
Level of Marcellus Activity In County
2007 to 2010
Average Change in Net Profits Income
Adjusted for Inflation (number of counties)
Average Change in Number
of Returns Reporting this
Income
More than 90 Marcellus wells 14.4% (8) -2.2%
10 to 89 Marcellus wells 0.8% (14) -3.1%
1 to 9 Marcellus wells -5.4% (13) -4.5%
No Marcellus wells -5.4% (32) -0.9%
State Average at the County Level -1.7% (67) -2.2%
Sources: PA DEP; PA Dept. of Revenue, Personal Income Tax Statistics
Long term trends seen from 2004 to 2010 show that counties with Marcellus activity were affected most by the economic recession in 2008 and 2009 (See Charts 4a and 4b). Counties with wells experienced the largest decrease in both number of tax returns reporting net profits and in such income during this time. Since then, these same counties on average have experienced much higher increases in net profits income than counties with no Marcellus wells, although the number of returns filed has been relatively similar from 2009 to 2010.
-6.0%
-4.0%
-2.0%
0.0%
2.0%
4.0%
6.0%
8.0%
Av
era
ge
Pe
rce
nt
Ch
an
ge
Chart 4a. Average County Level Percent Change in Tax Returns with Net Profits Income
More than 90Marcellus wells
10 to 89Marcellus wells
1 to 9 Marcelluswells
No Marcelluswells
Marcellus Shale & Local Economic Activity: What the 2012 Pennsylvania State Tax Data Say
Center for Economic & Community Development http://aese.psu.edu/research/centers/cecd 10
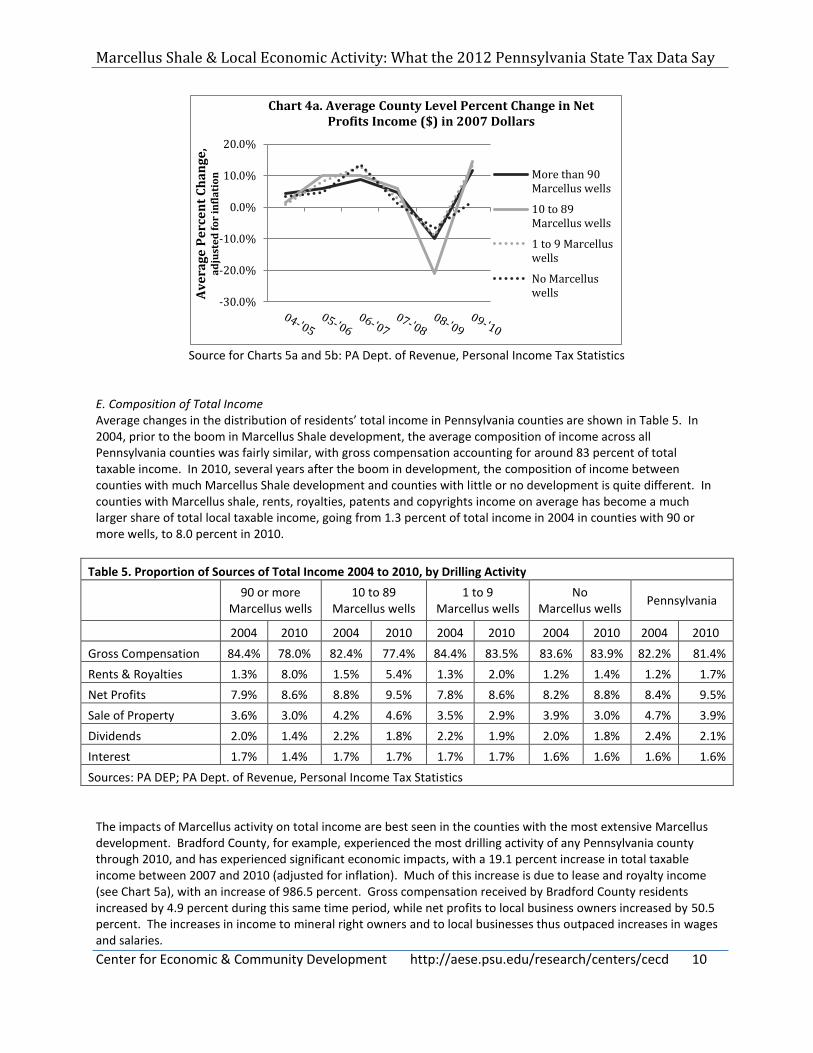
Source for Charts 5a and 5b: PA Dept. of Revenue, Personal Income Tax Statistics
E. Composition of Total Income Average changes in the distribution of residents’ total income in Pennsylvania counties are shown in Table 5. In 2004, prior to the boom in Marcellus Shale development, the average composition of income across all Pennsylvania counties was fairly similar, with gross compensation accounting for around 83 percent of total taxable income. In 2010, several years after the boom in development, the composition of income between counties with much Marcellus Shale development and counties with little or no development is quite different. In counties with Marcellus shale, rents, royalties, patents and copyrights income on average has become a much larger share of total local taxable income, going from 1.3 percent of total income in 2004 in counties with 90 or more wells, to 8.0 percent in 2010.
Table 5. Proportion of Sources of Total Income 2004 to 2010, by Drilling Activity
Sources: PA DEP; PA Dept. of Revenue, Personal Income Tax Statistics
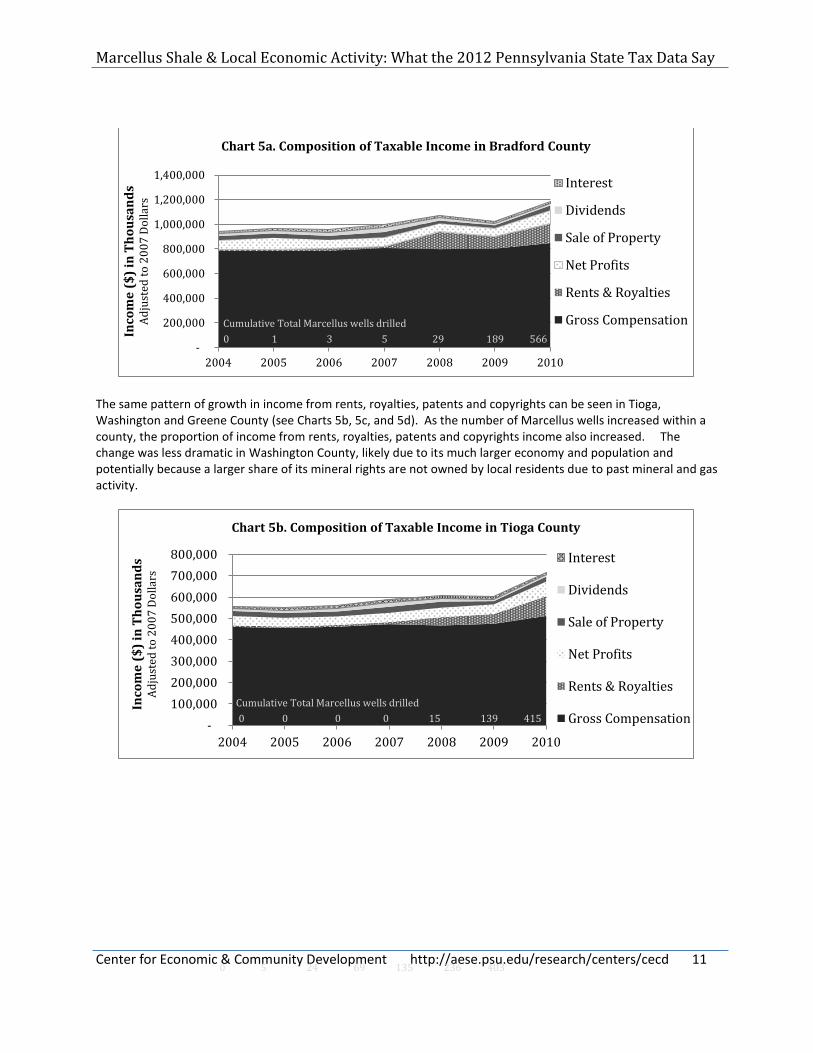
The impacts of Marcellus activity on total income are best seen in the counties with the most extensive Marcellus development. Bradford County, for example, experienced the most drilling activity of any Pennsylvania county through 2010, and has experienced significant economic impacts, with a 19.1 percent increase in total taxable income between 2007 and 2010 (adjusted for inflation). Much of this increase is due to lease and royalty income (see Chart 5a), with an increase of 986.5 percent. Gross compensation received by Bradford County residents increased by 4.9 percent during this same time period, while net profits to local business owners increased by 50.5 percent. The increases in income to mineral right owners and to local businesses thus outpaced increases in wages and salaries.
-30.0%
-20.0%
-10.0%
0.0%
10.0%
20.0%
Av
era
ge
Pe
rce
nt
Ch
an
ge
, a
dju
ste
d f
or
infl
ati
on
Chart 4a. Average County Level Percent Change in Net Profits Income ($) in 2007 Dollars
More than 90Marcellus wells
10 to 89Marcellus wells
1 to 9 Marcelluswells
No Marcelluswells
Marcellus Shale & Local Economic Activity: What the 2012 Pennsylvania State Tax Data Say
Center for Economic & Community Development http://aese.psu.edu/research/centers/cecd 11
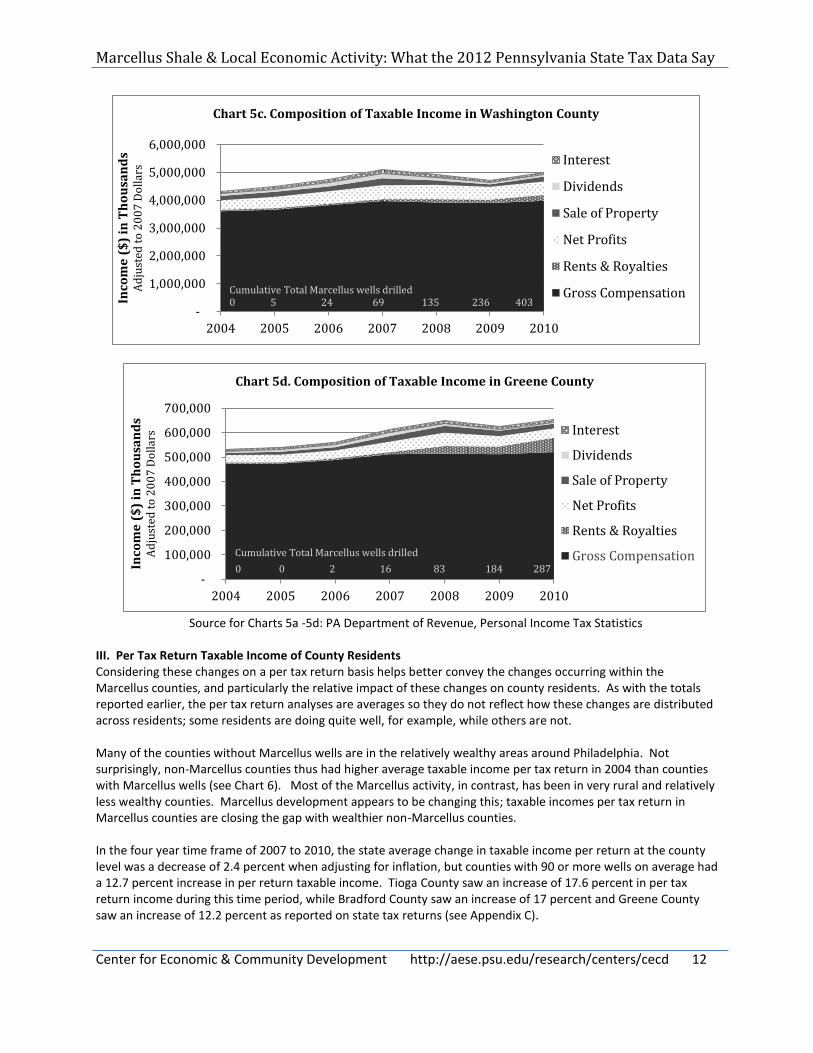
The same pattern of growth in income from rents, royalties, patents and copyrights can be seen in Tioga, Washington and Greene County (see Charts 5b, 5c, and 5d). As the number of Marcellus wells increased within a county, the proportion of income from rents, royalties, patents and copyrights income also increased. The change was less dramatic in Washington County, likely due to its much larger economy and population and potentially because a larger share of its mineral rights are not owned by local residents due to past mineral and gas activity.
-
200,000
400,000
600,000
800,000
1,000,000
1,200,000
1,400,000
2004 2005 2006 2007 2008 2009 2010
Inco
me
($
) in
Th
ou
san
ds
Ad
just
ed t
o 2
00
7 D
oll
ars
Chart 5a. Composition of Taxable Income in Bradford County
Interest
Dividends
Sale of Property
Net Profits
Rents & Royalties
Gross Compensation
-
100,000
200,000
300,000
400,000
500,000
600,000
700,000
800,000
2004 2005 2006 2007 2008 2009 2010
Inco
me
($
) in
Th
ou
san
ds
Ad
just
ed t
o 2
00
7 D
oll
ars
Chart 5b. Composition of Taxable Income in Tioga County
Marcellus Shale & Local Economic Activity: What the 2012 Pennsylvania State Tax Data Say
Center for Economic & Community Development http://aese.psu.edu/research/centers/cecd 12
Source for Charts 5a -5d: PA Department of Revenue, Personal Income Tax Statistics
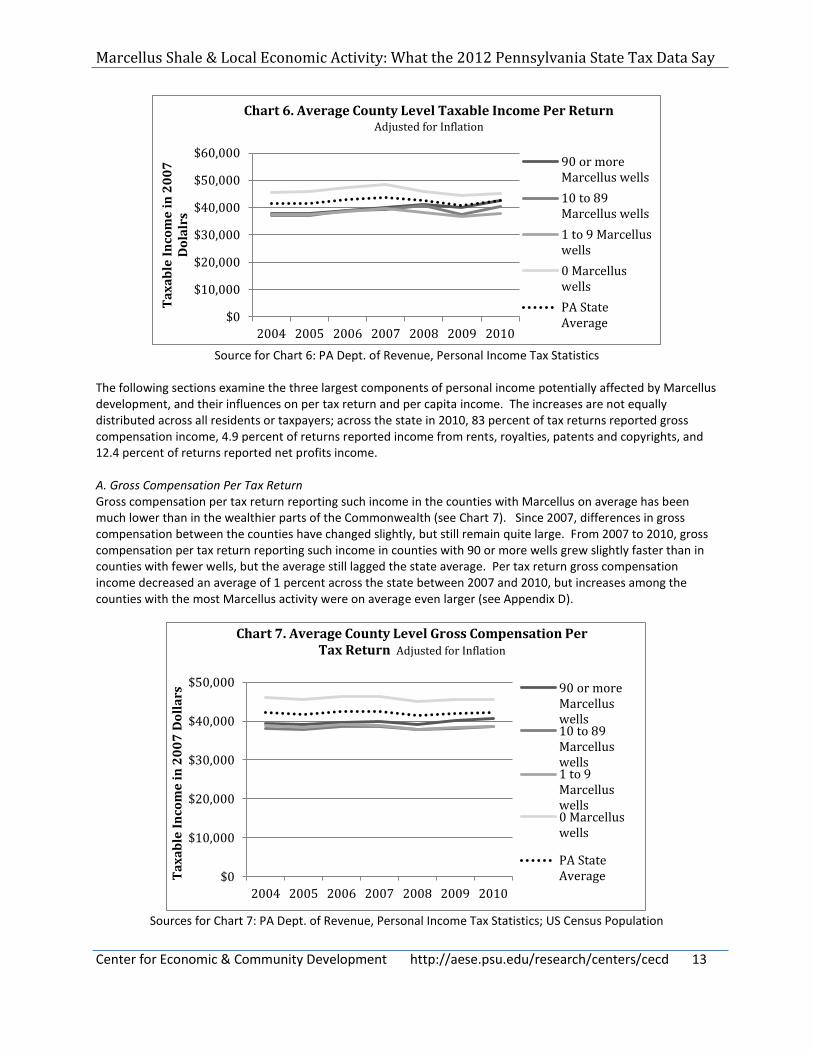
III. Per Tax Return Taxable Income of County Residents Considering these changes on a per tax return basis helps better convey the changes occurring within the Marcellus counties, and particularly the relative impact of these changes on county residents. As with the totals reported earlier, the per tax return analyses are averages so they do not reflect how these changes are distributed across residents; some residents are doing quite well, for example, while others are not. Many of the counties without Marcellus wells are in the relatively wealthy areas around Philadelphia. Not surprisingly, non-Marcellus counties thus had higher average taxable income per tax return in 2004 than counties with Marcellus wells (see Chart 6). Most of the Marcellus activity, in contrast, has been in very rural and relatively less wealthy counties. Marcellus development appears to be changing this; taxable incomes per tax return in Marcellus counties are closing the gap with wealthier non-Marcellus counties. In the four year time frame of 2007 to 2010, the state average change in taxable income per return at the county level was a decrease of 2.4 percent when adjusting for inflation, but counties with 90 or more wells on average had a 12.7 percent increase in per return taxable income. Tioga County saw an increase of 17.6 percent in per tax return income during this time period, while Bradford County saw an increase of 17 percent and Greene County saw an increase of 12.2 percent as reported on state tax returns (see Appendix C).
-
1,000,000
2,000,000
3,000,000
4,000,000
5,000,000
6,000,000
2004 2005 2006 2007 2008 2009 2010
Inco
me
($
) in
Th
ou
san
ds
Ad
just
ed t
o 2
00
7 D
oll
ars
Chart 5c. Composition of Taxable Income in Washington County
Interest
Dividends
Sale of Property
Net Profits
Rents & Royalties
Gross Compensation
-
100,000
200,000
300,000
400,000
500,000
600,000
700,000
2004 2005 2006 2007 2008 2009 2010
Inco
me
($
) in
Th
ou
san
ds
Ad
just
ed t
o 2
00
7 D
oll
ars
Chart 5d. Composition of Taxable Income in Greene County
Marcellus Shale & Local Economic Activity: What the 2012 Pennsylvania State Tax Data Say
Center for Economic & Community Development http://aese.psu.edu/research/centers/cecd 13
Source for Chart 6: PA Dept. of Revenue, Personal Income Tax Statistics
The following sections examine the three largest components of personal income potentially affected by Marcellus development, and their influences on per tax return and per capita income. The increases are not equally distributed across all residents or taxpayers; across the state in 2010, 83 percent of tax returns reported gross compensation income, 4.9 percent of returns reported income from rents, royalties, patents and copyrights, and 12.4 percent of returns reported net profits income. A. Gross Compensation Per Tax Return Gross compensation per tax return reporting such income in the counties with Marcellus on average has been much lower than in the wealthier parts of the Commonwealth (see Chart 7). Since 2007, differences in gross compensation between the counties have changed slightly, but still remain quite large. From 2007 to 2010, gross compensation per tax return reporting such income in counties with 90 or more wells grew slightly faster than in counties with fewer wells, but the average still lagged the state average. Per tax return gross compensation income decreased an average of 1 percent across the state between 2007 and 2010, but increases among the counties with the most Marcellus activity were on average even larger (see Appendix D).
Sources for Chart 7: PA Dept. of Revenue, Personal Income Tax Statistics; US Census Population
$0
$10,000
$20,000
$30,000
$40,000
$50,000
$60,000
2004 2005 2006 2007 2008 2009 2010
Ta
xa
ble
In
com
e i
n 2
00
7
Do
lalr
s
Chart 6. Average County Level Taxable Income Per Return Adjusted for Inflation
90 or moreMarcellus wells
10 to 89Marcellus wells
1 to 9 Marcelluswells
0 Marcelluswells
PA StateAverage
$0
$10,000
$20,000
$30,000
$40,000
$50,000
2004 2005 2006 2007 2008 2009 2010
Ta
xa
ble
In
com
e i
n 2
00
7 D
oll
ars
Chart 7. Average County Level Gross Compensation Per Tax Return Adjusted for Inflation
90 or moreMarcelluswells10 to 89Marcelluswells1 to 9Marcelluswells0 Marcelluswells
PA StateAverage
Marcellus Shale & Local Economic Activity: What the 2012 Pennsylvania State Tax Data Say
Center for Economic & Community Development http://aese.psu.edu/research/centers/cecd 14
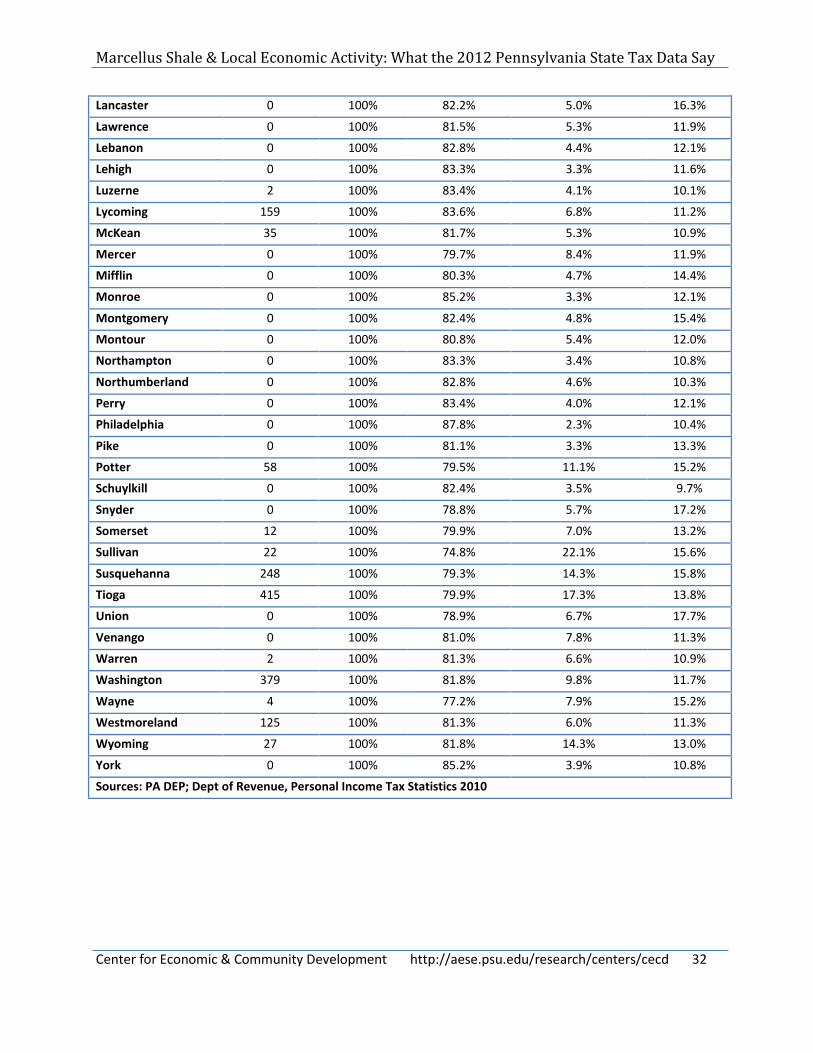
B. Rents, Royalties, Patents, and Copyrights Per Tax Return In contrast, counties with much Marcellus activity on average are experiencing major increases in per tax return Rents, Royalties, Patents and Copyrights income, a result of leasing and royalty payments to mineral rights owners (see Chart 8). Such increases account for much of why per tax return taxable incomes in counties with Marcellus activity are approaching the higher incomes of wealthier counties without Marcellus activity. These average per return income increases are greatest in counties with the most Marcellus wells, substantially increasing since the boom in development began in 2007. The data indicates that in 2010, annual leasing and royalty income in the highest drilling activity counties was $26,537 per tax return reporting such income (inflation adjusted to 2007 dollars). This varied from an average of $30,266 per tax return reporting such income in Bradford County, to $48,287 per tax return in Susquehanna County and $36,810 per tax return in Greene County (see Appendix E). These numbers are very large and show that some residents of the Marcellus counties are receiving substantially higher incomes from lease and royalty dollars. However, the portion of each county’s population receiving this income is rather small. For example, just 4.9 percent of tax returns filed in Pennsylvania in 2010 reported receiving income from rents, royalties, patents and copyrights (see Appendix G). In Bradford County, 19.2 percent of tax returns filed reported receiving income of this type, as did 14.3 percent of tax returns in Susquehanna County and 10.9 percent in Greene County.
Sources for Chart 8: PA Dept. of Revenue, Personal Income Tax Statistics, US Census Population
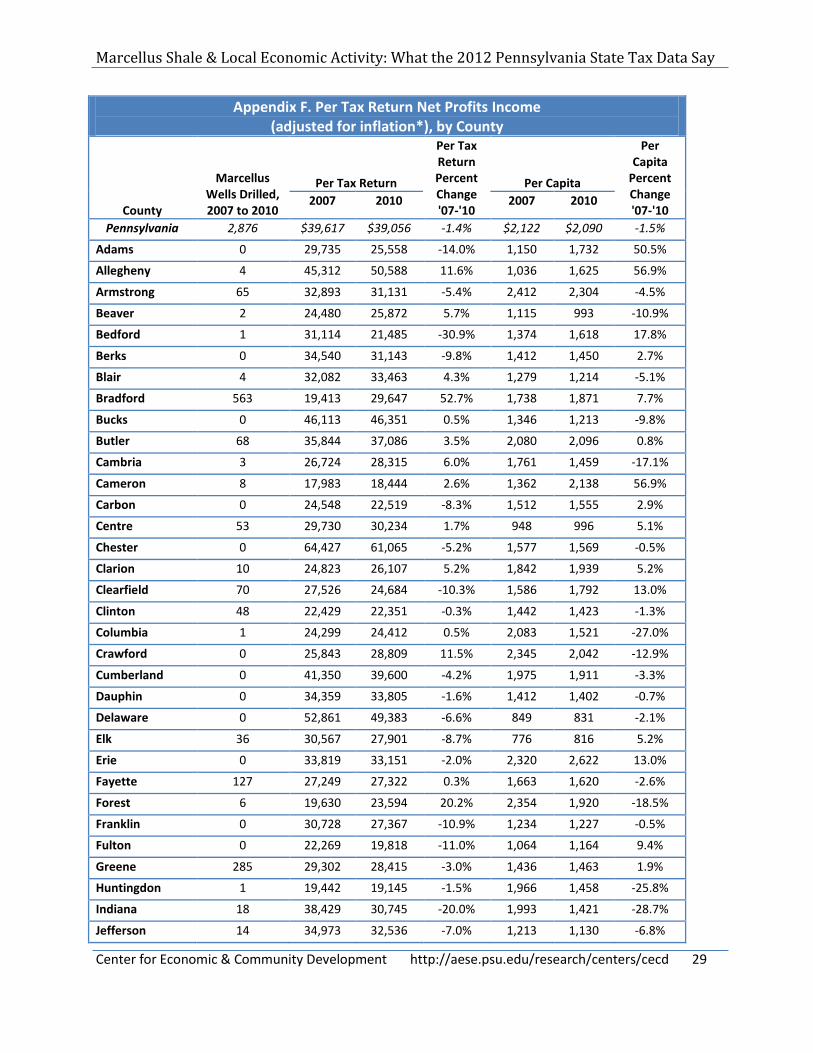
C. Net Profits Per Tax Return Changes in net profits income per tax return reporting such income also help to explain the increase in total taxable income in Marcellus counties. Average increases in per return net profits income in counties with 10 or more wells are much larger than increases in counties with 9 or fewer or no Marcellus wells (see Chart 9). In counties with 90 or more Marcellus wells, per tax return net profits income increased from $25,345 in 2004 to $30,693 in 2010, a 21 percent increase (inflation adjusted to 2007 dollars). In those same counties per capita net profits income increased from $1,254 in 2004 to $1,600 in 2010, a 27.6 percent increase (see Appendix F).
$0
$5,000
$10,000
$15,000
$20,000
$25,000
$30,000
2004 2005 2006 2007 2008 2009 2010Ta
xa
ble
In
com
e i
n 2
00
7 D
oll
ars
Chart 8. Average County Level Rents, Royalties, Patents &
Copyrights Per Tax Return Adjusted for Inflation
90 or moreMarcellus wells
10 to 89Marcellus wells
1 to 9Marcellus wells
0 Marcelluswells
PA StateAverage
Marcellus Shale & Local Economic Activity: What the 2012 Pennsylvania State Tax Data Say
Center for Economic & Community Development http://aese.psu.edu/research/centers/cecd 15
Sources for Chart 9: PA Dept. of Revenue, Personal Income Tax Statistics; US Census 2010 Population
IV. Local Retail Sale Activity (State Sales Tax Collections) Sales Tax collections are a marker of the level of retail activity occurring within a county. Higher local retail sales mean more state sales tax collections, while declining local retail sales mean lower collections (though changes in sales tax collections don’t perfectly track retail sales because food and clothing are excluded from the tax). The state sales tax data indicate collections in counties with high Marcellus activity on average outperformed collections in counties with less or no Marcellus activity. State collections in counties with 150 or more Marcellus wells drilled between July 1, 2007, and June 30, 2012, for example, experienced an average increase of 26.9 percent (see Table 6) compared to an average decrease of 12.6 percent in counties with no Marcellus activity during this same time period. This indicates that counties with much Marcellus activity on average are experiencing large increases in retail activity. The increases between 2007 and 2012 were particularly dramatic in several counties; Sales Tax collections in Greene County increased 111.6 percent, collections in Bradford County increased 55.9 percent, and collections in Susquehanna County increased 30.4 percent when adjusting for inflation during this time period (see Appendix H). While not all counties with Marcellus activity experienced such large increases in retail activity, these counties with Marcellus activity on average greatly outperformed the counties without Marcellus activity. Of the 29 counties in 2012 without Marcellus activity, all but one experienced decreases in state Sales Tax collections.
Table 6. Average Change in State Sales Tax Collections, by Marcellus Activity
Level of Marcellus Activity in County
Percent Change (inflation adjusted) (number of counties at level of Marcellus activity
July 1, 2007 to June 30, 2010
July 1, 2007 to June 30, 2011
July 1, 2007 to June 30, 2012
150 or more Marcellus wells 7.6% (5) 17.8% (6) 26.9% (8)
No Marcellus wells -10.9% (36) -9.7% (30) -12.6% (29)
State Average at the County Level -7% (67) -3.7% (67) -2.4% (67)
Sources: PA DEP; PA Dept. of Revenue, Tax Compendium
$0
$5,000
$10,000
$15,000
$20,000
$25,000
$30,000
$35,000
2004 2005 2006 2007 2008 2009 2010
Ta
xa
ble
In
com
e i
n 2
00
7 D
oll
ars
Chart 9. Average County Level Net Profits Per Tax Return Adjusted for Inflation
90 or moreMarcellus wells
10 to 89Marcellus wells
1 to 9 Marcelluswells
0 Marcelluswells
PA State Average
Marcellus Shale & Local Economic Activity: What the 2012 Pennsylvania State Tax Data Say
Center for Economic & Community Development http://aese.psu.edu/research/centers/cecd 16
Chart 10 shows the increase in Sales Tax collections in counties with 150 or more Marcellus wells over time and the comparison to Sales Tax collections in other counties with fewer or no Marcellus wells. Since the growth in drilling Marcellus wells began in 2007, state sales tax collections in counties with 150 or more wells on average have been steadily experiencing an increase. Patterns for counties with less than 149 wells or no Marcellus wells are less clear. However, since 2007 counties with Marcellus wells on average have seen greater increases or smaller decreases in Sales Tax collections than counties with no Marcellus wells. The large increase in Sales Tax collections in counties with much Marcellus activity indicates an increase in retail sales in those counties. This data suggests that greater Marcellus activity has a positive effect on retail spending in Pennsylvania counties. Prior to the boom in Marcellus development in 2007, state sales tax collections in counties with no Marcellus wells on average grew faster than in counties with 150 or more wells. Since the onset of drilling, this has switched, with state collections in counties with 150 or more wells growing much faster than in those with no wells.
Source for Chart 10: PA Dept. of Revenue, Tax Compendium
V. Realty Transfer Tax Collections Pennsylvania’s Realty Transfer Tax is a one percent tax on the sale of real estate (many municipal governments and school districts also levy a local realty transfer tax). Changes in Realty Transfer Tax collections result from changes in the average value of sold properties, changes in the number of sales, or a combination of both. State Realty Transfer Tax collections in counties with 150 or more wells on average increased 26.5 percent between 2007 and 2012 when adjusting for inflation, compared to an average 35.2 percent decline in counties with no Marcellus drilling (see Table 7). The large increase observed between 2007 and 2012 in counties with 150 or more wells is exaggerated by the large increase within Greene County in the most recent fiscal year. Greene County, with 447 Marcellus wells as of June 2012, experienced a Realty Transfer Tax increase of 192.3 percent between June 2007 and July 2012, which was far above the increase of all other counties in that group
1. The
average change in state Realty Transfer Tax collections among counties with 150 or more wells is 2.9 percent if not including collections in Greene County, which is still a much better performance than seen in counties with fewer or no Marcellus wells.
1 A phone call to a representative of the Recorder of Deeds Office in Greene County explained that this increase is
a result of large transfers of mineral rights, the creation of transportation lines, and the increasing value of real estate in the county.
-10.0%
-5.0%
0.0%
5.0%
10.0%
15.0%
2004-2005to
2005-2006
2005-2006to
2006-2007
2006-2007to
2007-2008
2007-2008to
2008-2009
2008-2009to
2009-2010
2009-2010to
2010-2011
2010-2011to
2011-2012
Chart 10. Average County Level Annual Percent Change in Sales Tax Collections, by Marcellus Activity (inflation adjusted)
150 or moreMarcellus wells
10 to 149Marcellus wells
1 to 9 Marcelluswells
No Marcelluswells
Marcellus Shale & Local Economic Activity: What the 2012 Pennsylvania State Tax Data Say
Center for Economic & Community Development http://aese.psu.edu/research/centers/cecd 17
Table 7. Average Change in State Realty Transfer Tax Collections, by Marcellus Activity
Level of Marcellus Activity in County
Percent Change (number of counties at level of Marcellus activity
July 1, 2007 to June 30, 2010
July 1, 2007 to June 30, 2011
July 1, 2007 to June 30, 2012
150 or more Marcellus wells -17.4% (5) -0.8% (6) 26.5% (8)
No Marcellus wells -30.6% (36) -37.8% (30) -35.2% (29)
State Average at the county level -24.7% (67) -26.6% (67) -22.4% (67)
Sources: PA DEP; PA Dept. of Revenue, Tax Compendium
Chart 11 shows changes in Realty Transfer Tax collections over time. On average, all four groups of counties saw large declines in Realty Transfer Tax collections between fiscal years 2007-2008 to 2008-2009, although counties with 10 or more Marcellus wells on average experienced a smaller decline than counties with less wells or none at all (21.6 percent decrease and 29.3 percent decrease, respectively). Counties with no Marcellus wells did not experience positive changes in Realty Transfer Tax collections until two years after other counties with Marcellus wells. Since fiscal year 2008 to 2009, state collections in counties with 150 or more wells have seen a steady increase in Realty Transfer Tax collections. This means that the counties with much drilling activity on average saw large increases in either real estate sales activity, real estate prices paid, or a combination of both during that year.
Source for Chart 11: PA Dept. of Revenue, Tax Compendium
VI. Implications The Pennsylvania Department of Revenue data show major tax collection patterns associated with Marcellus Shale development. Counties with much Marcellus Shale drilling activity witnessed, on average, much larger percentage increases in residents’ personal income. In addition, they had faster growth in state sales tax collections, and smaller declines in realty transfer tax collections than did other Pennsylvania counties. The 21.6 percent increase in total taxable income between 2007 to 2010 in Tioga County is remarkable, as is the 20.5 percent increase in Sullivan County and 19.1 percent increase in Bradford County, particularly when statewide taxable income fell an average of 2 percent during this same time period. The data demonstrate that major economic benefits from Marcellus shale development are going to local residents, regardless of the presence of ‘non-local’ workers.
-40.0%
-30.0%
-20.0%
-10.0%
0.0%
10.0%
20.0%
30.0%
40.0%
2004-2005to
2005-2006
2005-2006to
2006-2007
2006-2007to
2007-2008
2007-2008to
2008-2009
2008-2009to
2009-2010
2009-2010to
2010-2011
2010-2011to
2011-2012
Chart 11. Average County Level Percent Change in Realty Transfer Tax Collections, by Marcellus Activity (inflation adjusted)
150 or moreMarcellus wells
10 to 149Marcellus wells
1 to 9 Marcelluswells
No Marcelluswells
Marcellus Shale & Local Economic Activity: What the 2012 Pennsylvania State Tax Data Say
Center for Economic & Community Development http://aese.psu.edu/research/centers/cecd 18
There were differences between the types of taxable income. Income increases typically were proportionally the largest for mineral right owners, and the second largest for local business owners. While there were important increases in gross compensation for workers, these tended to be much lower than the increases experienced by the other taxpayers, both proportionally and in real numbers, which may reflect the presence of non-resident who take their wages out of the county. It is also important to note that in the high drilling activity counties, wages and salaries (represented by Gross Compensation Tax data) are increasing faster than total employment of county residents. In other words, it would suggest that much of the employment effect for local residents from Marcellus work is either higher wages or more hours worked for existing workers, rather than new hiring. The proportionally large increases in rents, royalties, patents, and copyrights income indicate that much of the local economic benefit of Marcellus activity is going to residents who own the mineral rights. Increases in this income tended to be much larger in the northeast region of the Commonwealth than in the southwest. This likely reflects the major prior history of mineral and oil and gas development in the southwest, and the resulting severing of mineral and surface rights. The increases in sales tax collections are particularly important, because they indicate that Marcellus development is very positively affecting the local retail sector. The increases in Sales Tax in several counties between 2007 and 2012, particularly Bradford (55.9 percent) and Greene (111.6 percent) are especially remarkable. The slight decline in number of residents reporting Net Profits income suggest that although many of the Marcellus counties are experiencing increased retail spending, the spending is occurring over fewer locally owned businesses . Those retail businesses that are surviving, however, are likely seeing increased spending and experiencing greater incomes because of this. It is important to note that this analysis finds correlations between Marcellus shale activity and local economic activity; it does not prove that Marcellus shale activity was the cause of these economic changes. There was wide variation between counties within the same levels of drilling activity, so the experience of any individual county is different from the averages. Economic activity in these counties is affected by a wide variety of factors, in addition to Marcellus shale, so drilling by itself cannot fully explain all the changes and differences between counties. Yet the cross-tab analysis does convey general trends and influences associated with Marcellus development. Because the state data was compiled at the county level, we were unable to examine how the economic benefits are distributed across residents within counties. Per capita analysis can hide important differences in the experience between taxpayers. Evidence suggests that major differences exist, such as between large landowners and low income residents who rent (see, for example, Kelsey, Metcalf and Salcedo, 2012). This analysis still only reflects the early stages of natural gas drilling and does not include the cost impacts of Marcellus development, such as on the local cost-of-living or the environment. It also does not consider the impact of Marcellus development on local government and school district tax collections, since royalty and leasing income is exempt from the local earned income tax, and local jurisdictions cannot levy sales taxes. There has been much discussion about the local benefits of Marcellus shale development to Pennsylvania residents and debate about the benefits going to non-Pennsylvania residents. The analysis in this report shows that regardless of benefits going to non-Pennsylvanians, residents in counties with much Marcellus activity on average are receiving economic benefits from the shale development, with taxable incomes on average rising faster than in counties without the development.
Marcellus Shale & Local Economic Activity: What the 2012 Pennsylvania State Tax Data Say
Center for Economic & Community Development http://aese.psu.edu/research/centers/cecd 19
Written by Kirsten Hardy and Timothy W. Kelsey, Ph.D. The authors are an undergraduate student in Penn State’s Community, Environment and Development program, and a Professor of Agricultural Economics, at The Pennsylvania State University. No external funding was used for this research. References and Data Sources: Costanzo, Charles, and Timothy W. Kelsey. “Marcellus Shale and Local Collection of State Taxes: What the 2011 Pennsylvania Tax Data Say.” Cooperative Extension, The Pennsylvania State University, 2011. Costanzo, Charles, and Timothy W. Kelsey. “State Tax Implications of Marcellus Shale: What the Pennsylvania Data Say in 2010.” Cooperative Extension, The Pennsylvania State University, 2011. Jacobson, Michael, and Timothy W. Kelsey. “Impacts of Marcellus Shale Development on Municipal Governments in Susquehanna and Washington Counties, 2010.” Cooperative Extension, The Pennsylvania State University. 2011. Kelsey, Timothy W., Riley Adams, and Scott Milchak. “Real Property Tax Base, Market Values, and Marcellus Shale: 2007 to 2009. Center for Economic and Community Development White Paper Series. University Park, PA: Penn State University. 2012. Kelsey, Timothy W., William Hartman, Kai A. Schafft, Yetkin Borlu, and Charles Costanzo. “Marcellus Shale Gas Development and Pennsylvania School Districts: What Are the Implications for School Expenditures and Tax Revenues?” Cooperative Extension, The Pennsylvania State University. 2012. Kelsey, Timothy W., Alex Metcalf, and Rodrigo Salcedo. “Marcellus Shale: Land Ownership, Local Voice, and the Distribution of Lease and Royalty Dollars.” Center for Economic and Community Development White Paper Series. University Park, PA: Penn State University. 2012. Kelsey, Timothy W., and Melissa M. Ward. “Natural Gas Drilling Effects on Municipal Governments Throughout Pennsylvania’s Marcellus Shale Region, 2010.” Cooperative Extension, The Pennsylvania State University. 2011. Pennsylvania Department of Environmental Protection. Office of Oil and Gas Management. Spud Report 2004-2013. Downloaded January 17, 2013. http://www.depreportingservices.state.pa.us/ReportServer/Pages/ReportViewer.aspx?%2fOil_Gas%2fSpud_External_Data
Pennsylvania Department of Revenue. “Tax Compendium.” 2007-08; through 2010-2012. http://www.portal.state.pa.us/portal/server.pt/community/reports_and_statistics/17303/tax_compendium/602434 Pennsylvania Department of Revenue. “Personal Income Statistics.” 2007, 2008, 2009, and 2010. http://www.portal.state.pa.us/portal/server.pt/community/personal_income_tax_statistics/14832
Source: PA DEP; PA Dept. of Revenue, Personal Income Tax statistics 2007-2010; US Census Pennsylvania Quickfacts 2010. *Inflation adjusted to 2007 dollars
Marcellus Shale & Local Economic Activity: What the 2012 Pennsylvania State Tax Data Say
Center for Economic & Community Development http://aese.psu.edu/research/centers/cecd 25
Appendix D. Per Tax Return Gross Compensation Income (adjusted for inflation*), by County
County
Marcellus Wells Drilled, 2007 to 2010 Per Tax Return
Sources: PA DEP; PA Dept. of Revenue, Personal Income Tax Statistics 2007-2010; US Census Pennsylvania Quickfacts 2010. *Inflation adjusted to 2007 dollars
Marcellus Shale & Local Economic Activity: What the 2012 Pennsylvania State Tax Data Say
Center for Economic & Community Development http://aese.psu.edu/research/centers/cecd 27
Appendix E. Per Tax Return Rents, Royalties, Patents & Copyrights Income (adjusted for inflation*), by County
County
Marcellus Wells Drilled, 2007 to 2010
Per Tax Return
Per Tax Return Percent Change '07-'10
Per Capita
Per Capita Percent Change '07-'10 2007 2010 2007 2010
Sources: PA DEP; PA Dept. of Revenue Personal Income Tax Statistics 2007-2010; US Census Pennsylvania Quickfacts 2010. *Inflation adjusted to 2007 dollars
Marcellus Shale & Local Economic Activity: What the 2012 Pennsylvania State Tax Data Say
Center for Economic & Community Development http://aese.psu.edu/research/centers/cecd 29
Appendix F. Per Tax Return Net Profits Income (adjusted for inflation*), by County
Sources: PA DEP; PA Dept. of Revenue Personal Income Tax Statistics 2007-2010; US Census Pennsylvania Quickfacts 2010. *Inflation adjusted to 2007 dollars
Marcellus Shale & Local Economic Activity: What the 2012 Pennsylvania State Tax Data Say
Center for Economic & Community Development http://aese.psu.edu/research/centers/cecd 31
Appendix G. Proportion of Tax Returns Reporting Specific Types of Taxable Income, 2010
County
Marcellus Wells Drilled, 2007 - 2010
Total Taxable Income
Gross Compensation
Rents, Royalties, Patents & Copyrights Net Profits
Pennsylvania 2,876 100% 83.3% 4.9% 12.4%
Adams 0 100% 84.1% 4.9% 12.1%
Allegheny 4 100% 83.2% 4.2% 11.5%
Armstrong 65 100% 80.2% 11.0% 10.4%
Beaver 2 100% 83.4% 4.3% 9.9%
Bedford 1 100% 81.4% 6.1% 15.2%
Berks 0 100% 83.5% 3.5% 11.6%
Blair 4 100% 83.6% 5.1% 11.2%
Bradford 563 100% 81.3% 19.2% 13.5%
Bucks 0 100% 83.2% 4.1% 15.2%
Butler 68 100% 83.2% 6.6% 12.3%
Cambria 3 100% 80.1% 4.5% 10.0%
Cameron 8 100% 80.2% 5.5% 10.0%
Carbon 0 100% 82.5% 3.4% 9.7%
Centre 53 100% 83.8% 6.0% 14.6%
Chester 0 100% 84.0% 4.7% 15.7%
Clarion 10 100% 80.4% 12.0% 13.0%
Clearfield 70 100% 82.5% 8.0% 11.6%
Clinton 48 100% 83.6% 4.9% 11.3%
Columbia 1 100% 82.7% 6.4% 11.2%
Crawford 0 100% 80.5% 11.2% 14.8%
Cumberland 0 100% 82.1% 4.2% 11.8%
Dauphin 0 100% 85.7% 3.0% 10.1%
Delaware 0 100% 83.3% 3.8% 13.7%
Elk 36 100% 81.9% 5.8% 11.4%
Erie 0 100% 84.0% 5.1% 10.9%
Fayette 127 100% 82.6% 7.3% 10.2%
Forest 6 100% 76.5% 6.9% 11.9%
Franklin 0 100% 81.9% 4.8% 12.2%
Fulton 0 100% 82.4% 6.0% 13.2%
Greene 285 100% 83.4% 10.9% 9.3%
Huntingdon 1 100% 82.4% 5.2% 13.0%
Indiana 18 100% 79.5% 12.3% 12.5%
Jefferson 14 100% 79.6% 11.6% 13.6%
Juniata 0 100% 78.0% 5.9% 17.2%
Lackawanna 1 100% 84.0% 4.4% 10.9%
Marcellus Shale & Local Economic Activity: What the 2012 Pennsylvania State Tax Data Say
Center for Economic & Community Development http://aese.psu.edu/research/centers/cecd 32
Lancaster 0 100% 82.2% 5.0% 16.3%
Lawrence 0 100% 81.5% 5.3% 11.9%
Lebanon 0 100% 82.8% 4.4% 12.1%
Lehigh 0 100% 83.3% 3.3% 11.6%
Luzerne 2 100% 83.4% 4.1% 10.1%
Lycoming 159 100% 83.6% 6.8% 11.2%
McKean 35 100% 81.7% 5.3% 10.9%
Mercer 0 100% 79.7% 8.4% 11.9%
Mifflin 0 100% 80.3% 4.7% 14.4%
Monroe 0 100% 85.2% 3.3% 12.1%
Montgomery 0 100% 82.4% 4.8% 15.4%
Montour 0 100% 80.8% 5.4% 12.0%
Northampton 0 100% 83.3% 3.4% 10.8%
Northumberland 0 100% 82.8% 4.6% 10.3%
Perry 0 100% 83.4% 4.0% 12.1%
Philadelphia 0 100% 87.8% 2.3% 10.4%
Pike 0 100% 81.1% 3.3% 13.3%
Potter 58 100% 79.5% 11.1% 15.2%
Schuylkill 0 100% 82.4% 3.5% 9.7%
Snyder 0 100% 78.8% 5.7% 17.2%
Somerset 12 100% 79.9% 7.0% 13.2%
Sullivan 22 100% 74.8% 22.1% 15.6%
Susquehanna 248 100% 79.3% 14.3% 15.8%
Tioga 415 100% 79.9% 17.3% 13.8%
Union 0 100% 78.9% 6.7% 17.7%
Venango 0 100% 81.0% 7.8% 11.3%
Warren 2 100% 81.3% 6.6% 10.9%
Washington 379 100% 81.8% 9.8% 11.7%
Wayne 4 100% 77.2% 7.9% 15.2%
Westmoreland 125 100% 81.3% 6.0% 11.3%
Wyoming 27 100% 81.8% 14.3% 13.0%
York 0 100% 85.2% 3.9% 10.8%
Sources: PA DEP; Dept of Revenue, Personal Income Tax Statistics 2010
Marcellus Shale & Local Economic Activity: What the 2012 Pennsylvania State Tax Data Say
Center for Economic & Community Development http://aese.psu.edu/research/centers/cecd 33
Appendix H. Local Collections of Sales Tax and Realty Transfer Tax (adjusted for inflation*), 2007 and 2012
Sources: PA DEP; PA Department of Revenue, Tax Compendium 2007 and 2010. *Inflation adjusted to 2007 dollars
Marcellus Shale & Local Economic Activity: What the 2012 Pennsylvania State Tax Data Say
Center for Economic & Community Development http://aese.psu.edu/research/centers/cecd 35
This publication is available in alternative media on request. The Pennsylvania State University is committed to the policy that all persons shall have equal access to programs, facilities, admission, and employment without regard to personal characteristics not related to ability, performance, or qualifications as determined by University policy or by state or federal authorities. It is the policy of the University to maintain an academic and work environment free of discrimination, including harassment. The Pennsylvania State University prohibits discrimination and harassment against any person because of age, ancestry, color, disability or handicap, genetic information, national origin, race, religious creed, sex, sexual orientation, gender identity, or veteran status and retaliation due to the reporting of discrimination or harassment. Discrimination, harassment, or retaliation against faculty, staff, or students will not be tolerated at The Pennsylvania State University. Direct all inquiries regarding the nondiscrimination policy to the Affirmative Action Director, The Pennsylvania State University, 328 Boucke Building, University Park, PA 16802-5901; Tel 814-865-4700/V, 814-863-0471/TTY.