March 28, 2012 Initiating Coverage ICICI Securities Ltd | Retail Equity Research The Behemoth… Larsen & Toubro‘s (L&T) ability to increase its order backlog consistently despite a weak investment cycle (42% YoY growth during last crisis phase of FY10 and 27% as on 9MFY12) showcases the company’s robust fundamentals. A diverse presence across segments and geographies, a strong balance sheet, reliability in execution and ability to monetise the revival in investment cycle ensure that L&T is well placed to meet its FY12E revenue guidance of 25% YoY in an environment where its peers are facing declining order backlog and volatility in earnings. Coupled with this, value unlocking in subsidiaries, would offer huge upside potential as L&T has invested about | 7400 crore in various strategic subsidiaries, which have the capability to provide huge back ended IRRs on equity. We believe L&T remains the preferred bet in the capital goods space. We advise buying the stock on steep declines as a huge run up will cap upside in the short-term. Best placed to weather capex cycle downs and monetise the ups... The investment cycle is going through a turbulent phase as capex decisions are moving at a snails pace. However, we believe L&T has done a commendable job in maintaining a flattish order inflow for 9MFY12 on a high base (we have built in ~8% decline in FY12E order inflows). L&T commands a robust book-to-bill ratio of 2.9x as of Q3FY12. Therefore, this lends credence to our assumptions that L&T will be able to meet its FY12E revenue target. We have been a tad conservative on the assumptions and have modelled in 23% YoY revenue growth for FY12E. Going ahead, given the decline that L&T has witnessed in order inflows, we believe the company can still achieve ~17% and 10% CAGR in revenues and PAT over FY11-14E, respectively. Subsidiaries: Storehouse of tremendous potential… L&T invested | 7400 crore into various subsidiaries spanning across various sectors and segments. Investments in subsidiaries have grown at a CAGR of 43% (low base) over FY08-11. Going ahead, as various projects near their completion phase, we expect investments to grow at 20% CAGR over FY11-14E to | 13063 crore. Reaching a critical mass level (revenues) would trigger value unlocking. The process has taken off gradually as L&T Finance Holdings came out with an IPO in FY12. Valuations We have valued L&T on a sum of the parts methodology and arrived at a fair value of | 1473/share in our base case scenario. The base business remains the key contributor to valuations (~80%). Going ahead, a re- rating/decline of P/E will be highly dependent on the order inflow outlook in FY13E, which, in turn, will drive valuations. Also, listing of any subsidiary can provide further impetus to value creation. Initiate with Hold Exhibit 1: Valuation Metrics (Standalone) (Year-end March) FY10 FY11 FY12E FY13E FY14E Net Sales (| crore) 36,675.2 43,495.9 53,799.6 59,568.7 69,236.1 EBITDA (| crore) 4,739.4 5,598.1 6,026.8 6,974.6 7,875.4 Net Profit (| crore) 4,417.1 4,006.8 4,269.9 4,675.6 5,302.9 EPS (|) 73.4 65.8 70.1 76.8 87.1 P/E (x) 18.0 20.1 18.8 17.2 15.2 Price / Book (x) 4.3 3.7 3.2 2.8 2.4 RoCE 17.5 17.5 15.4 15.7 15.8 RoE 24.1 18.3 17.0 16.3 16.1 Source: Company, ICICIdirect.com Research Larsen & Toubro (LARTOU) | 1320 Rating Matrix Rating : Hold Target : | 1470 Target Period : 12-15 months Potential Upside : 11% YoY Growth (%) (YoY Growth) FY11 FY12E FY13E FY14E Net Sales 18.6 23.7 10.7 16.2 EBITDA 18.1 7.7 15.7 12.9 Net Profit (9.3) 6.6 9.5 13.4 EPS (Rs) (10.3) 6.6 9.5 13.4 Current & target multiple FY11 FY12E FY13E FY14E P/E 20.1 18.8 17.2 15.2 Target P/E 18.7 17.5 16.0 14.1 EV / EBITDA 15.3 14.4 12.2 10.6 Target EV / EBITDA 14.3 13.4 11.4 9.9 Price to Book Value 3.7 3.2 2.8 2.4 Stock Data Bloomberg/Reuters Code LT IN EQUITY/ LART.NS Sensex 17,361.7 Average volumes 2,436,007 Market Cap (Rs crore) 80,368.2 EV | 86606.8 Crore 52 week H/L 1863 / 978 Equity Capital (Rs crore) 121.8 Promoter's Stake (%) - FII Holding (%) 13.8 DII Holding (%) 37.8 Comparative return matrix Return % 1M 3M 6M 12M Larsen & Toubro Ltd (8.9) 29.1 (13.1) (14.7) GMR 1.2 47.1 3.0 (21.3) Thermax Ltd (10.6) 20.2 (2.1) (16.1) Crompton Greaves (8.5) 17.2 (8.2) (48.3) Price movement 0 500 1,000 1,500 2,000 2,500 Mar-12 Jun-11 Aug-10 Oct-09 Dec-08 Feb-08 May-07 (|) 0 1,000 2,000 3,000 4,000 5,000 6,000 7,000 (Index) Price (R.H.S) Nifty (L.H.S) Analyst’s name Chirag Shah [email protected]Sonabh Bubna [email protected]
Transcript
March 28, 2012
Initiating Coverage
ICICI Securities Ltd | Retail Equity Research
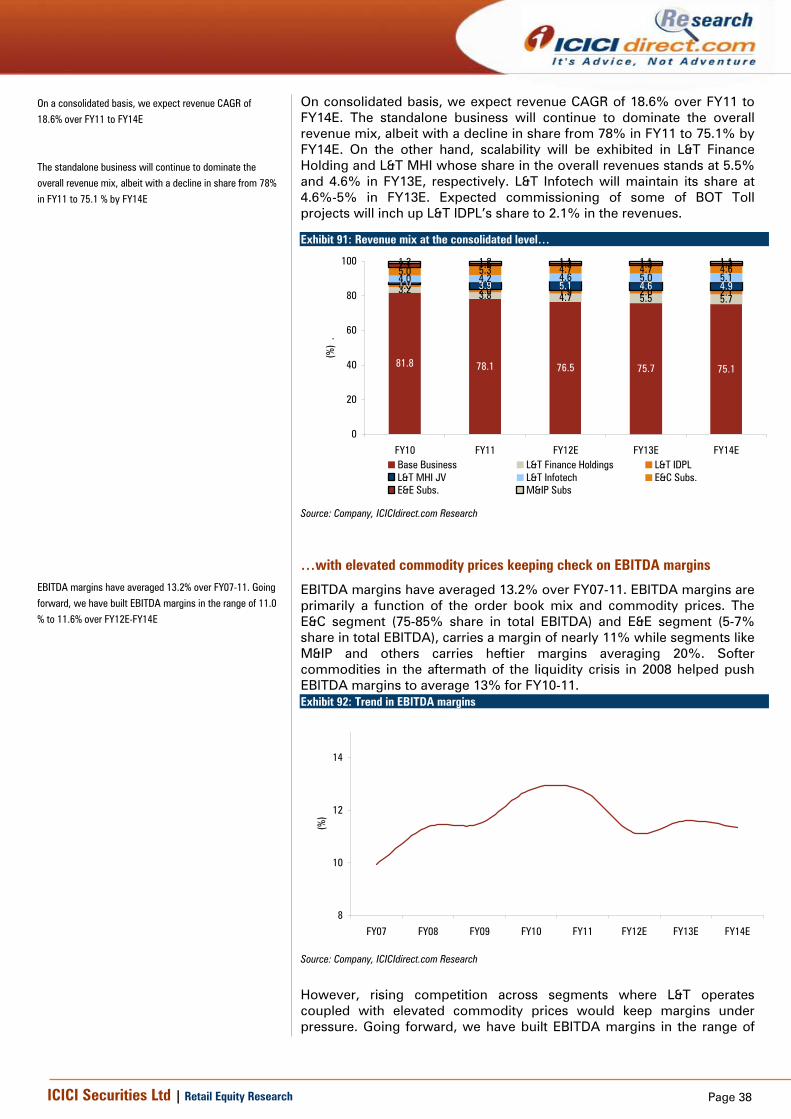
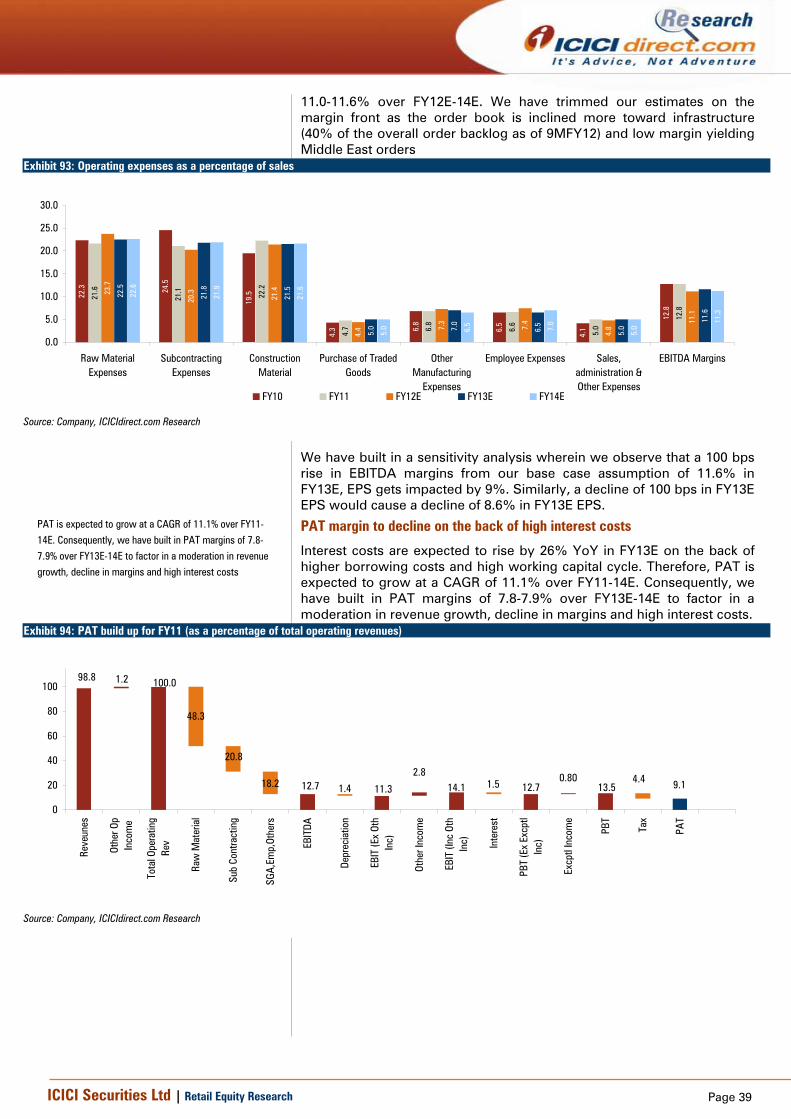
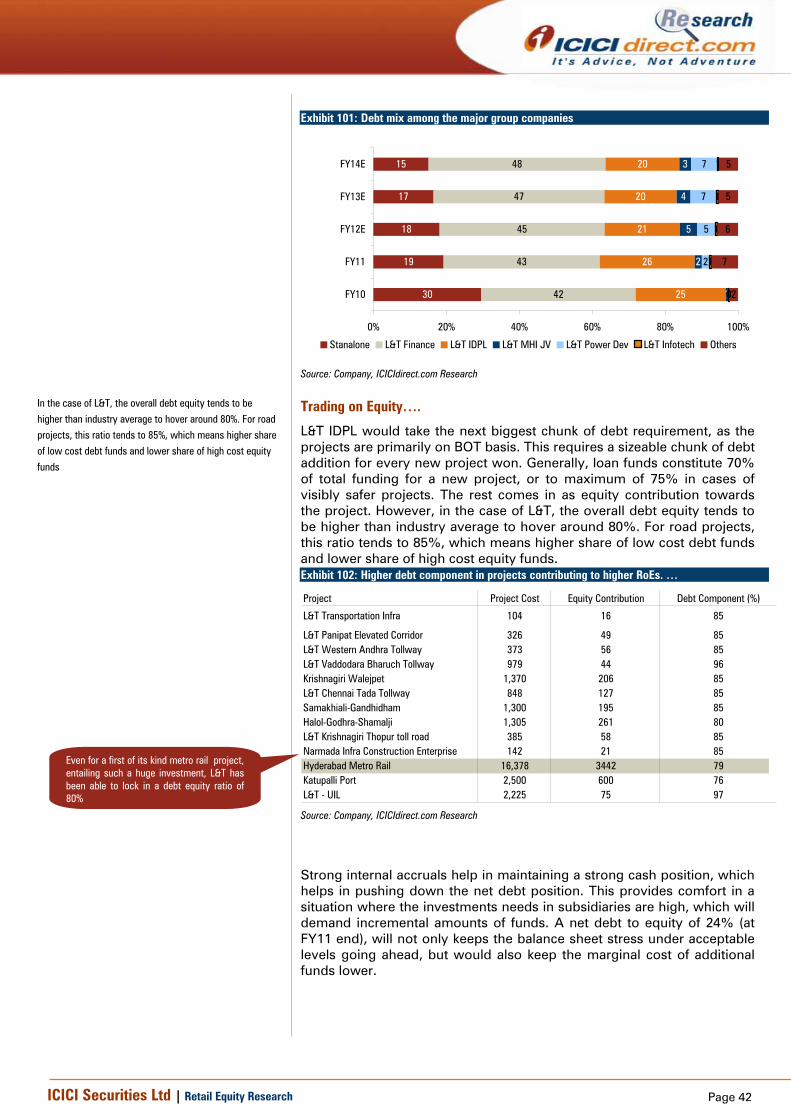
The Behemoth… Larsen & Toubro‘s (L&T) ability to increase its order backlog consistently despite a weak investment cycle (42% YoY growth during last crisis phase of FY10 and 27% as on 9MFY12) showcases the company’s robust fundamentals. A diverse presence across segments and geographies, a strong balance sheet, reliability in execution and ability to monetise the revival in investment cycle ensure that L&T is well placed to meet its FY12E revenue guidance of 25% YoY in an environment where its peers are facing declining order backlog and volatility in earnings. Coupled with this, value unlocking in subsidiaries, would offer huge upside potential as L&T has invested about | 7400 crore in various strategic subsidiaries, which have the capability to provide huge back ended IRRs on equity. We believe L&T remains the preferred bet in the capital goods space. We advise buying the stock on steep declines as a huge run up will cap upside in the short-term. Best placed to weather capex cycle downs and monetise the ups... The investment cycle is going through a turbulent phase as capex decisions are moving at a snails pace. However, we believe L&T has done a commendable job in maintaining a flattish order inflow for 9MFY12 on a high base (we have built in ~8% decline in FY12E order inflows). L&T commands a robust book-to-bill ratio of 2.9x as of Q3FY12. Therefore, this lends credence to our assumptions that L&T will be able to meet its FY12E revenue target. We have been a tad conservative on the assumptions and have modelled in 23% YoY revenue growth for FY12E. Going ahead, given the decline that L&T has witnessed in order inflows, we believe the company can still achieve ~17% and 10% CAGR in revenues and PAT over FY11-14E, respectively. Subsidiaries: Storehouse of tremendous potential… L&T invested | 7400 crore into various subsidiaries spanning across various sectors and segments. Investments in subsidiaries have grown at a CAGR of 43% (low base) over FY08-11. Going ahead, as various projects near their completion phase, we expect investments to grow at 20% CAGR over FY11-14E to | 13063 crore. Reaching a critical mass level (revenues) would trigger value unlocking. The process has taken off gradually as L&T Finance Holdings came out with an IPO in FY12.
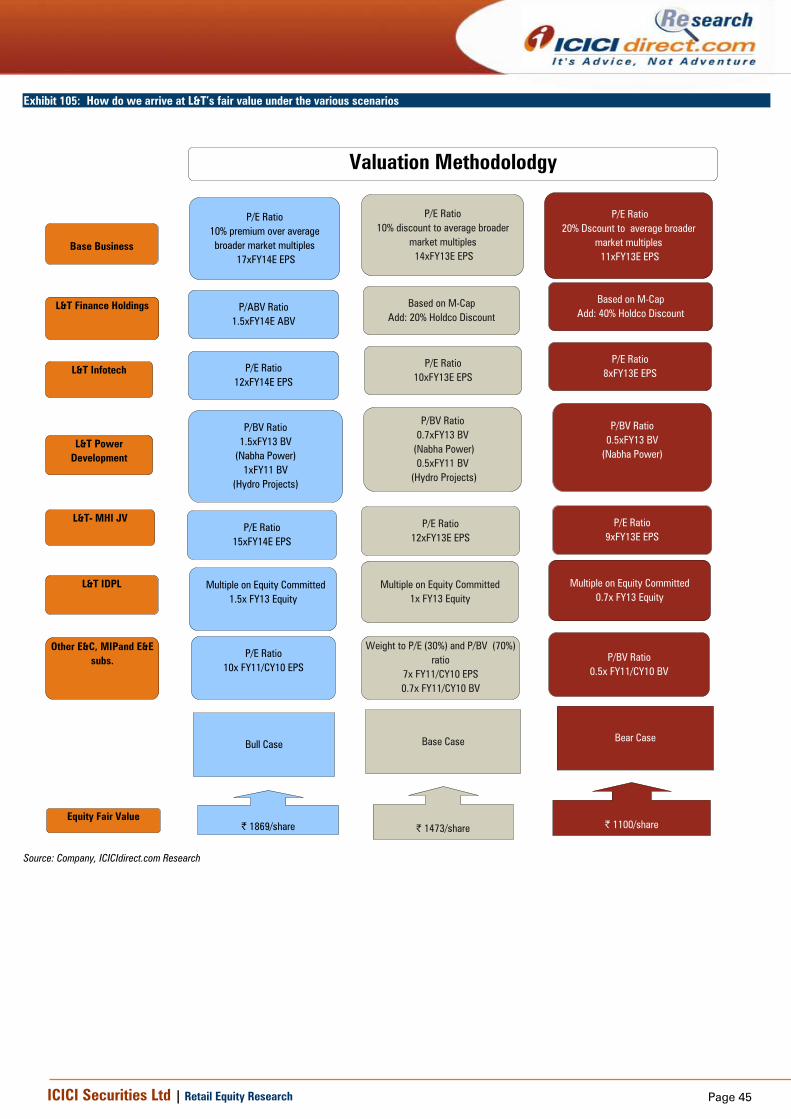
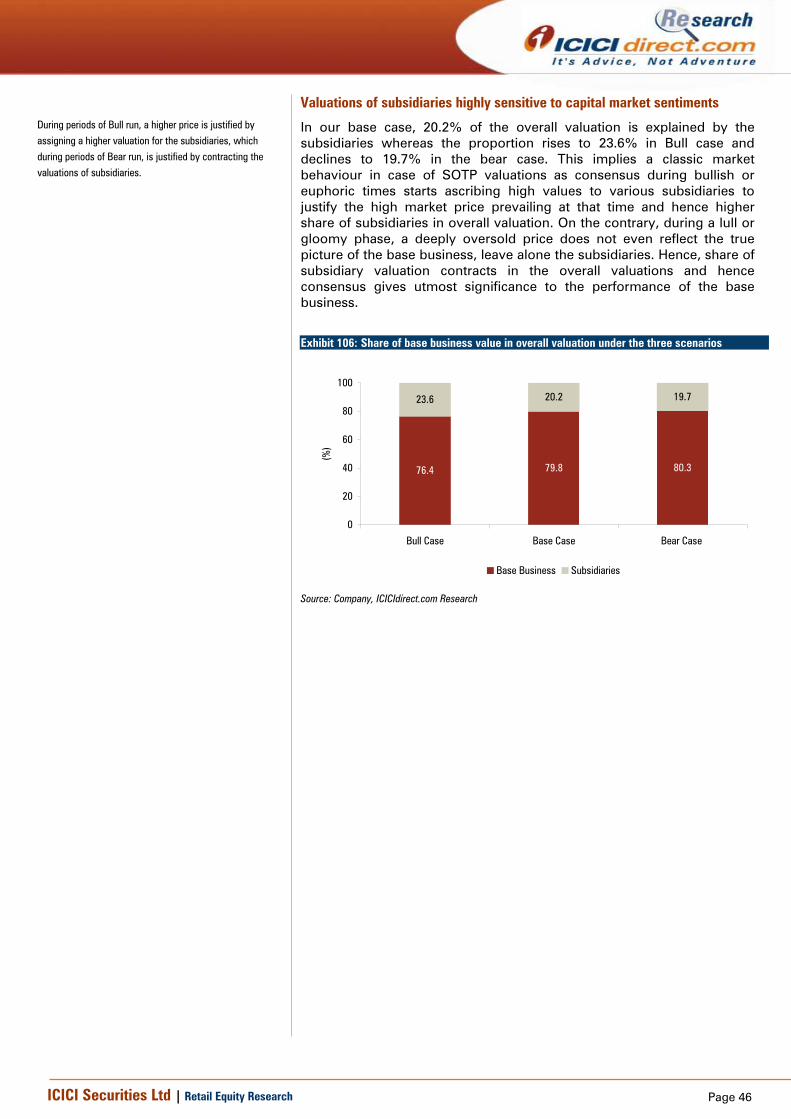
Valuations We have valued L&T on a sum of the parts methodology and arrived at a fair value of | 1473/share in our base case scenario. The base business remains the key contributor to valuations (~80%). Going ahead, a re-rating/decline of P/E will be highly dependent on the order inflow outlook in FY13E, which, in turn, will drive valuations. Also, listing of any subsidiary can provide further impetus to value creation. Initiate with Hold
Page 2ICICI Securities Ltd | Retail Equity Research
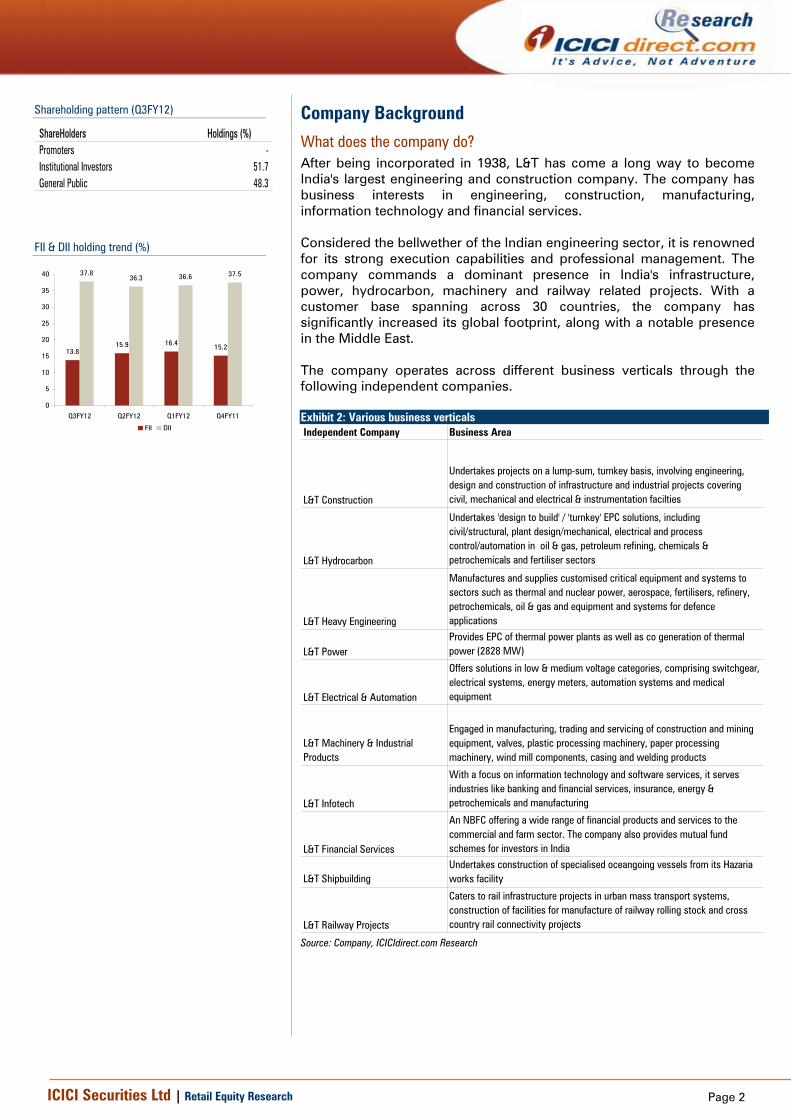
Company Background What does the company do? After being incorporated in 1938, L&T has come a long way to become India's largest engineering and construction company. The company has business interests in engineering, construction, manufacturing, information technology and financial services. Considered the bellwether of the Indian engineering sector, it is renowned for its strong execution capabilities and professional management. The company commands a dominant presence in India's infrastructure, power, hydrocarbon, machinery and railway related projects. With a customer base spanning across 30 countries, the company has significantly increased its global footprint, along with a notable presence in the Middle East. The company operates across different business verticals through the following independent companies. Exhibit 2: Various business verticals Independent Company Business Area
L&T Construction
Undertakes projects on a lump-sum, turnkey basis, involving engineering, design and construction of infrastructure and industrial projects covering civil, mechanical and electrical & instrumentation facilties
L&T Hydrocarbon
Undertakes 'design to build' / 'turnkey' EPC solutions, including civil/structural, plant design/mechanical, electrical and process control/automation in oil & gas, petroleum refining, chemicals & petrochemicals and fertiliser sectors
L&T Heavy Engineering
Manufactures and supplies customised critical equipment and systems to sectors such as thermal and nuclear power, aerospace, fertilisers, refinery, petrochemicals, oil & gas and equipment and systems for defence applications
L&T PowerProvides EPC of thermal power plants as well as co generation of thermal power (2828 MW)
L&T Electrical & Automation
Offers solutions in low & medium voltage categories, comprising switchgear, electrical systems, energy meters, automation systems and medical equipment
L&T Machinery & Industrial Products
Engaged in manufacturing, trading and servicing of construction and mining equipment, valves, plastic processing machinery, paper processing machinery, wind mill components, casing and welding products
L&T Infotech
With a focus on information technology and software services, it serves industries like banking and financial services, insurance, energy & petrochemicals and manufacturing
L&T Financial Services
An NBFC offering a wide range of financial products and services to the commercial and farm sector. The company also provides mutual fund schemes for investors in India
L&T ShipbuildingUndertakes construction of specialised oceangoing vessels from its Hazaria works facility
L&T Railway Projects
Caters to rail infrastructure projects in urban mass transport systems, construction of facilities for manufacture of railway rolling stock and cross country rail connectivity projects
Source: Company, ICICIdirect.com Research
Shareholding pattern (Q3FY12)
ShareHolders Holdings (%)Promoters -Institutional Investors 51.7 General Public 48.3
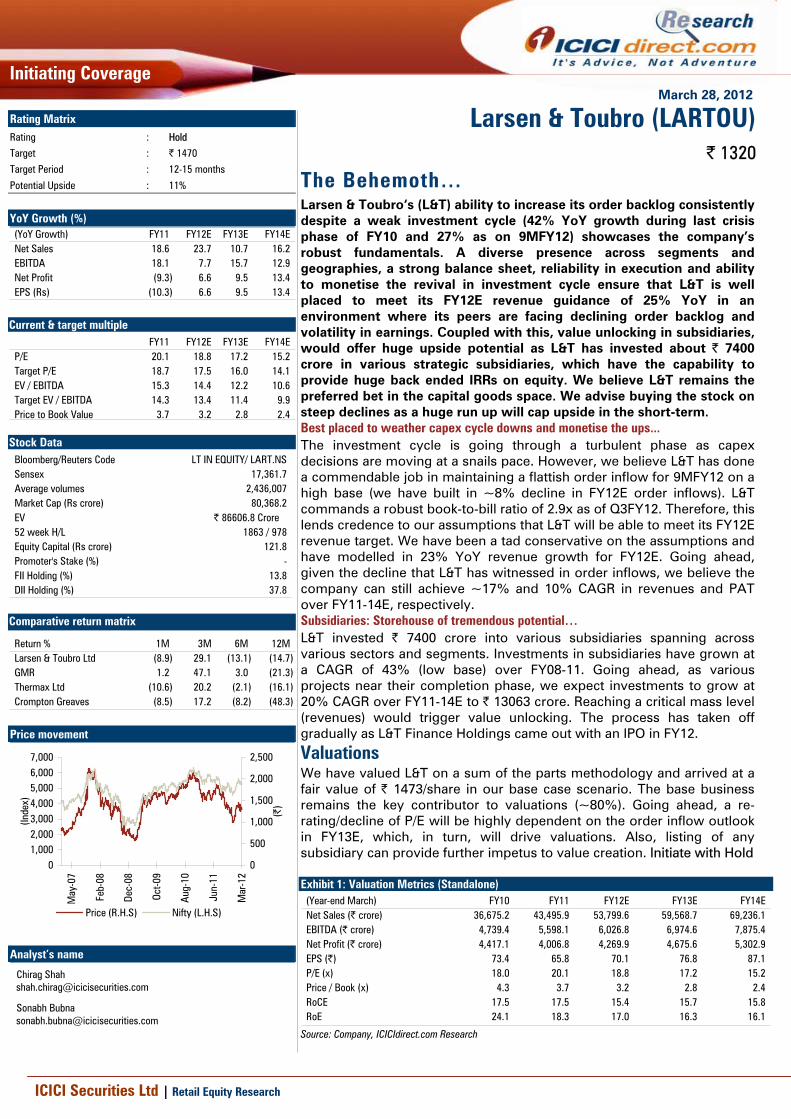
FII & DII holding trend (%)
13.815.9 16.4 15.2
37.836.3 36.6 37.5
0
5
10
15
20
25
30
35
40
Q3FY12 Q2FY12 Q1FY12 Q4FY11
FII DII
Page 3ICICI Securities Ltd | Retail Equity Research
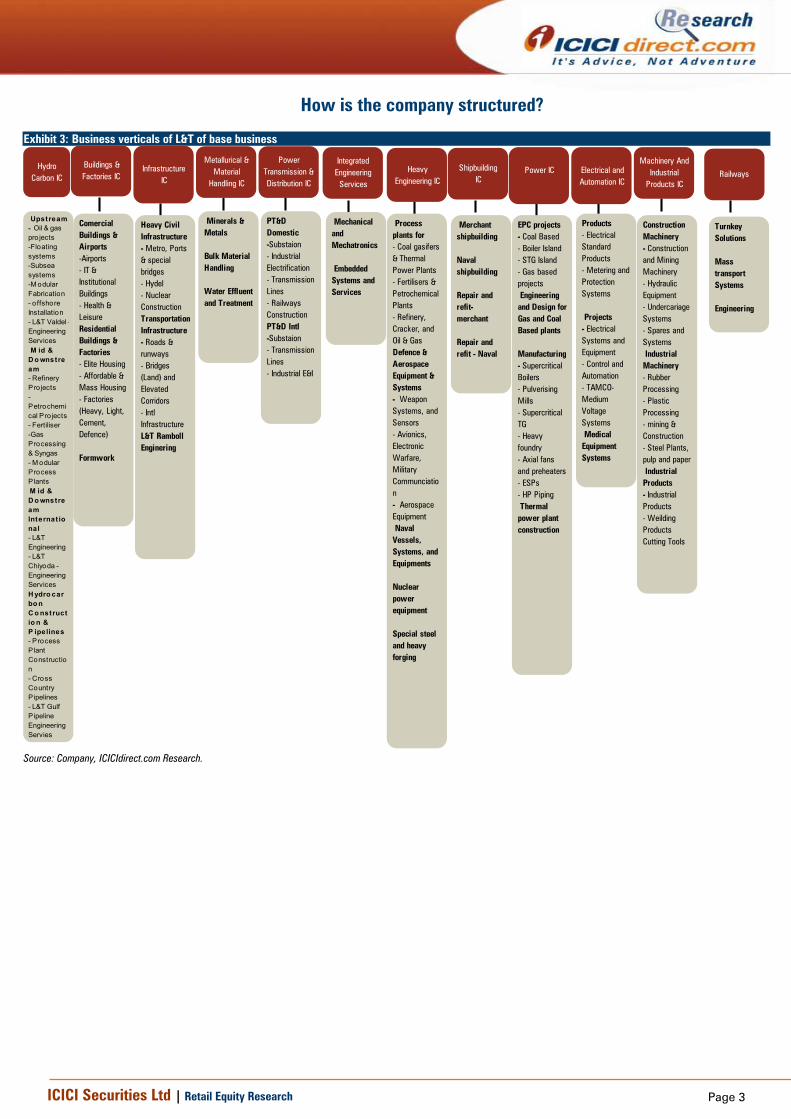
How is the company structured?
Exhibit 3: Business verticals of L&T of base business
Hydro Carbon IC
Upstream- Oil & gas pro jects-Floating systems-Subsea systems-M odular Fabrication- o ffshore Installation- L&T Valdel -Engineering Services M id & D o wnstream- Refinery Pro jects- Petrochemical Pro jects- Fertiliser-Gas Processing & Syngas - M odular Process Plants M id & D o wnstream Internat ional- L&T Engineering- L&T Chiyoda - Engineering ServicesH ydro carbo n C o nstructio n & P ipelines- Process Plant Construction - Cross Country Pipelines- L&T Gulf Pipeline Engineering Servies
Buildings & Factories IC
Comercial Buildings & Airports-Airports- IT & Institutional Buildings- Health & LeisureResidential Buildings & Factories- Elite Housing- Affordable & Mass Housing- Factories (Heavy, Light, Cement, Defence)
Heavy Civil Infrastructure- Metro, Ports & special bridges- Hydel- Nuclear ConstructionTransportationInfrastructure- Roads & runways- Bridges (Land) and Elevated Corridors- Intl InfrastructureL&T Ramboll Enginering
Metallurical & Material
Handling IC
Minerals & Metals
Bulk Material Handling
Water Effluent and Treatment
Shipbuilding IC
Merchant shipbuilding
Naval shipbuilding
Repair and refit- merchant
Repair and refit - Naval
Integrated Engineering
Services
Mechanical and Mechatronics
Embedded Systems and Services
Heavy Engineering IC
Process plants for - Coal gasifers & Thermal Power Plants- Fertilisers & Petrochemical Plants- Refinery, Cracker, and Oil & GasDefence & Aerospace Equipment & Systems- Weapon Systems, and Sensors- Avionics, Electronic Warfare, Military Communciation- Aerospace Equipment Naval Vessels, Systems, and Equipments
Nuclear power equipment
Special steel and heavy forging
Power IC
EPC projects- Coal Based- Boiler Island- STG Island- Gas based projects Engineering and Design forGas and Coal Based plants
Manufacturing- Supercritical Boilers- Pulverising Mills- Supercritical TG- Heavy foundry- Axial fans and preheaters- ESPs- HP Piping Thermal power plant construction
Electrical and Automation IC
Products- Electrical Standard Products- Metering and Protection Systems
Projects- Electrical Systems and Equipment- Control and Automation- TAMCO- Medium Voltage Systems Medical Equipment Systems
Machinery And Industrial
Products IC
Construction Machinery- Construction and Mining Machinery- Hydraulic Equipment- Undercariage Systems- Spares and Systems Industrial Machinery- Rubber Processing- Plastic Processing- mining & Construction- Steel Plants, pulp and paper Industrial Products- Industrial Products- Weilding ProductsCutting Tools
Railways
Turnkey Solutions
Mass transport Systems
Engineering
Source: Company, ICICIdirect.com Research.
Page 4ICICI Securities Ltd | Retail Equity Research
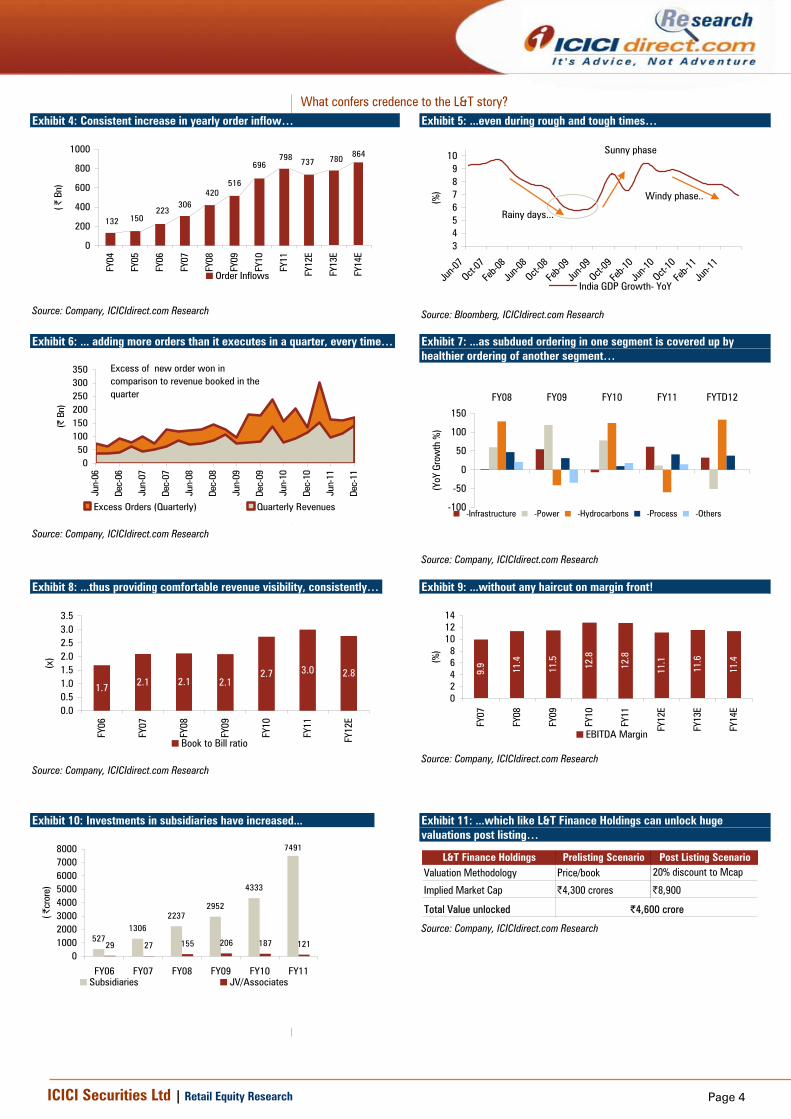
What confers credence to the L&T story? Exhibit 4: Consistent increase in yearly order inflow…
737
132 150223
306420
516
696798 780
864
0
200
400
600
800
1000
FY04
FY05
FY06
FY07
FY08
FY09
FY10
FY11
FY12
E
FY13
E
FY14
E
( | B
n)
Order Inflows
Source: Company, ICICIdirect.com Research
Exhibit 5: ...even during rough and tough times…
3456789
10
Jun-0
7Oct-
07
Feb-0
8
Jun-0
8Oct-
08
Feb-0
9
Jun-0
9Oct-
09
Feb-1
0
Jun-1
0Oct-
10
Feb-1
1
Jun-1
1
(%)
India GDP Growth- YoY
Rainy days...
Sunny phase
Windy phase..
Source: Bloomberg, ICICIdirect.com Research
Exhibit 6: ... adding more orders than it executes in a quarter, every time…
050
100150200250300350
Jun-
06
Dec-
06
Jun-
07
Dec-
07
Jun-
08
Dec-
08
Jun-
09
Dec-
09
Jun-
10
Dec-
10
Jun-
11
Dec-
11
(| B
n)
Excess Orders (Quarterly) Quarterly Revenues
Excess of new order won in comparison to revenue booked in the quarter
Source: Company, ICICIdirect.com Research
Exhibit 7: ...as subdued ordering in one segment is covered up by healthier ordering of another segment…
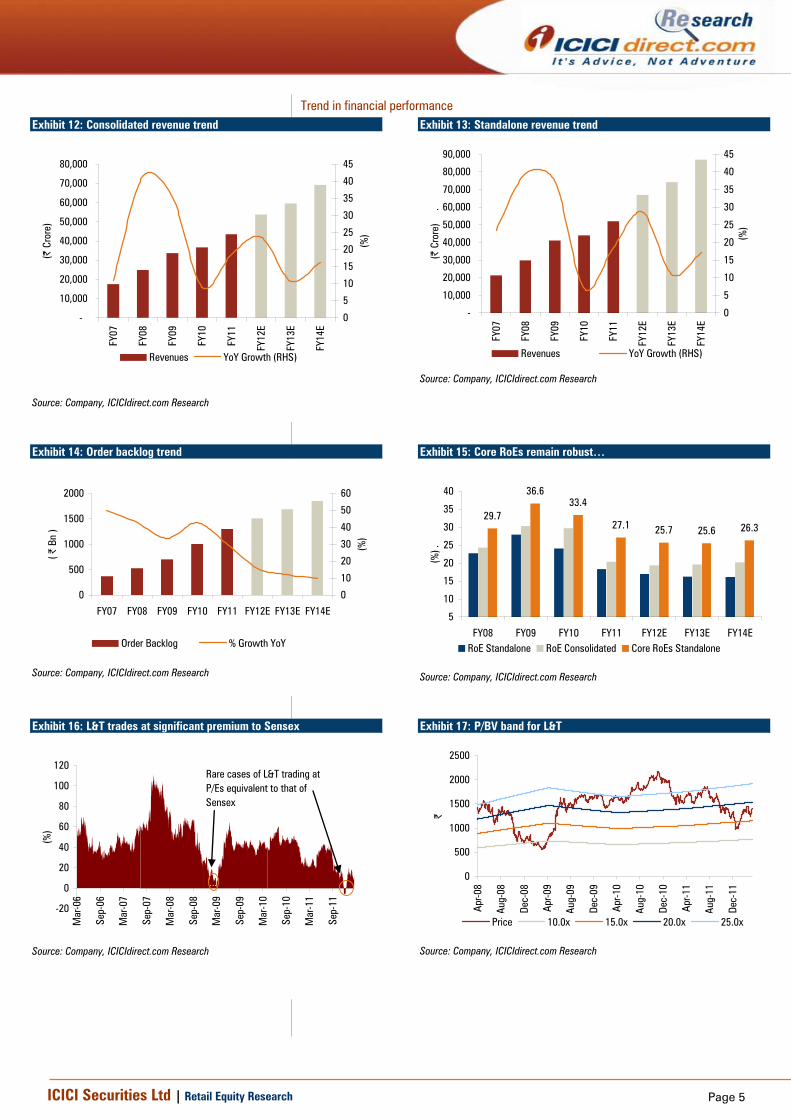
Exhibit 16: L&T trades at significant premium to Sensex
-20
0
20
40
60
80
100
120
Mar
-06
Sep-
06
Mar
-07
Sep-
07
Mar
-08
Sep-
08
Mar
-09
Sep-
09
Mar
-10
Sep-
10
Mar
-11
Sep-
11
(%)
Rare cases of L&T trading at P/Es equivalent to that of Sensex
Source: Company, ICICIdirect.com Research
Exhibit 17: P/BV band for L&T
0
500
1000
1500
2000
2500
Apr-0
8
Aug-
08
Dec-
08
Apr-0
9
Aug-
09
Dec-
09
Apr-1
0
Aug-
10
Dec-
10
Apr-1
1
Aug-
11
Dec-
11
|
Price 10.0x 15.0x 20.0x 25.0x
Source: Company, ICICIdirect.com Research
Page 6ICICI Securities Ltd | Retail Equity Research
Investment Rationale
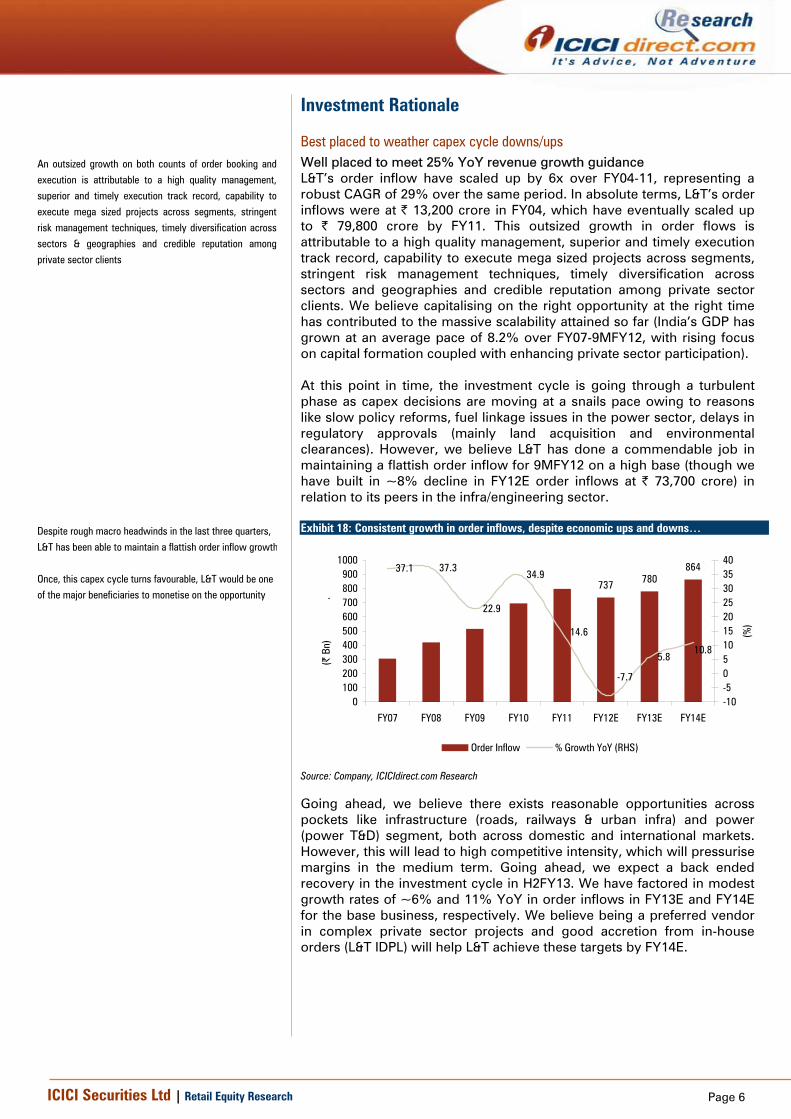
Best placed to weather capex cycle downs/ups Well placed to meet 25% YoY revenue growth guidance L&T’s order inflow have scaled up by 6x over FY04-11, representing a robust CAGR of 29% over the same period. In absolute terms, L&T’s order inflows were at | 13,200 crore in FY04, which have eventually scaled up to | 79,800 crore by FY11. This outsized growth in order flows is attributable to a high quality management, superior and timely execution track record, capability to execute mega sized projects across segments, stringent risk management techniques, timely diversification across sectors and geographies and credible reputation among private sector clients. We believe capitalising on the right opportunity at the right time has contributed to the massive scalability attained so far (India’s GDP has grown at an average pace of 8.2% over FY07-9MFY12, with rising focus on capital formation coupled with enhancing private sector participation). At this point in time, the investment cycle is going through a turbulent phase as capex decisions are moving at a snails pace owing to reasons like slow policy reforms, fuel linkage issues in the power sector, delays in regulatory approvals (mainly land acquisition and environmental clearances). However, we believe L&T has done a commendable job in maintaining a flattish order inflow for 9MFY12 on a high base (though we have built in ~8% decline in FY12E order inflows at | 73,700 crore) in relation to its peers in the infra/engineering sector. Exhibit 18: Consistent growth in order inflows, despite economic ups and downs…
780737
86437.1 37.3
22.9
34.9
14.6
5.810.8
-7.7
0100200300400500600700800900
1000
FY07 FY08 FY09 FY10 FY11 FY12E FY13E FY14E
(| B
n)
.
-10-50510152025303540
(%)
Order Inflow % Growth YoY (RHS)
Source: Company, ICICIdirect.com Research
Going ahead, we believe there exists reasonable opportunities across pockets like infrastructure (roads, railways & urban infra) and power (power T&D) segment, both across domestic and international markets. However, this will lead to high competitive intensity, which will pressurise margins in the medium term. Going ahead, we expect a back ended recovery in the investment cycle in H2FY13. We have factored in modest growth rates of ~6% and 11% YoY in order inflows in FY13E and FY14E for the base business, respectively. We believe being a preferred vendor in complex private sector projects and good accretion from in-house orders (L&T IDPL) will help L&T achieve these targets by FY14E.
An outsized growth on both counts of order booking and
execution is attributable to a high quality management,
superior and timely execution track record, capability to
execute mega sized projects across segments, stringent
risk management techniques, timely diversification across
sectors & geographies and credible reputation among
private sector clients
Despite rough macro headwinds in the last three quarters,
L&T has been able to maintain a flattish order inflow growth
Once, this capex cycle turns favourable, L&T would be one of the major beneficiaries to monetise on the opportunity
Page 7ICICI Securities Ltd | Retail Equity Research
Exhibit 19: Book to bill ratio of 2.8x to ensure high double digit revenue growth into FY14E
1.72.1 2.1 2.1
2.7 3.0 2.8
0.0
0.5
1.0
1.5
2.0
2.5
3.0
3.5
FY06
FY07
FY08
FY09
FY10
FY11
FY12
E
(x)
Book to Bill ratio
Source: Company, ICICIdirect.com Research
Exhibit 20: Order backlog indicative of revenue growth over FY11-FY14E.
369526.8
703
1002.39
1302.17
15081686
1850
0
200
400
600
800
1000
1200
1400
1600
1800
2000
FY07 FY08 FY09 FY10 FY11 FY12E FY13E FY14E
(| B
n)
.
0.0
10.0
20.0
30.0
40.0
50.0
60.0
(%)
.
Order Backlog Growth YoY
Source: Company, ICICIdirect.com Research
L&T commands a book-to-bill ratio of 2.9x as of Q3FY12 and, therefore, lends credence to our assumptions that L&T will be able to meet its FY12E revenue target of 25% YoY. We have been a tad conservative on the assumptions and have modelled in 23% YoY revenue growth for FY12E. Going ahead, given the tepid decline that L&T would witness in order inflows for FY12E coupled with a modest rise in FY13E and FY14E, we have modelled in growth at 11.4% and 16.2% in the base business revenues in FY13E and FY14E, respectively.
Exhibit 21: History of L&T’s guidance vs. achievement
Order Inflow Growth (%) Base Business Revenue Growth (%) EBITDA Margin (%)
Source: Company, ICICIdirect.com Research, Figures marked in Red indicated ICICIdirect Estimates for FY12E(standalone)
Stands tall across parameters vis-à-vis construction/engineering peers Looking at the various operating matrices of L&T and its construction/engineering peers, we observe that L&T is far superior across parameters such as order inflow growth, revenue growth and working capital management across business cycles. Hence, clearly premium multiples, especially during investment cycle downturns are sustained for L&T vis-à-vis its peers. We have analysed data from FY07-9MYTDFY12, which clearly supports our argument as order inflow growth for players like IVRCL infra, NCC, Simplex and HCC is too lumpy wherein L&T’s order inflows exhibits low lumpiness and, thereby, consistent revenue visibility and growth (refer Exhibit 22 and Exhibit 23).
Page 8ICICI Securities Ltd | Retail Equity Research
Exhibit 22: Order inflow growth for L&T and its construction peers
Even among engineering firms, L&T exhibits consistent operating matrices. The most significant among these parameters are the order inflow growth and order replacement ratio (refer Exhibit 26 and Exhibit 27). Though at absolute levels, inflow growth has declined, the volatility in inflow growth is less compared to peers like BGR Energy, Crompton Greaves and Siemens as degree of business diversification of L&T is significantly higher than its peers, thereby diffusing macro risks in a better way.
Cycles of downturn further exhibit a robust business
model and strong balance sheet of L&T. This is clearly
indicated in the NWC ratio as percentage of sales.
During downturns, L&T’s NWC as percentage of sales
hovers between 16% and 17% whereas peers like
IVRCL, NCC, Simplex and HCC have NWCs ranging
between 30% and 60%
Quality of earnings and growth rates are better for L&T
when compared to its peers (Refer Exhibit 25)
Page 9ICICI Securities Ltd | Retail Equity Research
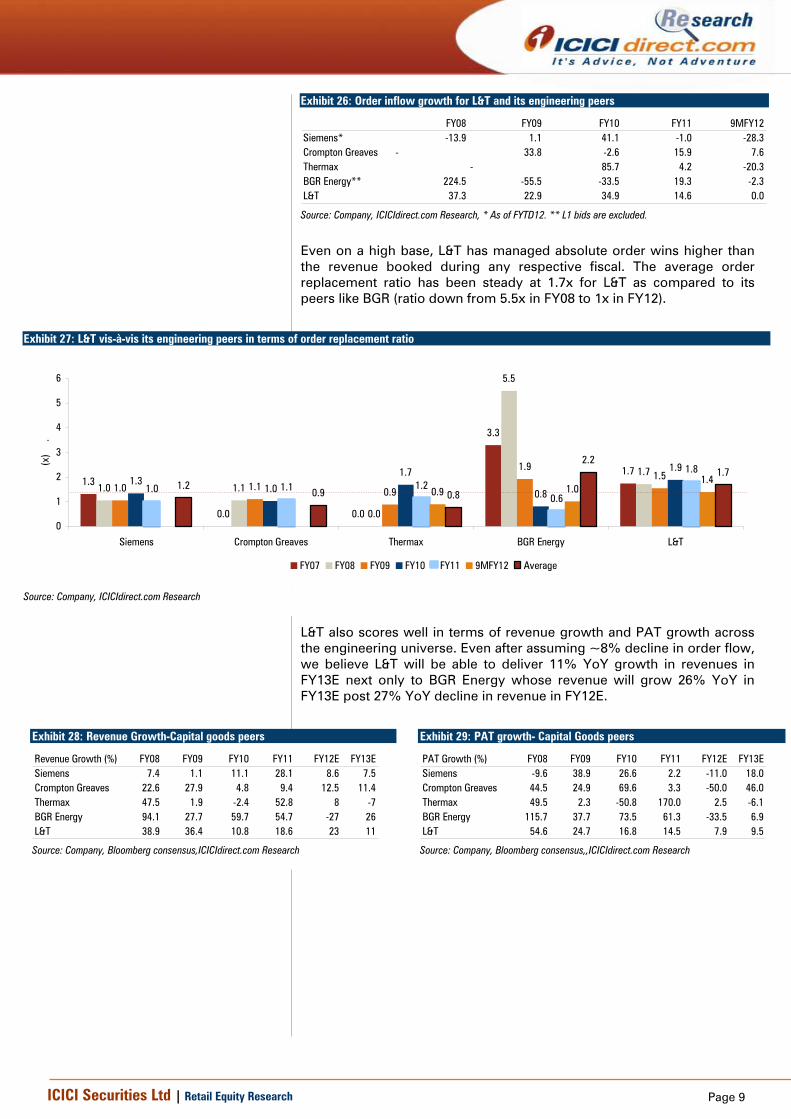
Exhibit 26: Order inflow growth for L&T and its engineering peers
Source: Company, ICICIdirect.com Research, * As of FYTD12. ** L1 bids are excluded.
Even on a high base, L&T has managed absolute order wins higher than the revenue booked during any respective fiscal. The average order replacement ratio has been steady at 1.7x for L&T as compared to its peers like BGR (ratio down from 5.5x in FY08 to 1x in FY12).
Exhibit 27: L&T vis-à-vis its engineering peers in terms of order replacement ratio
1.3
0.0 0.0
3.3
1.7
1.0 1.1
0.0
5.5
1.7
1.0 1.1 0.9
1.91.51.3
1.0
1.7
0.8
1.9
1.0 1.1 1.20.6
1.8
0.9 1.01.41.2
0.9 0.8
2.21.7
0
1
2
3
4
5
6
Siemens Crompton Greaves Thermax BGR Energy L&T
(x)
.
FY07 FY08 FY09 FY10 FY11 9MFY12 Average
Source: Company, ICICIdirect.com Research
L&T also scores well in terms of revenue growth and PAT growth across the engineering universe. Even after assuming ~8% decline in order flow, we believe L&T will be able to deliver 11% YoY growth in revenues in FY13E next only to BGR Energy whose revenue will grow 26% YoY in FY13E post 27% YoY decline in revenue in FY12E.
Source: Company, Bloomberg consensus,,ICICIdirect.com Research
Page 10ICICI Securities Ltd | Retail Equity Research
Diversified operations provide good hedge during capex downturns L&T’s current order backlog of | 146000 crore (Q3FY12) is highly diversified across segments. Out of the current backlog, the infrastructure segment (roads, buildings & factories, urban infra, airports) comprises 40% of the backlog whereas power (generation & T&D) and process (metals & material handling) segment’s share stands at 29% and 15%, respectively. Hydrocarbons and others (defence, shipbuilding and electronic products), on the other hand, constitute 11% and 5% of the backlog, respectively.
Exhibit 30: Segment wise business activities of L&T
Infrastructure Power Hydrocarbons Process Others
Roads and bridge Power generation Upstream Minerals and metals Shipbuilding
Ports and harbours Power plant equipment Mid and downstream Bulk material handling Defence & aerospace
AirportsElectrification/transmission and
distribution Pipelines Construction and mining equipment
Railways Fertilisers Electronic Products
Buildings and factories Valves Technology service
Urban infra
Water
Source: Company, ICICIdirect.com Research
Comparing the current break up of backlog, the share of the power and infrastructure segment has made significant gains of 18% and 5% to 29% and 40%, respectively, when compared to the average share (FY04-YTDFY12) of 11% and 35%, respectively. On the other hand, the share of hydrocarbons and other segments has faced a loss of 7% and 9% when compared to historical averages (FY04-YTDFY12).
Going ahead, we expect the share of infrastructure to rise to 42% in FY14E from 40% in FY12E (pick-up in road project awards, opportunities in metro projects and mega projects such as DFC and urban infra) as other segments like power (fuel linkage issues, delays in environmental clearances and high competitive intensity though domestic and international T&D projects provide reasonable scope) and process (low capacity utilisations) are going through a rough patch.
Total 70% of the current backlog comes from the infra and power
segments. Going ahead, we expect the share of infrastructure to rise to 42% in FY14E from 40% in FY12E
Page 11ICICI Securities Ltd | Retail Equity Research
Exhibit 31: Trend in share of segment in order backlog
39 36 41 33 36 40 41 42
16 1622 30 32 29 27 25
19 2314 15 12 11 11 12
12 14 16 16 16 15 15 1514 11 7 6 4 5 6 6
0102030405060708090
100
FY07 FY08 FY09 FY10 FY11 FY12E FY13E FY14E
(%) .
Infrastructure Power Hydrocarbons Process Others
Source: Company, ICICIdirect.com Research
From a seasonality perspective, order inflows in the infrastructure projects segment have remained relatively consistent as compared to the power and hydrocarbons space where lumpiness in order flows is high. Over FY08-YTD FY12 (18 quarters), segments such as power and hydrocarbons have posted negative quarterly order inflow growth (YoY) seven and nine times, respectively. On the other hand, consistency of infra segment order flows is explained by 14 quarters of positive order inflow growth out of 18 counts.
Exhibit 32: Degree of cyclicality in the various segments with respect to order inflows over FY10-YTDFY12
Though power order inflows had been down in recent quarters, one big EPC order win could make up for lost quarters...
A higher dgree of lumpiness for hydrocarbons orders as capex plans are sensitive to oil prices
Sensitive to overall capex sentiments..
Emerging segments (like defence) for L&T..
Source: Company, ICICIdirect.com Research
Different segments are displaying different sensitivities,
with the infrastructure projects segment remaining
relatively consistent as compared to the power and hydrocarbons space where lumpiness in order flows is high
Page 12ICICI Securities Ltd | Retail Equity Research
Exhibit 33: Positive/negative order inflow growth for segment across Q1FY08-Q3FY12
47
95
9
1412 9
139
02468
101214161820
Infrastructure Power Hydrocarbons Process Others
(No
of Q
uarte
rs)
.Negative growth Positive growth
Source: Company, ICICIdirect.com Research
Our second argument for consistency in segmental order flows is reflected in the slow moving orders in the backlog (10-12% of the backlog as of Q3FY12), which are mainly related to the power and process segments. Hence, with rising thrust on the infrastructure segment in the overall order book, we expect moderation in execution rate to be limited and to keep the growth rate in standalone revenues at 16.8% CAGR over FY11-FY14E.
Exhibit 34: Some slow moving orders in current order backlog (as of 9MFY12) Order Segment Size (| crore) CommentsNabha Power Power Pending fuel linakgesKarchana Power Land acquisition delaysHyderabad Metro Infrastructure - Land acquisition delaysBlast furnace Process
Source: Company, ICICIdirect.com Research
Page 13ICICI Securities Ltd | Retail Equity Research
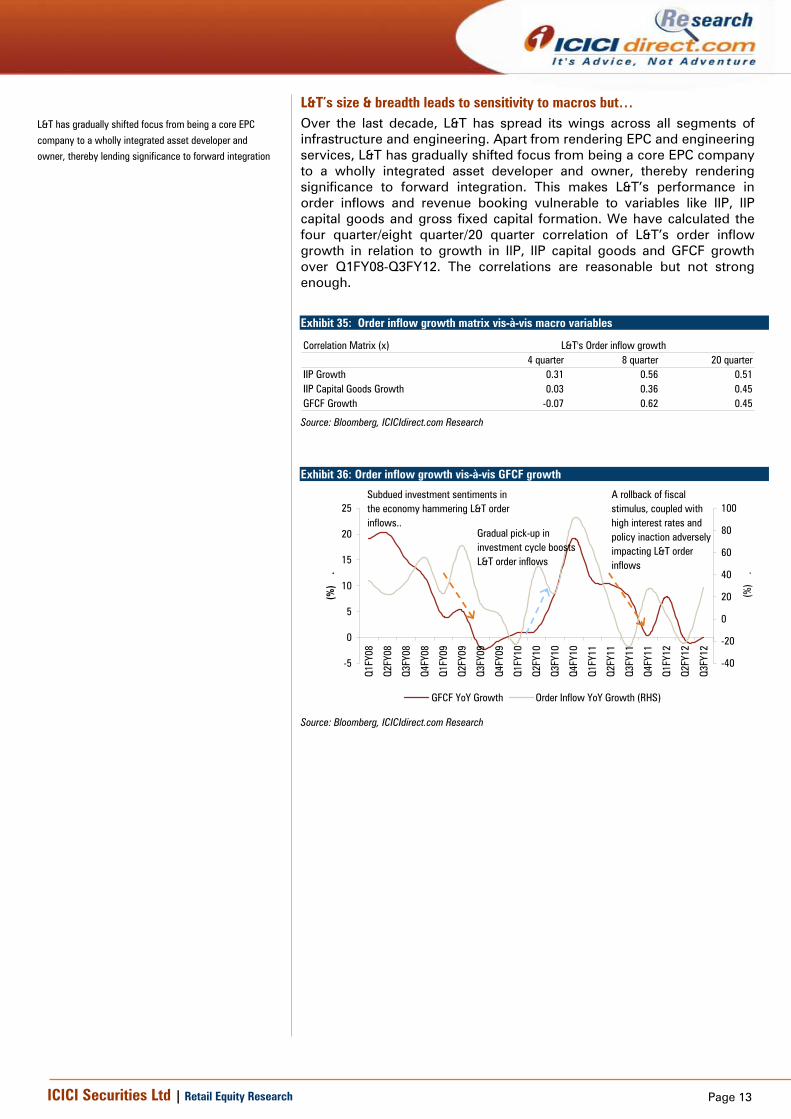
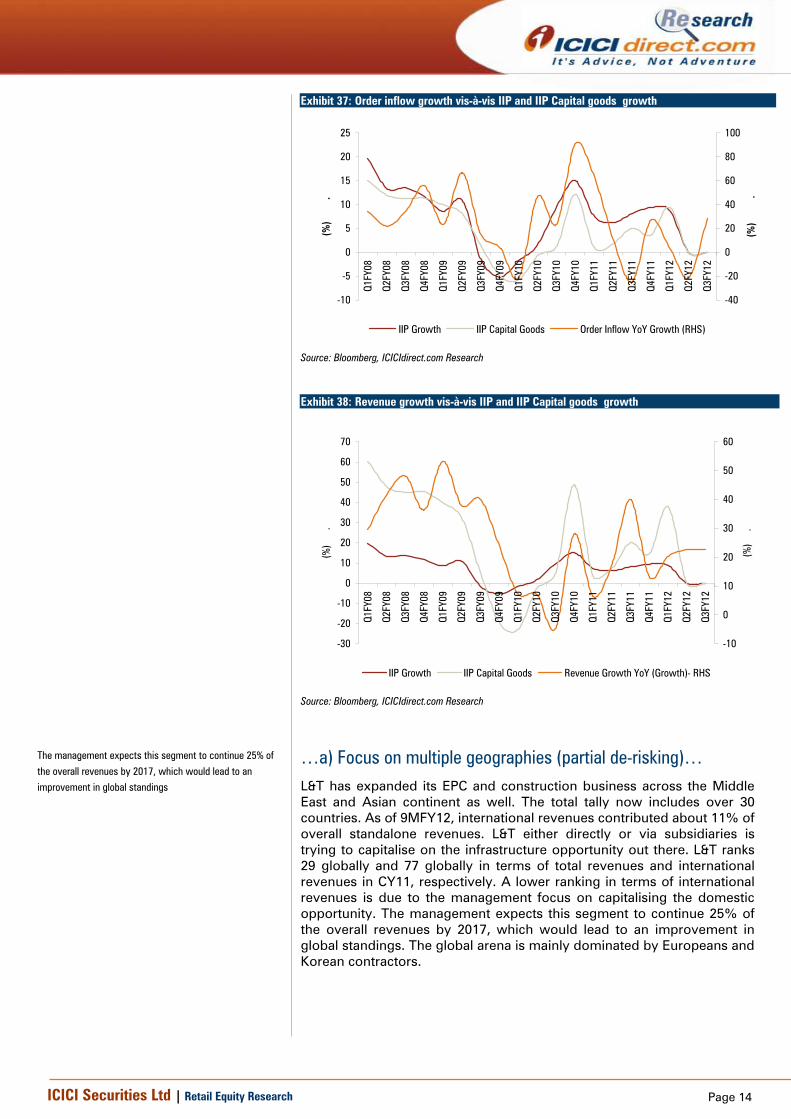
L&T’s size & breadth leads to sensitivity to macros but… Over the last decade, L&T has spread its wings across all segments of infrastructure and engineering. Apart from rendering EPC and engineering services, L&T has gradually shifted focus from being a core EPC company to a wholly integrated asset developer and owner, thereby rendering significance to forward integration. This makes L&T’s performance in order inflows and revenue booking vulnerable to variables like IIP, IIP capital goods and gross fixed capital formation. We have calculated the four quarter/eight quarter/20 quarter correlation of L&T’s order inflow growth in relation to growth in IIP, IIP capital goods and GFCF growth over Q1FY08-Q3FY12. The correlations are reasonable but not strong enough.
Exhibit 35: Order inflow growth matrix vis-à-vis macro variables
Exhibit 36: Order inflow growth vis-à-vis GFCF growth
-5
0
5
10
15
20
25
Q1FY
08
Q2FY
08
Q3FY
08
Q4FY
08
Q1FY
09
Q2FY
09
Q3FY
09
Q4FY
09
Q1FY
10
Q2FY
10
Q3FY
10
Q4FY
10
Q1FY
11
Q2FY
11
Q3FY
11
Q4FY
11
Q1FY
12
Q2FY
12
Q3FY
12
(%)
.
-40
-20
0
20
40
60
80
100
(%)
.
GFCF YoY Growth Order Inflow YoY Growth (RHS)
Subdued investment sentiments in the economy hammering L&T order inflows..
Gradual pick-up in investment cycle boosts L&T order inflows
A rollback of fiscal stimulus, coupled with high interest rates and policy inaction adversely impacting L&T order inflows
Source: Bloomberg, ICICIdirect.com Research
L&T has gradually shifted focus from being a core EPC
company to a wholly integrated asset developer and owner, thereby lending significance to forward integration
Page 14ICICI Securities Ltd | Retail Equity Research
Exhibit 37: Order inflow growth vis-à-vis IIP and IIP Capital goods growth
-10
-5
0
5
10
15
20
25
Q1FY
08
Q2FY
08
Q3FY
08
Q4FY
08
Q1FY
09
Q2FY
09
Q3FY
09
Q4FY
09
Q1FY
10
Q2FY
10
Q3FY
10
Q4FY
10
Q1FY
11
Q2FY
11
Q3FY
11
Q4FY
11
Q1FY
12
Q2FY
12
Q3FY
12
(%)
.
-40
-20
0
20
40
60
80
100
(%)
.
IIP Growth IIP Capital Goods Order Inflow YoY Growth (RHS)
Source: Bloomberg, ICICIdirect.com Research
Exhibit 38: Revenue growth vis-à-vis IIP and IIP Capital goods growth
-30
-20
-10
0
10
20
30
40
50
60
70
Q1FY
08
Q2FY
08
Q3FY
08
Q4FY
08
Q1FY
09
Q2FY
09
Q3FY
09
Q4FY
09
Q1FY
10
Q2FY
10
Q3FY
10
Q4FY
10
Q1FY
11
Q2FY
11
Q3FY
11
Q4FY
11
Q1FY
12
Q2FY
12
Q3FY
12
(%)
.
-10
0
10
20
30
40
50
60
(%)
.
IIP Growth IIP Capital Goods Revenue Growth YoY (Growth)- RHS
Source: Bloomberg, ICICIdirect.com Research
…a) Focus on multiple geographies (partial de-risking)…
L&T has expanded its EPC and construction business across the Middle East and Asian continent as well. The total tally now includes over 30 countries. As of 9MFY12, international revenues contributed about 11% of overall standalone revenues. L&T either directly or via subsidiaries is trying to capitalise on the infrastructure opportunity out there. L&T ranks 29 globally and 77 globally in terms of total revenues and international revenues in CY11, respectively. A lower ranking in terms of international revenues is due to the management focus on capitalising the domestic opportunity. The management expects this segment to continue 25% of the overall revenues by 2017, which would lead to an improvement in global standings. The global arena is mainly dominated by Europeans and Korean contractors.
The management expects this segment to continue 25% of
the overall revenues by 2017, which would lead to an improvement in global standings
Page 15ICICI Securities Ltd | Retail Equity Research
Exhibit 39: Global ranking of contractors in terms of international revenues
Company Name Company Rank in 2011 Rank in 2010HOCTIEF Germany 1 1VINCI France 2 2Bechtel US 3 4BOUGYES France 4 5Skanska Sweden 5 6Saipem Italy 6 7Flour Corp US 7 9Larsen & Toubro India 77 62
Source: McGraw Hill Construction,, ICICIdirect.com Research
Exhibit 40: Global ranking of contractors in terms of overall revenues
Company Name Company Rank in 2011 Rank in 2010China Railway Cons. China 1 1China Railway group China 2 2China state cons. China 3 6VINCI France 4 3China communications China 5 5BOUGYES France 6 4China Metallurgical grou China 7 8Larsen & Toubro India 29 34
Source: McGraw Hill Construction, ICICIdirect.com Research
Opportunity is huge in the Middle East markets
Exhibit 41: Opportunity in Saudi Arabia over 2009-2014
7 8 10 13
25
35
59
92
105 7 10
0102030405060708090
100
2009 2014 2019 2024
($ B
n)
.
Public Sector Private Industrial Oil Sector
Source: Ministry of economy and planning (Kingdom of Saudi Arabia), ICICIdirect.com Research
Exhibit 42: Opportunity in Oman over 8th five year plan (2010-2015)
4.33.2
1.3 1.2 1.20.40
2
4
6
Airp
orts
Road
s
Seap
orts
Wat
er
Hous
ing
Othe
rs
($ B
n)
Source: Ministry national economy (Oman), ICICIdirect.com Research
Key initiatives taken to step up international business opportunities …
• Setting up of modular fabrication facility in Oman • Also, setting up a switchboard manufacturing facility in Saudi Arabia • A system integration facility in Jebel Ali to capitalise on the drive automation business
… Efforts start to become visible..
Exhibit 43: Major orders announced in International markets by L&T across various segments. Order Details Client Year Order size (| Crore) SegmentT&D order in Oman Public FY12 170 PowerOrder of 132/11 KV substation system in Kuwait Public FY12 320 PowerSubstation and Transmission line order in Kuwait Public FY12 185 Power Order from Qatar General Electric and Water Corporation for 13 EHV Substaion Public FY12 1210 PowerEPC of 225 km transmission line for Saudi Construction Company Public FY12 597 PowerOrder from Petroleum Development Oman, LLC for 3 MMSCMD grenfield gas project Public FY12 700 HydrocarbonsEPC of 123 km pipleline order from GASCO: Abu Dhabhi, Public FY12 $189 mn HydrocarbonsOrder for four wellhead towers and one mainhead tower platform from ADNOC, UAE Public FY12 $450 mn HydrocarbonsOrder for three wellhead and associated works for PTT Public Ltd Co Public FY12 $250 mn HydrocarbonsTwo major roads orders in Oman (first big road orders) Public FY12 875 Infrastructure
Public FY11 2200 InfrastructureConstruction of New Salah International Aiport (Oman), to be done in 30 months (L&T's share in total order is |2,200)
Source: Company, ICICIdirect.com Research
Page 16ICICI Securities Ltd | Retail Equity Research
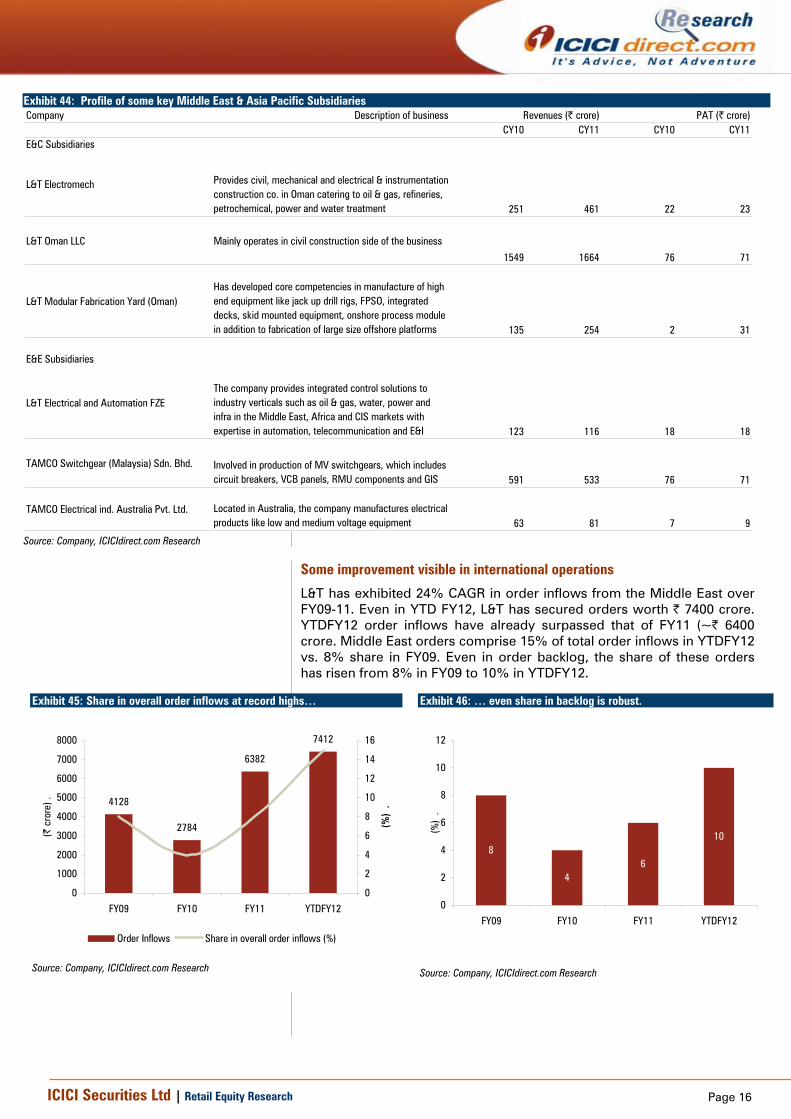
Exhibit 44: Profile of some key Middle East & Asia Pacific Subsidiaries Company Description of business
CY10 CY11 CY10 CY11E&C Subsidiaries
L&T Electromech Provides civil, mechanical and electrical & instrumentation construction co. in Oman catering to oil & gas, refineries, petrochemical, power and water treatment 251 461 22 23
L&T Oman LLC Mainly operates in civil construction side of the business
1549 1664 76 71
L&T Modular Fabrication Yard (Oman)Has developed core competencies in manufacture of high end equipment like jack up drill rigs, FPSO, integrated decks, skid mounted equipment, onshore process module in addition to fabrication of large size offshore platforms 135 254 2 31
E&E Subsidiaries
L&T Electrical and Automation FZEThe company provides integrated control solutions to industry verticals such as oil & gas, water, power and infra in the Middle East, Africa and CIS markets with expertise in automation, telecommunication and E&I 123 116 18 18
TAMCO Switchgear (Malaysia) Sdn. Bhd. Involved in production of MV switchgears, which includes circuit breakers, VCB panels, RMU components and GIS 591 533 76 71
TAMCO Electrical ind. Australia Pvt. Ltd. Located in Australia, the company manufactures electrical products like low and medium voltage equipment 63 81 7 9
Revenues (| crore) PAT (| crore)
Source: Company, ICICIdirect.com Research
Some improvement visible in international operations
L&T has exhibited 24% CAGR in order inflows from the Middle East over FY09-11. Even in YTD FY12, L&T has secured orders worth | 7400 crore. YTDFY12 order inflows have already surpassed that of FY11 (~| 6400 crore. Middle East orders comprise 15% of total order inflows in YTDFY12 vs. 8% share in FY09. Even in order backlog, the share of these orders has risen from 8% in FY09 to 10% in YTDFY12.
Exhibit 45: Share in overall order inflows at record highs…
4128
2784
6382
7412
0
1000
2000
3000
4000
5000
6000
7000
8000
FY09 FY10 FY11 YTDFY12
(| c
rore
) .
0
2
4
6
8
10
12
14
16
(%)
.
Order Inflows Share in overall order inflows (%)
Source: Company, ICICIdirect.com Research
Exhibit 46: … even share in backlog is robust.
8
46
10
0
2
4
6
8
10
12
FY09 FY10 FY11 YTDFY12
(%)
.
Source: Company, ICICIdirect.com Research
Page 17ICICI Securities Ltd | Retail Equity Research
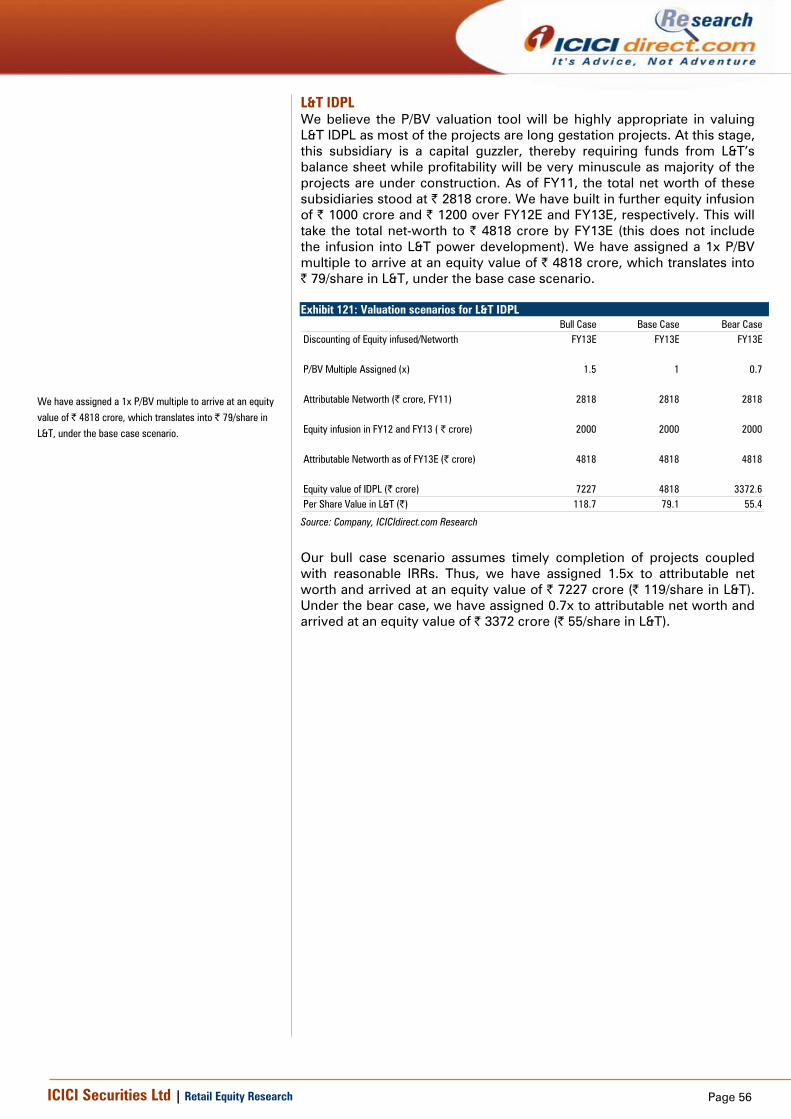
…b) Traction in captive orders: L&T IDPL enhancing portfolio… L&T is also aiming to house significant infrastructure assets portfolio via its subsidiary L&T IDPL, which houses about 17 projects costing over | 75500 crore. Given the backward integration of L&T (strong EPC business), ordering for the developmental assets do come to the base business, thereby proving a good opportunity for the base business. As of YTDFY12, in-house orders contributed 14% of the overall backlog and commanded ~13% of the order inflows in Q3DY12. Going ahead, many infrastructure projects (mainly in power T&D, roads and Railways) will be ordered out on a BOT basis, where L&T will be a key bidder. Hence, this will provide visibility to the base business in terms of securing further in-house orders from L&T IDPL. Exhibit 47: Share of In house orders in backlog and order inflows
0
5
10
15
20
FY08
FY09
Q1FY
10
Q2FY
10
Q3FY
10
Q4FY
10
Q1FY
11
Q2FY
11
Q3FY
11
Q4FY
11
Q1FY
12
Q2FY
12
Q3FY
12
(%)
.
0
10
20
30
40
(%)
.
Share in order backlog Share in order inflows(RHS)
Source: Company, ICICIdirect.com Research
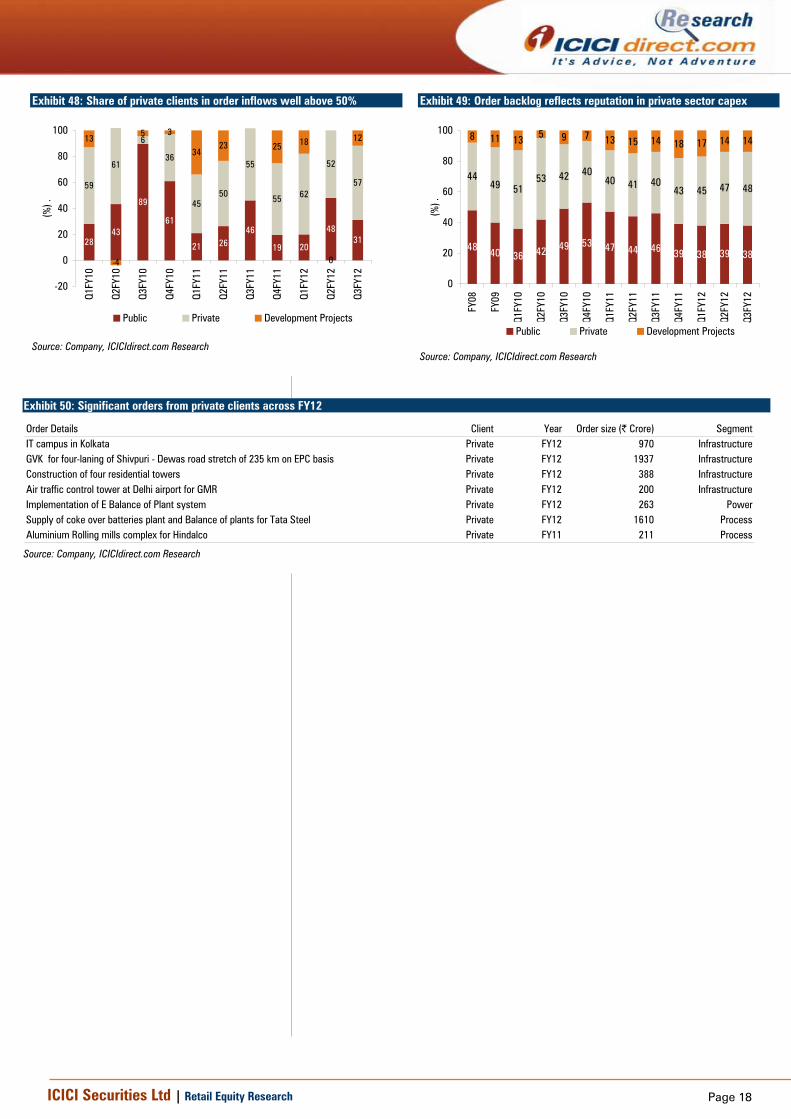
…c) Preferred bidder in complex private sector projects
Another reason why L&T‘s sensitivity to macro variables has relatively come down may be due to the fact that in large complex negotiated orders, L&T scores well above its peers as L&T has robust execution skills, an integrated business model and timely delivery schedules to handle large complex projects as private sector projects are more time bound ones. This is clearly visible in the private clients’ share in order inflows over FY10-YTDFY12 as the average share during the period stood at 50%. Even in the backlog, average share of private clients stood at 45% over FY08-YTDFY12.
Opportunities in India’s five year plan also will help L&T, going ahead, as private sector participation in the Eleventh and Twelfth Five Year Plan is expected to rise to 33% and 50%, respectively. Hence, we believe once the tough macro conditions trough and private sector capex resumes, L&T will benefit immensely from the same.
L&T scores well above its peers in private sector orders as
it has robust execution skills, an integrated business model
and timely delivery schedules to handle large complex projects as the same are more time bound projects
Page 18ICICI Securities Ltd | Retail Equity Research
Exhibit 48: Share of private clients in order inflows well above 50%
2843
89
61
21 2646
19 20
4831
59
61
6
36
4550
55
55 62
52
57
13
-4
5 3
3423 25 18
0
12
-20
0
20
40
60
80
100
Q1FY
10
Q2FY
10
Q3FY
10
Q4FY
10
Q1FY
11
Q2FY
11
Q3FY
11
Q4FY
11
Q1FY
12
Q2FY
12
Q3FY
12
(%) .
Public Private Development Projects
Source: Company, ICICIdirect.com Research
Exhibit 49: Order backlog reflects reputation in private sector capex
48 40 36 42 49 53 47 44 46 39 38 39 38
4449 51
53 42 4040 41 40
43 45 47 48
8 11 13 5 9 7 13 15 14 18 17 14 14
0
20
40
60
80
100
FY08
FY09
Q1FY
10
Q2FY
10
Q3FY
10
Q4FY
10
Q1FY
11
Q2FY
11
Q3FY
11
Q4FY
11
Q1FY
12
Q2FY
12
Q3FY
12
(%) .
Public Private Development Projects
Source: Company, ICICIdirect.com Research
Exhibit 50: Significant orders from private clients across FY12
Order Details Client Year Order size (| Crore) SegmentIT campus in Kolkata Private FY12 970 InfrastructureGVK for four-laning of Shivpuri - Dewas road stretch of 235 km on EPC basis Private FY12 1937 InfrastructureConstruction of four residential towers Private FY12 388 InfrastructureAir traffic control tower at Delhi airport for GMR Private FY12 200 InfrastructureImplementation of E Balance of Plant system Private FY12 263 PowerSupply of coke over batteries plant and Balance of plants for Tata Steel Private FY12 1610 ProcessAluminium Rolling mills complex for Hindalco Private FY11 211 Process
Source: Company, ICICIdirect.com Research
Page 19ICICI Securities Ltd | Retail Equity Research
Opportunities exist; accompanied by some hurdles … We believe we are entering an environment wherein an interest rate cut cycle is about to commence and some movement in terms of policy initiatives are coming from the government (recent PMO directives to Coal India to sign FSAs with IPPs) that may lead to a gradual recovery in the investment cycle by H2FY13E. We believe this will help L&T’s business outlook. Even in the current environment, there are pockets of opportunities for L&T mainly across the infrastructure segment (roads, railways and urban infra) and power (transmission) where ordering is still happening and where L&T possesses requisite skills to capitalise on the same.
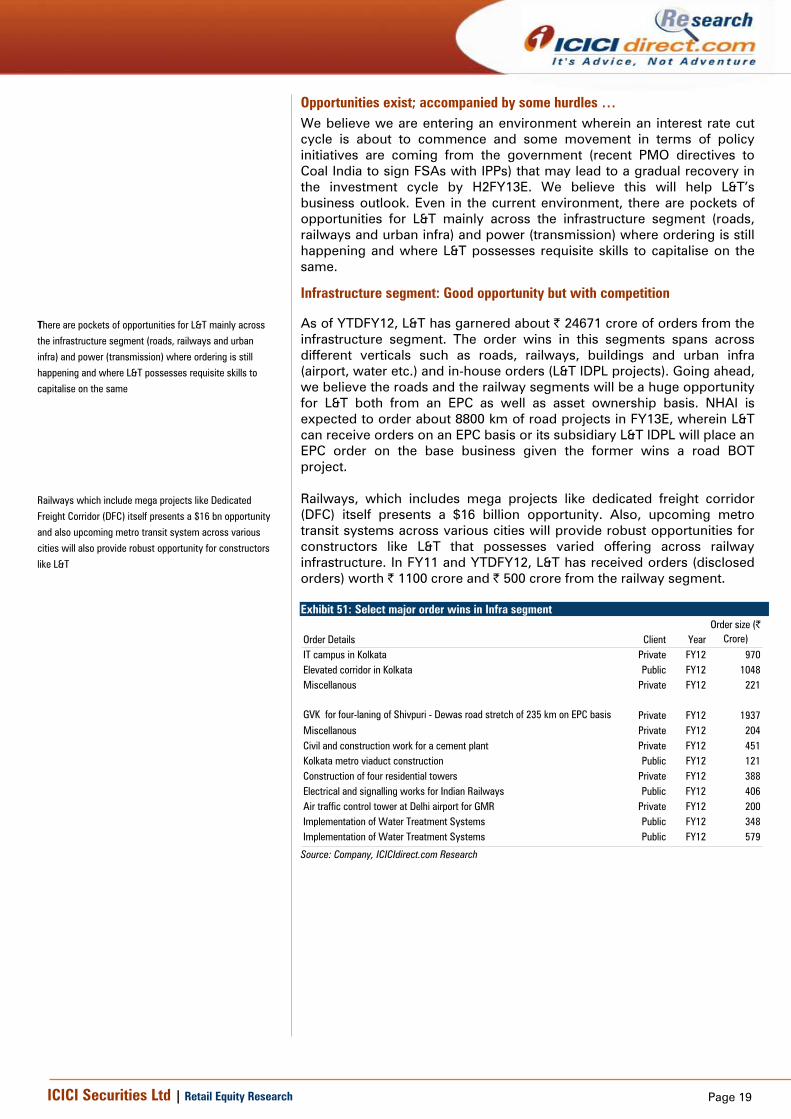
Infrastructure segment: Good opportunity but with competition
As of YTDFY12, L&T has garnered about | 24671 crore of orders from the infrastructure segment. The order wins in this segments spans across different verticals such as roads, railways, buildings and urban infra (airport, water etc.) and in-house orders (L&T IDPL projects). Going ahead, we believe the roads and the railway segments will be a huge opportunity for L&T both from an EPC as well as asset ownership basis. NHAI is expected to order about 8800 km of road projects in FY13E, wherein L&T can receive orders on an EPC basis or its subsidiary L&T IDPL will place an EPC order on the base business given the former wins a road BOT project. Railways, which includes mega projects like dedicated freight corridor (DFC) itself presents a $16 billion opportunity. Also, upcoming metro transit systems across various cities will provide robust opportunities for constructors like L&T that possesses varied offering across railway infrastructure. In FY11 and YTDFY12, L&T has received orders (disclosed orders) worth | 1100 crore and | 500 crore from the railway segment. Exhibit 51: Select major order wins in Infra segment
Order Details Client YearOrder size (|
Crore)IT campus in Kolkata Private FY12 970Elevated corridor in Kolkata Public FY12 1048Miscellanous Private FY12 221
GVK for four-laning of Shivpuri - Dewas road stretch of 235 km on EPC basis Private FY12 1937Miscellanous Private FY12 204Civil and construction work for a cement plant Private FY12 451Kolkata metro viaduct construction Public FY12 121Construction of four residential towers Private FY12 388Electrical and signalling works for Indian Railways Public FY12 406Air traffic control tower at Delhi airport for GMR Private FY12 200Implementation of Water Treatment Systems Public FY12 348Implementation of Water Treatment Systems Public FY12 579
Source: Company, ICICIdirect.com Research
There are pockets of opportunities for L&T mainly across
the infrastructure segment (roads, railways and urban
infra) and power (transmission) where ordering is still
happening and where L&T possesses requisite skills to capitalise on the same
Railways which include mega projects like Dedicated
Freight Corridor (DFC) itself presents a $16 bn opportunity
and also upcoming metro transit system across various
cities will also provide robust opportunity for constructors
like L&T
Page 20ICICI Securities Ltd | Retail Equity Research
Roads vertical: NHAI expected to award 8800 Kms of road projects in FY13E Exhibit 52: Ordering opportunity for L&T in the roads segment
Balance length for award - 420 2,572 3,023 1,000 659 276 12,250 19,924 - 20 20,220
percentage left for awarding - 6 21 47 100 94 71 83 41 - 1 40
NHDP Phase III
NHDP Phase V
NHDP Phase VI Others
PortConnectivityGQ Total by NHAI
NHDP Phase VII
NHDP
SARDP -NE
NHDP Phase IV
NHDP Total
NS -EW Ph. I & II
Source: NHAI, ICICIdirect.com Research
Exhibit 53: Road ordering by NHAI till FY13E
500
1500
2500
3500
4500
5500
6500
7500FY
07
FY08
FY09
FY10
FY11
FY12
E*
FY13
E**
(km
)
.
Source: NHAI, Budget Document, ICICIdirect.com Research. * Expected ordering in FY12E ** Ordering target for Fy13E
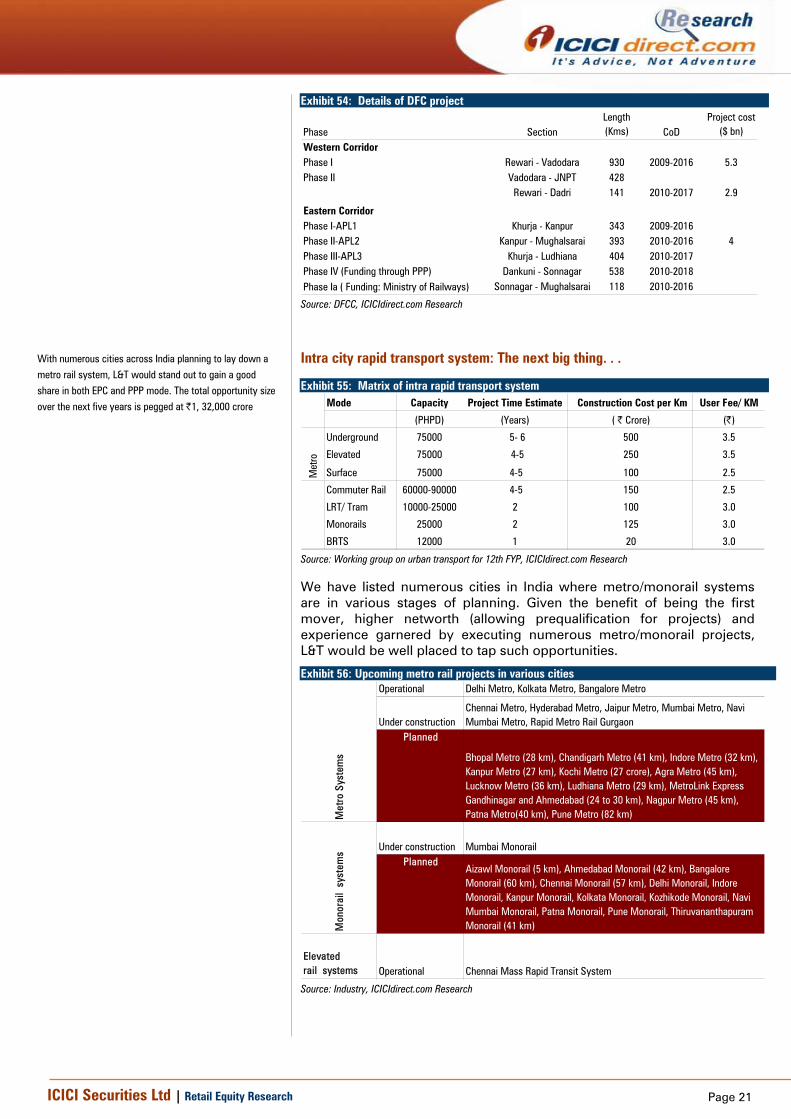
Dedicated Freight Corridor The dedicated freight corridor (DFC) is a mega project and the completion cost as per the business plan is | 77630 crore. Railways is expected to award 1,000 km route contracts for DFC in FY13 and work with respect of RFP and RFQ processes for phase 1 of the western and eastern corridor has already commenced. The completion of this project is expected to happen by 2017-2018.
The dedicated freight corridor (DFC) is a mega project and
the completion cost as per the Business Plan is | 77630
Crore. Railways is expected to award 1,000 km route
contracts for DFC in FY13
Page 21ICICI Securities Ltd | Retail Equity Research
Exhibit 54: Details of DFC project
Phase SectionLength (Kms) CoD
Project cost ($ bn)
Western CorridorPhase I Rewari - Vadodara 930 2009-2016 5.3Phase II Vadodara - JNPT 428
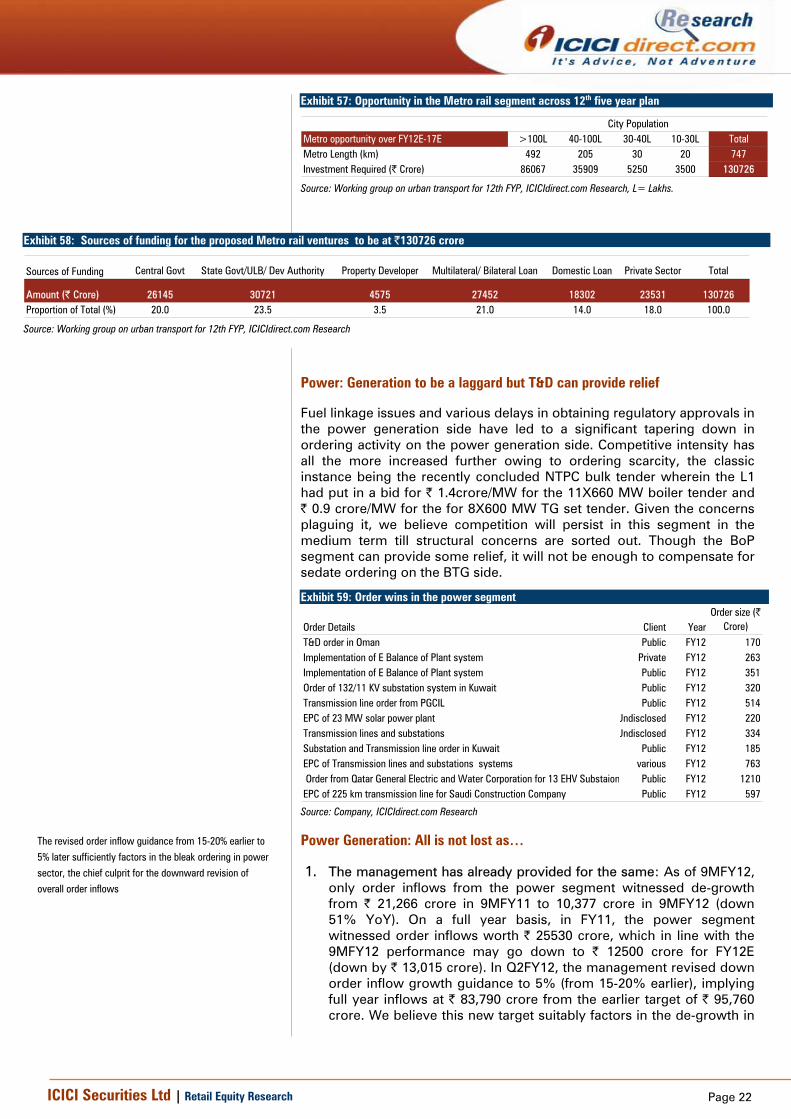
Intra city rapid transport system: The next big thing. . .
Exhibit 55: Matrix of intra rapid transport system Mode Capacity Project Time Estimate Construction Cost per Km User Fee/ KM
(PHPD) (Years) ( | Crore) (|)
Underground 75000 5- 6 500 3.5
Elevated 75000 4-5 250 3.5
Surface 75000 4-5 100 2.5
Commuter Rail 60000-90000 4-5 150 2.5
LRT/ Tram 10000-25000 2 100 3.0
Monorails 25000 2 125 3.0
BRTS 12000 1 20 3.0
Met
ro
Source: Working group on urban transport for 12th FYP, ICICIdirect.com Research
We have listed numerous cities in India where metro/monorail systems are in various stages of planning. Given the benefit of being the first mover, higher networth (allowing prequalification for projects) and experience garnered by executing numerous metro/monorail projects, L&T would be well placed to tap such opportunities.
Exhibit 56: Upcoming metro rail projects in various cities Operational
Under constructionPlanned
Under construction Mumbai MonorailPlanned
Elevated rail systems Operational Chennai Mass Rapid Transit System
Met
ro S
yste
ms
Mon
orai
l sy
stem
s
Delhi Metro, Kolkata Metro, Bangalore Metro
Chennai Metro, Hyderabad Metro, Jaipur Metro, Mumbai Metro, Navi Mumbai Metro, Rapid Metro Rail Gurgaon
Bhopal Metro (28 km), Chandigarh Metro (41 km), Indore Metro (32 km), Kanpur Metro (27 km), Kochi Metro (27 crore), Agra Metro (45 km), Lucknow Metro (36 km), Ludhiana Metro (29 km), MetroLink Express Gandhinagar and Ahmedabad (24 to 30 km), Nagpur Metro (45 km), Patna Metro(40 km), Pune Metro (82 km)
With numerous cities across India planning to lay down a metro rail system, L&T would stand out to gain a good share in both EPC and PPP mode. The total opportunity size over the next five years is pegged at |1, 32,000 crore
Page 22ICICI Securities Ltd | Retail Equity Research
Exhibit 57: Opportunity in the Metro rail segment across 12th five year plan
Source: Working group on urban transport for 12th FYP, ICICIdirect.com Research, L= Lakhs.
Exhibit 58: Sources of funding for the proposed Metro rail ventures to be at |130726 crore
Sources of Funding Central Govt State Govt/ULB/ Dev Authority Property Developer Multilateral/ Bilateral Loan Domestic Loan Private Sector Total
Amount (| Crore) 26145 30721 4575 27452 18302 23531 130726Proportion of Total (%) 20.0 23.5 3.5 21.0 14.0 18.0 100.0
Source: Working group on urban transport for 12th FYP, ICICIdirect.com Research
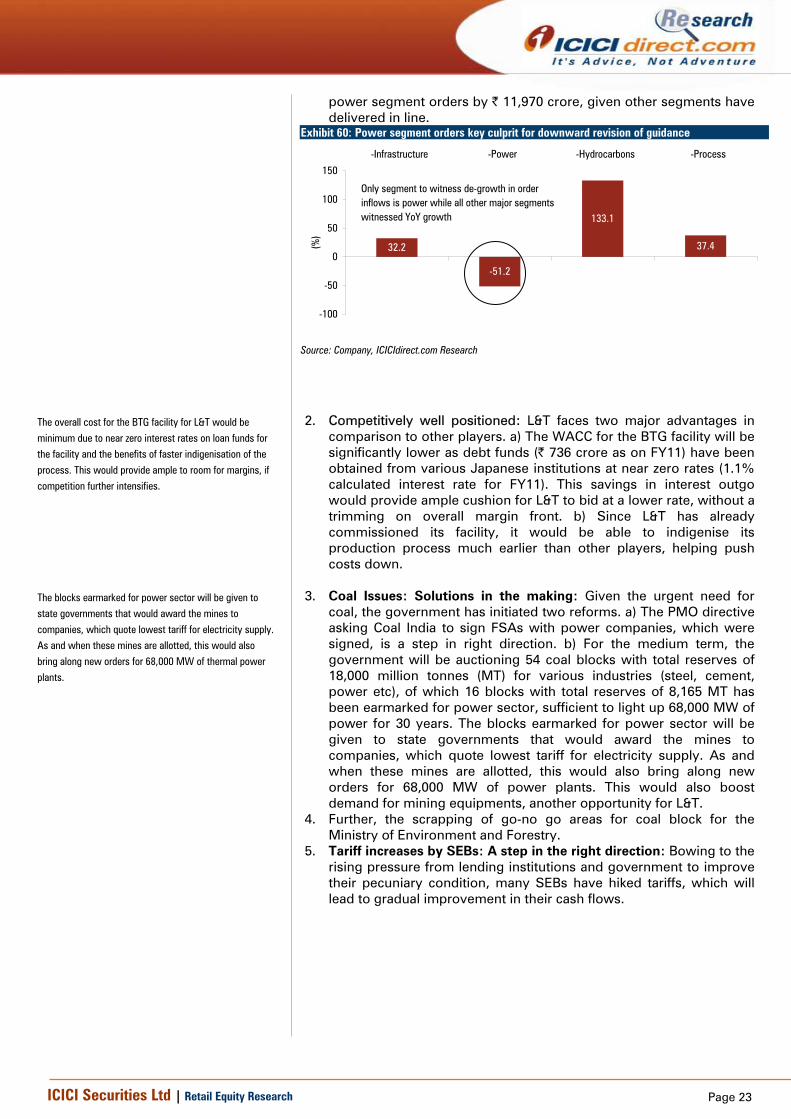
Power: Generation to be a laggard but T&D can provide relief
Fuel linkage issues and various delays in obtaining regulatory approvals in the power generation side have led to a significant tapering down in ordering activity on the power generation side. Competitive intensity has all the more increased further owing to ordering scarcity, the classic instance being the recently concluded NTPC bulk tender wherein the L1 had put in a bid for | 1.4crore/MW for the 11X660 MW boiler tender and | 0.9 crore/MW for the for 8X600 MW TG set tender. Given the concerns plaguing it, we believe competition will persist in this segment in the medium term till structural concerns are sorted out. Though the BoP segment can provide some relief, it will not be enough to compensate for sedate ordering on the BTG side.
Exhibit 59: Order wins in the power segment
Order Details Client YearOrder size (|
Crore)T&D order in Oman Public FY12 170Implementation of E Balance of Plant system Private FY12 263Implementation of E Balance of Plant system Public FY12 351Order of 132/11 KV substation system in Kuwait Public FY12 320Transmission line order from PGCIL Public FY12 514EPC of 23 MW solar power plant Undisclosed FY12 220Transmission lines and substations Undisclosed FY12 334Substation and Transmission line order in Kuwait Public FY12 185EPC of Transmission lines and substations systems various FY12 763 Order from Qatar General Electric and Water Corporation for 13 EHV Substaion Public FY12 1210EPC of 225 km transmission line for Saudi Construction Company Public FY12 597
Source: Company, ICICIdirect.com Research
Power Generation: All is not lost as…
1. The management has already provided for the same: As of 9MFY12, only order inflows from the power segment witnessed de-growth from | 21,266 crore in 9MFY11 to 10,377 crore in 9MFY12 (down 51% YoY). On a full year basis, in FY11, the power segment witnessed order inflows worth | 25530 crore, which in line with the 9MFY12 performance may go down to | 12500 crore for FY12E (down by | 13,015 crore). In Q2FY12, the management revised down order inflow growth guidance to 5% (from 15-20% earlier), implying full year inflows at | 83,790 crore from the earlier target of | 95,760 crore. We believe this new target suitably factors in the de-growth in
The revised order inflow guidance from 15-20% earlier to 5% later sufficiently factors in the bleak ordering in power sector, the chief culprit for the downward revision of overall order inflows
Page 23ICICI Securities Ltd | Retail Equity Research
power segment orders by | 11,970 crore, given other segments have delivered in line.
Exhibit 60: Power segment orders key culprit for downward revision of guidance
32.2
-51.2
133.1
37.4
-100
-50
0
50
100
150
-Infrastructure -Power -Hydrocarbons -Process
(%)
Only segment to witness de-growth in order inflows is power while all other major segments witnessed YoY growth
Source: Company, ICICIdirect.com Research
2. Competitively well positioned: L&T faces two major advantages in
comparison to other players. a) The WACC for the BTG facility will be significantly lower as debt funds (| 736 crore as on FY11) have been obtained from various Japanese institutions at near zero rates (1.1% calculated interest rate for FY11). This savings in interest outgo would provide ample cushion for L&T to bid at a lower rate, without a trimming on overall margin front. b) Since L&T has already commissioned its facility, it would be able to indigenise its production process much earlier than other players, helping push costs down.
3. Coal Issues: Solutions in the making: Given the urgent need for
coal, the government has initiated two reforms. a) The PMO directive asking Coal India to sign FSAs with power companies, which were signed, is a step in right direction. b) For the medium term, the government will be auctioning 54 coal blocks with total reserves of 18,000 million tonnes (MT) for various industries (steel, cement, power etc), of which 16 blocks with total reserves of 8,165 MT has been earmarked for power sector, sufficient to light up 68,000 MW of power for 30 years. The blocks earmarked for power sector will be given to state governments that would award the mines to companies, which quote lowest tariff for electricity supply. As and when these mines are allotted, this would also bring along new orders for 68,000 MW of power plants. This would also boost demand for mining equipments, another opportunity for L&T.
4. Further, the scrapping of go-no go areas for coal block for the Ministry of Environment and Forestry.
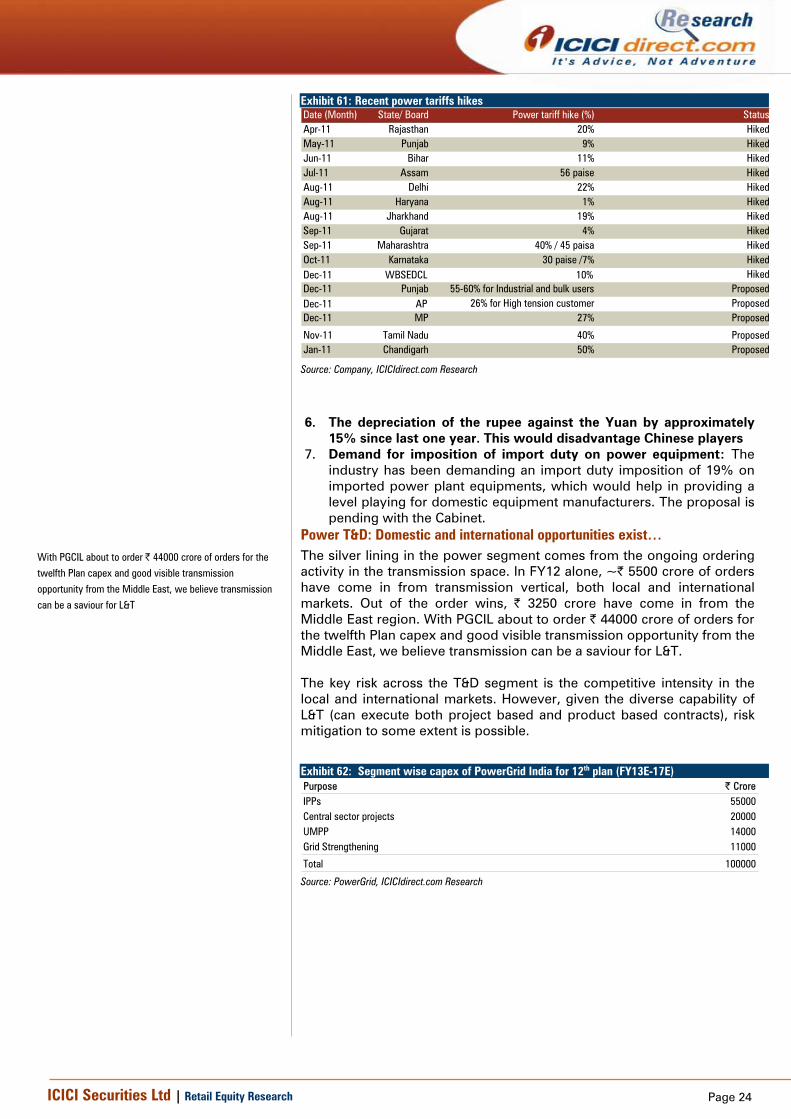
5. Tariff increases by SEBs: A step in the right direction: Bowing to the rising pressure from lending institutions and government to improve their pecuniary condition, many SEBs have hiked tariffs, which will lead to gradual improvement in their cash flows.
The overall cost for the BTG facility for L&T would be minimum due to near zero interest rates on loan funds for the facility and the benefits of faster indigenisation of the process. This would provide ample to room for margins, if competition further intensifies.
The blocks earmarked for power sector will be given to state governments that would award the mines to companies, which quote lowest tariff for electricity supply. As and when these mines are allotted, this would also bring along new orders for 68,000 MW of thermal power plants.
Page 24ICICI Securities Ltd | Retail Equity Research
Exhibit 61: Recent power tariffs hikes Date (Month) State/ Board Power tariff hike (%) StatusApr-11 Rajasthan 20% HikedMay-11 Punjab 9% HikedJun-11 Bihar 11% HikedJul-11 Assam 56 paise HikedAug-11 Delhi 22% HikedAug-11 Haryana 1% HikedAug-11 Jharkhand 19% HikedSep-11 Gujarat 4% HikedSep-11 Maharashtra 40% / 45 paisa HikedOct-11 Karnataka 30 paise /7% HikedDec-11 WBSEDCL 10% HikedDec-11 Punjab 55-60% for Industrial and bulk users ProposedDec-11 AP 26% for High tension customer ProposedDec-11 MP 27% Proposed
Nov-11 Tamil Nadu 40% ProposedJan-11 Chandigarh 50% Proposed
Source: Company, ICICIdirect.com Research
6. The depreciation of the rupee against the Yuan by approximately
15% since last one year. This would disadvantage Chinese players 7. Demand for imposition of import duty on power equipment: The
industry has been demanding an import duty imposition of 19% on imported power plant equipments, which would help in providing a level playing for domestic equipment manufacturers. The proposal is pending with the Cabinet.
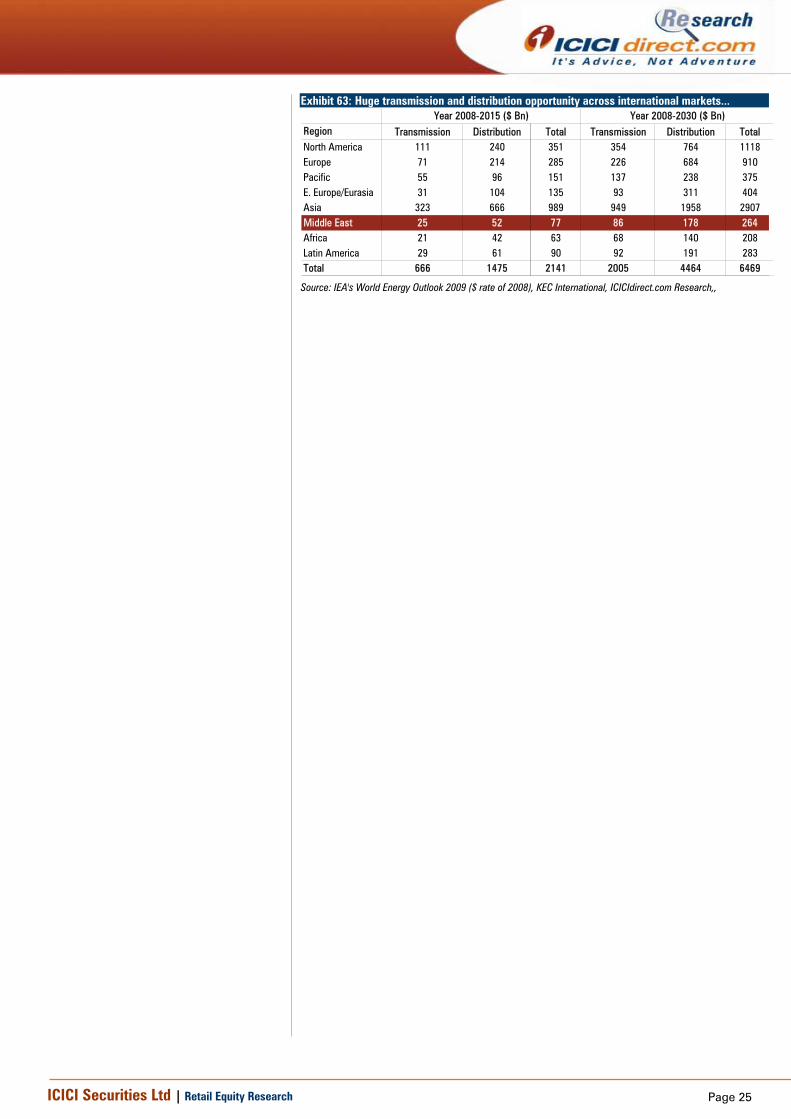
Power T&D: Domestic and international opportunities exist… The silver lining in the power segment comes from the ongoing ordering activity in the transmission space. In FY12 alone, ~| 5500 crore of orders have come in from transmission vertical, both local and international markets. Out of the order wins, | 3250 crore have come in from the Middle East region. With PGCIL about to order | 44000 crore of orders for the twelfth Plan capex and good visible transmission opportunity from the Middle East, we believe transmission can be a saviour for L&T. The key risk across the T&D segment is the competitive intensity in the local and international markets. However, given the diverse capability of L&T (can execute both project based and product based contracts), risk mitigation to some extent is possible.
Exhibit 62: Segment wise capex of PowerGrid India for 12th plan (FY13E-17E) Purpose | CroreIPPs 55000Central sector projects 20000UMPP 14000Grid Strengthening 11000
Total 100000
Source: PowerGrid, ICICIdirect.com Research
With PGCIL about to order | 44000 crore of orders for the
twelfth Plan capex and good visible transmission
opportunity from the Middle East, we believe transmission
can be a saviour for L&T
Page 25ICICI Securities Ltd | Retail Equity Research
Exhibit 63: Huge transmission and distribution opportunity across international markets...
Region Transmission Distribution Total Transmission Distribution TotalNorth America 111 240 351 354 764 1118Europe 71 214 285 226 684 910Pacific 55 96 151 137 238 375E. Europe/Eurasia 31 104 135 93 311 404Asia 323 666 989 949 1958 2907Middle East 25 52 77 86 178 264Africa 21 42 63 68 140 208Latin America 29 61 90 92 191 283Total 666 1475 2141 2005 4464 6469
Year 2008-2015 ($ Bn) Year 2008-2030 ($ Bn)
Source: IEA's World Energy Outlook 2009 ($ rate of 2008), KEC International, ICICIdirect.com Research,,
Page 26ICICI Securities Ltd | Retail Equity Research
Hydrocarbons: Velocity of capex from public enterprises the key In the hydrocarbon space, YTD FY12 L&T has secured orders worth | 6500 crore in the hydrocarbon space. Out of these, 77% of the inflows came in from the Middle East markets. Going ahead, ONGC has planned a capex of | 65000 crore in the Twelfth plan and about ~| 25000 crore opportunity is feasible from Saudi Arabia, thereby proving scope to L&T in this segment. The capex in this segment is mainly committed by government agencies and velocity of project movement/ordering will hold the key, going ahead.
Exhibit 64: Order wins in hydrocarbons space
Order Details Client YearOrder size (|
Crore)
Order from Petroleum Development Oman, LLC for 3 MMSCMD grenfield gas project Public FY12 700EPC of 123 km pipleline order from GASCO: Abu Dhabhi, Public FY12 $189 mnOrder for four wellhead towers and one mainhead tower platform from ADNOC, UAE Public FY12 $450 mn Order for three wellhead and associated works for PTT Public Ltd Co Public FY12 $250 mnOffshore platform contract from Gujarat State Petroleum Co Public FY12 1450Additional processing units for gas proessing for ONGC Public FY11 1195Offshore platform contract from Gujarat State Petroleum Corp Public FY11 1060
Source: Company, ICICIdirect.com Research
Exhibit 65: Capex plan of ONGC across the 12th five year plan (FY13E-FY17E) Particulars (| crore) FY13 BE FY14 STP FY15 STP FY16 STP FY17 STP Total 12th PlanSurvey 1,720 2,467 889 662 556 6,293 Exploratory drilling 7,667 10,918 9,648 8,242 8,187 44,662 Development drilling 5,831 8,058 6,472 3,245 2,899 26,505 Capital Projects 15,607 13,317 1,553 17,207 17,581 65,264 R&D & Institutes 246 410 430 452 17,581 19,118
Source: ONGC, ICICIdirect.com Research
Exhibit 66: Hydrocarbon opportunity in Saudi Arabia till 2024
2525933561
48668
0
10000
20000
30000
40000
50000
60000
2014 2019 2024
(| C
rore
)
Source: Ministry of Economy and Planning (Kingdom of Saudi Arabia), ICICIdirect.com Research
Going ahead, ONGC has planned a capex of | 65000 crore
in the Twelfth Plan and about ~|25000 crore opportunity
is feasible from Saudi Arabia, thereby proving scope to L&T
in the hydrocarbon segment
Page 27ICICI Securities Ltd | Retail Equity Research
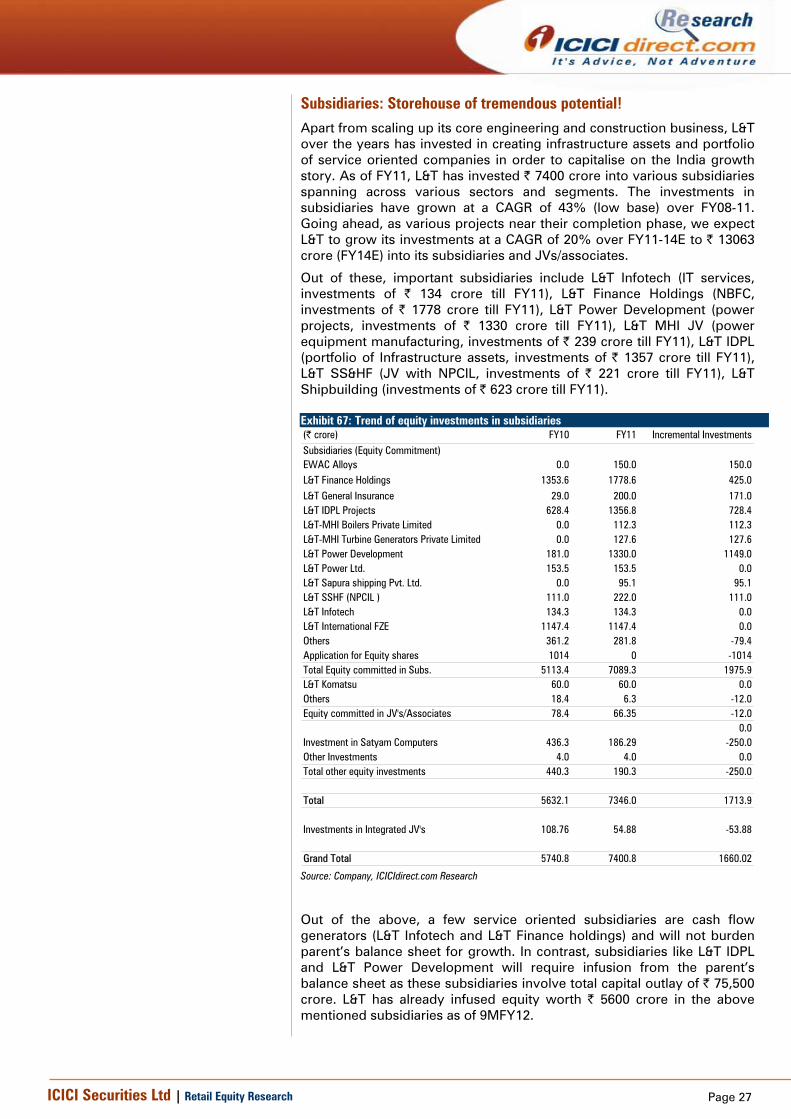
Subsidiaries: Storehouse of tremendous potential!
Apart from scaling up its core engineering and construction business, L&T over the years has invested in creating infrastructure assets and portfolio of service oriented companies in order to capitalise on the India growth story. As of FY11, L&T has invested | 7400 crore into various subsidiaries spanning across various sectors and segments. The investments in subsidiaries have grown at a CAGR of 43% (low base) over FY08-11. Going ahead, as various projects near their completion phase, we expect L&T to grow its investments at a CAGR of 20% over FY11-14E to | 13063 crore (FY14E) into its subsidiaries and JVs/associates.
Out of these, important subsidiaries include L&T Infotech (IT services, investments of | 134 crore till FY11), L&T Finance Holdings (NBFC, investments of | 1778 crore till FY11), L&T Power Development (power projects, investments of | 1330 crore till FY11), L&T MHI JV (power equipment manufacturing, investments of | 239 crore till FY11), L&T IDPL (portfolio of Infrastructure assets, investments of | 1357 crore till FY11), L&T SS&HF (JV with NPCIL, investments of | 221 crore till FY11), L&T Shipbuilding (investments of | 623 crore till FY11). Exhibit 67: Trend of equity investments in subsidiaries (| crore) FY10 FY11 Incremental InvestmentsSubsidiaries (Equity Commitment)EWAC Alloys 0.0 150.0 150.0L&T Finance Holdings 1353.6 1778.6 425.0L&T General Insurance 29.0 200.0 171.0L&T IDPL Projects 628.4 1356.8 728.4L&T-MHI Boilers Private Limited 0.0 112.3 112.3L&T-MHI Turbine Generators Private Limited 0.0 127.6 127.6L&T Power Development 181.0 1330.0 1149.0L&T Power Ltd. 153.5 153.5 0.0L&T Sapura shipping Pvt. Ltd. 0.0 95.1 95.1L&T SSHF (NPCIL ) 111.0 222.0 111.0L&T Infotech 134.3 134.3 0.0L&T International FZE 1147.4 1147.4 0.0Others 361.2 281.8 -79.4Application for Equity shares 1014 0 -1014Total Equity committed in Subs. 5113.4 7089.3 1975.9L&T Komatsu 60.0 60.0 0.0Others 18.4 6.3 -12.0Equity committed in JV's/Associates 78.4 66.35 -12.0
0.0Investment in Satyam Computers 436.3 186.29 -250.0Other Investments 4.0 4.0 0.0Total other equity investments 440.3 190.3 -250.0
Total 5632.1 7346.0 1713.9
Investments in Integrated JV's 108.76 54.88 -53.88
Grand Total 5740.8 7400.8 1660.02
Source: Company, ICICIdirect.com Research
Out of the above, a few service oriented subsidiaries are cash flow generators (L&T Infotech and L&T Finance holdings) and will not burden parent’s balance sheet for growth. In contrast, subsidiaries like L&T IDPL and L&T Power Development will require infusion from the parent’s balance sheet as these subsidiaries involve total capital outlay of | 75,500 crore. L&T has already infused equity worth | 5600 crore in the above mentioned subsidiaries as of 9MFY12.
Page 28ICICI Securities Ltd | Retail Equity Research
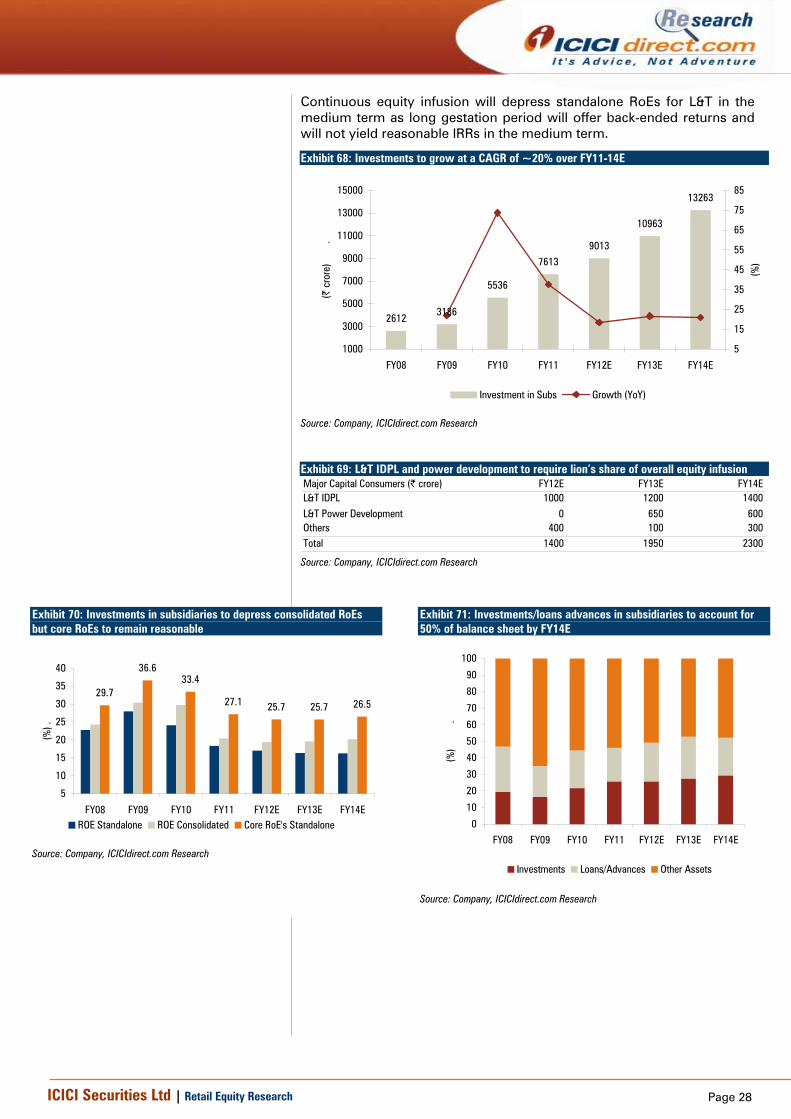
Continuous equity infusion will depress standalone RoEs for L&T in the medium term as long gestation period will offer back-ended returns and will not yield reasonable IRRs in the medium term.
Exhibit 68: Investments to grow at a CAGR of ~20% over FY11-14E
26123186
5536
76139013
10963
13263
1000
3000
5000
7000
9000
11000
13000
15000
FY08 FY09 FY10 FY11 FY12E FY13E FY14E
(| c
rore
)
.
5
15
25
35
45
55
65
75
85
(%)
Investment in Subs Growth (YoY)
Source: Company, ICICIdirect.com Research
Exhibit 69: L&T IDPL and power development to require lion’s share of overall equity infusion Major Capital Consumers (| crore) FY12E FY13E FY14EL&T IDPL 1000 1200 1400L&T Power Development 0 650 600Others 400 100 300Total 1400 1950 2300
Source: Company, ICICIdirect.com Research
Exhibit 70: Investments in subsidiaries to depress consolidated RoEs but core RoEs to remain reasonable
Exhibit 71: Investments/loans advances in subsidiaries to account for 50% of balance sheet by FY14E
0
10
20
30
40
50
60
70
80
90
100
FY08 FY09 FY10 FY11 FY12E FY13E FY14E
(%)
.
Investments Loans/Advances Other Assets
Source: Company, ICICIdirect.com Research
Page 29ICICI Securities Ltd | Retail Equity Research
L&T Finance Holdings: (post IPO no more dependent on parent for equity)
L&T Finance houses two NBFCs i.e. L&T Finance and L&T Infra Finance. The former caters to segment like corporate and retail financing (these include construction & transportation equipment finance, microfinance, corporate loans & lease, supply chain finance and capital market finance), asset backed finance and also houses a mutual fund unit (L&T MF). The latter focuses on project finance and advisory.
Over FY08-FY11, the subsidiary has grown its asset base at a CAGR of 52%. Given the moderation in the economy, we expect the growth rate to moderate. Hence, we have modelled in a business CAGR of 32% over FY11-14E. We expect NIMs to moderate owing to the overall slowdown and rise in borrowing costs to 5.8% in FY13E from 7.2%. Hence, PAT is expected to grow at a CAGR of 27% over FY11-14E due to a moderation in core business and rise in provisions on the assets. In our view, L&T has the lever to increase its RoEs, which is expected at 14.8% in FY14E on the back of rising leverage (comfortable at 6x in FY12E and 7.8x in FY14E).
L&T Finance Holding’s net interest income (NII) will contribute about 2.3% and 2.5% to the overall consolidated revenues in FY13E and FY14E.
Exhibit 72: CAGR of 32% in overall business (FY11-14E)….
2000
12000
22000
32000
42000
52000
62000
72000
82000
FY10 FY11 FY12E FY13E FY14E
(| c
rore
)
.
Loans Borrowings Business
Source: Company, ICICIdirect.com Research
Exhibit 73: … to drive NII and PAT growth (FY11-FY14E)
0
500
1000
1500
2000
2500
FY10 FY11 FY12E FY13E FY14E
(| c
rore
)
.
NII PPP PAT
Source: Company, ICICIdirect.com Research
Exhibit 74: Pick-up in leverage to improve RoEs by 210 bps over FY12E-14E
6.06.8
6.06.9
7.6
2.6 2.5 2.02.02.01
2
3
4
5
6
7
8
FY10 FY11 FY12E FY13E FY14E
(X)
0
5
10
15
20
25
(%)
Leverage ROA (RHS) ROE (RHS)
Source: Company, ICICIdirect.com Research
For L&T Finance Holdings, PAT is expected to grow at a
CAGR of 27% over FY11-14E due to moderation in core
business and rise in provisions on assets
In our view, L&T has the lever to increase its RoEs, which
is expected at 14.8% in FY14E on the back of rising leverage (comfortable at 6x in FY12E and 7.8x in FY14E)
Page 30ICICI Securities Ltd | Retail Equity Research
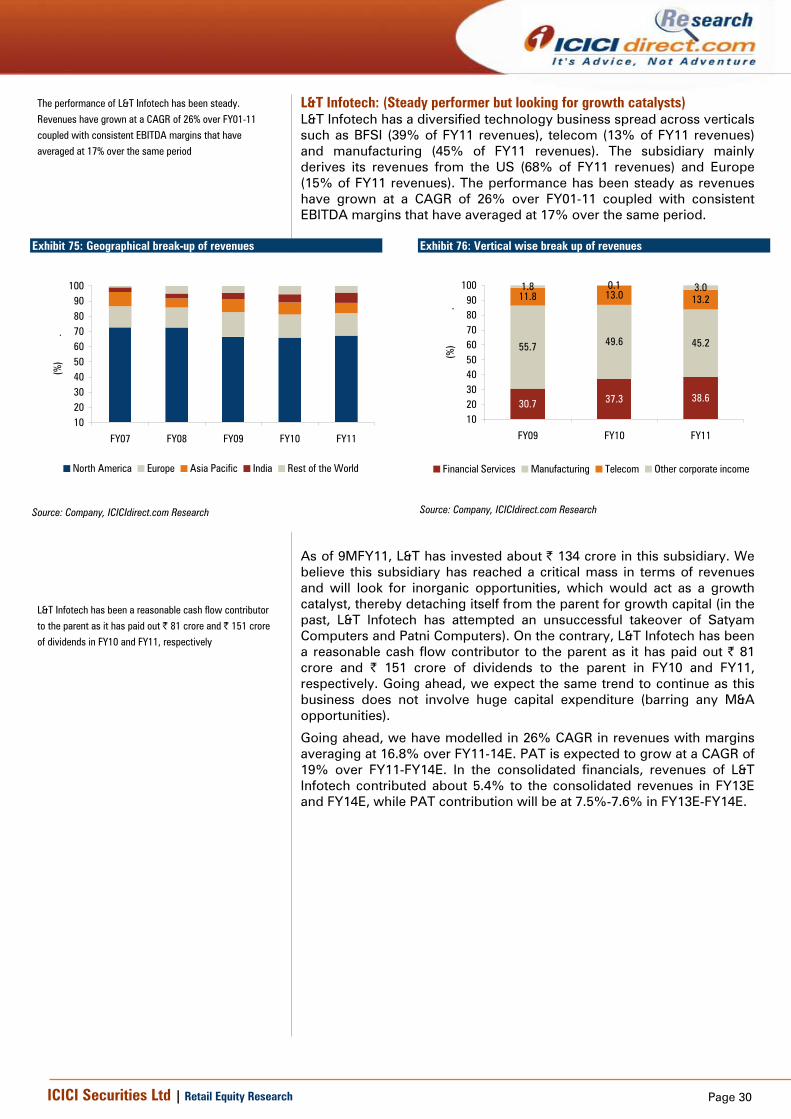
L&T Infotech: (Steady performer but looking for growth catalysts) L&T Infotech has a diversified technology business spread across verticals such as BFSI (39% of FY11 revenues), telecom (13% of FY11 revenues) and manufacturing (45% of FY11 revenues). The subsidiary mainly derives its revenues from the US (68% of FY11 revenues) and Europe (15% of FY11 revenues). The performance has been steady as revenues have grown at a CAGR of 26% over FY01-11 coupled with consistent EBITDA margins that have averaged at 17% over the same period.
Exhibit 75: Geographical break-up of revenues
102030405060708090
100
FY07 FY08 FY09 FY10 FY11
(%)
.
North America Europe Asia Pacific India Rest of the World
Source: Company, ICICIdirect.com Research
Exhibit 76: Vertical wise break up of revenues
30.7 37.3 38.6
55.7 49.6 45.2
11.8 13.0 13.21.8 0.1 3.0
102030405060708090
100
FY09 FY10 FY11(%
)
.
Financial Services Manufacturing Telecom Other corporate income
Source: Company, ICICIdirect.com Research
As of 9MFY11, L&T has invested about | 134 crore in this subsidiary. We believe this subsidiary has reached a critical mass in terms of revenues and will look for inorganic opportunities, which would act as a growth catalyst, thereby detaching itself from the parent for growth capital (in the past, L&T Infotech has attempted an unsuccessful takeover of Satyam Computers and Patni Computers). On the contrary, L&T Infotech has been a reasonable cash flow contributor to the parent as it has paid out | 81 crore and | 151 crore of dividends to the parent in FY10 and FY11, respectively. Going ahead, we expect the same trend to continue as this business does not involve huge capital expenditure (barring any M&A opportunities).
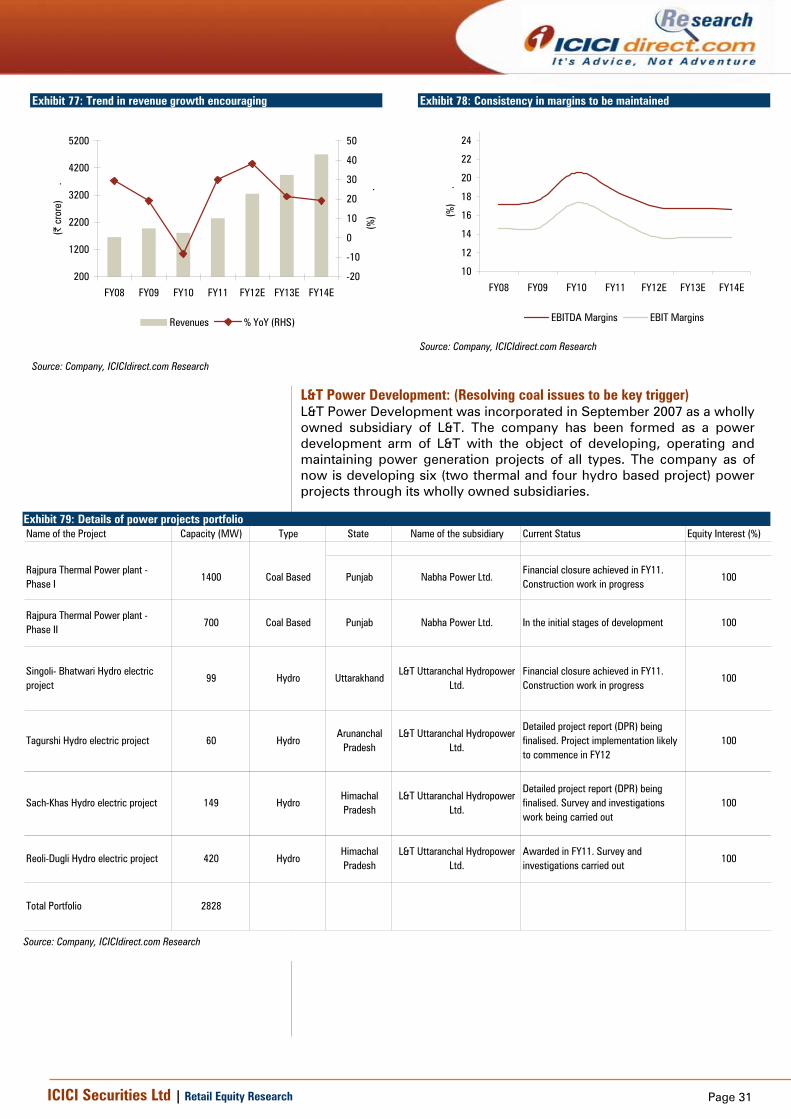
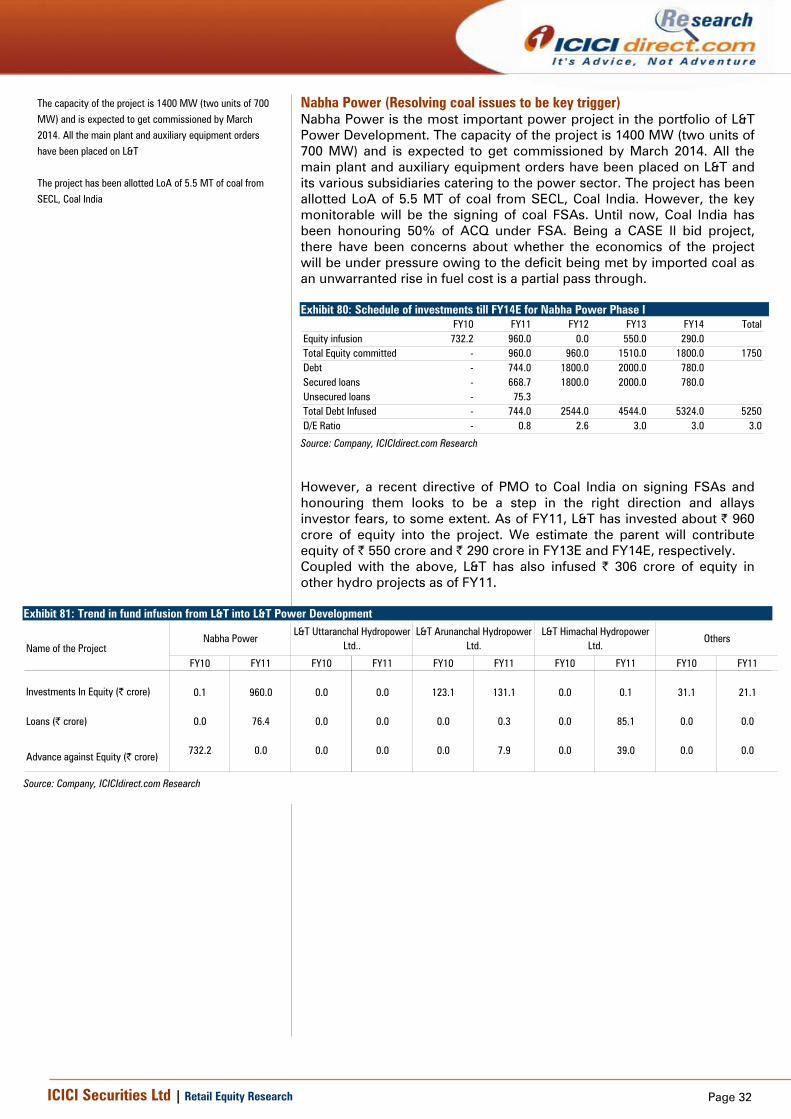
Going ahead, we have modelled in 26% CAGR in revenues with margins averaging at 16.8% over FY11-14E. PAT is expected to grow at a CAGR of 19% over FY11-FY14E. In the consolidated financials, revenues of L&T Infotech contributed about 5.4% to the consolidated revenues in FY13E and FY14E, while PAT contribution will be at 7.5%-7.6% in FY13E-FY14E.
The performance of L&T Infotech has been steady. Revenues have grown at a CAGR of 26% over FY01-11 coupled with consistent EBITDA margins that have averaged at 17% over the same period
L&T Infotech has been a reasonable cash flow contributor
to the parent as it has paid out | 81 crore and | 151 crore
of dividends in FY10 and FY11, respectively
Page 31ICICI Securities Ltd | Retail Equity Research
Exhibit 77: Trend in revenue growth encouraging
200
1200
2200
3200
4200
5200
FY08 FY09 FY10 FY11 FY12E FY13E FY14E
(| c
rore
)
.
-20
-10
0
10
20
30
40
50
(%)
.
Revenues % YoY (RHS)
Source: Company, ICICIdirect.com Research
Exhibit 78: Consistency in margins to be maintained
10
12
14
16
18
20
22
24
FY08 FY09 FY10 FY11 FY12E FY13E FY14E
(%)
.
EBITDA Margins EBIT Margins
Source: Company, ICICIdirect.com Research
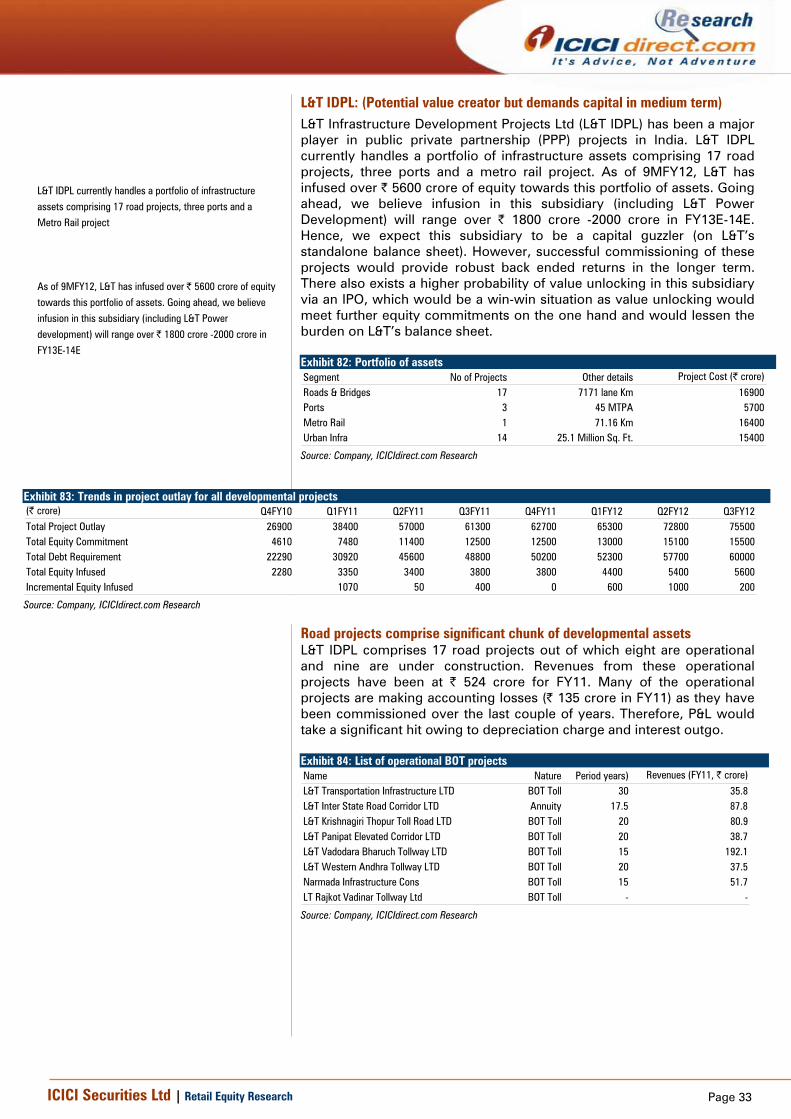
L&T Power Development: (Resolving coal issues to be key trigger) L&T Power Development was incorporated in September 2007 as a wholly owned subsidiary of L&T. The company has been formed as a power development arm of L&T with the object of developing, operating and maintaining power generation projects of all types. The company as of now is developing six (two thermal and four hydro based project) power projects through its wholly owned subsidiaries.
Exhibit 79: Details of power projects portfolio Name of the Project Capacity (MW) Type State Name of the subsidiary Current Status Equity Interest (%)
Rajpura Thermal Power plant - Phase I
1400 Coal Based Punjab Nabha Power Ltd.Financial closure achieved in FY11. Construction work in progress
Rajpura Thermal Power plant - Phase II
700 Coal Based Punjab Nabha Power Ltd. In the initial stages of development
Singoli- Bhatwari Hydro electric project
99 Hydro UttarakhandL&T Uttaranchal Hydropower
Ltd.Financial closure achieved in FY11. Construction work in progress
Detailed project report (DPR) being finalised. Project implementation likely to commence in FY12
L&T Uttaranchal Hydropower Ltd.
Arunanchal Pradesh
Hydro60Tagurshi Hydro electric project
Awarded in FY11. Survey and investigations carried out
L&T Uttaranchal Hydropower Ltd.
Sach-Khas Hydro electric project 149 HydroHimachal Pradesh
Himachal Pradesh
Hydro420Reoli-Dugli Hydro electric project
Total Portfolio 2828
100
100
100
100
100
100
L&T Uttaranchal Hydropower Ltd.
Detailed project report (DPR) being finalised. Survey and investigations work being carried out
Source: Company, ICICIdirect.com Research
Page 32ICICI Securities Ltd | Retail Equity Research
Nabha Power (Resolving coal issues to be key trigger) Nabha Power is the most important power project in the portfolio of L&T Power Development. The capacity of the project is 1400 MW (two units of 700 MW) and is expected to get commissioned by March 2014. All the main plant and auxiliary equipment orders have been placed on L&T and its various subsidiaries catering to the power sector. The project has been allotted LoA of 5.5 MT of coal from SECL, Coal India. However, the key monitorable will be the signing of coal FSAs. Until now, Coal India has been honouring 50% of ACQ under FSA. Being a CASE II bid project, there have been concerns about whether the economics of the project will be under pressure owing to the deficit being met by imported coal as an unwarranted rise in fuel cost is a partial pass through. Exhibit 80: Schedule of investments till FY14E for Nabha Power Phase I
However, a recent directive of PMO to Coal India on signing FSAs and honouring them looks to be a step in the right direction and allays investor fears, to some extent. As of FY11, L&T has invested about | 960 crore of equity into the project. We estimate the parent will contribute equity of | 550 crore and | 290 crore in FY13E and FY14E, respectively. Coupled with the above, L&T has also infused | 306 crore of equity in other hydro projects as of FY11.
Exhibit 81: Trend in fund infusion from L&T into L&T Power Development
Name of the ProjectFY10 FY11 FY10 FY11 FY10 FY11 FY10 FY11 FY10 FY11
The capacity of the project is 1400 MW (two units of 700 MW) and is expected to get commissioned by March 2014. All the main plant and auxiliary equipment orders have been placed on L&T The project has been allotted LoA of 5.5 MT of coal from SECL, Coal India
Page 33ICICI Securities Ltd | Retail Equity Research
L&T IDPL: (Potential value creator but demands capital in medium term)
L&T Infrastructure Development Projects Ltd (L&T IDPL) has been a major player in public private partnership (PPP) projects in India. L&T IDPL currently handles a portfolio of infrastructure assets comprising 17 road projects, three ports and a metro rail project. As of 9MFY12, L&T has infused over | 5600 crore of equity towards this portfolio of assets. Going ahead, we believe infusion in this subsidiary (including L&T Power Development) will range over | 1800 crore -2000 crore in FY13E-14E. Hence, we expect this subsidiary to be a capital guzzler (on L&T’s standalone balance sheet). However, successful commissioning of these projects would provide robust back ended returns in the longer term. There also exists a higher probability of value unlocking in this subsidiary via an IPO, which would be a win-win situation as value unlocking would meet further equity commitments on the one hand and would lessen the burden on L&T’s balance sheet. Exhibit 82: Portfolio of assets Segment No of Projects Other details Project Cost (| crore)Roads & Bridges 17 7171 lane Km 16900Ports 3 45 MTPA 5700Metro Rail 1 71.16 Km 16400Urban Infra 14 25.1 Million Sq. Ft. 15400
Road projects comprise significant chunk of developmental assets L&T IDPL comprises 17 road projects out of which eight are operational and nine are under construction. Revenues from these operational projects have been at | 524 crore for FY11. Many of the operational projects are making accounting losses (| 135 crore in FY11) as they have been commissioned over the last couple of years. Therefore, P&L would take a significant hit owing to depreciation charge and interest outgo. Exhibit 84: List of operational BOT projects Name Nature Period years) Revenues (FY11, | crore)L&T Transportation Infrastructure LTD BOT Toll 30 35.8L&T Inter State Road Corridor LTD Annuity 17.5 87.8L&T Krishnagiri Thopur Toll Road LTD BOT Toll 20 80.9L&T Panipat Elevated Corridor LTD BOT Toll 20 38.7L&T Vadodara Bharuch Tollway LTD BOT Toll 15 192.1L&T Western Andhra Tollway LTD BOT Toll 20 37.5Narmada Infrastructure Cons BOT Toll 15 51.7LT Rajkot Vadinar Tollway Ltd BOT Toll - -
Source: Company, ICICIdirect.com Research
L&T IDPL currently handles a portfolio of infrastructure assets comprising 17 road projects, three ports and a Metro Rail project As of 9MFY12, L&T has infused over | 5600 crore of equity
towards this portfolio of assets. Going ahead, we believe
infusion in this subsidiary (including L&T Power
development) will range over | 1800 crore -2000 crore in
FY13E-14E
Page 34ICICI Securities Ltd | Retail Equity Research
Exhibit 85: List of projects under construction Name Basis Expected CompletionL&T Krishnagiri Walahjahpet Tollway BOT Toll Nov-13L&T Devihall Hassan Tollway BOT Toll Jun-13L&T Ahmedabad Mallaya Tollway BOT Toll FY13L&T Halol Shamlaji Tollway BOT Toll FY13L&T Chennai Tada Tollway BOT Toll Feb-12L&T Samakhaiall Gandhiam Tollway BOT Toll Feb-13PNG Tollway BOT Toll Jan-12Pindhwara- Rajasthan BOT Toll -
Source: Company, ICICIdirect.com Research
The segment does offer robust opportunities but L&T has to watch for the following factors:
• Competitive intensity on the rise: Bidding in road projects during the last couple of years has been very aggressive, given the dearth of adequate business opportunities in other business segments and low engineering value additions required in road projects, which leads to many developers participating in bidding for road projects. Relatively, competitive intensity is lesser in big ticket road projects but there have been instances wherein the gap between the L1 and L2 signifies intense competitive pressures. Hence, if L&T resorts to aggressive bidding then it may hurt the IRRs for projects. Exhibit 86: Competitive intensity also on rise in larger size road projects Project Cost (| crore) Winner % gap between L1 and L2Ahmedabad - Vadodara 3600 IRB Infra 61Udaipur Expressway 5400 GMR Infra 23Sivpuri-Devas 2800 GVK Power 63
Source: NHAI, ICICIdirect.com Research
• Opportunities for M&A exist Given the strength and size of L&T’s balance sheet coupled with robust execution capability, L&T has the appetite for acquiring road projects from weaker developers who are in need of capital. However, proper evaluation should be done in order to ensure all technical and legal approvals are in place for the respective projects.
Page 35ICICI Securities Ltd | Retail Equity Research
Hyderabad Metro: (Land acquisition leading to delays) The Hyderabad metro project is reportedly already facing delays due to land acquisition issues. Moreover, due to a depreciating rupee and delays in execution, the project cost is reported to have escalated by | 1500 crore already (although the company highlights that these have been factored in appropriately). IRRs of the project mainly depends on timely commissioning of the project and pace of land monetisation, which remains a key upside/downside risk given the ongoing environment in Hyderabad. • Execution Maestro: L&T has been associated in executing metro
projects in the cities of Mumbai, Delhi and Jaipur. Hence, it has gained hands-on experience in executing these projects. Combined with L&T’s superior in-house execution capability, we believe the cost overruns will be least and the commencement will be as scheduled
• Riding on real estate: As the DCA, the government will be transferring 279 acres of land, including 12 acres of prime properties, to the metro project. Over 6 million square feet (sq ft) of parking and circulation areas of 34 stations, 12.5 mn sq ft over the three depots (above first floor level), 10% of the floor area of each station, can be constructed and used for commercial purposes. Since the metro will cover substantial ground in the city, we believe real estate revenues will constitute a substantial chunk of total revenues. Of the total revenues, the management expects 60% to come from passengers and 40% from real estate
• Extension of lease: After 35 years, the concession period can be extended by up to 25 years, thereby extending the inflow period. Additionally, if by October 2021, the project falls short of the target ridership by 1%, the concession period will get extended by 1.5% (up to a maximum of 20% of the concession period i.e. seven years)
• Currently, RTC (bus services), carries an estimated ridership of 3 million daily. Once operational, a substantial chunk is likely to shift to metro
• Additional indirect subsidy has been provided as follows: o No local taxes, either on metro project or on real estate
projects o Electricity to be supplied at a subsidised rate of 2.5-
2.75/unit o Up to four hours a day can be declared as peak hours and
a premium of up to 25% can be charged during that period
o Fare can be increased by 5% every year o Right to run shuttle service to the metro station o Advertisement rights to act as a major revenue driver
Exhibit 87: High operating margins of Delhi Metro Delhi Metro :Common Size( in %) Rail Operation Real Estate Rail Operation Real EstateRevenue 100 100 100 100Operational ExpenditureEmployee Cost 24 0 24 0Administrative Expenses 11 1 12 3Repairs & Maintenance 7 4 8 7Electricity and Others 10 7 12 7Operating Cost 52 12 56 17Operating Margins 48 88 44 83
FY11 FY10
Source: DMRC, ICICIdirect.com Research
Project Cost | 16378 croresProject FundingEquity (20%) |3,442 croreDebt (80%) | 11478 croreViabilty Gap Funding (VGF) |1458 croreConsession Period 35 yearsMetro length 71.6 km, 66 stationsScheduled Commencement 2016Expected Daily Ridership
in 2016 1.5 mnin 2021 2.2 mn
Ticket Price (|) 8-19Biidding (on basis of lowest VGF demand)Player VGF DemandL&T |1458 croreTransstroy Consortium | 2200 croreReliance Infra consortium | 2991 crore
Hyderabad Metro Project Details
Page 36ICICI Securities Ltd | Retail Equity Research
Value unlocking adds to shareholder wealth creation Before L&T Finance Holdings was listed on the bourses, the Street assigned a valuation of 2x the book, implying a market capitalisation of around | 4,300 crore. However, when the shares where offered for IPO, the new discovered price for the company was | 52/share, translating into a total market capitalisation of | 8,900 crore, almost double its pre-listing value. L&T has diversified business interests across IT services, engineering, construction, financial services, power equipment manufacturing, hydrocarbons, defence and others with the company strategically placed in their respective sectors. While some are yet to reach critical mass on the topline and bottomline front, some like IT services, have grown on a consistent basis, to achieve critical mass. A bulging order book for the power equipment business (book to bill of 7.1x FY11 revenues) and strong execution capability in the property development business provides comfortable visibility for future growth. Once potential listing candidates are put under the hammer, they would be trading at their valuation, which tends to be much higher than the pre listing valuations. Moreover, once listed, they would be able to raise funds on their own with least recourse to the parent. This would help lighten the debt on L&T’s books, employed in subsidiaries. Going ahead, we expect value unlocking in strategic subsidiaries like L&T Infotech and L&T IDLP to further add to shareholder wealth in the long run.
L&T Finance Holdings Prelisting Post Listing
Valuation Methodology Price/book20% discount to
McapImplied Market Cap |4,300 crores |8,900Total Value unlocked |4,600 crore
Potential unlocking candidates include L&T IDPL and L&T Infotech
Page 37ICICI Securities Ltd | Retail Equity Research
Financials Revenues to grow at a CAGR of 16.8% over FY11-14E We are confident about L&T meeting its FY12E guidance of 25% YoY revenue growth. However, owing to a moderation in execution rates, slower order inflow growth in FY12E (-7.7% in FY12E) and rising proportion of slow moving orders (10-12% of Q3FY12 order backlog), we expect revenue CAGR of 16.8% over FY11-14E on a standalone basis to moderate vis-à-vis the revenue CAGR of 25.4% over FY07-11. In line with history, the E&C segment would continue to dominate the revenue mix, as the order backlog is skewed towards this segment. In addition, a weak investment cycle and higher competitive intensity will lead to lumpiness in growth rates for the E&E and M&IP segment. Hence, we expect the E&C segment to contribute 89.2% and 88.7% of the total revenues in FY13E and FY14E, respectively with the rest coming in from the E&E segment and M&IP segment.
In terms of segmental performance, we expect growth to mainly happen on the infrastructure segment, as these segments have seen 61% YoY and 32% YoY order inflow growth in FY11 and YTDFY12. Though cyclical in nature, hydrocarbons will also add to revenue growth as order inflows have grown 133% YoY in YTD FY12.
Exhibit 88: Standalone revenues to grow at CAGR of 16.7% over FY11-14E
-
10,000
20,000
30,000
40,000
50,000
60,000
70,000
80,000
FY07
FY08
FY09
FY10
FY11
FY12
E
FY13
E
FY14
E
(| C
rore
s)
051015202530354045
(%)
Revenues YoY Growth (RHS)
Source: Company, ICICIdirect.com Research
Exhibit 89: Consolidated revenues to grow at 18.6% CAGR over FY11-14E
-
10,000
20,000
30,000
40,000
50,000
60,000
70,000
80,000
90,000FY
07
FY08
FY09
FY10
FY11
FY12
E
FY13
E
FY14
E
(| C
rore
)
.
0
5
10
15
20
25
30
35
40
45
(%)
Reveunes YoY Growth (RHS)
Source: Company, ICICIdirect.com Research
Exhibit 90: E&C to comprise lion’s share of base business revenues
86.3 86.5 87.8 89.2 88.7
13.7 13.5 12.2 10.8 11.3
0
20
40
60
80
100
FY10 FY11 FY12E FY13E FY14E
(%)
E&C E&E + M&IP Segment
Source: Company, ICICIdirect.com Research
We expect revenue CAGR of 16.8% over FY11-14E on a standalone basis to moderate vis-à-vis the revenue CAGR of 25.4% over FY07-11 In terms of segmental performance, we expect growth to mainly happen on the infrastructure segment, as these segments have seen 61% YoY and 32% YoY order inflow growth in FY11 and YTDFY12
Page 38ICICI Securities Ltd | Retail Equity Research
On consolidated basis, we expect revenue CAGR of 18.6% over FY11 to FY14E. The standalone business will continue to dominate the overall revenue mix, albeit with a decline in share from 78% in FY11 to 75.1% by FY14E. On the other hand, scalability will be exhibited in L&T Finance Holding and L&T MHI whose share in the overall revenues stands at 5.5% and 4.6% in FY13E, respectively. L&T Infotech will maintain its share at 4.6%-5% in FY13E. Expected commissioning of some of BOT Toll projects will inch up L&T IDPL’s share to 2.1% in the revenues. Exhibit 91: Revenue mix at the consolidated level…
Base Business L&T Finance Holdings L&T IDPLL&T MHI JV L&T Infotech E&C Subs.E&E Subs. M&IP Subs
Source: Company, ICICIdirect.com Research
…with elevated commodity prices keeping check on EBITDA margins
EBITDA margins have averaged 13.2% over FY07-11. EBITDA margins are primarily a function of the order book mix and commodity prices. The E&C segment (75-85% share in total EBITDA) and E&E segment (5-7% share in total EBITDA), carries a margin of nearly 11% while segments like M&IP and others carries heftier margins averaging 20%. Softer commodities in the aftermath of the liquidity crisis in 2008 helped push EBITDA margins to average 13% for FY10-11. Exhibit 92: Trend in EBITDA margins
8
10
12
14
FY07 FY08 FY09 FY10 FY11 FY12E FY13E FY14E
(%)
Source: Company, ICICIdirect.com Research
However, rising competition across segments where L&T operates coupled with elevated commodity prices would keep margins under pressure. Going forward, we have built EBITDA margins in the range of
On a consolidated basis, we expect revenue CAGR of 18.6% over FY11 to FY14E The standalone business will continue to dominate the overall revenue mix, albeit with a decline in share from 78% in FY11 to 75.1 % by FY14E
EBITDA margins have averaged 13.2% over FY07-11. Going forward, we have built EBITDA margins in the range of 11.0 % to 11.6% over FY12E-FY14E
Page 39ICICI Securities Ltd | Retail Equity Research
11.0-11.6% over FY12E-14E. We have trimmed our estimates on the margin front as the order book is inclined more toward infrastructure (40% of the overall order backlog as of 9MFY12) and low margin yielding Middle East orders
Exhibit 93: Operating expenses as a percentage of sales
We have built in a sensitivity analysis wherein we observe that a 100 bps rise in EBITDA margins from our base case assumption of 11.6% in FY13E, EPS gets impacted by 9%. Similarly, a decline of 100 bps in FY13E EPS would cause a decline of 8.6% in FY13E EPS.
PAT margin to decline on the back of high interest costs
Interest costs are expected to rise by 26% YoY in FY13E on the back of higher borrowing costs and high working capital cycle. Therefore, PAT is expected to grow at a CAGR of 11.1% over FY11-14E. Consequently, we have built in PAT margins of 7.8-7.9% over FY13E-14E to factor in a moderation in revenue growth, decline in margins and high interest costs.
Exhibit 94: PAT build up for FY11 (as a percentage of total operating revenues)
48.3
9.113.514.111.312.7
98.8 100.0
18.2
20.8
4.40.801.52.8
1.4
1.2
12.7
0
20
40
60
80
100
Reve
unes
Othe
r Op
Inco
me
Tota
l Ope
ratin
gRe
v
Raw
Mat
eria
l
Sub
Cont
ract
ing
SGA,
Emp,
Othe
rs
EBIT
DA
Depr
ecia
tion
EBIT
(Ex
Oth
Inc)
Othe
r Inc
ome
EBIT
(Inc
Oth
Inc) Inte
rest
PBT
(Ex
Excp
tlIn
c)
Excp
tl In
com
e
PBT
Tax
PAT
Source: Company, ICICIdirect.com Research
PAT is expected to grow at a CAGR of 11.1% over FY11-14E. Consequently, we have built in PAT margins of 7.8-7.9% over FY13E-14E to factor in a moderation in revenue growth, decline in margins and high interest costs
Page 40ICICI Securities Ltd | Retail Equity Research
RoEs to get depressed as investments in subsidiary rise till FY14E; Core RoEs still robust! We expect standalone RoEs for FY13E and FY14E at 16.3% and 16.2%, respectively. This is a significant decline from 24% and 18% RoEs reported in FY10 and FY11, respectively. The key reason for the same is the significant rise in equity investments in strategic subsidiaries that has grown at a CAGR of 55% over FY09-11 and is further expected to grow at a CAGR of 20% over FY11-14E to | 13263 crore by FY14E. Together with loans and advances to subsidiaries this will form 50% of the total assets. These subsidiaries are expected to provide back ended returns though that would be a drag in the medium term.
Exhibit 95: Trend in standalone, consolidated and core RoEs
Furthermore, core RoE (net-worth adjusted for investments in subsidiaries) are still in the healthy range of 25-27% (over FY12E to FY14E), which are superior not only to numerous domestic peers but also several international peers (average RoEs of 15-16% in CY11/FY12). Working capital cycle to stretch in tough environment The net working capital requirement for every rupee of sales hovers around 15%, lowest in the industry. Thus, reliance on working capital loans to fund the daily operations falls to a minimal. Moreover, advances received from customers against orders (around 10% of the order size), gets deployed to manage the current liabilities, thus further reducing need for loan funds.
Exhibit 96: Working capital requirement is lowest in industry…
14.5
10.2
16.713.8
16.218.318.517.0
0
5
10
15
20
FY07 FY08 FY09 FY10 FY11 FY12E FY13E FY14E
(%)
Source: Company, ICICIdirect.com Research
Exhibit 97: Vendors sufficient to cover the debtors...
2725 25 25
24 24 25 24
20 1817
22
2624 24 25
0
5
10
15
20
25
30
FY07 FY08 FY09 FY10 FY11 FY12E FY13E FY14E
(%)
Debtors/Sales Creditors/Sales
Source: Company, ICICIdirect.com Research
Standalone RoEs for FY13E and FY14E at 16.3% and 16.2%, respectively, from the 24% and 18% RoEs reported in FY10 and FY11, respectively, as investments in subsidiaries are expected to be around 50% of the balance sheet. This will lead to lower RoEs in the short-term However, core-RoE (net-worth adjusted for investments in subsidiaries) are still in the healthy range of 25-27% (over FY12E to FY14E), which are superior to not only to numerous domestic peers but also several international peers
Page 41ICICI Securities Ltd | Retail Equity Research
As on FY11, 14% of the gross working capital (GWC) was tied up as advances to subsidiaries. Adjusting GWC for advances to subsidiaries, the advances from customers and money due to vendors more than make up for the investment required in debtors. This reflects in the P&L statement not only in the form of lower interest outgo, but also a greater share of other income from interest and dividends received.
Exhibit 98: Trends in key components of Working capital cycle
6
7
8
9
10
11
12
FY06 FY07 FY08 FY09 FY10 FY11
(%)
20
25
30
35
40
45
50
55
(%)
Advances as a % of Order BacklogAdvances as a % Total Current Liabilities (RHS)Sundry Creditors as a % of Total Current Liabilites (RHS)
Source: Company, ICICIdirect.com Research
Exhibit 99: Composition in gross working capital cycle (Adj.)
52.4 47.5 46.1 49.6 48.3 41.3
29.8 34.8 38.4 39.0 40.739.1
33.1 34.5 33.8 34.2 41.245.0
0
20
40
60
80
100
120
140
FY06 FY07 FY08 FY09 FY10 FY11
(%)
Sundry Debtors as a % of GWC (Adj) Customer Advancers a
Sundry Creditors as a % of GWC (Adj)
Source: Company, ICICIdirect.com Research
L&T Finance distorts debt/equity ratio at consolidated level At the standalone level, we expect the debt equity ratio to rise from 0.3x in FY11 to 0.4x in FY12E due to deteriorating working capital cycle. Thereafter we expect the leverage potion to remain at the same levels for FY13E and FY14E. On the consolidated level, L&T finance holdings distort the debt equity ratio to 1.8x in FY13E as we believe the latter to form 50% of the overall consolidated debt. Stripping off the debt from consolidated level, debt equity ratio remain well below 1x in FY13E (0.9x) and FY14E (0.9x) Exhibit 100: A comfortable debt equity position..
On the other hand, ongoing construction of the developmental projects will lead to 20% share of L&T IDPL’s share in consolidated debt. On an absolute basis the debt in L&T IDPL is expected to grow at a CAGR of 16% over FY11-FY14E.
Page 42ICICI Securities Ltd | Retail Equity Research
Exhibit 101: Debt mix among the major group companies
30
19
18
17
15
42
43
45
47
48
25
26
21
20
20
1
2
5
4
3
0
2
5
7
7
0
1
1
1
1
2
7
6
5
5
0% 20% 40% 60% 80% 100%
FY10
FY11
FY12E
FY13E
FY14E
Stanalone L&T Finance L&T IDPL L&T MHI JV L&T Power Dev L&T Infotech Others
Source: Company, ICICIdirect.com Research
Trading on Equity….
L&T IDPL would take the next biggest chunk of debt requirement, as the projects are primarily on BOT basis. This requires a sizeable chunk of debt addition for every new project won. Generally, loan funds constitute 70% of total funding for a new project, or to maximum of 75% in cases of visibly safer projects. The rest comes in as equity contribution towards the project. However, in the case of L&T, the overall debt equity tends to be higher than industry average to hover around 80%. For road projects, this ratio tends to 85%, which means higher share of low cost debt funds and lower share of high cost equity funds. Exhibit 102: Higher debt component in projects contributing to higher RoEs. …
L&T Panipat Elevated Corridor 326 49 85L&T Western Andhra Tollway 373 56 85L&T Vaddodara Bharuch Tollway 979 44 96Krishnagiri Walejpet 1,370 206 85L&T Chennai Tada Tollway 848 127 85Samakhiali-Gandhidham 1,300 195 85Halol-Godhra-Shamalji 1,305 261 80L&T Krishnagiri Thopur toll road 385 58 85Narmada Infra Construction Enterprise 142 21 85Hyderabad Metro Rail 16,378 3442 79Katupalli Port 2,500 600 76L&T - UIL 2,225 75 97
Source: Company, ICICIdirect.com Research
Strong internal accruals help in maintaining a strong cash position, which helps in pushing down the net debt position. This provides comfort in a situation where the investments needs in subsidiaries are high, which will demand incremental amounts of funds. A net debt to equity of 24% (at FY11 end), will not only keeps the balance sheet stress under acceptable levels going ahead, but would also keep the marginal cost of additional funds lower.
In the case of L&T, the overall debt equity tends to be higher than industry average to hover around 80%. For road projects, this ratio tends to 85%, which means higher shareof low cost debt funds and lower share of high cost equity funds
Even for a first of its kind metro rail project, entailing such a huge investment, L&T has been able to lock in a debt equity ratio of 80%
Page 43ICICI Securities Ltd | Retail Equity Research
Risk & concerns Further deterioration in macro environment to defer order awards A suppressed macro environment, both domestically and globally, would lead to subdued ordering, which, in turn, would hammer both the revenue visibility and P/E multiple going forward. Checked growth across sectors like Power, industrials, metals, hydrocarbons (especially in the MENA region) could curb ordering. Weak ordering tends to hammer sentiments, which, in turn, leads to P/E de rating. Policy inaction A sizeable portion of revenues is derived from power sector, which is facing fuel crisis, SEBs issues, environmental issues, etc. This would defer new projects and execution of existing ones. Blanket bans and policy ambiguity in sections of mining will put off new orders. Many projects in sectors like ports, airports, defence and fertilizers are at various stages of regulatory approval, which would be followed by financial closure. A significant delay in granting necessary approvals would postpone the order pipeline. High competitive intensity can put pressure on EBITDA margins Lack of adequate orders could force entry into lower margin orders, combined with intense competition from domestic, Chinese and Korean players. Bullish commodity margins could impact margins, especially for international contracts which are generally on fixed price basis. A one percentage point fall in EBITDA could lead to decline in stock price by 8.6% (at ceteris paribus). However we have been conservative in EBITDA estimates for FY123E-FY14E, which we expect to be in the range of 11-11.6% over the same period
Exhibit 103: Sensitivity of EPS vis-à-vis Order inflow growth and EBITDA Margins
Delay in commissioning of development project would impact IRRs Given the capital intensive nature of these projects, any delay in timely commissioning could lead to cost overruns and hit the overall profitability. Cost overruns, extended working capital cycle, and less than expected profitability could adversely impact project IRRs.
Page 44ICICI Securities Ltd | Retail Equity Research
Valuation Over the last decade L&T has spread its wings across all segments of infrastructure and engineering. Apart from rendering EPC and engineering services, L&T has gradually shifted focus from being a core EPC company to a wholly integrated asset developer and owner, thereby rendering significance to forward integration. As of 9MFY12, L&T has a portfolio of developmental projects spanning across roads & bridges (17 projects), power development (five projects), ports (three projects), metro rail (one project) and real estate (14 projects), thereby committing | 5600 crore of equity funds towards the commissioning of the same. We believe though high gestation nature of projects, this portfolio of projects will end up giving back ended returns and will require equity infusion from Base business balance sheet in the medium term. Given the changing business model of L&T, ascribing an individual valuation tool will underestimate the nature of the various businesses that the company is operating under and hence judging the company based on consolidated financials will not throw the correct picture. Hence, we have adopted a SOTP valuation methodology by using various appropriate valuations tools for different segments that L&T operates in and arrive at a Fair Value of |1473/share in our base case analysis. Further, we have built in three scenarios (Bull case/Base case/ Bear case) to further incorporate sensitivity of variables like order inflows and capex outlook, progress of developmental projects, unlocking of value in various subsidiaries, movement in policy reforms, trend of interest rates and capital market conditions. Hence under the three scenarios fair value of L&T works out to |1869/share (Bull case, 42% upside), |1473/share (Base case, 11% upside) and |1100/share (Bear case, 17% downside). Exhibit 104: Equity Fair Value (SOTP) under various scenarios
Company (|per share) Bull Case % of total Base Case % of total Bear Case % of totalBase Business 1428.1 76.4 1176.1 79.8 882.1 80.3
Under the three scenarios (Bull case/Base case/ Bear case)fair value of L&T works out to |1869/sahre (Bull case, 42% upside), |1473/share (Base case, 11% upside) and |1100/share (Bear case, 17% downside)
Page 45ICICI Securities Ltd | Retail Equity Research
Exhibit 105: How do we arrive at L&T’s fair value under the various scenarios
Valuation Methodolodgy
P/E Ratio10% premium over average broader market multiples
17xFY14E EPS
P/E Ratio20% Dscount to average broader
market multiples 11xFY13E EPS
P/ABV Ratio1.5xFY14E ABV
P/E Ratio12xFY14E EPS
Multiple on Equity Committed1.5x FY13 Equity
P/E Ratio9xFY13E EPS
P/E Ratio15xFY14E EPS
P/BV Ratio1.5xFY13 BV
(Nabha Power)1xFY11 BV
(Hydro Projects)
P/E Ratio10x FY11/CY10 EPS
L&T Finance Holdings
L&T- MHI JV
L&T Infotech
L&T Power Development
L&T IDPL
Base Business
Other E&C, MIPand E&E subs.
Bull Case
Equity Fair Value| 1869/share
P/E Ratio10% discount to average broader
market multiples 14xFY13E EPS
Based on M-CapAdd: 20% Holdco Discount
P/E Ratio10xFY13E EPS
P/E Ratio12xFY13E EPS
P/BV Ratio0.7xFY13 BV
(Nabha Power)0.5xFY11 BV
(Hydro Projects)
Multiple on Equity Committed1x FY13 Equity
Weight to P/E (30%) and P/BV (70%)ratio
7x FY11/CY10 EPS0.7x FY11/CY10 BV
Base Case
| 1473/share
Based on M-CapAdd: 40% Holdco Discount
P/E Ratio8xFY13E EPS
P/BV Ratio0.5xFY13 BV
(Nabha Power)
Multiple on Equity Committed0.7x FY13 Equity
P/BV Ratio0.5x FY11/CY10 BV
Bear Case
| 1100/share
Source: Company, ICICIdirect.com Research
Page 46ICICI Securities Ltd | Retail Equity Research
Valuations of subsidiaries highly sensitive to capital market sentiments
In our base case, 20.2% of the overall valuation is explained by the subsidiaries whereas the proportion rises to 23.6% in Bull case and declines to 19.7% in the bear case. This implies a classic market behaviour in case of SOTP valuations as consensus during bullish or euphoric times starts ascribing high values to various subsidiaries to justify the high market price prevailing at that time and hence higher share of subsidiaries in overall valuation. On the contrary, during a lull or gloomy phase, a deeply oversold price does not even reflect the true picture of the base business, leave alone the subsidiaries. Hence, share of subsidiary valuation contracts in the overall valuations and hence consensus gives utmost significance to the performance of the base business.
Exhibit 106: Share of base business value in overall valuation under the three scenarios
76.4 79.8 80.3
23.6 20.2 19.7
0
20
40
60
80
100
Bull Case Base Case Bear Case
(%)
Base Business Subsidiaries
Source: Company, ICICIdirect.com Research
During periods of Bull run, a higher price is justified by assigning a higher valuation for the subsidiaries, which during periods of Bear run, is justified by contracting the valuations of subsidiaries.
Page 47ICICI Securities Ltd | Retail Equity Research
Base Business: Multiples highly sensitive to Order Inflow growth Growth in order inflows remains highly crucial determinant for P/E multiples for L&T’s valuations, mainly base business as it forms ~80% of the overall valuation. Hence, period of high order inflows lead to higher P/E multiples. Multiples are keenly sensitive to overachievement and underachievement of the order inflow guidance set by the management for a particular fiscal year. Over FY05-FY11, L&T has been able to meet its order inflow guidance four times out of six occasions and has underachieved its guidance on two occasions. Average outperformance over the four occasions has ranged around 8% and average underachievement has been at 5% over the two occasions. During period of overachievement L&T has traded in the range 31x-56x in terms of maximum P/E multiple (based on one year forward multiple) and the average range has been 26x-39x over the same period. Similarly during periods of underachievement minimum P/E multiple (based on 1 year forward multiple) has hovered in the range of 20x-24x. Exhibit 107: Guidance Achievement vis-à-vis movement of 1 Forward Year P/E multiples
One Year Forward P/E Multiple Trailing P/E Multiple
Source: Bloomberg, Company, ICICIdirect.com Research
Exhibit 108: Forward P/E movement across last 23 quarters. …
0
10
20
30
40
50
60
Q1FY
07
Q2FY
07
Q3FY
07
Q4FY
07
Q1FY
08
Q2FY
08
Q3FY
08
Q4FY
08
Q1FY
09
Q2FY
09
Q3FY
09
Q4FY
09
Q1FY
10
Q2FY
10
Q3FY
10
Q4FY
10
Q1FY
11
Q2FY
11
Q3FY
11
Q4FY
11
Q1FY
12
Q2FY
12
Q3FY
12
Highest P/E for the Quarter
Average P/E for the Quarter
Lowest P/E for the Quarter
Source: Bloomberg, ICICIdirect.com Research
Periods of high order inflows lead to higher P/E multiples. Multiples are keenly sensitive to overachievement and underachievement of the order inflow guidance set by the management for a particular fiscal year
Page 48ICICI Securities Ltd | Retail Equity Research
Exhibit 109: Movement of Order Inflow vis-à-vis Forward P/E multiple
49.0
37.1 37.3
22.9
34.9
14.6
-7.7
5.810.8
-10
0
10
20
30
40
50
60
FY06 FY07 FY08 FY09 FY10 FY11 FY12E FY13E FY14E
YoY Order Inflow Growth (%) 12m Forward P/E (x)
Source: Company, Bloomberg, ICICIdirect.com Research
Assigning value to the base business: Historically, L&T’s base business has traded at a significant premium over the BSE Sensex multiples. The premium that L&T’s multiples have commanded over FY06-FY12 has average at 46%. But over FY08-YTDFY12 and particularly FY11-YTDFY12 the premium has contracted lower to 35% and 23%, respectively. The contraction in premium over the P/E multiple signifies the moderation in order inflow growth ( high base effect and challenging macro environment), moderation in consolidated RoEs as more equity is infused in developmental projects and rising competitive intensity across the various verticals that L&T operates in (More high during investment cycle downturns).
Exhibit 110: Movement of L&T’s Forward multiple vis-à-vis that of BSE Sensex
-20
0
20
40
60
80
100
120
Mar
-06
Jun-
06
Sep-
06
Dec-
06
Mar
-07
Jun-
07
Sep-
07
Dec-
07
Mar
-08
Jun-
08
Sep-
08
Dec-
08
Mar
-09
Jun-
09
Sep-
09
Dec-
09
Mar
-10
Jun-
10
Sep-
10
Dec-
10
Mar
-11
Jun-
11
Sep-
11
Dec-
11
(%)
Over FY06-YTDFY12 L&T 's multiples have commanded an average 46% premium over the multiples of BSE SensexDuring the crisis, the mulitples of both L&T and BSE Sensex had alomost converged.But post the 2008 crisis, the premiun till date has averaged 35%. In YTDFY12, the premium has even shrunk to 23%. Situation of mutliple convergence reoccurred in December 2012 wherein L&T 's forward multiple went into discount to that of BSE Sensex
Source: Bloomberg, ICICIdirect.com Research
Page 49ICICI Securities Ltd | Retail Equity Research
Exhibit 111: One year forward P/E Band
0
500
1000
1500
2000
2500
Apr-0
8
Jun-
08
Aug-
08
Oct-0
8
Dec-
08
Feb-
09
Apr-0
9
Jun-
09
Aug-
09
Oct-0
9
Dec-
09
Feb-
10
Apr-1
0
Jun-
10
Aug-
10
Oct-1
0
Dec-
10
Feb-
11
Apr-1
1
Jun-
11
Aug-
11
Oct-1
1
Dec-
11
Feb-
12
Price 10.0x 15.0x 20.0x 25.0x
Source: Bloomberg, ICICIdirect.com Research
Exhibit 112: One year forward P/BV Band
0
500
1000
1500
2000
2500
Apr-0
8
Jul-0
8
Oct-0
8
Jan-
09
Apr-0
9
Jul-0
9
Oct-0
9
Jan-
10
Apr-1
0
Jul-1
0
Oct-1
0
Jan-
11
Apr-1
1
Jul-1
1
Oct-1
1
Jan-
12
Price 2.0x 3.0x 4.0x 5.0x
Source: Bloomberg, ICICIdirect.com Research
We have factored in the above concerns and believe that L&T should trade in line with broader market multiples (average one year forward multiple of BSE Sensex has ranged at 15.5x) and assigned 14x on its FY13E EPS of | 77 to arrive at a fair value of | 1176 per share. But at the same time, during times of revival in investment cycle and easing of cyclical factors like declining interest rates and commodity process leads to a violent re-rating of base business multiples as investors bid up higher multiples as L&T has the wherewithal to win large orders on the back of robust execution skills and strong balance sheet. Therefore, we have assigned a 10% premium to broader market multiples and valued the base business at 17x its FY14E EPS to arrive at a fair value of |1428/share. Similarly, in our bear case we have assigned a discount of 20% to broader market multiples and value at 11x FY13E EPS to arrive at a fair value of | 882 per share.
During times of revival in investment cycle and easing of cyclical factors like declining interest rates and commodity process leads to a violent re-rating of base business multiples as investors bid up higher multiples as L&T has the wherewithal to win large orders
Page 50ICICI Securities Ltd | Retail Equity Research
Exhibit 113: Scenarios for base business valuations Bull Case Base Case Bear Case
Valuation Metholodgy P/E P/E P/E
Discounting of Earnings FY14E FY13E FY13E
Rationale10% premium to
BSE Sensex Multiples
10% discount to BSE Sensex
Multiples
20% discount to BSE Sensex
Multiples
P/B Multiple assigned (x) 17 14 11
Standalone PAT excl dividends (| crore) 5115.9 5115.9 5115.9
Value of Base business (| crore) 86970.2 71622.5 53716.9
Per Share Value in L&T (|) 1428.1 1176.1 882.1
Source: Company, ICICIdirect.com Research
At the implied value of | 1023/share (adjusted for |297/ share of subsidiaries from the CMP of | 1320 per share), base business is trading at ~13.5x on FY13E EPS
Exhibit 114: Comparison of L&T vis-à-vis domestic peers
Source: Reuters Consensus, ICICIdirect.com Research
L&T Infotech Ltd. We expect L&T Infotech to deliver a consistent performance across parameters. Being a service company, L&T Infotech generates cash flows and aids the balance sheet of the parent company in terms of dividend payout to the latter. Going ahead, revenues are expected to exhibit a CAGR of 26% over FY11-14E with EBITDA margins ranging between 16% and 17%. Consequently, the PAT is expected to grow at a CAGR of 19% over the same period. On a consolidated basis, L&T Infotech has contributed to 4.8% and 6.7% of overall revenues and PAT, respectively, averaged over FY07-FY11.
Exhibit 116: How does L&T Infotech stake up on relative valuation? Company
Hence, we have applied an earnings multiple on FY13 earnings in our base case scenario. In terms of valuation parameters, L&T Infotech scores well vis-à-vis the listed Indian mid-cap peers. The peers generally trade at average one year forward P/E multiple of 9-10x. Similarly, we have valued
Page 52ICICI Securities Ltd | Retail Equity Research
L&T Infotech at 10x its FY13 earnings and arrived at an equity fair value of | 4480 crore. Also, we have valued the strategic investments at 0.3x of equity that L&T Infotech has invested as of FY11. The total value of L&T Infotech adds up to | 4547 crore. This translates into | 75 per share in L&T (base case), thereby comprising 5% of overall valuations. In our bull and bear case scenarios, the value of L&T Infotech translates into | 107/share and | 58/share in L&T, respectively.
Exhibit 117: Valuation scenarios for L&T Infotech
Bull Case Base Case Bear CaseDiscounting of Earnings FY14E FY13E FY13E
P/E Multiple Assigned (x) 12.0 10.0 8.0
PAT (| crore) 525.2 442.6 442.6
RationaleWe assign 20% premium to
average multiple at which peer IT companies are traded
We assign average multiple at which peer IT companies are
traded
We assign 20% discount to average multiple at which peer IT
companies are traded
Firm Value (| crore) 6302.8 4426.3 3541.0
Accretion from Investment in Subsidiary (| crore) 401.0 401.0 401.0
P/B Multiple Assigned (x) 0.5 0.3 0.0
Accretion from Subsidiaries ( (| crore) 200.5 120.3 0.0
Total Value of L&T Infotech (| crore) 6503.3 4546.6 3541.0
Per Share Value in L&T (|) 106.8 74.7 58.1
Source: Company, ICICIdirect.com Research
Page 53ICICI Securities Ltd | Retail Equity Research
L&T Finance Holdings L&T Finance Holdings’ business momentum is likely to remain strong, albeit on a low base (loan growth expected at 28% CAGR over FY12E-14E). Return ratios will improve gradually by 220 bps from 12.7% in FY12E to 14.9% in FY14E on the back of robust growth in the asset base (leverage rising from 6.3x in FY12E to 7.2x in FY14E) and net interest income (CAGR of 30% over FY12E-14E). We have valued the subsidiary based on the 83% stake of L&T on the current market capitalisation and after applying a 20% holding company discount to the same. The value per share works out to | 88/share on L&T, in our base case scenario. Value of L&T Finance Holdings comprises 5.9% of the overall valuation (base case). Base case value for the subsidiary implies a P/ABV of 1.6x and 1.5x on FY13E and FY14E ABV, respectively. In our bull case scenario, we have valued the subsidiary at 1.5x FY14E ABV, which translates into | 113/ share in L&T. On the other hand, the bear case valuation assumes 40% holding company discount on the market capitalisation adjusted for the stake held by L&T (83%), wherein the per share value works out to | 66. Exhibit 118: Valuation scenarios for L&T Finance Holdings
Bull Case Base Case Bear Case
Valuation Metholodgy P/ABV
Value of 83% stake of parent on
current market cap
Value of 83% stake of parent on
current market cap
Discounting of Earnings/Networth FY14E - -
P/ABV Multiple Assigned (x) 1.5 - -
Holding co. discount (%) - 20 40
Attributable Networth (| crore) 5529 0 0
Market Capitalisation (| crore) 0 8059 8059
Accretion from investment in subsidiary (| crore) 6854 5328 3996
Per Share Value in L&T (|) 112.5 87.5 65.6
Source: Company, ICICIdirect.com Research
Value of L&T Finance Holdings comprises 5.9% of the overall valuation (base case). Base case value for the subsidiary implies a P/ABV of 1.6x and 1.5x on FY13E and FY14E ABV, respectively
Page 54ICICI Securities Ltd | Retail Equity Research
L&T Power Development We expect total equity infusion of ~| 1500 crore in Nabha Power by FY13E. In terms of valuation, we are ascribing multiple to the equity committed by L&T into Nabha power (FY13E) and other hydro projects (FY11). With the recent directive of PMO to Coal India with respect to signing of FSA with IPPs, we believe coal issues for Nabha Power will recede and above that it will allow L&T to plan on expansion project as well. In our base case, we have assigned a multiple of 0.7x to equity invested in Nabha Power and 0.5x to equity invested in L&T Arunanchal Hydropower Ltd. Per share value works out to | 19/share in L&T, which comprises 1.3% in overall valuation. In our bull case, we have assigned 1.5x to equity invested in Nabha Power (FY13E) and 1x equity invested in L&T Arunanchal Hydropower Ltd (FY11). In contrast, in our bear case, we have just considered Nabha Power for valuations at 0.5x of equity invested (FY13E). Exhibit 119: Valuation scenarios for L&T Power Development
Value of L&T Power Development 2417.1 1133.1 755.0
Per Share Value in L&T (|) 39.6 18.6 12.4
Source: Company, ICICIdirect.com Research
We believe coal issues for Nabha power will recede and above that it will allow L&T to plan expansion project as well. In our base case, we have assigned a multiple of 0.7x to equity invested in Nabha Power and 0.5x to equity invested in L&T Arunanchal Hydropower ltd. Per share value works out to | 19/share in L&T, which comprises 1.3% in the overall valuation
Page 55ICICI Securities Ltd | Retail Equity Research
L&T-MHI JV (Boiler-turbine generator facility) We have valued the power equipment JV on a P/E multiple basis, which would be in line with that of the midcap equipment manufacturing firms as the recent loss of orders in the NTPC bulk tenders implies that competitive intensity is here to stay in the power equipment domain. However, at the same time, catalysts like imposition of duty on import of power equipment and recent directives of PMO to Coal India with respect to signing coal FSAs would help revive power sector capex in the medium term. Hence, we have assigned a P/E multiple of 12x on FY13E to arrive at an equity value of | 694 crore (adjusted for L&T’s 51% stake in the JV), which translates into | 11/share in L&T. Exhibit 120: Valuation scenarios for L&T MHI JV
Bull Case Base Case Bear Case
Discounting of Earnings FY14E FY13E FY13E
P/E Multiple Assigned (x) 15.0 12.0 9.0
PAT (| crore) 155.9 113.5 113.5
Total Value of L&T MHI JV (| crore) 2338.8 1362.6 1021.9
L&T's Share in the JV (51%) 1192.8 694.9 521.2
Per Share Value in L&T (|) 19.6 11.4 8.5
Source: Company, ICICIdirect.com Research
We have inched up our earnings multiple in the bull case scenarios as we have assumed positive catalysts will materialise and combined with a higher execution of slow moving orders in the current backlog. The scenarios assume 15x P/E on FY14E EPS and translate into | 20/share into L&T. On the contrary, we have reduced the multiple to 10x on FY13E EPS and arrived at a per share value of | 9 in L&T, under the bear case scenario.
We have assigned a P/E multiple of 12x on FY13E to arrive at an equity value of | 694 crore (adjusted for L&T’s 51% stake in the JV), which translates into | 11/share in L&T in our base case scenario
Page 56ICICI Securities Ltd | Retail Equity Research
L&T IDPL We believe the P/BV valuation tool will be highly appropriate in valuing L&T IDPL as most of the projects are long gestation projects. At this stage, this subsidiary is a capital guzzler, thereby requiring funds from L&T’s balance sheet while profitability will be very minuscule as majority of the projects are under construction. As of FY11, the total net worth of these subsidiaries stood at | 2818 crore. We have built in further equity infusion of | 1000 crore and | 1200 over FY12E and FY13E, respectively. This will take the total net-worth to | 4818 crore by FY13E (this does not include the infusion into L&T power development). We have assigned a 1x P/BV multiple to arrive at an equity value of | 4818 crore, which translates into | 79/share in L&T, under the base case scenario. Exhibit 121: Valuation scenarios for L&T IDPL
Bull Case Base Case Bear CaseDiscounting of Equity infused/Networth FY13E FY13E FY13E
Equity infusion in FY12 and FY13 ( | crore) 2000 2000 2000
Attributable Networth as of FY13E (| crore) 4818 4818 4818
Equity value of IDPL (| crore) 7227 4818 3372.6Per Share Value in L&T (|) 118.7 79.1 55.4
Source: Company, ICICIdirect.com Research
Our bull case scenario assumes timely completion of projects coupled with reasonable IRRs. Thus, we have assigned 1.5x to attributable net worth and arrived at an equity value of | 7227 crore (| 119/share in L&T). Under the bear case, we have assigned 0.7x to attributable net worth and arrived at an equity value of | 3372 crore (| 55/share in L&T).
We have assigned a 1x P/BV multiple to arrive at an equity value of | 4818 crore, which translates into | 79/share in L&T, under the base case scenario.
Page 57ICICI Securities Ltd | Retail Equity Research
Other engineering and capital goods subsidiaries We have valued the various E&C, MIP and E&E subsidiaries; both domestic and international by assigning weights to P/E and P/BV multiples in our base case. PAT growth for these subsidiaries stood at 23% in FY11/CY10 over FY10/CY09. We believe these valuations are quite conservative given the high growth profile for several of these companies. In our base case, we have assigned 30% weights to P/E multiple and 70% weights to P/BV multiple on FY11/CY10 attributable PAT (| 268 crore) and net worth (| 2071 crore). Our rationale for the same stems from the fact that some these subsidiaries are well established ones and are experiencing robust growth while others are in a nascent stage of development or are high gestation projects (e.g. L&T Shipbuilding has an equity infusion of | 623 crore but is yet to book sizeable revenues and PAT and JV with NPCIL), implying back ended returns. Our base case scenario for these subsidiaries yields a value per share of | 26/share in L&T. Exhibit 122: Valuation scenarios for other engineering subsidiaries
Bull Case Base Case Bear Case
Valuation Metholodgy P/E30% weight to P/E and 70% weight to
P/BV multiplesP/BV
Discounting of Earnings/Networth FY11/CY10 FY11/CY10 FY11/CY10
Accretion from investment in subsidiary (| crore) 2679.7 1577.7 1035.7
Per Share Value in L&T (|) 43.9 25.9 17.0
Source: Company, ICICIdirect.com Research
Our bull case captures the growth potential of these subsidiaries and yields a value of | 44/share in L&T (10x Attributable PAT of FY11/CY10). On the contrary, we have valued the attributable networth of these subsidiaries at 0.5x FY11/CY10 BV to arrive at a per share value of | 17/share in our bear case.
In our base case, we have assigned equal weights to P/E multiples and P/BV multiples on FY11/CY10 attributable PAT (| 268 crore) and networth (| 2071 crore) Our base case scenario for these subsidiaries yields a value per share of | 26/share in L&T
Page 58ICICI Securities Ltd | Retail Equity Research
Financials: Standalone Exhibit 123: Profit and Loss Account
(Year-end March) (| Crore) FY10 FY11 FY12E FY13E FY14ENet Sales 36,675.2 43,495.9 53,799.6 59,568.7 69,236.1 Other Operating Income 359.7 408.4 286.1 599.0 694.5 Total Operating Income 37,034.8 43,904.3 54,085.7 60,167.7 69,930.5 Total Operating Expenditure 32,295.4 38,306.2 48,058.9 53,193.1 62,055.2 Raw Material Expenses 8,186.9 9,396.3 12,777.1 13,403.0 15,645.9 Subcontracting Expenses 8,998.0 9,156.8 10,903.8 12,984.2 15,164.2 Construction Material 7,146.2 9,675.4 11,512.5 12,807.3 14,974.7 Purchase of Traded Goods 1,574.3 2,065.0 2,371.7 2,978.4 3,461.8 Other Manufacturing Expenses 2,492.8 2,955.2 3,930.5 4,169.8 4,500.3 Employee Cost 2,379.2 2,884.5 3,996.7 3,872.0 4,846.5 Sales, administration & Other Expenses 1,518.1 2,173.0 2,566.6 2,978.4 3,461.8 EBITDA 4,739.4 5,598.1 6,026.8 6,974.6 7,875.4 Other Income 2,024.5 1,443.1 1,680.3 1,688.9 1,789.3 Interest 505.3 647.4 783.0 1,027.1 1,022.5 Depreciation 336.3 512.1 708.9 810.7 900.7 Less: Exceptional Items (135.7) (70.8) - - - PBT 6,058.0 5,952.6 6,215.2 6,825.6 7,741.5 Exceptional Items 1,640.9 1,945.9 1,945.3 2,150.1 2,438.6 PAT 4,417.1 4,006.8 4,269.9 4,675.6 5,302.9
Source: Company, ICICIdirect.com Research
Exhibit 124: Balance Sheet
(Year-end March) FY10 FY11 FY12E FY13E FY14EEquity Capital 120.4 121.8 121.8 121.8 121.8 ESOP 284.0 285.0 285.0 285.0 285.0 Reserve and Surplus 17,925.7 21,448.5 24,683.4 28,326.9 32,460.2 Total Shareholders funds 18,330.1 21,855.3 25,090.1 28,733.7 32,867.0 Secured Loan 955.7 1,063.0 1,263.0 1,463.0 1,563.0 Unsecured Loan 5,845.1 6,098.0 8,098.0 9,098.0 9,798.0 Total Debt 6,800.8 7,161.1 9,361.1 10,561.1 11,361.1 Deferred Tax Liability 389.0 549.7 549.7 549.7 549.7 Liability side total 25,520.0 29,566.0 35,000.9 39,844.5 44,777.8 Assets - - - - - Total Gross Block 7,110.4 8,704.3 10,204.3 11,404.3 12,504.3 Less Accumulated Depreciation on T 1,722.3 2,216.7 2,894.9 3,670.1 4,527.7 Net Block 5,388.1 6,487.7 7,309.4 7,734.3 7,976.6 Capital WIP 858.0 785.0 785.0 785.0 785.0 Total Fixed Assets 6,246.1 7,272.7 8,094.4 8,519.3 8,761.6
- - - - - - Net Intangible Assets 144.5 222.9 242.3 256.7 313.6 Other Investments 13,705.0 14,684.0 17,184.0 19,684.0 22,684.0 Total Current Assets 26,355.2 34,923.6 41,744.6 47,108.4 55,713.2 Inventory 1,415.4 1,577.2 1,812.9 2,103.9 2,258.9 Debtors 11,115.0 12,308.1 16,213.6 18,278.6 20,486.3 Loans and Advances 5,997.7 8,188.6 10,103.2 10,150.1 10,620.7 Other Current Assets 6,353.2 11,027.4 10,492.5 10,952.3 13,972.7 Cash 1,473.9 1,822.4 3,122.5 5,623.4 8,374.6 Total Current Liabilities 21,242.7 27,823.4 32,550.7 36,010.1 42,980.9 Creditors 9,508.0 13,532.7 15,918.8 17,952.2 21,814.1
Provisions 2,188.5 2,233.4 2,865.4 3,231.4 4,144.7 Other Current Liability 9,546.2 12,057.3 13,766.5 14,826.5 17,022.1 Net Current Assets 5,112.5 7,100.2 9,194.0 11,098.3 12,732.3 Deferred Tax Assets 312.0 286.3 286.3 286.3 286.3 Assets side total 25,520.0 29,566.1 35,001.0 39,844.5 44,777.8
Source: Company, ICICIdirect.com Research
Page 59ICICI Securities Ltd | Retail Equity Research
Exhibit 125: Cash Flow Statement
(| Crore)
(Year-end March) FY10 FY11 FY12E FY13E FY14EProfit after Tax 4,417.1 4,006.8 4,269.9 4,675.6 5,302.9 Depreciation 336.3 512.1 708.9 810.7 900.7 Cash Flow before working capital cha 4,753.4 4,518.9 4,978.8 5,486.3 6,203.6
- - - - - Net Increase in Current Assets (3,272.9) (8,220.1) (5,520.9) (2,862.8) (5,853.6) Net Increase in Current Liabilities 4,522.7 6,580.8 4,727.2 3,459.5 6,970.8 Net cash flow from operating activitie 6,003.2 2,879.6 4,185.1 6,083.0 7,320.8
Africa L&T Overseas Projects Nigeria | L&T T&D SA (Properitory) Ltd
China L&T (Jiangsu) Valve Co Ltd | L&T (Wuxi) Electric Co Ltd| L&T Rubber Machinery Co |Qingdao L&T Trading Co Ltd
Malaysia Tamco Switchgear (Malasyian) SDN BHD | L&T (East Asia) SDN BHD
Indonesia PT Tamco, Indonesia
AustraliaTamco Electrical Industries, Australia Pvt Ltd
Brazil L&T Consultoria E Projecto Ltda
Countries Subsidiaries
Source: Company, ICICIdirect.com Research
Page 68ICICI Securities Ltd | Retail Equity Research
RATING RATIONALE ICICIdirect.com endeavors to provide objective opinions and recommendations. ICICIdirect.com assigns ratings to its stocks according to their notional target price vs. current market price and then categorises them as Strong Buy, Buy, Hold and Sell. The performance horizon is two years unless specified and the notional target price is defined as the analysts' valuation for a stock. Strong Buy: >15%/20% for large caps / midcaps, respectively, with high conviction; Buy: > 10%/ 15% for large caps / midcaps, respectively; Hold: Up to +/-10%; Sell: -10% or more;
ANALYST CERTIFICATION We /I, Chirag Shah PGDBM Sonabh Bubna MBA research analysts, authors and the names subscribed to this report, hereby certify that all of the views expressed in this research report accurately reflect our personal views about any and all of the subject issuer(s) or securities. We also certify that no part of our compensation was, is, or will be directly or indirectly related to the specific recommendation(s) or view(s) in this report. Analysts aren't registered as research analysts by FINRA and might not be an associated person of the ICICI Securities Inc.
Disclosures: ICICI Securities Limited (ICICI Securities) and its affiliates are a full-service, integrated investment banking, investment management and brokerage and financing group. We along with affiliates are leading underwriter of securities and participate in virtually all securities trading markets in India. We and our affiliates have investment banking and other business relationship with a significant percentage of companies covered by our Investment Research Department. Our research professionals provide important input into our investment banking and other business selection processes. ICICI Securities generally prohibits its analysts, persons reporting to analysts and their dependent family members from maintaining a financial interest in the securities or derivatives of any companies that the analysts cover.
The information and opinions in this report have been prepared by ICICI Securities and are subject to change without any notice. The report and information contained herein is strictly confidential and meant solely for the selected recipient and may not be altered in any way, transmitted to, copied or distributed, in part or in whole, to any other person or to the media or reproduced in any form, without prior written consent of ICICI Securities. While we would endeavour to update the information herein on reasonable basis, ICICI Securities, its subsidiaries and associated companies, their directors and employees (“ICICI Securities and affiliates”) are under no obligation to update or keep the information current. Also, there may be regulatory, compliance or other reasons that may prevent ICICI Securities from doing so. Non-rated securities indicate that rating on a particular security has been suspended temporarily and such suspension is in compliance with applicable regulations and/or ICICI Securities policies, in circumstances where ICICI Securities is acting in an advisory capacity to this company, or in certain other circumstances.
This report is based on information obtained from public sources and sources believed to be reliable, but no independent verification has been made nor is its accuracy or completeness guaranteed. This report and information herein is solely for informational purpose and may not be used or considered as an offer document or solicitation of offer to buy or sell or subscribe for securities or other financial instruments. Though disseminated to all the customers simultaneously, not all customers may receive this report at the same time. ICICI Securities will not treat recipients as customers by virtue of their receiving this report. Nothing in this report constitutes investment, legal, accounting and tax advice or a representation that any investment or strategy is suitable or appropriate to your specific circumstances. The securities discussed and opinions expressed in this report may not be suitable for all investors, who must make their own investment decisions, based on their own investment objectives, financial positions and needs of specific recipient. This may not be taken in substitution for the exercise of independent judgment by any recipient. The recipient should independently evaluate the investment risks. The value and return of investment may vary because of changes in interest rates, foreign exchange rates or any other reason. ICICI Securities and affiliates accept no liabilities for any loss or damage of any kind arising out of the use of this report. Past performance is not necessarily a guide to future performance. Investors are advised to see Risk Disclosure Document to understand the risks associated before investing in the securities markets. Actual results may differ materially from those set forth in projections. Forward-looking statements are not predictions and may be subject to change without notice.
ICICI Securities and its affiliates might have managed or co-managed a public offering for the subject company in the preceding twelve months. ICICI Securities and affiliates might have received compensation from the companies mentioned in the report during the period preceding twelve months from the date of this report for services in respect of public offerings, corporate finance, investment banking or other advisory services in a merger or specific transaction. It is confirmed that , Chirag Shah PGDBM Sonabh Bubna MBA research analysts and the authors of this report have not received any compensation from the companies mentioned in the report in the preceding twelve months. Our research professionals are paid in part based on the profitability of ICICI Securities, which include earnings from Investment Banking and other business.
ICICI Securities or its subsidiaries collectively do not own 1% or more of the equity securities of the Company mentioned in the report as of the last day of the month preceding the publication of the research report.
It is confirmed that , Chirag Shah PGDBM Sonabh Bubna MBA research analysts and the authors of this report or any of their family members does not serve as an officer, director or advisory board member of the companies mentioned in the report.
ICICI Securities may have issued other reports that are inconsistent with and reach different conclusion from the information presented in this report. ICICI Securities and affiliates may act upon or make use of information contained in the report prior to the publication thereof.
This report is not directed or intended for distribution to, or use by, any person or entity who is a citizen or resident of or located in any locality, state, country or other jurisdiction, where such distribution, publication, availability or use would be contrary to law, regulation or which would subject ICICI Securities and affiliates to any registration or licensing requirement within such jurisdiction. The securities described herein may or may not be eligible for sale in all jurisdictions or to certain category of investors. Persons in whose possession this document may come are required to inform themselves of and to observe such restriction.