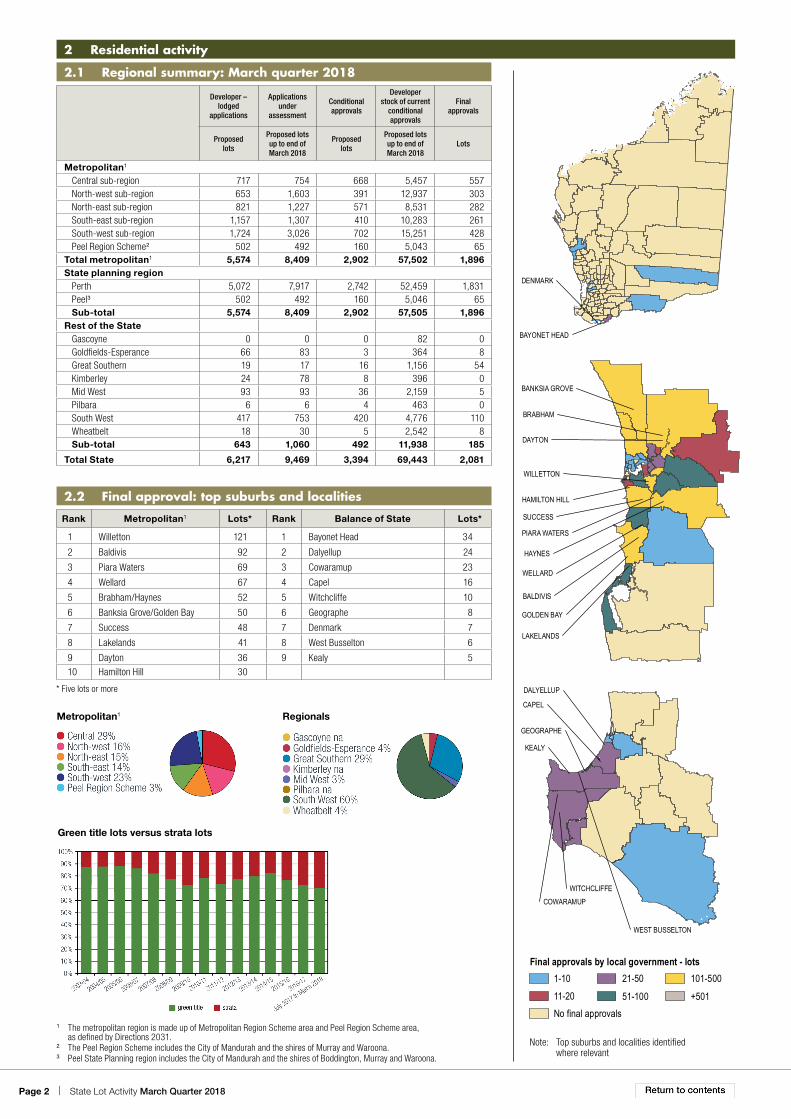
Department of Planning, Lands and Heritage • During the March 2018 quarter, the number of developer-lodged applications totalled 546 for residential purposes and 130 for non-residential purposes across Western Australia. This represents a decrease of six and seven per cent, respectively, from the previous quarter (December). • The number of proposed residential lots among the received applications increased by 25 per cent from the previous quarter to 6,217. The number of proposed non- residential increased by 31 per cent over the same quarter to 713. • By the end of March, the number of proposed lots under assessment totalled 9,469 for residential lots and 1,286 for non-residential lots. This represents an increase of 10 per cent and 21 per cent, respectively, from the previous quarter. • The number of residential conditional approvals during the quarter decreased by 27 per cent to 3,394; whereas the number of non-residential conditional approvals increased by six per cent to 438. • At the end of March, the developer stock of proposed residental lots in conditionally- approved applications totalled 69,443, which is almost the same as the previous quarter (69,423). The developer stock of proposed non-residental lots decreased by five per cent over the same period to 5,589. • The number of final approvals for residential lots and non-residential lots decreased by 35 per cent and eight per cent, respectively, to 2,081 and 516 between December and March. Contents ... Page 1 State summary ............................................... 1 2 Residential activity......................................... 2 3 Residential lot size.......................................... 3 4 Residential final approvals by suburb ............ 4 5 Rural residential and special residential activity ........................................... 6 6 Commercial activity ....................................... 7 7 Industrial activity ............................................ 8 8 Metropolitan local government summary .................................... 9 9 Balance of the State and selected local government summary .......................... 10 10 State lot approvals ....................................... 11 11 Notes ............................................................ 13 1.1 Final approval activity March quarter 2018 MARCH QUARTER 2018 Data type Stock Flow Developer – lodged applications Applications under assessment Conditional approvals Developer stock of current conditional approval Final approvals No. Proposed lots No. Proposed lots No. Proposed lots No. Proposed lots No. Proposed lots NOTE: All pie chart values within the publication have been rounded to 100% Final approvals by local government - lots 1-10 21-50 101-500 11-20 51-100 +501 No final approvals Residential Dec qtr 2017 581 4,977 583 8,579 500 4,644 3,889 69,423 535 3,191 Mar qtr 2018 546 6,217 523 9,469 529 3,394 3,868 69,443 460 2,081 July 2017 to March 2018 1,642 17,673 1,551 12,383 1,477 7,942 Change between quarters ➘ ➚ ➘ ➚ ➚ ➘ ➘ ➚ ➘ ➘ -6% 25% -10% 10% 6% -27% -1% 0% -14% -35% Non-residential Dec qtr 2017 140 544 178 1,061 147 412 711 5,892 221 559 Mar qtr 2018 130 713 164 1,286 167 438 685 5,589 221 516 July 2017 to March 2018 398 1,698 469 1,803 606 1,437 Change between quarters ➘ ➚ ➘ ➚ ➚ ➚ ➘ ➘ ➘ ➘ -7% 31% -8% 21% 14% 6% -4% -5% 0% -8% 1 State summary This version is designed to be interactive. Click on any chart for an enlarged version, and click on the chart again to close. Contents are also linked.
Transcript
Department of Planning, Lands and Heritage
• During the March 2018 quarter, the number of developer-lodged applications totalled 546 for residential purposes and 130 for non-residential purposes across Western Australia. This represents a decrease of six and seven per cent, respectively, from the previous quarter (December).
• The number of proposed residential lots among the received applications increased by 25 per cent from the previous quarter to 6,217. The number of proposed non-residential increased by 31 per cent over the same quarter to 713.
• By the end of March, the number of proposed lots under assessment totalled 9,469 for residential lots and 1,286 for non-residential lots. This represents an increase of 10 per cent and 21 per cent, respectively, from the previous quarter.
• The number of residential conditional approvals during the quarter decreased by 27 per cent to 3,394; whereas the number of non-residential conditional approvals increased by six per cent to 438.
• At the end of March, the developer stock of proposed residental lots in conditionally-approved applications totalled 69,443, which is almost the same as the previous quarter (69,423). The developer stock of proposed non-residental lots decreased by five per cent over the same period to 5,589.
• The number of final approvals for residential lots and non-residential lots decreased by 35 per cent and eight per cent, respectively, to 2,081 and 516 between December and March.
Contents ... Page
1 State summary ...............................................12 Residential activity......................................... 23 Residential lot size ..........................................34 Residential final approvals by suburb ............45 Rural residential and special residential activity ...........................................66 Commercial activity ....................................... 77 Industrial activity ............................................88 Metropolitan local government summary ....................................99 Balance of the State and selected local government summary ..........................1010 State lot approvals .......................................1111 Notes ............................................................13
1.1 Final approval activity March quarter 2018
MARCH QUARTER 2018
Dat
a ty
pe
Stock
Flow
Developer – lodged
applications
Applications under
assessment
Conditional approvals
Developer stock of current
conditional approval
Final approvals
No.Proposed
lotsNo.
Proposed lots
No.Proposed
lotsNo.
Proposed lots
No.Proposed
lots
NOTE: All pie chart values within the publication have been rounded to 100%
This version is designed to be interactive. Click on any chart for an enlarged version, and click on the chart again to close. Contents are also linked.
Rank Metropolitan1 Lots* Rank Balance of State Lots*
1 Willetton 121 1 Bayonet Head 34
2 Baldivis 92 2 Dalyellup 24
3 Piara Waters 69 3 Cowaramup 23
4 Wellard 67 4 Capel 16
5 Brabham/Haynes 52 5 Witchcliffe 10
6 Banksia Grove/Golden Bay 50 6 Geographe 8
7 Success 48 7 Denmark 7
8 Lakelands 41 8 West Busselton 6
9 Dayton 36 9 Kealy 5
10 Hamilton Hill 30
Metropolitan1 Regionals
Green title lots versus strata lots
Note: Top suburbs and localities identified where relevant
1 The metropolitan region is made up of Metropolitan Region Scheme area and Peel Region Scheme area, as defined by Directions 2031.
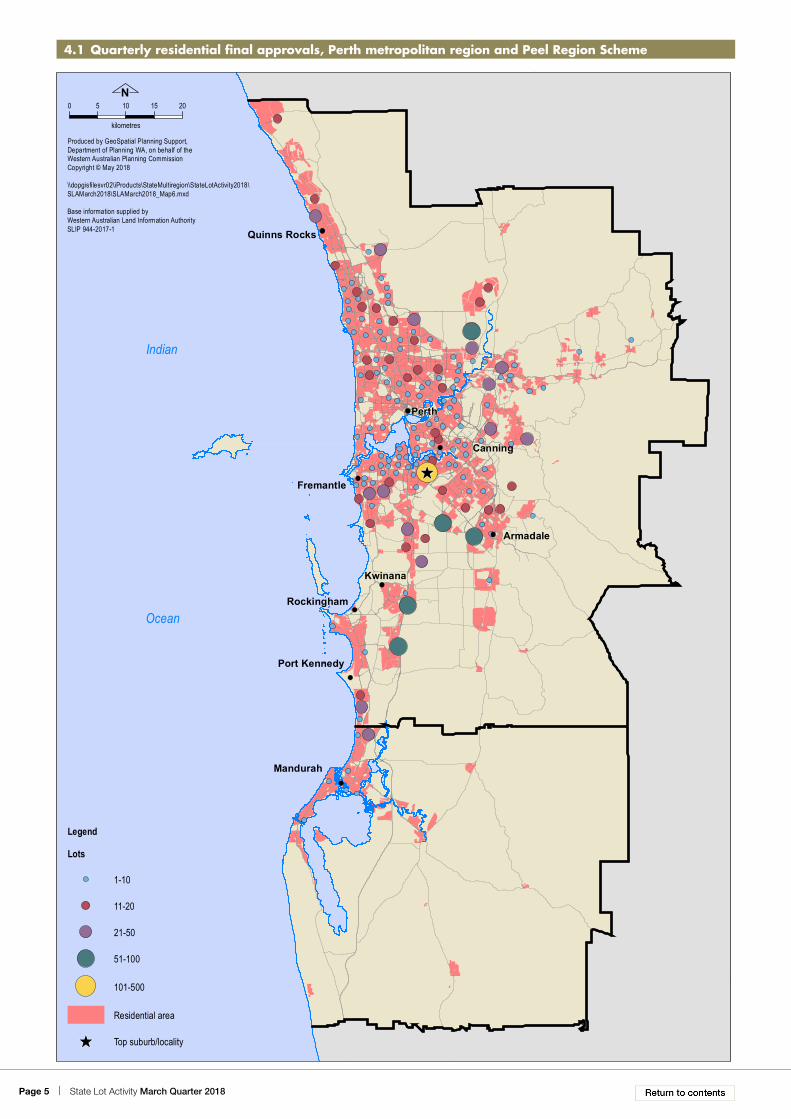
2 The Peel Region Scheme includes the City of Mandurah and the shires of Murray and Waroona. 3 Peel State Planning region includes the City of Mandurah and the shires of Boddington, Murray and Waroona.Final approval activity - March 2018 Page 2 Map 4
Land Development Program - State lot activity
DENMARK
BAYONET HEAD
HAYNES
DAYTON
SUCCESS
WELLARD
BRABHAM
BALDIVIS
LAKELANDS
WILLETTON
GOLDEN BAY
BANKSIA GROVE
PIARA WATERS
HAMILTON HILL
CAPEL
KEALY
DALYELLUP
COWARAMUPWITCHCLIFFE
GEOGRAPHE
WEST BUSSELTON
Final approvals by local government - lots1-10 21-50 101-50011-20 51-100 +501No final approvals
Residential
* Five lots or more
Page 3 | State Lot Activity March Quarter 2018
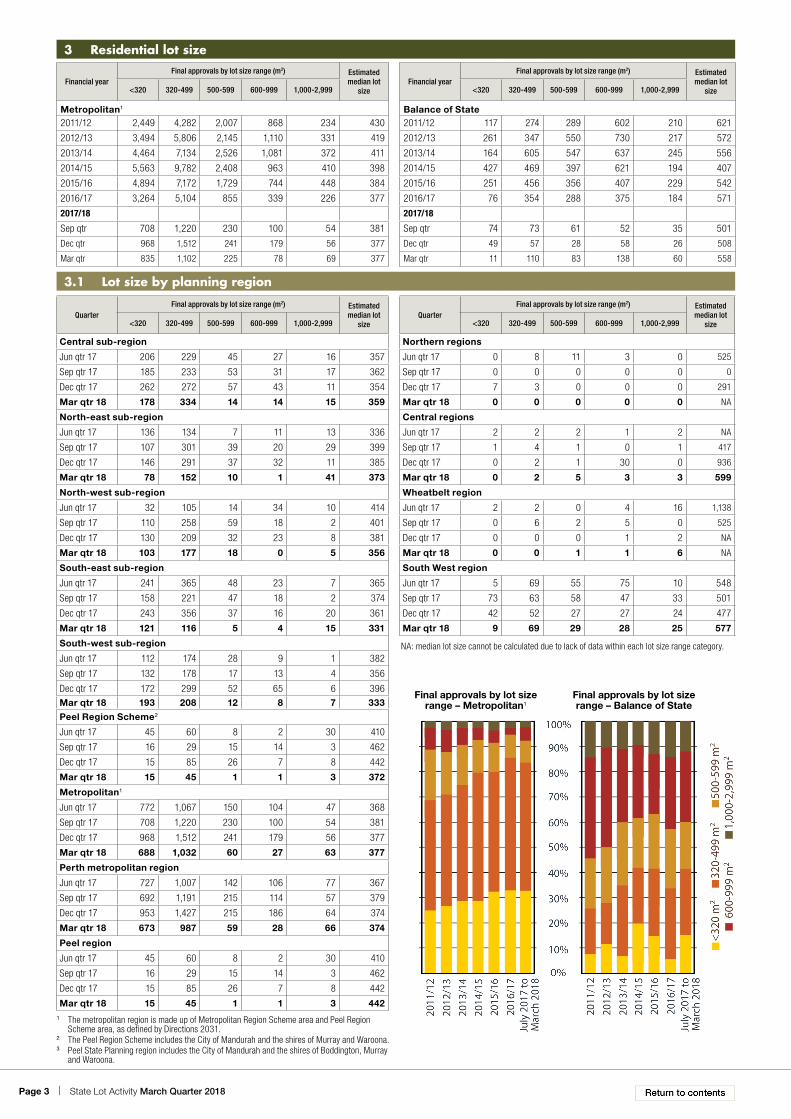
QuarterFinal approvals by lot size range (m2) Estimated
median lot size
QuarterFinal approvals by lot size range (m2) Estimated
median lot size<320 320-499 500-599 600-999 1,000-2,999 <320 320-499 500-599 600-999 1,000-2,999
Central sub-region Northern regions
Jun qtr 17 206 229 45 27 16 357 Jun qtr 17 0 8 11 3 0 525
Dec qtr 968 1,512 241 179 56 377 Dec qtr 49 57 28 58 26 508
Mar qtr 835 1,102 225 78 69 377 Mar qtr 11 110 83 138 60 558
1 The metropolitan region is made up of Metropolitan Region Scheme area and Peel Region Scheme area, as defined by Directions 2031.
2 The Peel Region Scheme includes the City of Mandurah and the shires of Murray and Waroona. 3 Peel State Planning region includes the City of Mandurah and the shires of Boddington, Murray
and Waroona.
NA: median lot size cannot be calculated due to lack of data within each lot size range category.
1 The metropolitan region is made up of Metropolitan Region Scheme area and Peel Region Scheme area, as defined by Directions 2031.
2 The Peel Region Scheme includes the City of Mandurah and the shires of Murray and Waroona. 3 Peel State Planning region includes the City of Mandurah and the shires of Boddington, Murray and Waroona.Final approval activity - March 2018 Page 6 Map 8
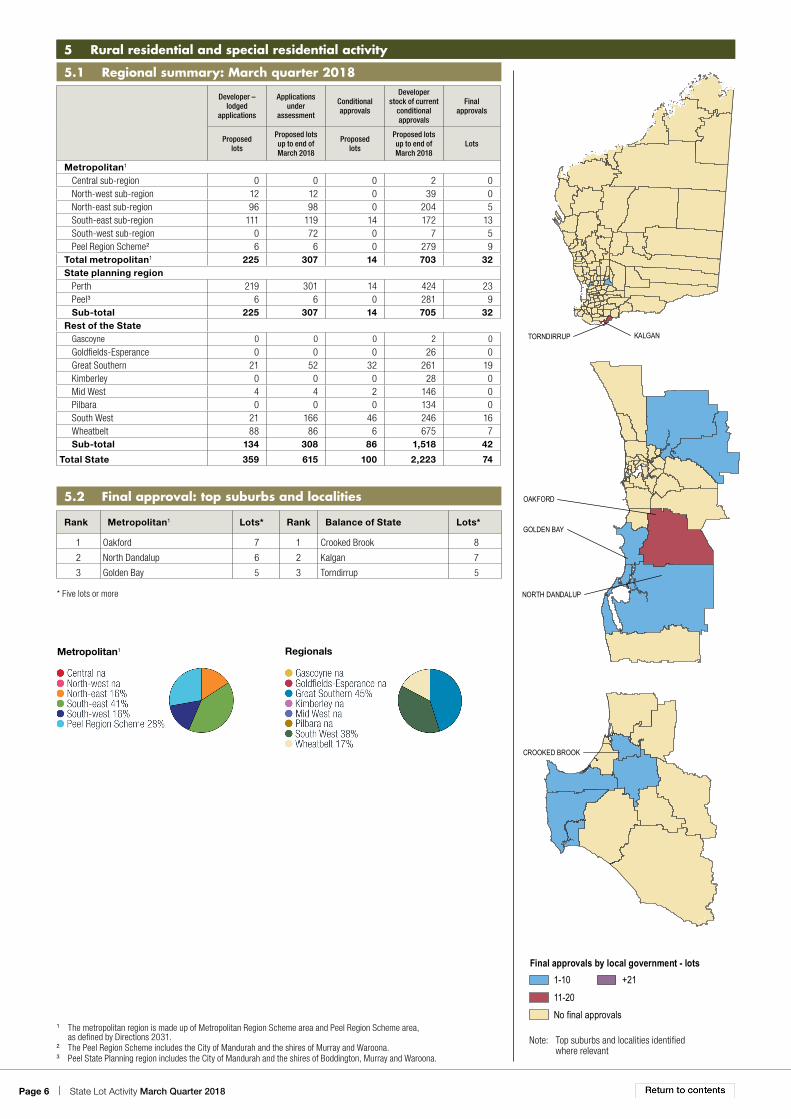
Land Development Program - State lot activity
KALGANTORNDIRRUP
OAKFORD
GOLDEN BAY
NORTH DANDALUP
CROOKED BROOK
Final approvals by local government - lots1-10 +2111-20No final approvals
Rural residential
Page 7 | State Lot Activity March Quarter 2018
# Heading
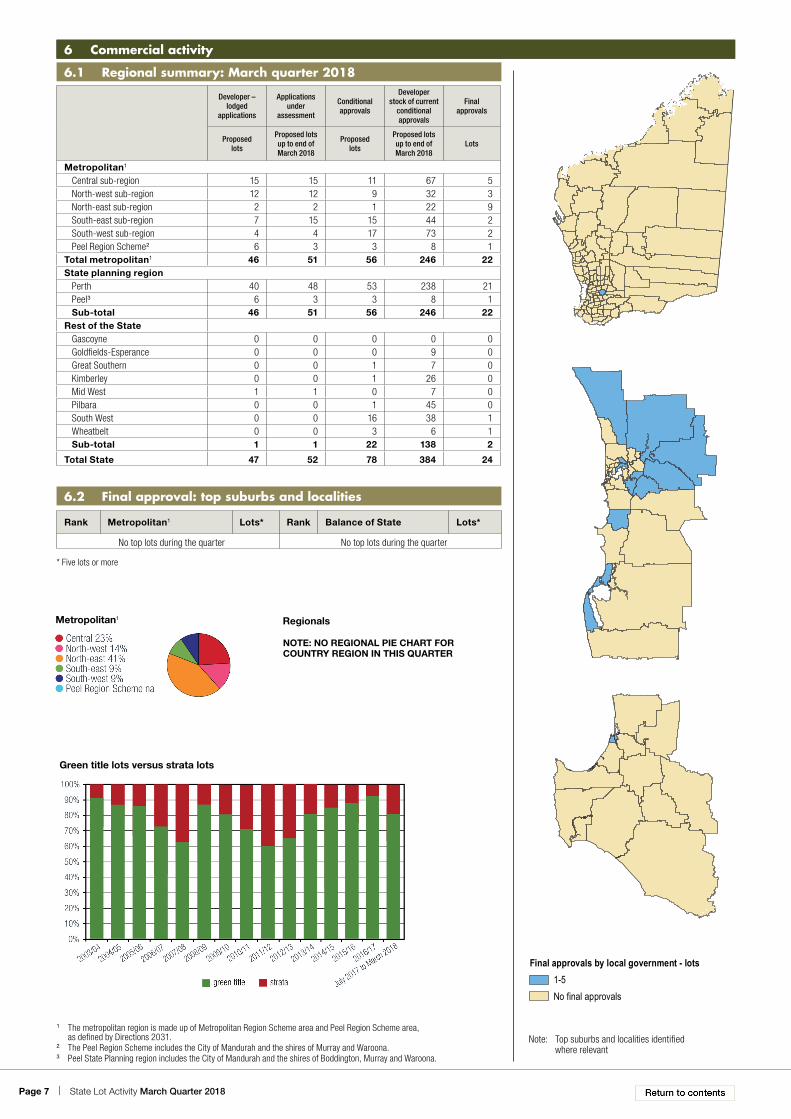
6.2 Final approval: top suburbs and localities
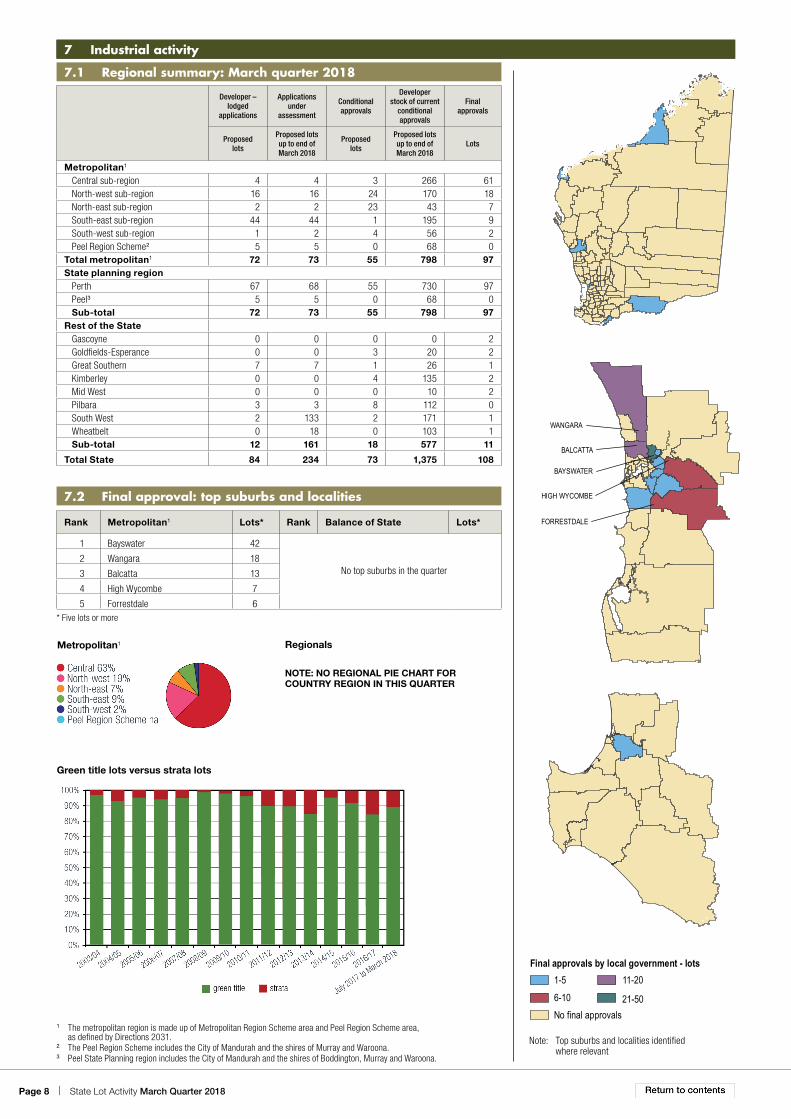
6 Commercial activity
6.1 Regional summary: March quarter 2018
Metropolitan1
Green title lots versus strata lots
Note: Top suburbs and localities identified where relevant
1 The metropolitan region is made up of Metropolitan Region Scheme area and Peel Region Scheme area, as defined by Directions 2031.
2 The Peel Region Scheme includes the City of Mandurah and the shires of Murray and Waroona. 3 Peel State Planning region includes the City of Mandurah and the shires of Boddington, Murray and Waroona.Final approval activity - March 2018 Page 7 Map 11
Land Development Program - State lot activity Commercial
Final approvals by local government - lots1-5No final approvals
Rank Metropolitan1 Lots* Rank Balance of State Lots*
No top lots during the quarter No top lots during the quarter
NOTE: NO REGIONAL PIE CHART FOR COUNTRY REGION IN THIS QUARTER
1 The metropolitan region is made up of Metropolitan Region Scheme area and Peel Region Scheme area, as defined by Directions 2031.
2 The Peel Region Scheme includes the City of Mandurah and the shires of Murray and Waroona. 3 Peel State Planning region includes the City of Mandurah and the shires of Boddington, Murray and Waroona.Final approval activity - March 2018 Page 8 Map 14
Land Development Program - State lot activity
WANGARA
BALCATTA
BAYSWATER
FORRESTDALE
HIGH WYCOMBE
Final approvals by local government - lots
No final approvals
Industrial
1-56-10
11-20
21-50
7.2 Final approval: top suburbs and localities
Rank Metropolitan1 Lots* Rank Balance of State Lots*
1 Bayswater 42
No top suburbs in the quarter2 Wangara 18
3 Balcatta 13
4 High Wycombe 7
5 Forrestdale 6
Metropolitan1 Regionals
* Five lots or more
NOTE: NO REGIONAL PIE CHART FOR COUNTRY REGION IN THIS QUARTER
Note: Top suburbs and localities identified where relevant
Total Perth metropolitan region and Peel Region Scheme 5,574 8,409 2,902 57,502 1,896 425 544 200 2,152 357
Note: (C) City, (T) Town, and (S) Shire
1 The metropolitan region is made up of Metropolitan Region Scheme area and Peel Region Scheme area, as defined by Directions 2031.
2 The Peel Region Scheme includes the City of Mandurah and the shires of Murray and Waroona. 3 Peel State Planning region includes the City of Mandurah and the shires of Boddington, Murray and Waroona.
Page 10 | State Lot Activity March Quarter 2018
9 Balance of the State and selected local government summary
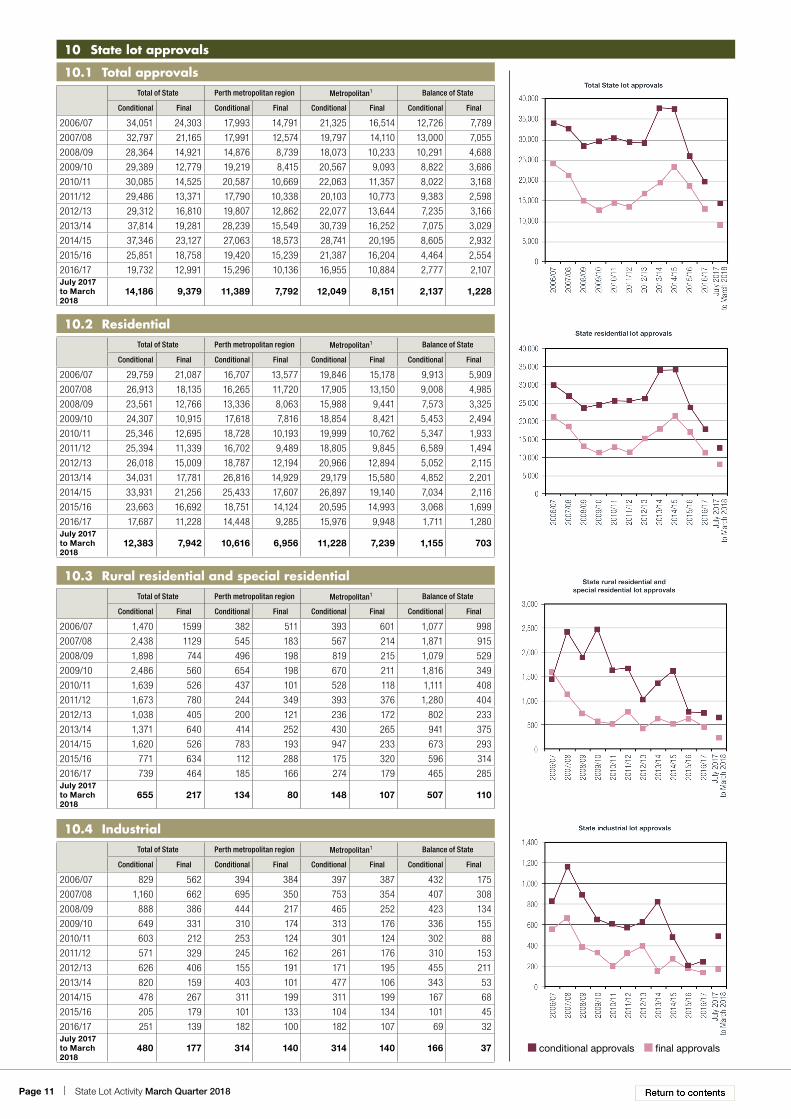
2016/17 17,687 11,228 14,448 9,285 15,976 9,948 1,711 1,280July 2017 to March 2018
12,383 7,942 10,616 6,956 11,228 7,239 1,155 703
10.2 Residential
Total of State Perth metropolitan region Metropolitan1 Balance of State
Conditional Final Conditional Final Conditional Final Conditional Final
2006/07 1,470 1599 382 511 393 601 1,077 998
2007/08 2,438 1129 545 183 567 214 1,871 915
2008/09 1,898 744 496 198 819 215 1,079 529
2009/10 2,486 560 654 198 670 211 1,816 349
2010/11 1,639 526 437 101 528 118 1,111 408
2011/12 1,673 780 244 349 393 376 1,280 404
2012/13 1,038 405 200 121 236 172 802 233
2013/14 1,371 640 414 252 430 265 941 375
2014/15 1,620 526 783 193 947 233 673 293
2015/16 771 634 112 288 175 320 596 314
2016/17 739 464 185 166 274 179 465 285July 2017 to March 2018
655 217 134 80 148 107 507 110
10.3 Rural residential and special residential
Total of State Perth metropolitan region Metropolitan1 Balance of State
Conditional Final Conditional Final Conditional Final Conditional Final
2006/07 829 562 394 384 397 387 432 175
2007/08 1,160 662 695 350 753 354 407 308
2008/09 888 386 444 217 465 252 423 134
2009/10 649 331 310 174 313 176 336 155
2010/11 603 212 253 124 301 124 302 88
2011/12 571 329 245 162 261 176 310 153
2012/13 626 406 155 191 171 195 455 211
2013/14 820 159 403 101 477 106 343 53
2014/15 478 267 311 199 311 199 167 68
2015/16 205 179 101 133 104 134 101 45
2016/17 251 139 182 100 182 107 69 32July 2017 to March 2018
480 177 314 140 314 140 166 37
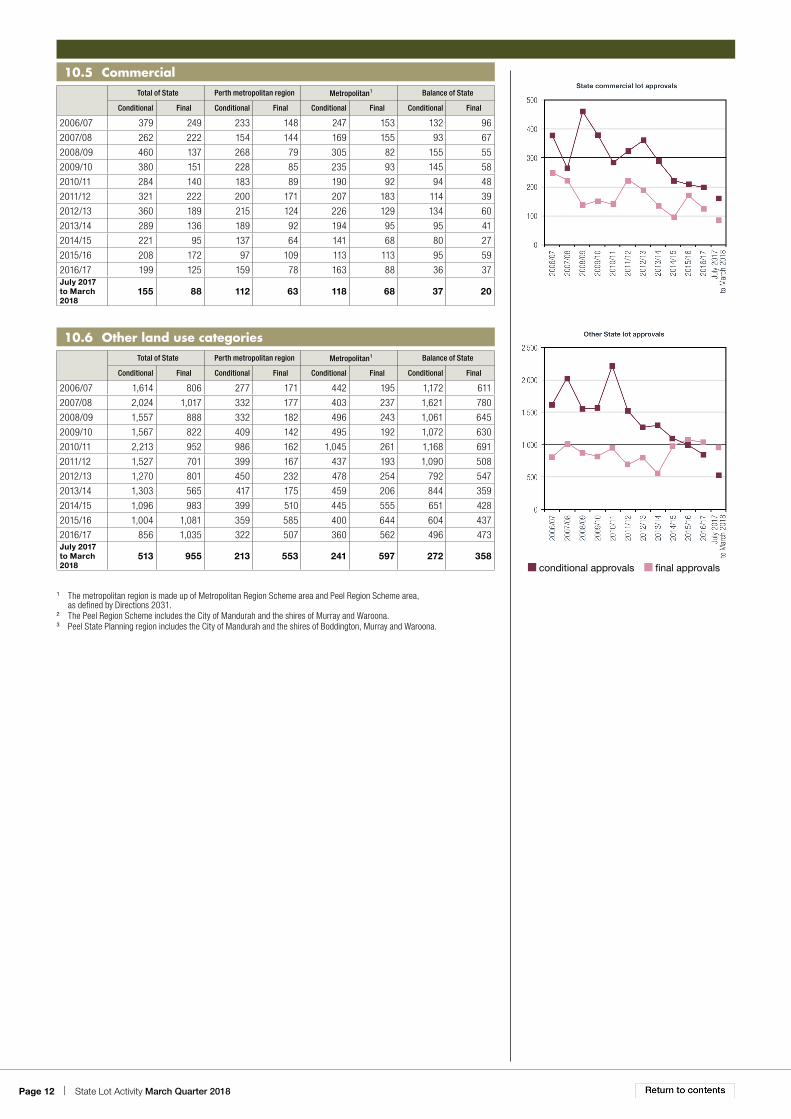
10.4 Industrial
Page 12 | State Lot Activity March Quarter 2018
conditional approvals final approvals
Total of State Perth metropolitan region Metropolitan1 Balance of State
Conditional Final Conditional Final Conditional Final Conditional Final
2006/07 379 249 233 148 247 153 132 96
2007/08 262 222 154 144 169 155 93 67
2008/09 460 137 268 79 305 82 155 55
2009/10 380 151 228 85 235 93 145 58
2010/11 284 140 183 89 190 92 94 48
2011/12 321 222 200 171 207 183 114 39
2012/13 360 189 215 124 226 129 134 60
2013/14 289 136 189 92 194 95 95 41
2014/15 221 95 137 64 141 68 80 27
2015/16 208 172 97 109 113 113 95 59
2016/17 199 125 159 78 163 88 36 37July 2017 to March 2018
155 88 112 63 118 68 37 20
10.5 Commercial
Total of State Perth metropolitan region Metropolitan1 Balance of State
Conditional Final Conditional Final Conditional Final Conditional Final
2006/07 1,614 806 277 171 442 195 1,172 611
2007/08 2,024 1,017 332 177 403 237 1,621 780
2008/09 1,557 888 332 182 496 243 1,061 645
2009/10 1,567 822 409 142 495 192 1,072 630
2010/11 2,213 952 986 162 1,045 261 1,168 691
2011/12 1,527 701 399 167 437 193 1,090 508
2012/13 1,270 801 450 232 478 254 792 547
2013/14 1,303 565 417 175 459 206 844 359
2014/15 1,096 983 399 510 445 555 651 428
2015/16 1,004 1,081 359 585 400 644 604 437
2016/17 856 1,035 322 507 360 562 496 473July 2017 to March 2018
513 955 213 553 241 597 272 358
10.6 Other land use categories
1 The metropolitan region is made up of Metropolitan Region Scheme area and Peel Region Scheme area, as defined by Directions 2031.
2 The Peel Region Scheme includes the City of Mandurah and the shires of Murray and Waroona. 3 Peel State Planning region includes the City of Mandurah and the shires of Boddington, Murray and Waroona.
Page 13 | State Lot Activity March Quarter 2018
11 Notes
Introduction
This publication contains statistical details of subdivision activity in Western Australia.
Coverage
1. Lot creation statistics are compiled from subdivision (including survey strata and vacant strata) applications lodged with the Western Australian Planning Commission (WAPC) for approval.
2. These statistics relate to lots for residential and non-residential purposes; for urban residential lots less than 3,000 square metres; and all non-residential and residential strata lots, irrespective of size. The non-residential component of these statistics includes counts of rural residential and special residential lots.
3. Strata lot statistics provided include all survey strata lots and vacant strata lots that require determination by the WAPC. Built strata lots are not included in the strata lot statistics because they do not require determination by the WAPC.
Definitions
Developer – lodged applications refers to those applications received by the WAPC for the purpose of subdivision.
Applications under assessment is the number of applications under assessment for conditional approval by the WAPC and includes those which have been deferred.
Conditional approval is granted by the WAPC for subdivision development to begin. The approval is preceded by an assessment of the proposed subdivision plan in consultation with servicing agencies. On receipt of conditional approval, the proponent may commence subdivision development in accordance with the conditions of approval within four years of the approval date. These approval conditions are based on outcomes from the consultative assessment.
Current conditional approvals are approvals creating five lots or less not older than three years and approvals for more than five lots not older than four years.
Formerly, development of lots was to be completed within three years. This period has been extended to four years by the Planning and Development Act 2005 proclaimed on 9 April 2006. State lot activity statistics for the June quarter 2006 and later, reflect the new legislation.
Final approval is the WAPC endorsement of the proponent’s submitted deposited plan or strata/survey strata plan describing the now complete subdivision constructed in accordance with the conditions set down in the conditional approval.
Deposited plans/strata plans that have final approval are registered with Landgate (formerly Department of Land Information) where certificates of titles for the newly created lots can be issued. The characteristic difference in lot numbers seen between conditional and final approvals arises from proponents choosing not to proceed with the subdivision in the specified four year period in accordance with the conditions of the conditional approval; either at all, only in part, or via another conditional approval incorporating a new plan for the subject land.
Green title lot is a conventional land parcel shown on a deposited plan registered with Landgate. The purpose of the lot is determined by an appropriate zoning under the relevant local government local planning scheme.
Survey strata is a new form of strata created by the Strata Titles Amendment Act 1995. Simply, it defines ownership of a land parcel without reference to a building, even though buildings exist or will be constructed on all parcels. Survey strata schemes are either all vacant or all developed, excluding those lots where ownership is shared as common property. The lots on a survey strata plan look much the same as lots that are shown on plans and diagrams for green titles.
Vacant strata is created by the subdivision of a lot containing an existing dwelling. On coming into existence the strata plan will comprise a mix of developed and vacant lots, of which at least one will contain a dwelling.
Estimated median lot size is calculated from a count of created lots grouped within lot size intervals that have become standards of the Department’s application processing. This is an estimate only. An accurate median needs to be calculated from counts using the specific size of each created lot.
Contact
For more information regarding the data, please call (08) 6551 8002.
Caveat
Any statement, opinion or advice, expressed or implied in this publication is made in good faith but on the basis that the WAPC, its agents and employees are not liable to any person for any damage or loss whatsoever which has occurred or may occur in relation to that person taking or not taking action in respect of any statement, or advice referred to in this document.
Reproduction of these statistics, either in part or full, is permitted. However, acknowledgement of the source would be appreciated.
Page 14 | State Lot Activity March Quarter 2018
This document is available in alternative formats on application to the Department of Planning, Lands and Heritage Communication Branch.
Notes
Geographic explanation
Data in this publication is presented by local government area and State planning region.
State planning regionPerth metropolitan region• Central sub-region• North-east sub-region• North-west sub-region• South-east sub-region• South-west sub-region
Peel planning region• City of Mandurah• Shire of Murray• Shire of Waroona• Shire of Boddington
Gascoyne
Goldfields-Esperance
Great Southern
Kimberley
Mid West
Pilbara
South West
Wheatbelt
MetropolitanIncludes the following local government areas:
Central sub-region• Town of Bassendean• City of Bayswater• City of Belmont• Town of Cambridge• City of Canning• Town of Claremont• Town of Cottesloe• Town of East Fremantle• City of Fremantle• City of Melville• Town of Mosman Park• City of Nedlands• Shire of Peppermint Grove• City of Perth• City of South Perth• City of Stirling• City of Subiaco• Town of Victoria Park• City of Vincent
North-east sub-region• City of Kalamunda• Shire of Mundaring• City of Swan
North-west sub-region• City of Wanneroo• City of Joondalup
South-east sub-region• City of Armadale• City of Gosnells• Shire of Serpentine-Jarahdale
South-west sub-region• City of Cockburn• Town of Kwinana• City of Rockingham
Peel Region Scheme• City of Mandurah• Shire of Murray• Shire of Waroona
Balance of StateIncludes all regional planning regions plus the Shire of Boddington. Excludes the Metropolitan region.
RegionalsNorthen regions• Includes the Kimberley and Pilbara
planning regions
Central regions• Includes the Gascoyne, Mid West
and Goldfields-Esperance planning regions
Wheatbealt region• Refers to the Wheatbelt planning
region
South West regions• Includes the South West and Great


![Item-06-AI0000030418€¦ · ^E Á } v µ ] } v _ µ ] o ] v P W u ] Data 1st Qtr 2016 2nd Qtr 2016 3rd Qtr 2016 4th Qtr 2016 1st Qtr 2017 Permits $ Value Permits $ Value Permits](https://static.documents.pub/doc/80x56/5fcb107d1e181d01d75aae23/item-06-ai0000030418-e-v-v-o-v-p-w-u-data-1st-qtr-2016-2nd.jpg)


