Marcus Ziegler SCIPP/UCSC Pulsar Meeting 1/17/2006 1 Fourier Transform with Fourier Transform with differences on differences on Simulated and Real Pulsar Data Simulated and Real Pulsar Data Gamma-ray Large Gamma-ray Large Area Space Area Space Telescope Telescope Marcus Ziegler Bill Atwood Brian Baughman Robert Johnson
Transcript
Marcus Ziegler SCIPP/UCSC Pulsar Meeting 1/17/2006 1
Fourier Transform with differences on Fourier Transform with differences on Simulated and Real Pulsar Data Simulated and Real Pulsar Data Gamma-ray Large Gamma-ray Large
Area Space Area Space TelescopeTelescope
Marcus Ziegler
Bill Atwood
Brian Baughman
Robert Johnson
Marcus Ziegler SCIPP/UCSC Pulsar Meeting 1/17/2006 2
Fourier Transform on DifferencesFourier Transform on Differences
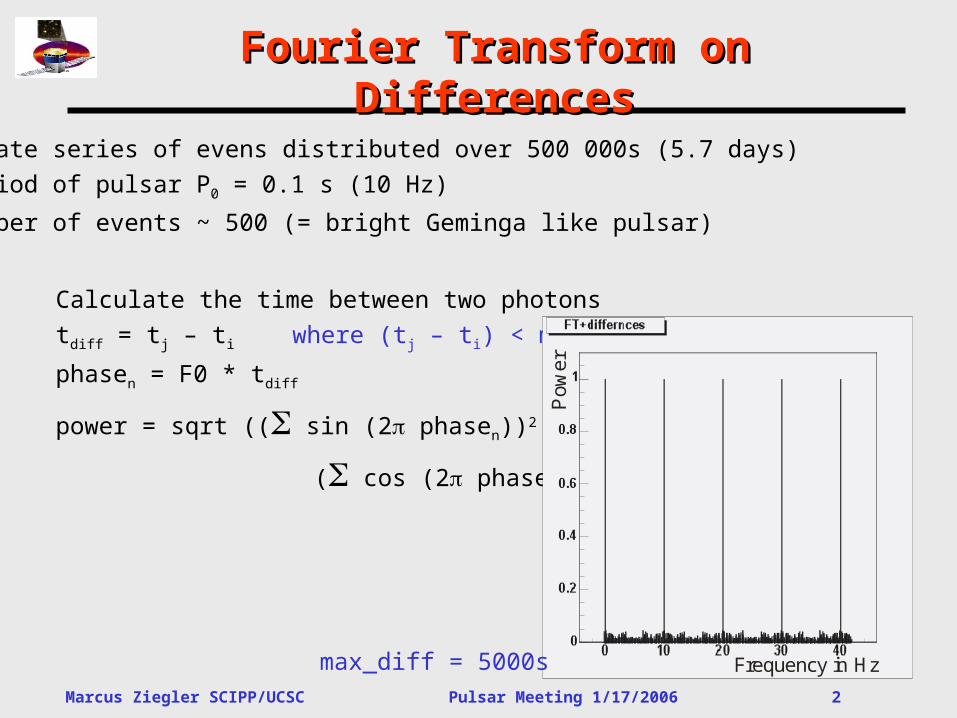
Calculate the time between two photons
tdiff = tj – ti where (tj – ti) < max_diff
phasen = F0 * tdiff
power = sqrt (( sin (2 phasen))2 +
( cos (2 phasen))2) /n
Frequency in Hz
Pow
er
max_diff = 5000s
Create series of evens distributed over 500 000s (5.7 days)
Period of pulsar P0 = 0.1 s (10 Hz)
Number of events ~ 500 (= bright Geminga like pulsar)
Marcus Ziegler SCIPP/UCSC Pulsar Meeting 1/17/2006 3
Dependence on max_diffDependence on max_diff
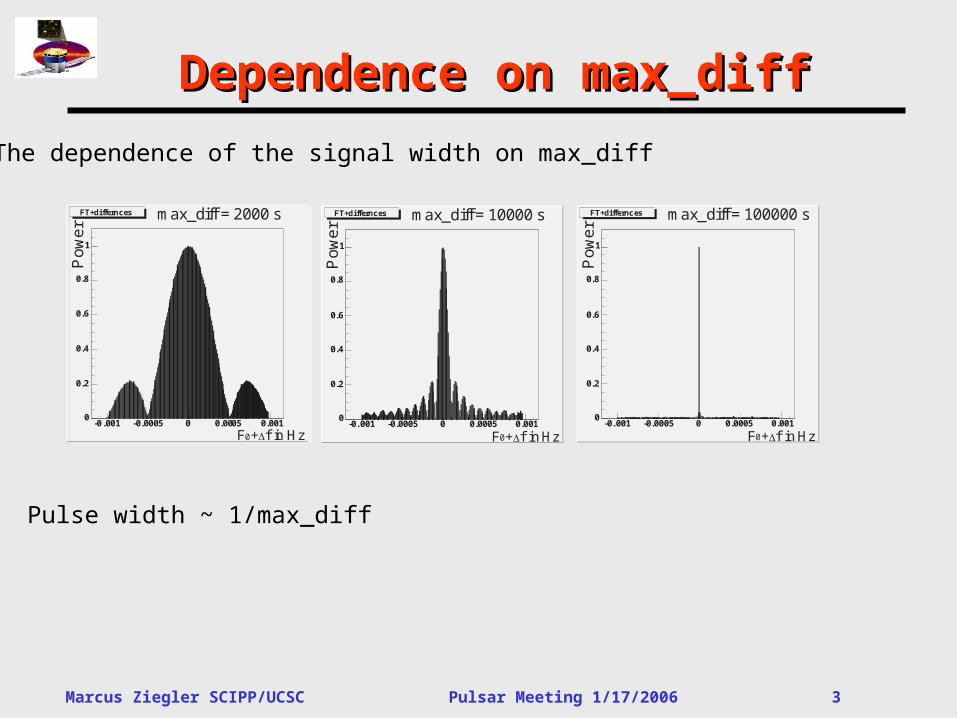
The dependence of the signal width on max_diff
-0 .001 -0.0005 0 0.0005 0.0010
0.2
0.4
0.6
0.8
1
FT+differnces
F + f in Hz0
Po
we
r
max_diff = 2000 s
-0. 001 -0.0005 0 0.0005 0.0010
0.2
0.4
0.6
0.8
1
FT+differnces
F + f in Hz0
Pow
er
max_diff = 10000 s
-0. 001 -0.0005 0 0.0005 0.0010
0.2
0.4
0.6
0.8
1
FT+differnces
F + f in Hz0
Pow
er
max_diff = 100000 s
Pulse width ~ 1/max_diff
Marcus Ziegler SCIPP/UCSC Pulsar Meeting 1/17/2006 4
Dependence on max_diffDependence on max_diff
Frequency in Hz
Pow
er
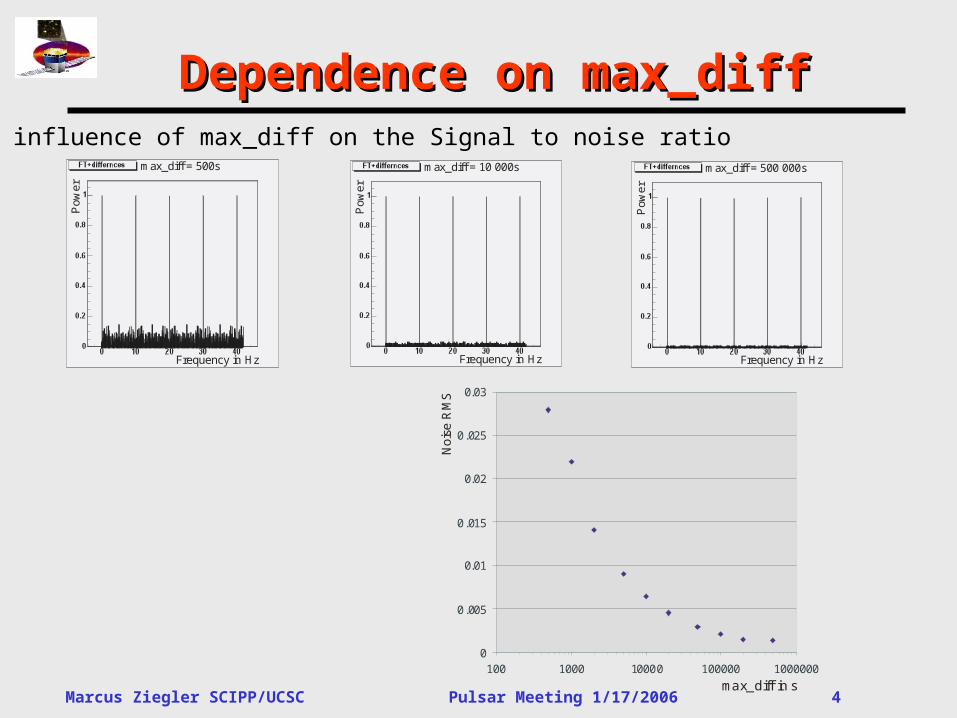
max_diff = 500 000s
Frequency in Hz
Pow
er
max_diff = 500s
Frequency in HzP
ower
max_diff = 10 000s
The influence of max_diff on the Signal to noise ratio
0
0.005
0.01
0.015
0.02
0.025
0.03
100 1000 10000 100000 1000000
max_diff in s
No
ise
RM
S
Marcus Ziegler SCIPP/UCSC Pulsar Meeting 1/17/2006 5
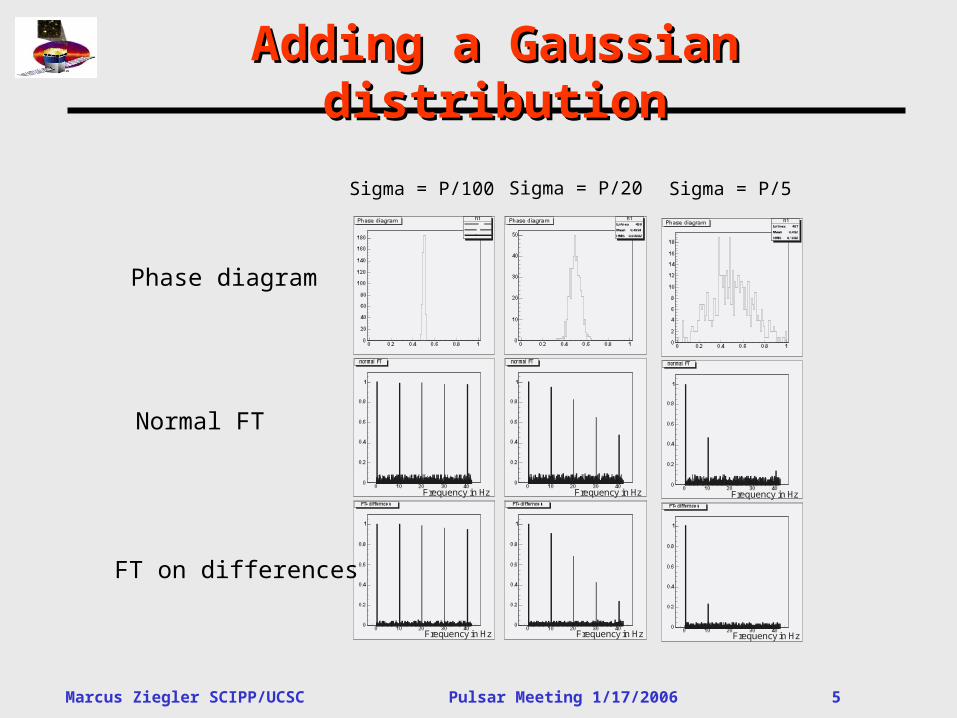
Adding a Gaussian distributionAdding a Gaussian distribution
Phase diagram
Frequency in Hz
Frequency in Hz
Frequency in Hz
Frequency in Hz
Frequency in Hz
Frequency in Hz
Normal FT
FT on differences
Sigma = P/5Sigma = P/20Sigma = P/100
Marcus Ziegler SCIPP/UCSC Pulsar Meeting 1/17/2006 6
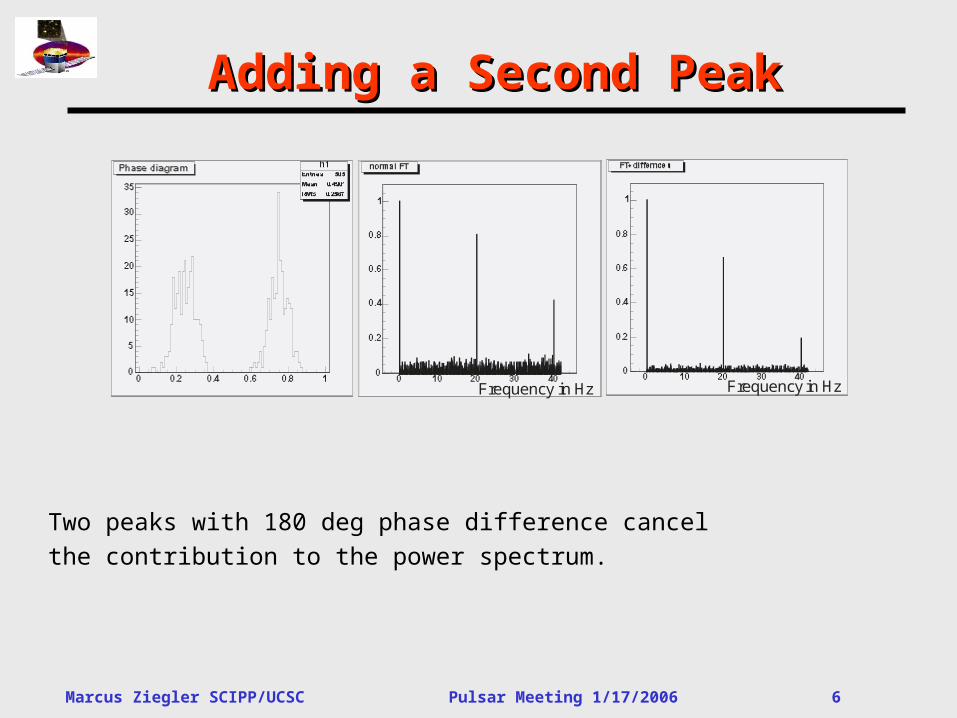
Adding a Second PeakAdding a Second Peak
Frequency in Hz Frequency in Hz
Two peaks with 180 deg phase difference cancel
the contribution to the power spectrum.
Marcus Ziegler SCIPP/UCSC Pulsar Meeting 1/17/2006 7
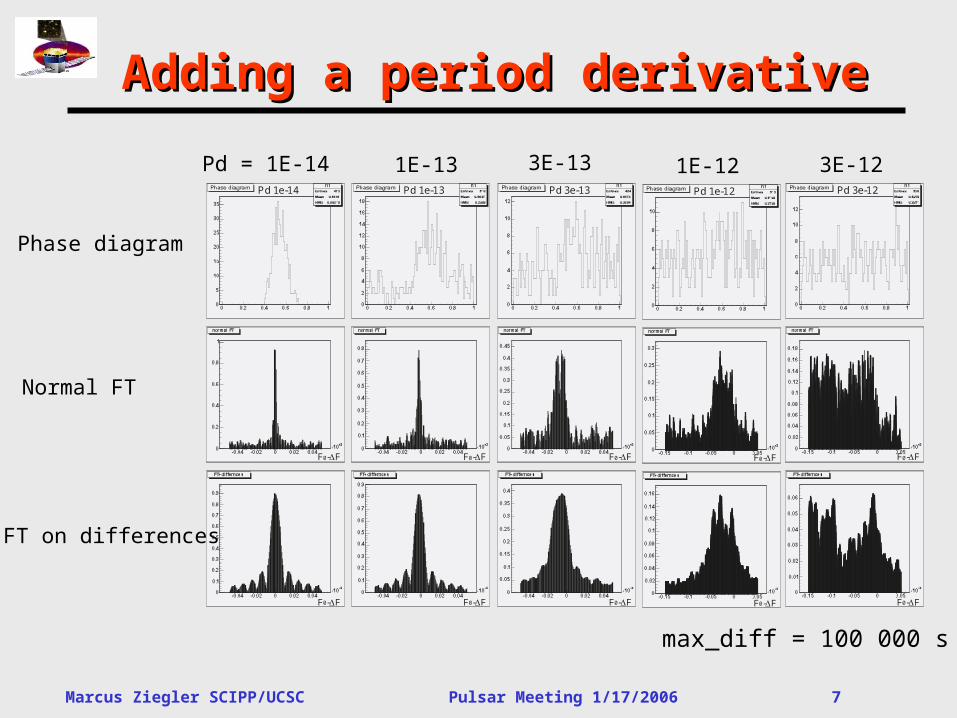
Adding a period derivativeAdding a period derivative
max_diff = 100 000 s
F - F0
F - F0
Pd 1e-14
F - F0
F - F0
Pd 1e-13
F - F0
F - F0
Pd 3e-13
F - F0
F - F0
Pd 1e-12
F - F0
F - F0
Pd 3e-12
Phase diagram
Normal FT
FT on differences
Pd = 1E-14 1E-13 3E-13 1E-12 3E-12
Marcus Ziegler SCIPP/UCSC Pulsar Meeting 1/17/2006 8
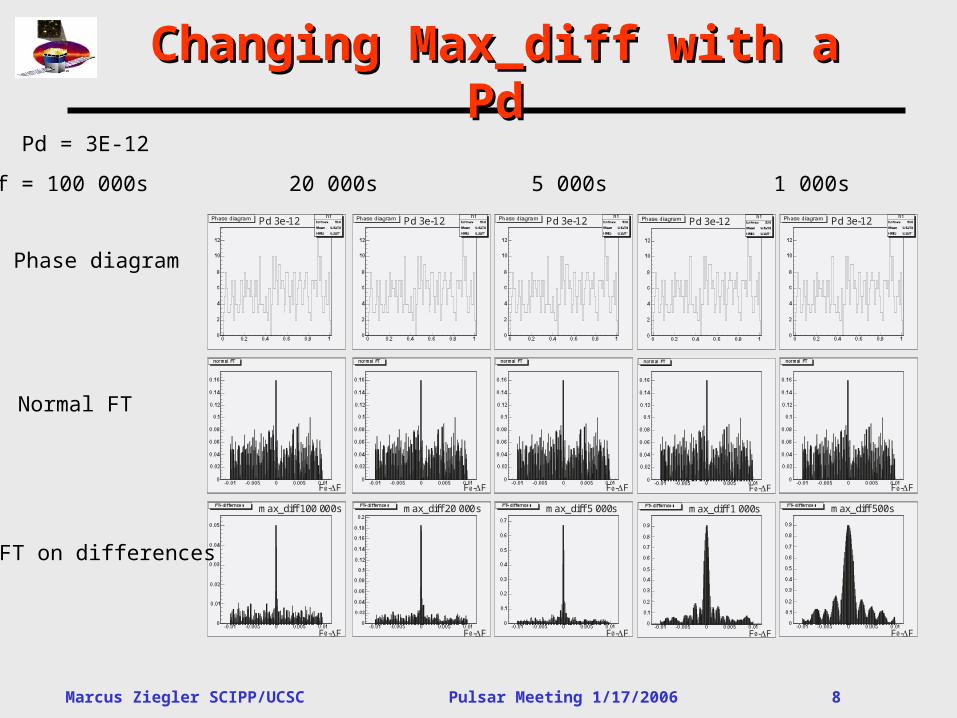
Changing Max_diff with a PdChanging Max_diff with a Pd
F - F0
F - F0
max_diff 100 000s
Pd 3e-12
F - F0
F - F0
max_diff 20 000s
Pd 3e-12
F - F0
F - F0
max_diff 5 000s
Pd 3e-12
F - F0
F - F0
max_diff 1 000s
Pd 3e-12
F - F0
F - F0
max_diff 500s
Pd 3e-12
Phase diagram
Normal FT
FT on differences
Pd = 3E-12
max_diff = 100 000s 20 000s 5 000s 1 000s 500s
Marcus Ziegler SCIPP/UCSC Pulsar Meeting 1/17/2006 9
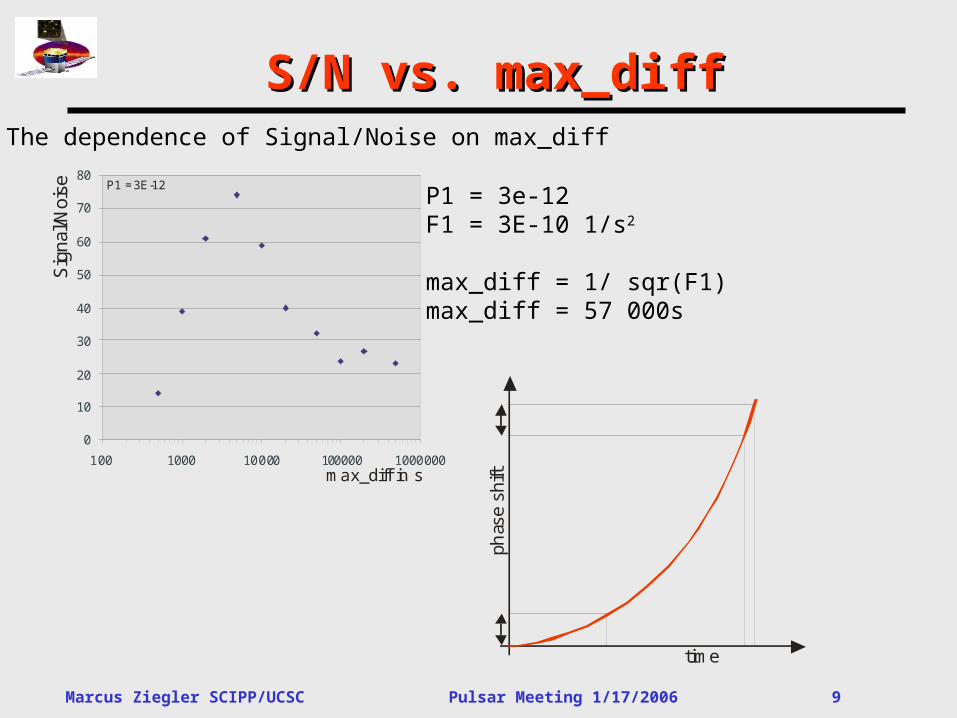
S/N vs. max_diffS/N vs. max_diffThe dependence of Signal/Noise on max_diff
0
10
20
30
40
50
60
70
80
100 1000 10000 100000 1000000
Sig
nal/N
oise
max_diff in s
P1 = 3E-12P1 = 3e-12 F1 = 3E-10 1/s2
max_diff = 1/ sqr(F1)max_diff = 57 000s
phas
e sh
ift
time
Marcus Ziegler SCIPP/UCSC Pulsar Meeting 1/17/2006 10
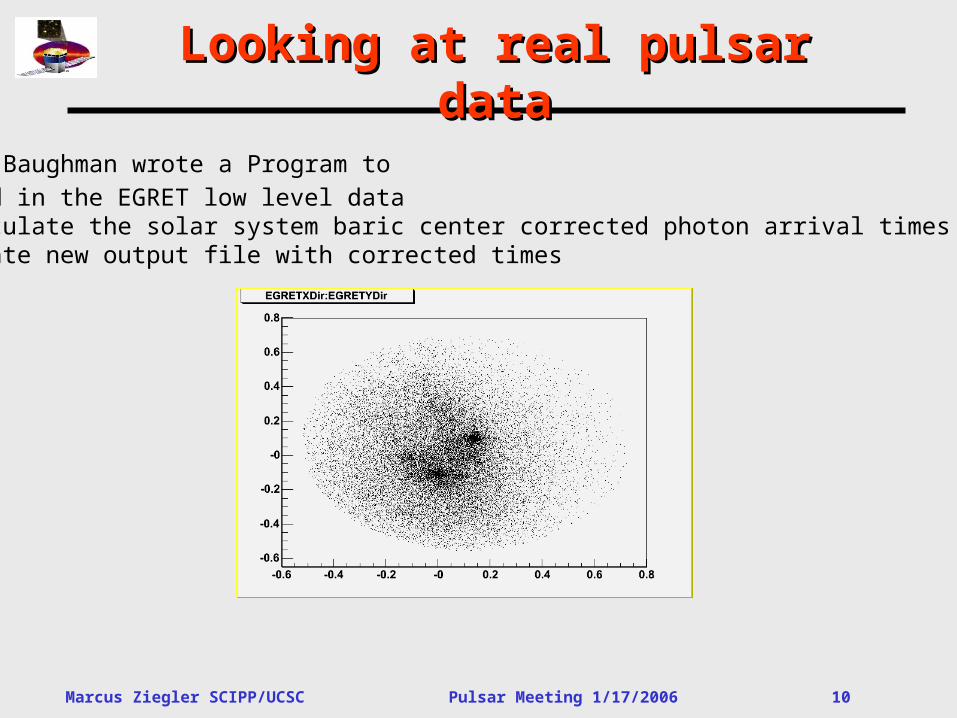
Looking at real pulsar dataLooking at real pulsar data
Brian Baughman wrote a Program to- read in the EGRET low level data- calculate the solar system baric center corrected photon arrival times- create new output file with corrected times
Marcus Ziegler SCIPP/UCSC Pulsar Meeting 1/17/2006 11
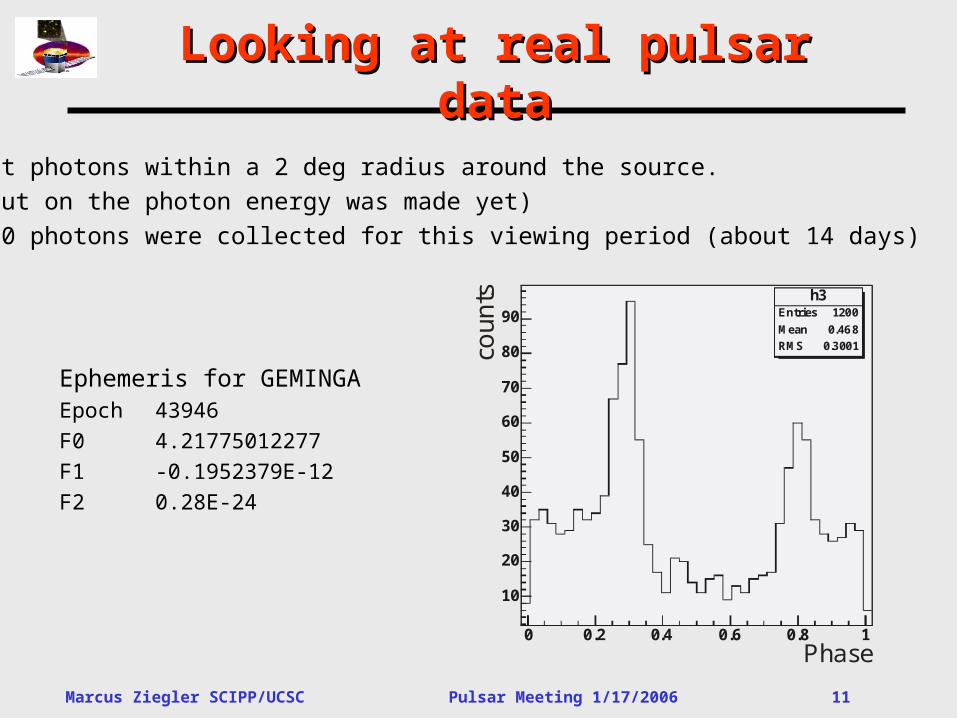
Looking at real pulsar dataLooking at real pulsar data
Select photons within a 2 deg radius around the source.
(no cut on the photon energy was made yet)
- 1200 photons were collected for this viewing period (about 14 days)
Ephemeris for GEMINGAEpoch 43946
F0 4.21775012277
F1 -0.1952379E-12
F2 0.28E-24
h3Entries 1200
Mean 0.468
RMS 0.3001
0 0.2 0.4 0.6 0.8 1
10
20
30
40
50
60
70
80
90h3
Entries 1200
Mean 0.468
RMS 0.3001
Phase
coun
ts
Marcus Ziegler SCIPP/UCSC Pulsar Meeting 1/17/2006 12
Ft on differencesFt on differences
Max_diff 10 000s
Po
we
r
4.2172 4.2178 4.21840
0.005
0.01
0.015
0.02
0.025
0.03
0.035 Power (f)
Po
we
r
Max_diff 100 000s
Frequency scan around GEMINGAs F0 with correction for F1
Marcus Ziegler SCIPP/UCSC Pulsar Meeting 1/17/2006 13
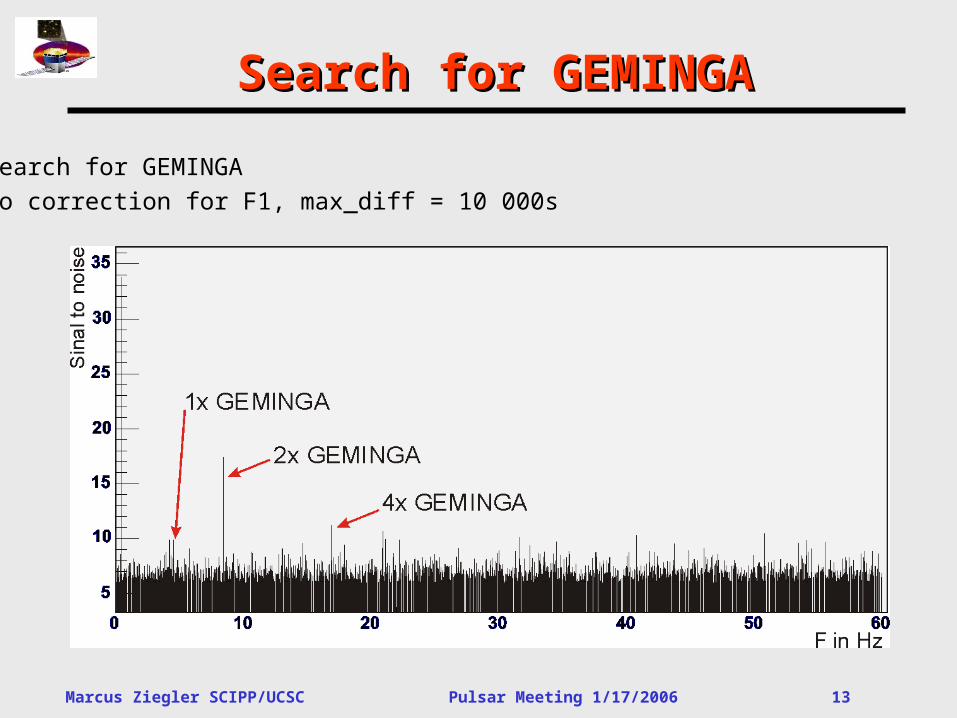
Search for GEMINGASearch for GEMINGA
Search for GEMINGA
no correction for F1, max_diff = 10 000s
Marcus Ziegler SCIPP/UCSC Pulsar Meeting 1/17/2006 14
Conclusion and OutlookConclusion and Outlook
The Fourier Transform on the differences is very simple and powerful
This method tolerates uncertainties in the ephemeris data
A very good “noise” separation can be achieved by tuning max_diff