30
RTU Savings Research Project RTU Savings Research Project: Findings and Recommendations Regional Technical Forum February 3, 2009 Mark Cherniack Howard Reichmuth New Buildings Institute
| Date post: | 04-Jan-2016 |
| Category: |
Documents |
| Upload: | rogan-humphrey |
| View: | 29 times |
| Download: | 0 times |
RTU Savings Research Project
RTU Savings Research Project: Findings and Recommendations
Regional Technical ForumFebruary 3, 2009
Mark Cherniack
Howard Reichmuth
New Buildings Institute
RTU Savings Research Project
RTU Savings Research Project
• Phased RTU Research program– Phase 1: Identify the known savings and cost-
effectiveness data; establish priorities for Phase 2 research
– Phase 2: Conduct the Phase 1 recommended research activities
– Phase 3: To be determined by outcome of Phase 2; an expanded field test was envisioned
RTU Savings Research Project
Phase 2 RTU Research Project
• Bench test controller/sensor issue
• Apply field measurement and service protocol to RTUs
• Develop an annual savings methodology based on the measured data
• Review existing utility RTU program data
• Propose a Phase 3 work plan
RTU Savings Research Project
Review Existing Data Set
• 70% had the controller being tested
• 1% used enthalpy sensors with unknown drift and calibration, although only dry-bulb sensing is necessary in our climate
• 56% had only a single stage of cooling wired, which significantly curtailed economizer use
• 73% used single changeover point (one outdoor sensor and no return air sensor), 27% used a differential changeover strategy
RTU Savings Research Project
Phase 2 RTU Research ProjectBench Test
• Economizer control problem identified
• Tested specific Honeywell controller/sensor combo
• Found 6-10 degF deadband in sensor-limited economizer cooling
• Honeywell verifies sensor finding
• Recommendations made for new sensor
RTU Savings Research Project
RTU Savings Research ProjectBench Test
5
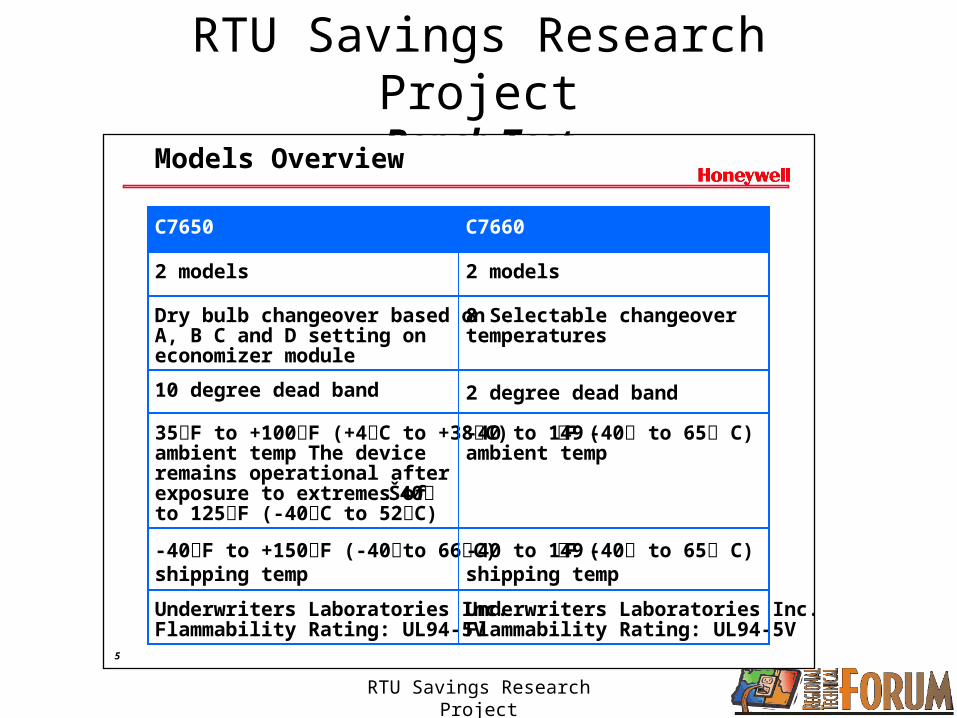
Models Overview
2 degree dead band10 degree dead band
-40 to 149F (-40 to 65 C)shipping temp
-40F to +150F (-40to 66C)shipping temp
-40 to 149F (-40 to 65 C)ambient temp
35F to +100F (+4C to +38C)ambient temp The deviceremains operational afterexposure to extremes of Š40to 125F (-40C to 52C)
8 Selectable changeovertemperatures
Dry bulb changeover based onA, B C and D setting oneconomizer module
Underwriters Laboratories Inc.Flammability Rating: UL94-5V
Underwriters Laboratories Inc.Flammability Rating: UL94-5V
2 models2 models
C7660C7650
RTU Savings Research Project
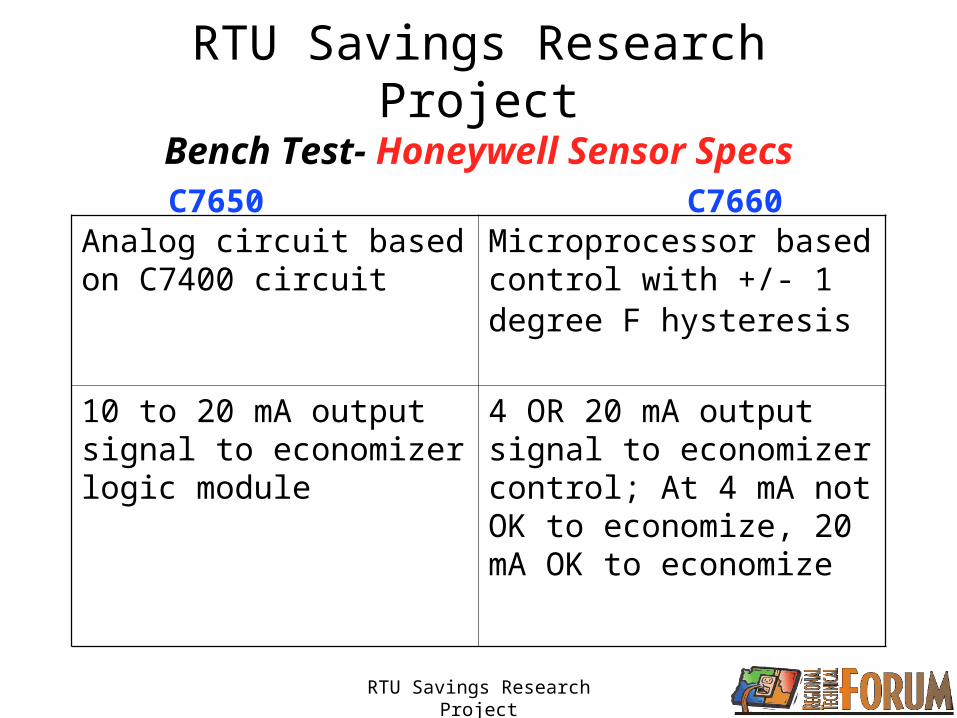
RTU Savings Research ProjectBench Test- Honeywell Sensor Specs
Analog circuit based on C7400 circuit
Microprocessor based control with +/- 1 degree F hysteresis
10 to 20 mA output signal to economizer logic module
4 OR 20 mA output signal to economizer control; At 4 mA not OK to economize, 20 mA OK to economize
C7650 C7660
RTU Savings Research Project
RTU Savings Research ProjectBench Test Recommendations
• Ensure that the old Honeywell sensor is not being used in new HVAC units coming in through utility HVAC EE programs
• Notify a wide band of HVAC market stakeholders
• Establish benefits of adding the new sensor to utility RTU field service protocols
• Consider regional bulk sensor purchase
RTU Savings Research Project
RTU Savings Research Project RTU Field Measurement & Service Protocol
• 9 initial sites recruited; 5 have little cooling load. 3 sites provided sufficient signature data for analysis and consideration
• Metering was more than sufficient for the minimum monitoring package
• Analyzed three preliminary Bonneville sites
RTU Savings Research Project
RTU Savings Research ProjectRTU Service Protocol
• Thermostat reset and/or replacement
• Measured airflow through the evaporator
• Economizer system check
• Additional control potential
• Refrigerant charge check/adjustment as needed
RTU Savings Research Project
RTU Savings Research ProjectRTU Monitoring
• RTU total power
• RTU fan power
• Gas burner status
• Damper position
• Condensate flow
• Outdoor air temperature (2 measurements)
• Return/mixed (4 measurements) temperatures
• Supply air temperature
RTU Savings Research Project
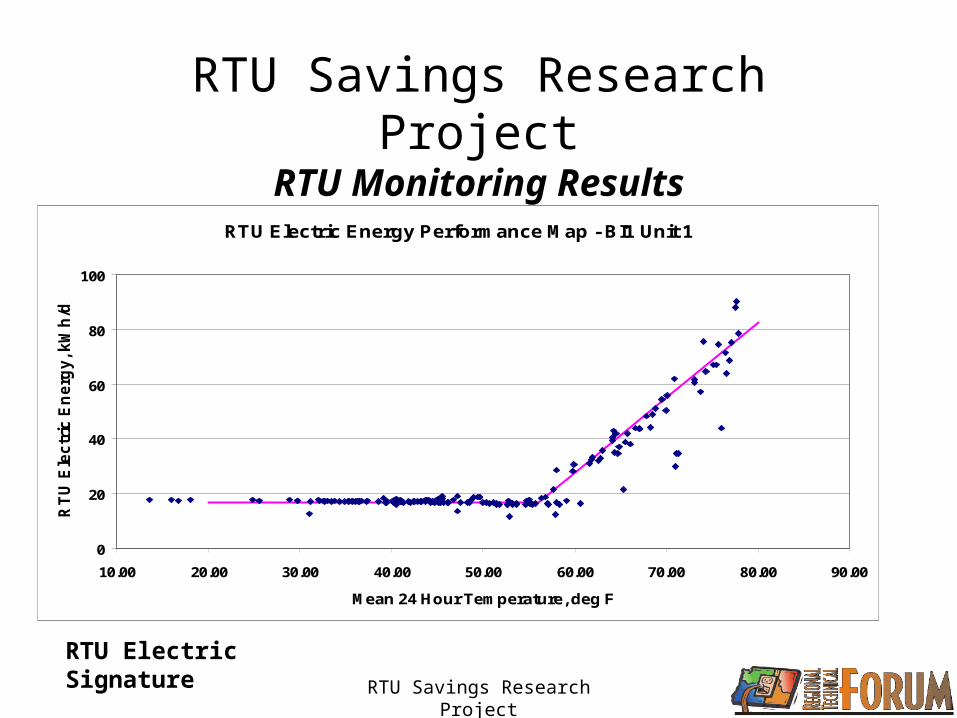
RTU Savings Research ProjectRTU Monitoring Results
RTU Electric Energy Performance Map - BI1 Unit 1
0
20
40
60
80
100
10.00 20.00 30.00 40.00 50.00 60.00 70.00 80.00 90.00
Mean 24 Hour Temperature, deg F
RT
U E
lec
tric
En
erg
y, k
Wh
/da
y
RTU Electric Signature
RTU Savings Research Project
RTU Savings Research Project Anatomy of an RTU Energy Signature
• Cooling balance point temperature
• ‘Flat’ low temperature slope
• Cooling slope
RTU Savings Research Project
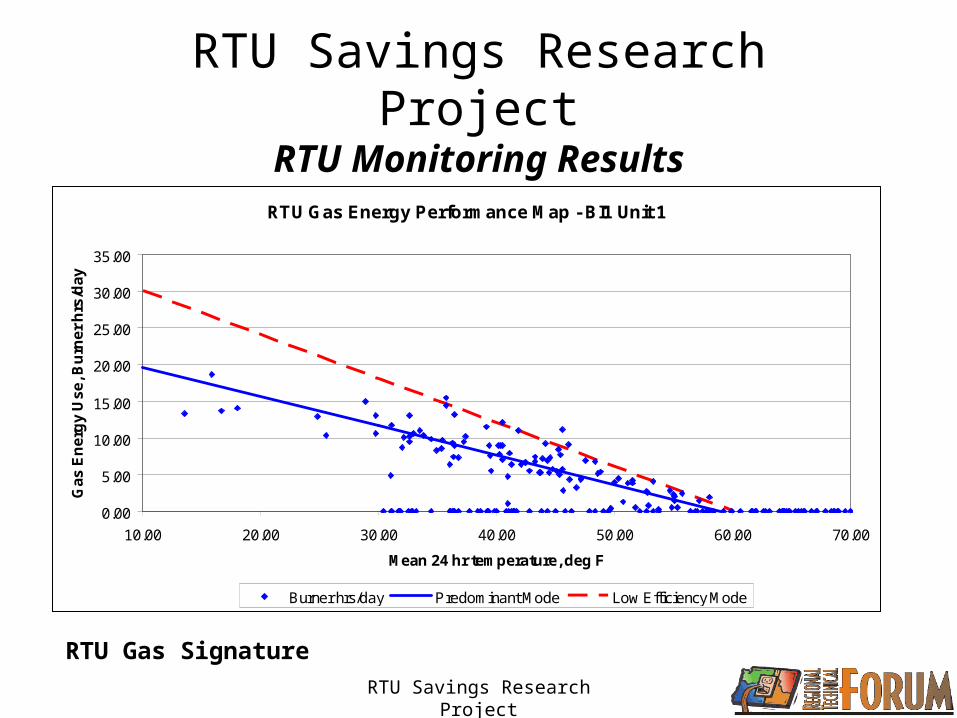
RTU Savings Research ProjectRTU Monitoring Results
RTU Gas Signature
RTU Gas Energy Performance Map - BI1 Unit 1
0.00
5.00
10.00
15.00
20.00
25.00
30.00
35.00
10.00 20.00 30.00 40.00 50.00 60.00 70.00
Mean 24 hr temperature, deg F
Ga
s E
ne
rgy
Us
e, B
urn
er
hrs
/da
y
Burner hrs/day Predominant Mode Low Efficiency Mode
RTU Savings Research Project
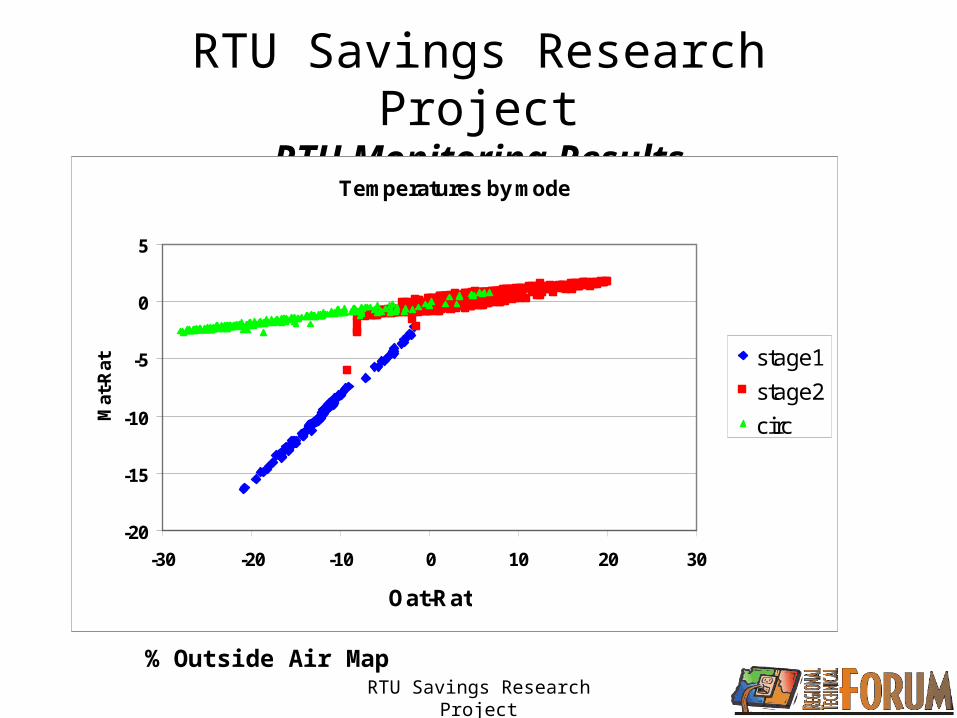
RTU Savings Research ProjectRTU Monitoring Results
% Outside Air Map
Temperatures by mode
-20
-15
-10
-5
0
5
-30 -20 -10 0 10 20 30
Oat-Rat
Mat
-Rat stage1
stage2
circ
RTU Savings Research Project
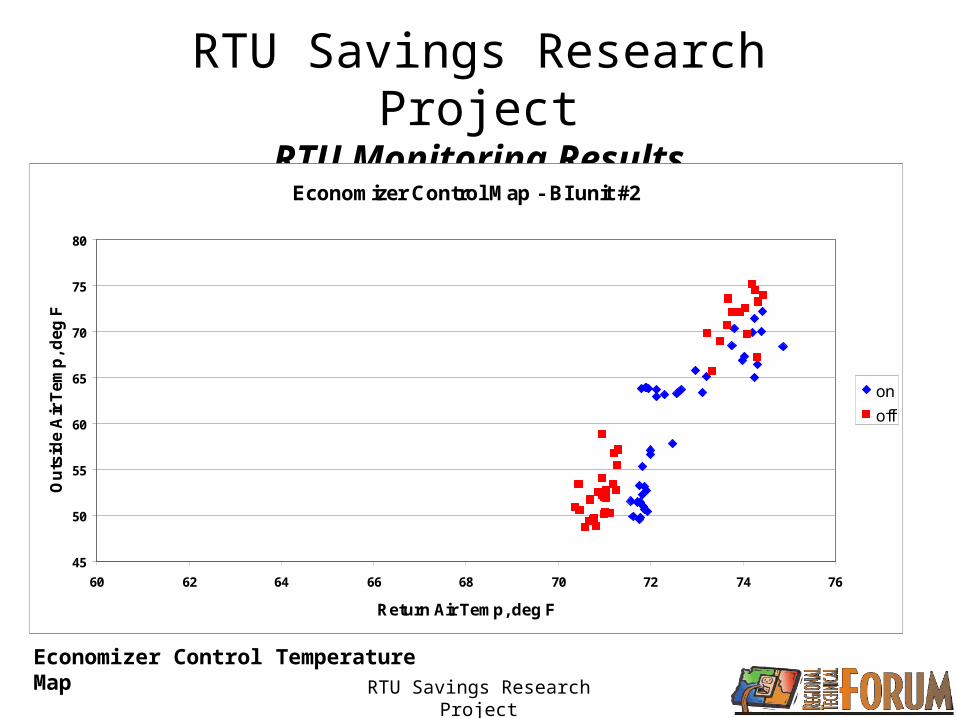
RTU Savings Research ProjectRTU Monitoring Results
Economizer Control Map - BI unit #2
45
50
55
60
65
70
75
80
60 62 64 66 68 70 72 74 76
Return Air Temp, deg F
Ou
tsid
e A
ir T
em
p, d
eg
F
on
off
Economizer Control Temperature Map
RTU Savings Research Project
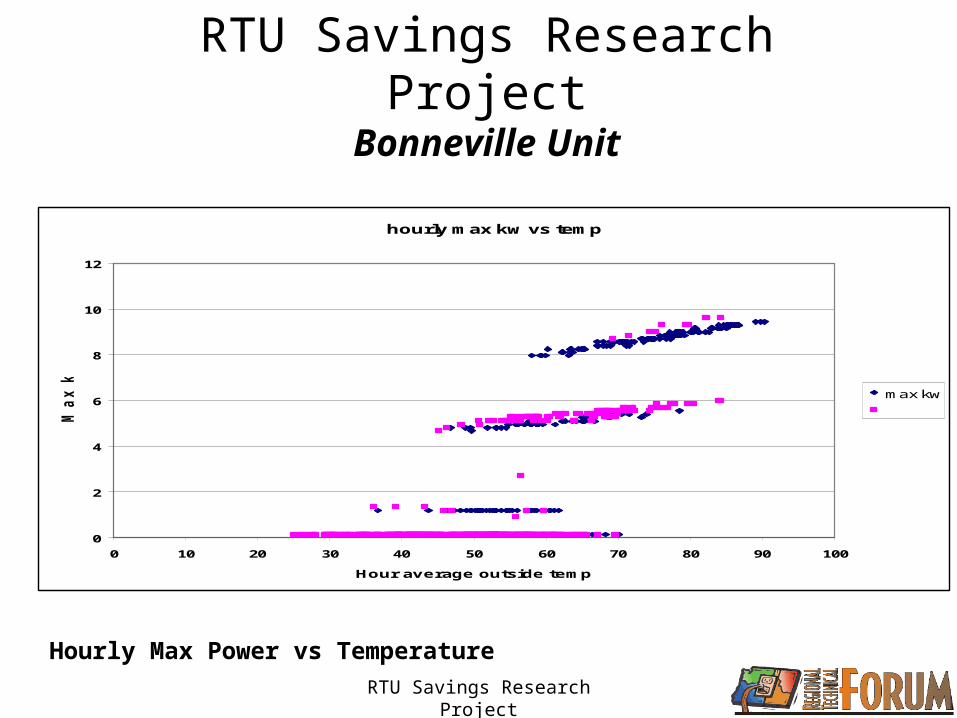
RTU Savings Research ProjectBonneville Unit
hourly max kw vs temp
0
2
4
6
8
10
12
0 10 20 30 40 50 60 70 80 90 100
Hour average outside temp
Ma
x k
W
max kw
Hourly Max Power vs Temperature
RTU Savings Research Project
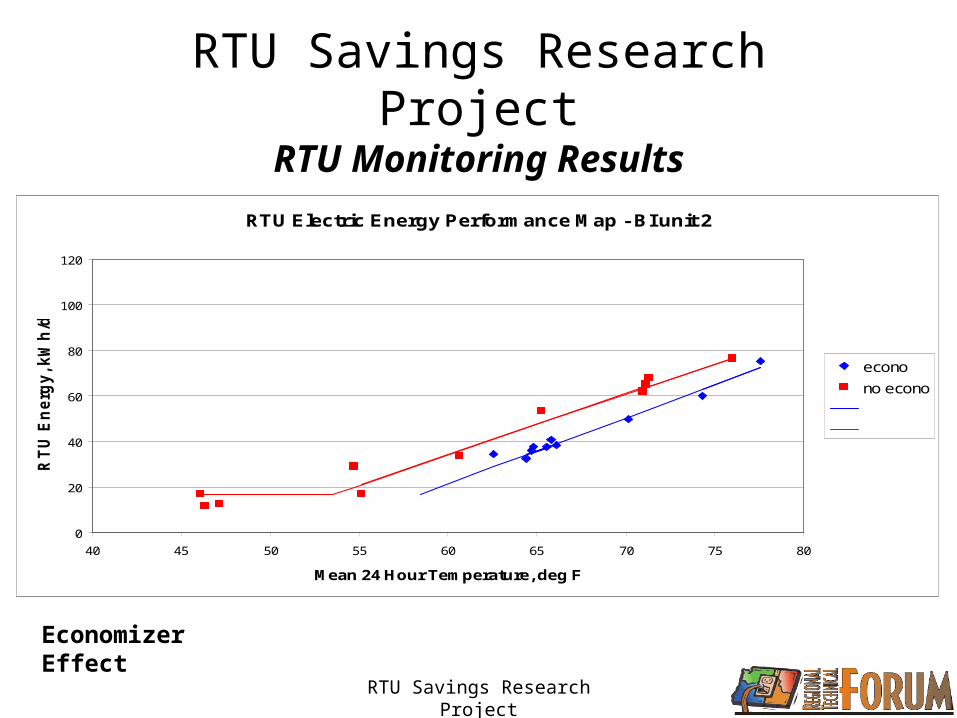
RTU Savings Research ProjectRTU Monitoring Results
RTU Electric Energy Performance Map - BI unit 2
0
20
40
60
80
100
120
40 45 50 55 60 65 70 75 80
Mean 24 Hour Temperature, deg F
RT
U E
ne
rgy
, k
Wh
/da
y
econo
no econo
Economizer Effect
RTU Savings Research Project
RTU Savings Research ProjectAnnual Savings Methodology
• Average daily site temperature
• Daily RTU energy [electric/gas] signature
• Histogram of site daily normal avg temperature
@ 5 degF bins (consistent with Bonneville data)
• Signature x histogram = daily RTU energy
• Normalized annualized RTU energy is annual
sum of daily RTU energy
RTU Savings Research Project
RTU Savings Research ProjectAnnual Savings Methodology
#1 Finding: With a few weeks pre- and
post-data on a regularly operating
building, an estimate of annual energy
use and therefore savings, can be
reliably made. Data needs to be studied
in detail to gain confidence in
interpreting the results.
RTU Savings Research Project
RTU Savings Research ProjectKeys To Annual Savings Methodology
• 4 diagnostic graphs are needed for a high
confidence energy savings estimate
– Mode by power map = accurate kW savings
– % outside air map
– Economizer temperature control map
– RTU energy performance map
RTU Savings Research Project
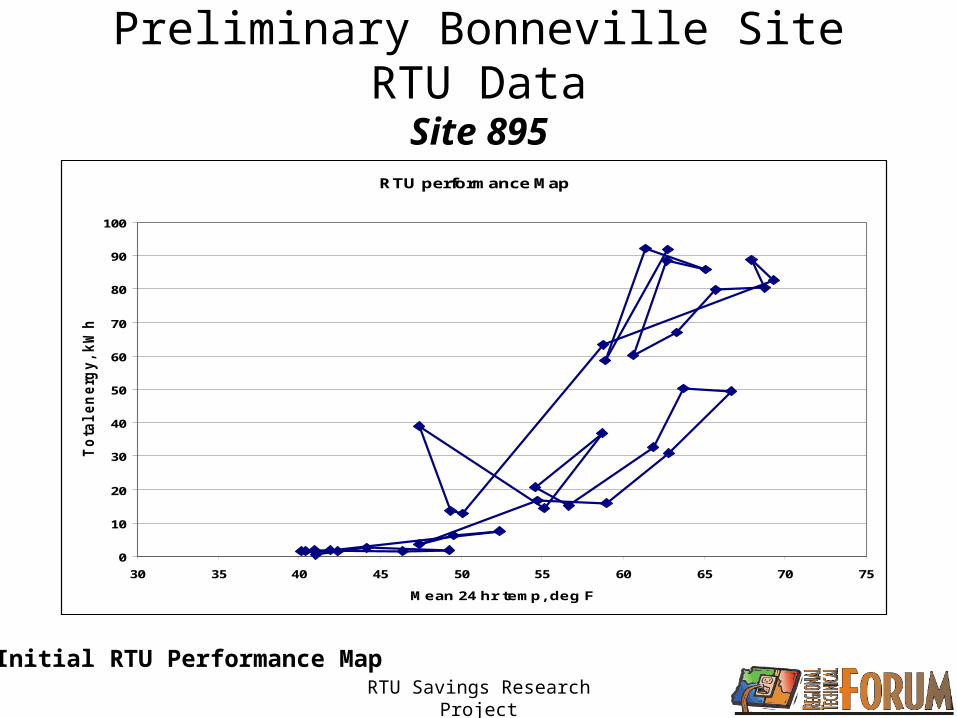
Preliminary Bonneville Site RTU DataSite 895
RTU performance Map
0
10
20
30
40
50
60
70
80
90
100
30 35 40 45 50 55 60 65 70 75
Mean 24 hr temp, deg F
To
tal
en
erg
y,
kW
h/d
ay
Initial RTU Performance Map
RTU Savings Research Project
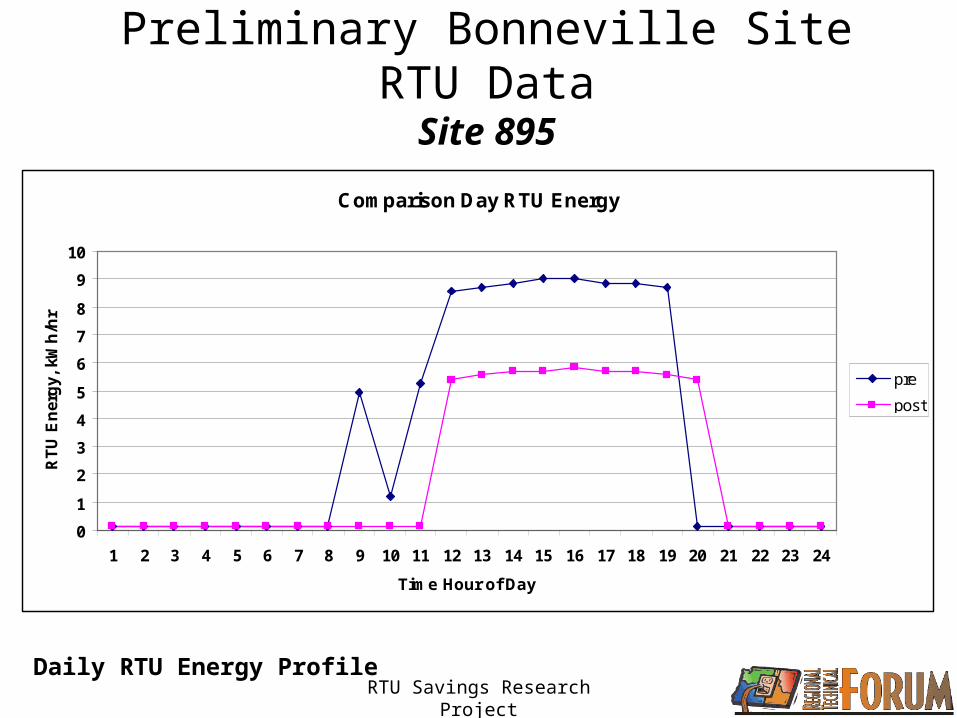
Preliminary Bonneville Site RTU DataSite 895
Comparison Day RTU Energy
0
1
2
3
4
5
6
7
8
9
10
1 2 3 4 5 6 7 8 9 10 11 12 13 14 15 16 17 18 19 20 21 22 23 24
Time Hour of Day
RT
U E
ner
gy,
kW
h/h
r
pre
post
Daily RTU Energy Profile
RTU Savings Research Project
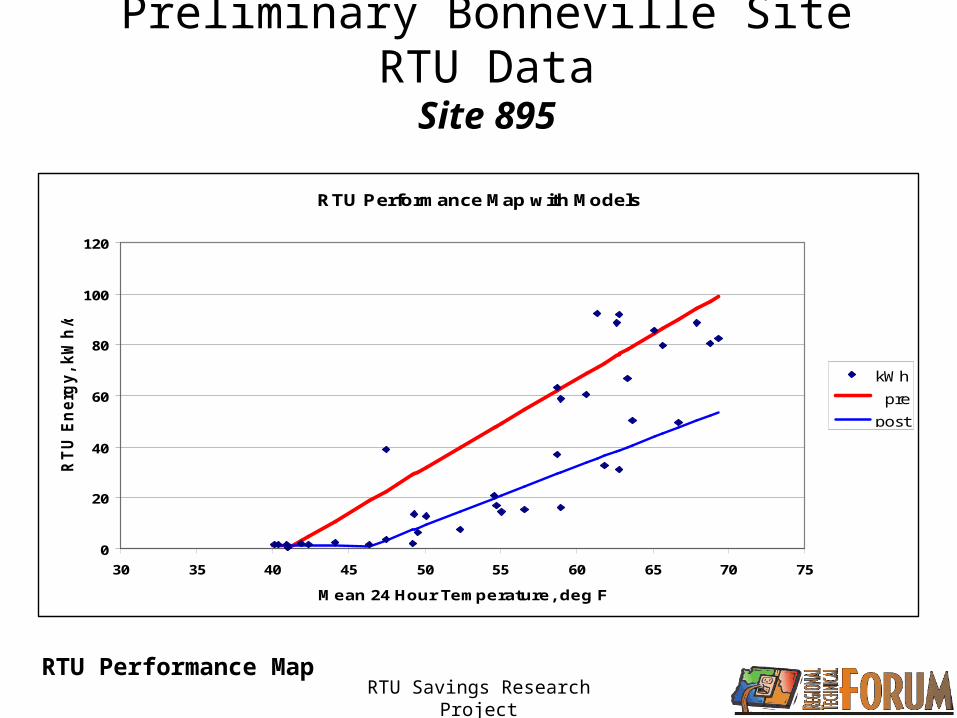
Preliminary Bonneville Site RTU DataSite 895
RTU Performance Map with Models
0
20
40
60
80
100
120
30 35 40 45 50 55 60 65 70 75
Mean 24 Hour Temperature, deg F
RT
U E
ne
rgy
, k
Wh
/da
y
kWh
pre
post
RTU Performance Map
RTU Savings Research Project
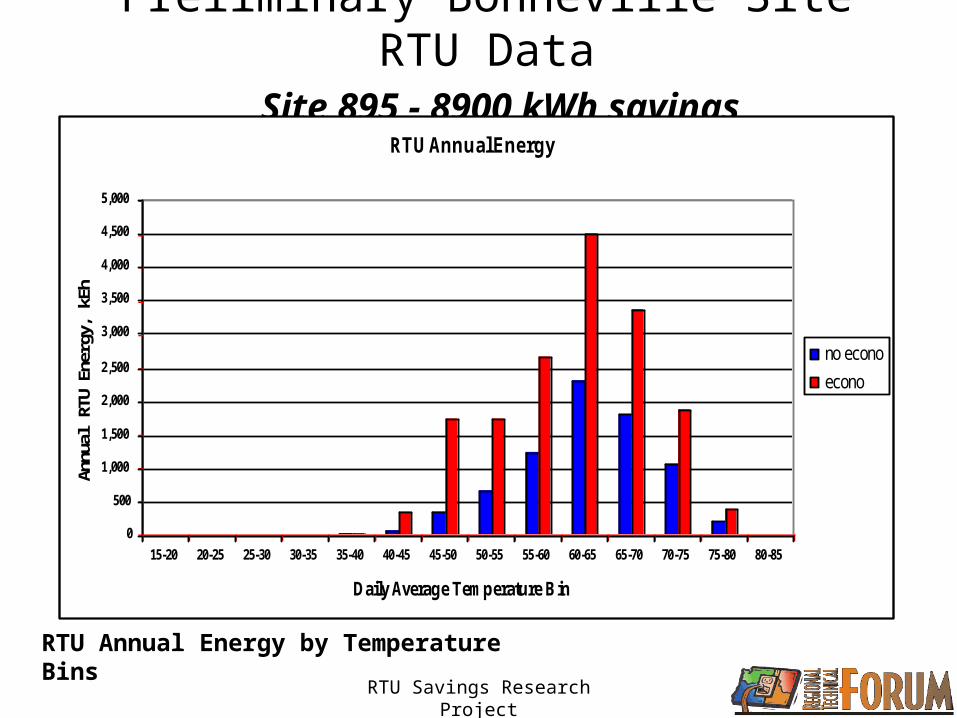
Preliminary Bonneville Site RTU Data Site 895 - 8900 kWh savings
RTU Annual Energy by Temperature Bins
RTU Annual Energy
0
500
1,000
1,500
2,000
2,500
3,000
3,500
4,000
4,500
5,000
15-20 20-25 25-30 30-35 35-40 40-45 45-50 50-55 55-60 60-65 65-70 70-75 75-80 80-85
Daily Average Temperature Bin
Ann
ual R
TU E
nerg
y, k
Eh
no econo
econo
RTU Savings Research Project
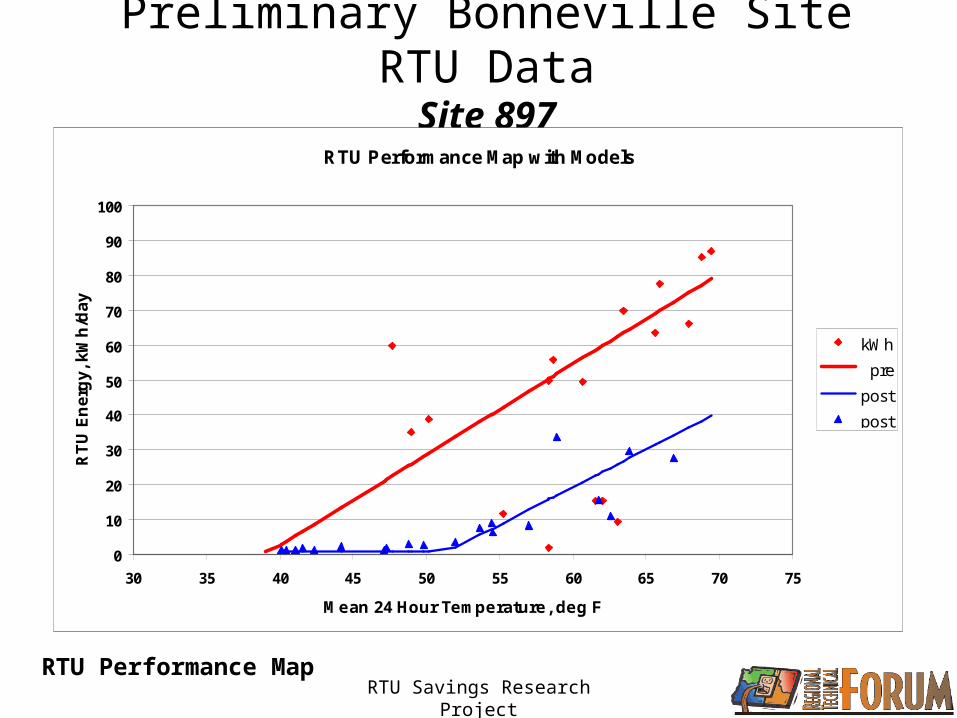
Preliminary Bonneville Site RTU DataSite 897
RTU Performance Map
RTU Performance Map with Models
0
10
20
30
40
50
60
70
80
90
100
30 35 40 45 50 55 60 65 70 75
Mean 24 Hour Temperature, deg F
RT
U E
ne
rgy
, k
Wh
/da
y
kWh
pre
post
post
RTU Savings Research Project
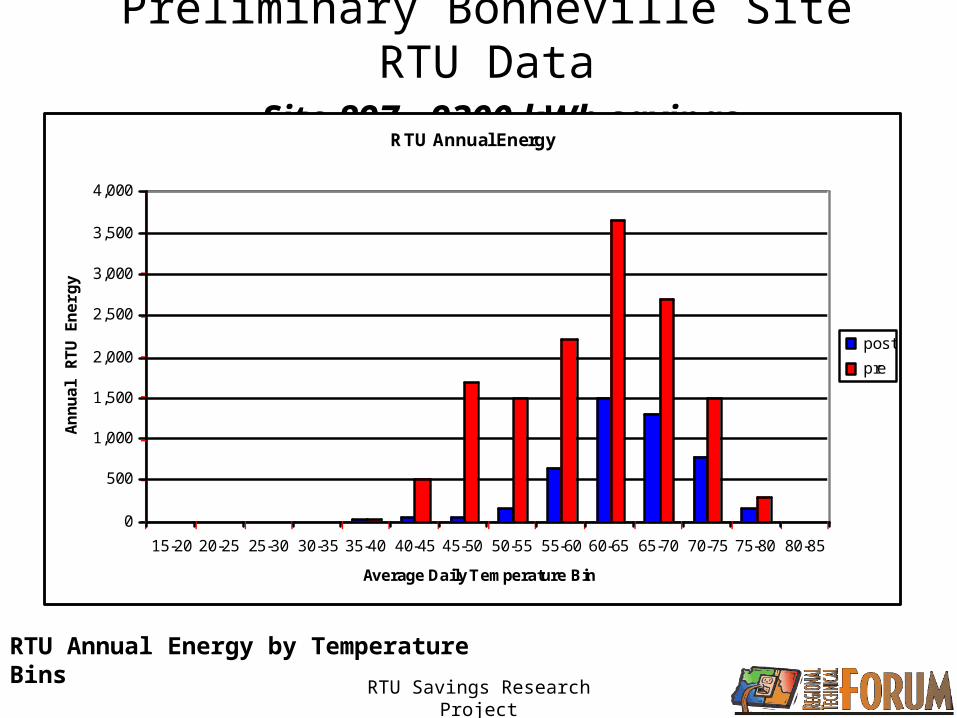
Preliminary Bonneville Site RTU Data Site 897 - 9300 kWh savings
RTU Annual Energy by Temperature Bins
RTU Annual Energy
0
500
1,000
1,500
2,000
2,500
3,000
3,500
4,000
15-20 20-25 25-30 30-35 35-40 40-45 45-50 50-55 55-60 60-65 65-70 70-75 75-80 80-85
Average Daily Temperature Bin
An
nu
al R
TU
En
erg
y
post
pre
RTU Savings Research Project
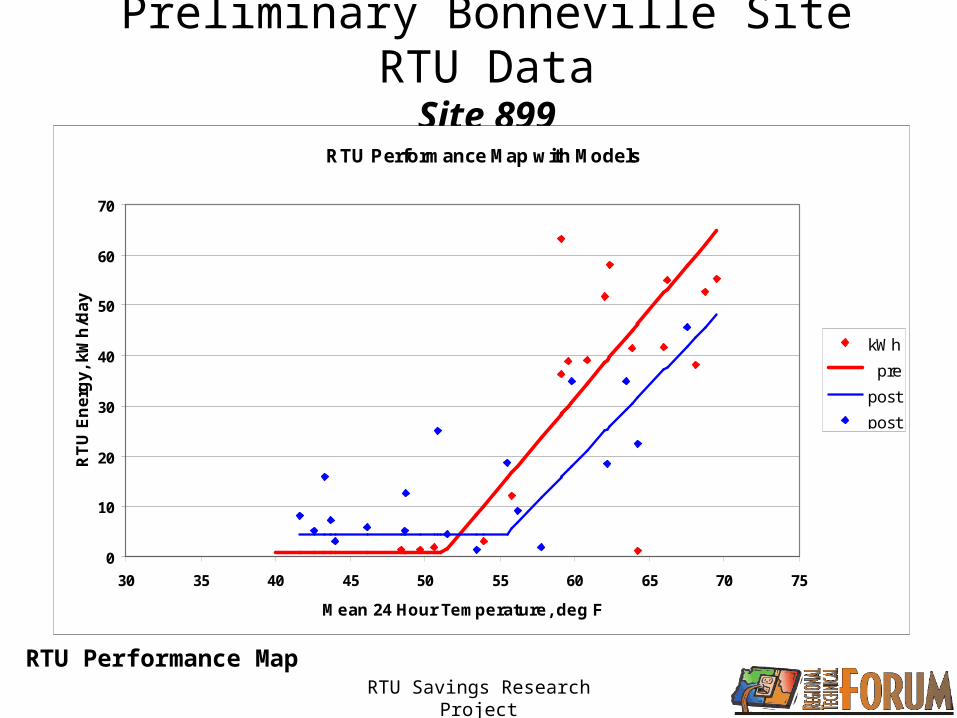
Preliminary Bonneville Site RTU DataSite 899
RTU Performance Map with Models
0
10
20
30
40
50
60
70
30 35 40 45 50 55 60 65 70 75
Mean 24 Hour Temperature, deg F
RT
U E
ne
rgy
, k
Wh
/da
y
kWh
pre
post
post
RTU Performance Map
RTU Savings Research Project
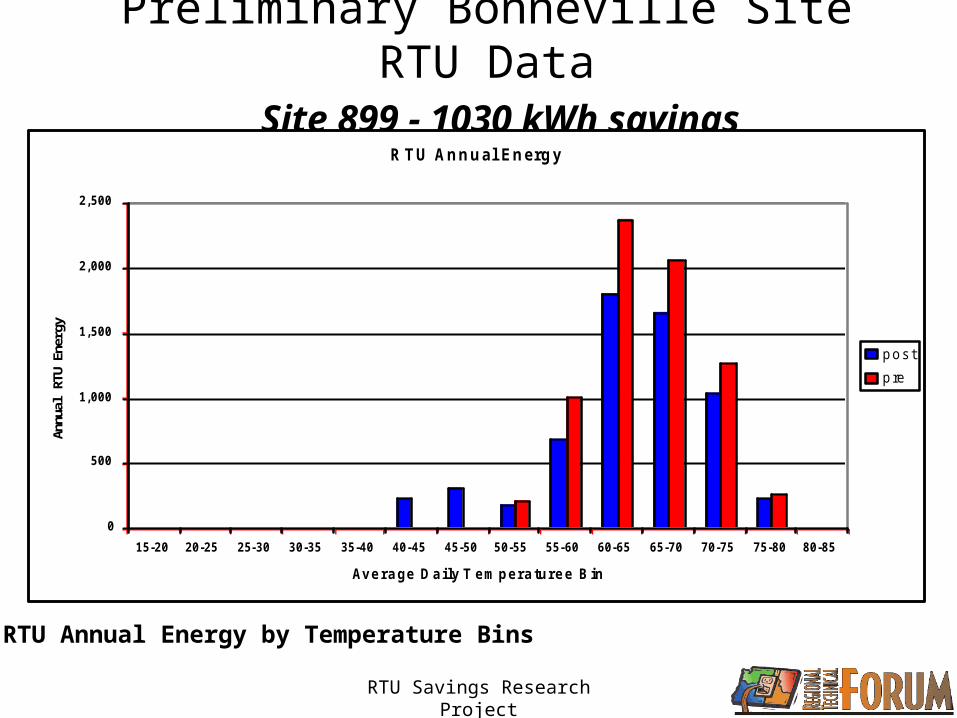
Preliminary Bonneville Site RTU Data Site 899 - 1030 kWh savings
RTU Annual Energy by Temperature Bins
R T U An n u al En erg y
0
500
1,000
1,500
2,000
2,500
15-20 20-25 25-30 30-35 35-40 40-45 45-50 50-55 55-60 60-65 65-70 70-75 75-80 80-85
Av e r a ge D a i ly T e m p e r a tu r e e B in
Ann
ual R
TU E
nerg
y
p o s t
p re
RTU Savings Research Project
RTU Savings Research Project Recommendations - Phase 3
• Apply measurement/monitoring protocol--
>> To all remaining Bonneville existing sites
>> In all new field monitoring projects including the Premium Ventilation Package and Bonneville’s upcoming field monitoring project [60+ sites?]
• Current models should be reconciled to existing/new unit level data
• Subset monitored annually at least 5 years
• Fan power savings are very important: 24-hr operation
• More aggressive economizer control: pre-cooling


