Market Insight Markets Analysis Covered: Ctrl + click to follow link Issue 002 | September 2009 Equities Malaysia | Singapore | Vietnam Thailand | US | Relative Performance Commodities Crude Oil | Gold | Crude Palm Oil Rubber Forex EUR/USD | GBP/USD | USD/JPY USD/CHF Articles Forex Analysis Astute Investors – everyone dreams of becoming one - Special: Forex analysis by market experts - Can the bulls continue to dominate the market? - Are commodity prices going to continue to hit the roof? - Astute investor – Are you dreaming of becoming one? All this in September’s Market insight!
Transcript
Market Insight
001: July 2009
Markets Analysis Covered: Ctrl + click to follow link
Issue 002 | September 2009
Equities Malaysia | Singapore | Vietnam Thailand | US | Relative Performance
Articles Forex Analysis Astute Investors – everyone dreams of becoming one
- Special: Forex analysis by market experts
- Can the bulls continue to dominate the market?
- Are commodity prices going to continue to hit the roof?
- Astute investor – Are you dreaming of becoming one?
All this in September’s Market insight!
Market Insight
2
Equities
Malaysia
Singapore
Thailand
Vietnam
US
Equity Markets Performance – 6 and 12 months
Commodities
Crude Oil
Gold
Crude Palm Oil
Rubber
Forex
Euro/USD
USD/JPY
GBP/USD
USD/CHF
Trading/Investment Idea/Article
Forex Analysis – from various market experts
Astute Investors – Everyone dreams of becoming one
For more recent articles, commentaries
and analysis, visit www.nextview.com
Main
Publishing and Editorial: NextVIEW Regular Contributors: Benny Lee Don Schellenberg Ameer Ali Mohamed Guest Contributors: Dar Wong Brent Penfold Rights and Permission: Materials in this publication may not be reproduced in any form without written permission from the publisher. Contact information For Advertising and other enquiries please email to [email protected] Although every reasonable care has been taken to ensure the accuracy and objectivity of the information contained in this publication, neither the publishers, authors and their employees and agents can be held liable for any errors, inaccuracies and/or omissions, howsoever caused. We shall not be liable for actions taken based on the views expressed, or information provided within this publication. Should you seek professional advice, please consult a licensed professional financial advisor or institution.
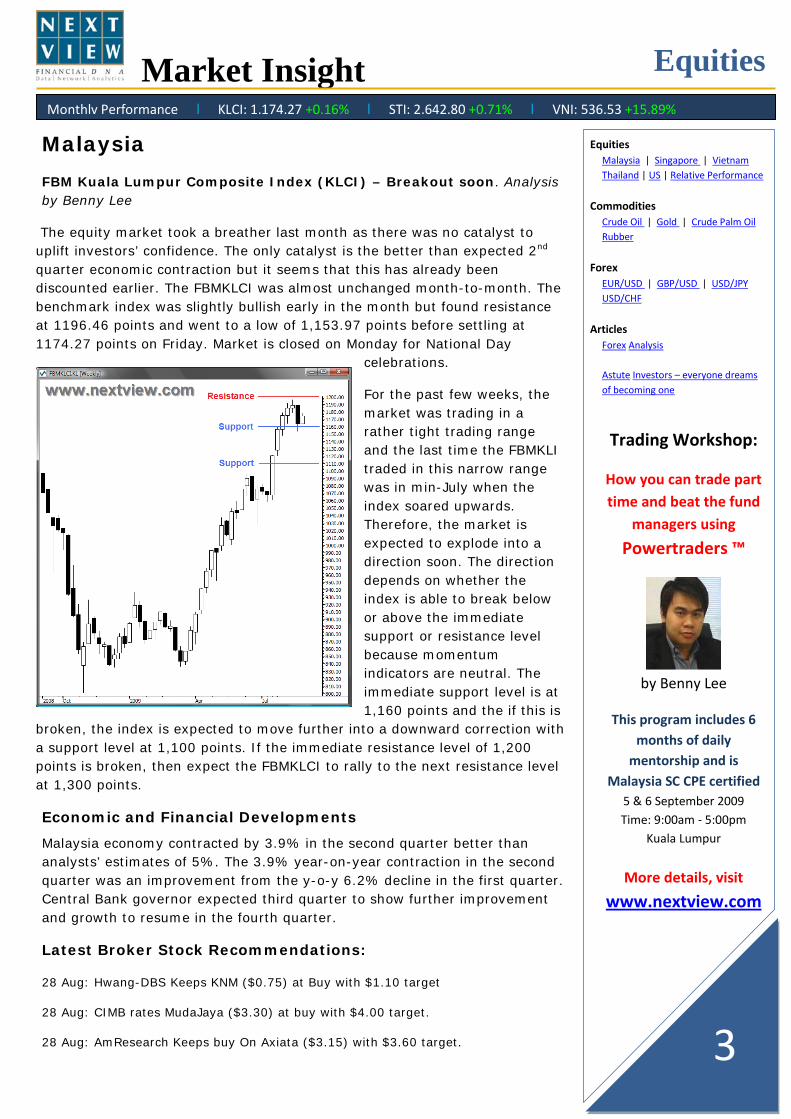
FBM Kuala Lumpur Composite Index (KLCI) – Breakout soon. Analysis by Benny Lee
The equity market took a breather last month as there was no catalyst to uplift investors’ confidence. The only catalyst is the better than expected 2nd quarter economic contraction but it seems that this has already been discounted earlier. The FBMKLCI was almost unchanged month-to-month. The benchmark index was slightly bullish early in the month but found resistance at 1196.46 points and went to a low of 1,153.97 points before settling at 1174.27 points on Friday. Market is closed on Monday for National Day
celebrations.
For the past few weeks, the market was trading in a rather tight trading range and the last time the FBMKLI traded in this narrow range was in min-July when the index soared upwards. Therefore, the market is expected to explode into a direction soon. The direction depends on whether the index is able to break below or above the immediate support or resistance level because momentum indicators are neutral. The immediate support level is at 1,160 points and the if this is
broken, the index is expected to move further into a downward correction with a support level at 1,100 points. If the immediate resistance level of 1,200 points is broken, then expect the FBMKLCI to rally to the next resistance level at 1,300 points.
Economic and Financial Developments
Malaysia economy contracted by 3.9% in the second quarter better than analysts’ estimates of 5%. The 3.9% year-on-year contraction in the second quarter was an improvement from the y-o-y 6.2% decline in the first quarter. Central Bank governor expected third quarter to show further improvement and growth to resume in the fourth quarter.
Latest Broker Stock Recommendations:
28 Aug: Hwang-DBS Keeps KNM ($0.75) at Buy with $1.10 target
28 Aug: CIMB rates MudaJaya ($3.30) at buy with $4.00 target.
28 Aug: AmResearch Keeps buy On Axiata ($3.15) with $3.60 target.
Articles Forex Analysis Astute Investors – everyone dreams of becoming one
Trading Workshop:
How you can trade part time and beat the fund
managers using
Powertraders ™
by Benny Lee
This program includes 6 months of daily
mentorship and is Malaysia SC CPE certified
5 & 6 September 2009 Time: 9:00am - 5:00pm
Kuala Lumpur
More details, visit
www.nextview.com
Market Insight
4
Singapore
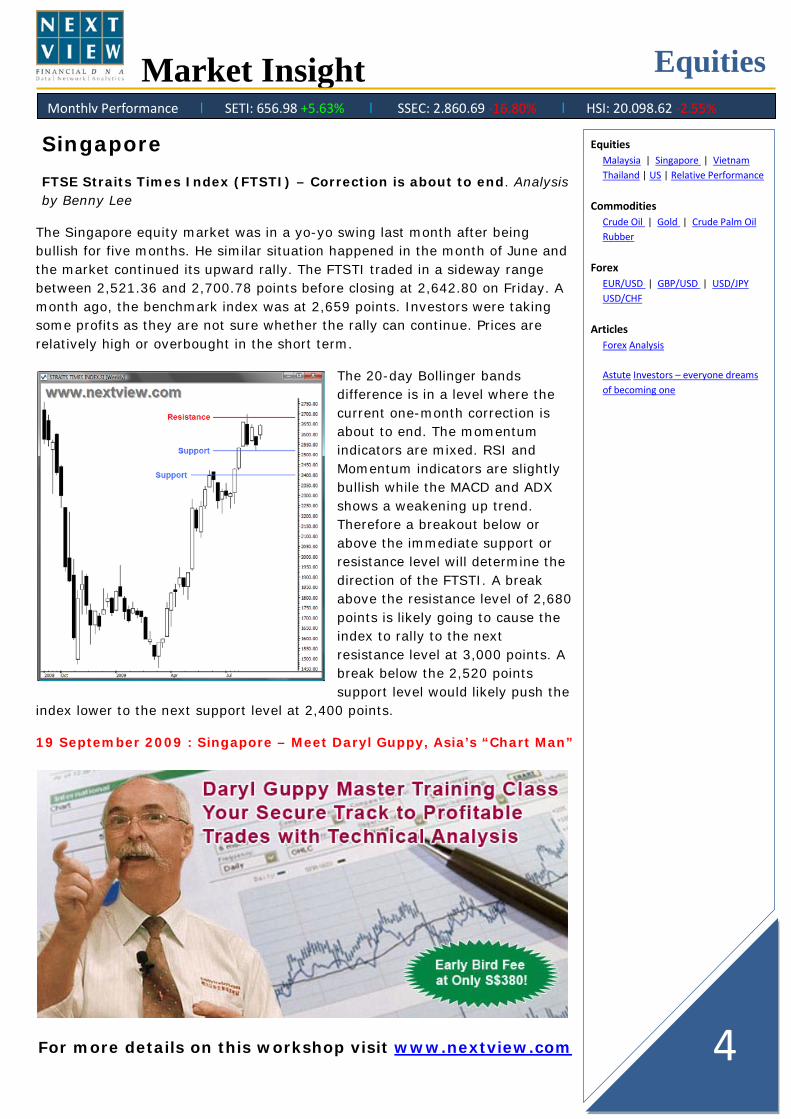
FTSE Straits Times Index (FTSTI) – Correction is about to end. Analysis by Benny Lee
The Singapore equity market was in a yo-yo swing last month after being bullish for five months. He similar situation happened in the month of June and the market continued its upward rally. The FTSTI traded in a sideway range between 2,521.36 and 2,700.78 points before closing at 2,642.80 on Friday. A month ago, the benchmark index was at 2,659 points. Investors were taking some profits as they are not sure whether the rally can continue. Prices are relatively high or overbought in the short term.
The 20-day Bollinger bands difference is in a level where the current one-month correction is about to end. The momentum indicators are mixed. RSI and Momentum indicators are slightly bullish while the MACD and ADX shows a weakening up trend. Therefore a breakout below or above the immediate support or resistance level will determine the direction of the FTSTI. A break above the resistance level of 2,680 points is likely going to cause the index to rally to the next resistance level at 3,000 points. A break below the 2,520 points support level would likely push the
index lower to the next support level at 2,400 points.
Singapore manufacturing output in July 2009 rose by 23.0% seasonally adjusted month-on-month basis 12.4% year-on-year, thanks to the biomedical manufacturing cluster. Singapore economy rebounded in the second quarter with a 20.4% jump from the first quarter. The government revised its forecast to 4% to 6% this year from the previous 6% to 9%. Visitor arrivals to Singapore in July 2009 declined 4.5% year-on-year, the smallest decline this year.
Latest Broker Stock Recommendations:
28 Aug: OCBC upgrades Olam ($2.52) to buy, increasing target to $3.08
28 Aug: UOBKH upgrades Raffles MG ($1.29) to buy with a $1.76 target.
27 Aug: DMG upgrades TiongWoon ($0.725) to buy, raising target to $0.95.
27 Aug: Citi and UBS raised Allgreen Properties ($1.21) to buy
Equities
Equities Malaysia | Singapore | Vietnam Thailand | US | Relative Performance
Articles Forex Analysis Astute Investors – everyone dreams of becoming one
Market Insight
7
Vietnam
HOSE Vietnam Stock Index(VNI) – Up trend likely to continue Analysis by Benny Lee
The Vietnam market is clearly dominated by the bulls last month. The VNI surged almost 16% in one month to close at 536.53 points. The level is currently the highest in nearly a year. It easily broke the 520 points resistance level and is probably eyeing the 575 points resistance level, which is the highest since mid of March 2008 and the 38.2% Fibonacci retracement level. The market performed better than the rest of the others because it the market value shrank nearly three quarter.
The market is back in the uptrend and if it is able to stay above the resistance level it just penetrated, the trend is likely going to continue to test the next resistance level at 575 points. There is a high chance that the market is going to climb higher because of strong bullish strength, based on momentum indicators like RSI and ADX. On a longer term view, a head and shoulder pattern can be indentified on the weekly chart and it has a price objective of 800 points. I would not want to look that far at this point of time.
Economic and Financial Developments
Over the past eight months, Vietnam has attracted more than 500 foreign direct investment projects with a combined registered capital of over US$5.6 billion. Vietnam’s five-year bonds fell on
speculation of a pickup in inflation will prompt the central bank to start raising interest rates, but this did not damper the equity market which continues to make new highs.
Latest Broker Stock Recommendations:
28 Aug: FPTS restart VCG at Buy, 32,000VND target
28 Aug: FPTS restart SRB at Sell, 9,900VND target.
Stock Exchange of Thailand Index (SETI) – Bulls taking charge again. Analysis by Benny Lee
The SETI broke the 640 points resistance levels as the bulls are controlling the market. It is one of the best performing markets in the Asian region despite government protestors planning to stage massive protests in the last weekend of August. At 656.98 points, the benchmark index is almost at a year’s high. The SETI is still hovering above the 50% Fibonacci retracement level from the bear trend in early 2008.
The trend continues to increase but with a weaker strength. Momentum indicators like the RSI and Momentum are showing short term bearish divergence. If the index is able to maintain above 640 points, it is likely going to test the next resistance level at 700 points. However, if the index falls below the 640 points support level, expect the market to correct further.
Economic and Financial Developments
Manufacturing production shrank 7.3% year-on-year in July, compared with an 8.3% decline in June. Private consumption grew 3.4% from June but shrank from the same period last year. Fitch Ratings said that political stability has become a major structural factor in determining Thailand's ability to recover from economic recession. Kasikornbank Asset, has a positive outlook on the country’s economy and expects economic growth of 3% in 2010 compared with a contraction of 3.5% this year. Inflation meanwhile is expected to rise 3-4% in 2010 compared with a contraction of 0.5-1% this year. They also agreed that the biggest concern was the political stability of the country.
Articles Forex Analysis Astute Investors – everyone dreams of becoming one
Market Insight
9
United States of America
US Dow Jones Industrial Average (DJI) – Healthy trend but weaker momentum. Analysis by Benny Lee
The US equity market continues its bullish trend with a marginal increase. The DJI closed 4% higher month-to-month at 9,544.20 on Friday. Increase in housing sales, better than expected corporate earnings and positive statements from the central bank boost investors’ confidence. Investors were trading cautiously as the job market has not been improving much. The market has been supported well. For many days, the market started with a bearish note but turned bullish in the later session.
Momentum indicators have been in convergence with the current upward rally. RSI and Momentum indicators are able to stay above its middle level and the
ADX indicator started to rise again. This means that the uptrend is still strong and there is a high chance that the trend may continue to go higher. The inverted heard and shoulder chart pattern was confirmed when the DJI broke above 9,400 points and this pattern has a price target at 11,600 points. However, there is also a technical resistance at 10,330 points. However, if the benchmark index fails to stay above the immediate support level at 9,100 points, then we may see further correction
downwards.
Economic and Financial Developments
Total loans held by 15 large U. S. banks shrank by 2.8% in the second quarter. More than 50% of total loan volume came from refinancing mortgages and renewing credit to existing businesses. Unemployment is still high at 9.4%. The recent University of Michigan Consumer Sentiment Survey showed a slip in consumer confidence.
Articles Forex Analysis Astute Investors – everyone dreams of becoming one
Market Insight
11
Crude Oil (based on Light Crude futures in NYMEX)
Analysis by Benny Lee
Bulls facing strong resistance. Crude oil price seems to be struggling to stay strong above US$70 a barrel. Every time it goes above US$70, it will start to move into a sideway trading range and fall below US$70. Price of crude oil is still above US$70 currently on NYMEX. However, the price fell US$3.00 to US$71 in the past few days. The highest was US$75 on 25 August. However, the price is still in an up trend, defined by the increasing moving averages and intermediate up trend line (See S1 on the chart below). In the short term, momentum indicators are suggesting a weak up trend. The RSI has been stagnant while price is rising in the past few weeks. The MACD indicator is crossing below its trigger line the second time in one month. This weak up trend momentum shows strong resistance. The technical resistance level is at US$77, based on a 38.2 Fibonacci retracement level from the long term bear trend. Price of oil is probably going to test US$77 but not so soon because of the strong resistance. Support level is at US$66 and the up trend shall continue as long as the price stays above this level.
News and Developments
U.S. crude inventories rose slightly when analysts expected it to decline, according to data released Wednesday by the U.S. Department of Energy. Sinopec expects second half crude oil prices to be at US$65-US$75 per barrel. Vietnam expects August crude oil exports to decline 43% on-year. China's crude oil imports in the first seven months increased 5.8% on-year.
Commodities
Real-time information on
various commodity markets in the world.
visit www.nextview.com
Equities Malaysia | Singapore | Vietnam Thailand | US | Relative Performance
Do you wish you could anticipate the direction of commodity prices? Do you want to be able to offset the risk of any adverse price movements? Do you want to make better price response decisions and recommendations?
What will you gain from this intensive workshop: • An overview on short/medium term price projections of the agricultural markets • Gain a firm understanding of basic technical analysis • Understand price actions/market psychology with confidence • Learn to forecast future price levels using one of the most advanced charting tools –
Fibonacci Studies • Get practical and in-depth understanding of price movements • Gain expert knowledge from a successful market analyst
Who Should Attend: Planters & Processors, Agricultural Based Commodities Products' Manufacturers, Traders, Importers & Exporters, Commodities Analysts & Advisors, Fund Managers & Futures Traders, Agriculture Ministries, Associations and Agencies Program Schedule
Workshop :
1 October 2009 (2.00pm – 6.00pm)
2 October 2009 (9.00am – 6.00pm)
City Tour:
3 October 2009 ( 9.00am – 4.00pm)
Call 03-27709388 or visit www.nextview.com for details and registration
Commodities
Equities Malaysia | Singapore | Vietnam Thailand | US | Relative Performance
Price action on the Gold chart has been creating a very clear triangle, which has developed over the past six months. A test of the July low, around $900 per ounce cannot be ruled out. That in itself would not prevent price from subsequently rising dramatically to the upside.
If price closes below $900, further downside movement could be expected. However, the main anticipated direction for price at this time is up. A close above the upper trend line will confirm this. The level of $1,000 will then be the first upside target, followed by $1060 - 1100. TECHNICALS MACD – flat Stochastic – this short term momentum indicator is rising. R1 – nearby resistance is at 972. R2 – 1007. R3 – 1060-1100. (not shown on chart) S1 – 930. S2 – 905. News and Developments
New drilling indicates more than 20% increase to strike length of Rubicon's F2 Gold system. High grade gold mineralization identified on surface on the Alexandria block, east of the Joanna gold project. Great Basin Gold Ltd has obtained Credit approval thereby securing the finance facility for its Burnstone Project in South Africa.
Commodities
Equities Malaysia | Singapore | Vietnam Thailand | US | Relative Performance
Crude Palm Oil (Based on Bursa Malaysia Crude Palm Oil Futures) Analysis by Benny Lee
The price of FCPO went into a bullish rally for one month in the mid-July to mid-August. The price climbed RM525 per metric ton or 26% from a low of RM1,990 to a high of RM2,515. The price then went into a correction, goes to a low of RM2,234 before settling at RM2,366 at the end of the month. The RM2,234 low was a 50% retracement from the one month bullish rally and the 30-day moving average line.
Technically, the price is still in a long term up trend but in a correction. The 90-day moving average is still increasing but the shorter averages are mixed. In the last one week of the month, market was uncertain as it traded in a tight trading range. The price of FCPO is currently slightly above the long term 15- and 30- week moving averages. A new up trend line is developed and is currently at RM2,300 and increasing.
Momentum indicators are mixed. The RSI indicator is indicating a slight bullish momentum in the short term and the bulls are still in control because the RSI is above the mid-level. However, the Momentum and MACD indicators are showing signs of bearishness. The Momentum indicator is below its equilibrium level while the MACD is below its 9-day average. Therefore it is difficult to determine whether the uptrend is weak or strong at the momentum but the
fact that the trend is still up, the bulls are still in control in the long term. Expect the price to test RM2,500 again if it stays above RM2,300.
News and Developments
Cargo surveyor SGS Services estimates August 1-20 Palm Oil exports fell 7% On Month while Intertek estimates export to fall 11% on-month. Exports to China and India have eased as both countries have purchased quite a fair bit, so a temporary slowdown is expected.
Commodities
Equities Malaysia | Singapore | Vietnam Thailand | US | Relative Performance
Articles Forex Analysis Astute Investors – everyone dreams of becoming one
Trading Workshop:
How you can trade part time and beat the fund
managers using
Powertraders ™
by Benny Lee
This program includes 6 months of daily
mentorship and is Malaysia SC CPE certified
5 & 6 September 2009 Time: 9:00am - 5:00pm
Kuala Lumpur
More details, visit
www.nextview.com
Market Insight
15
Rubber (based on TOCOM RSS3 futures)
Analysis by Benny Lee
After breaking above the resistance level of $180 last month, the price of rubber futures (RSS3) in TOCOMs surged 19% to a high of $214 before taking a breather and move into a trading range between $191 and $214. The price target of $210 from the triangle breakout last month has been achieved. Currently the price seems like going to test $214 again after rebounding at $191. The price is currently near the resistance level of the trading range at $207.90.
The short to long term 30- to 60-day moving averages continues to rise indicating a good up trend. However, the momentum indicators are showing bearish divergences and this basically means that the uptrend is weak in the short term. RSI and Momentum indicators are declining but above the mid-level. MACD has been in a bearish mode since the middle of August.
The weakening momentum means that the market may move deeper into a sideway correction. Rubber prices tend to correct for a long period before moving to the next level. Therefore, expect the price of rubber to trade sideways between $191 and $214 in the near term. If the resistance level
is broken, then the next target for the price of rubber would be $230. If it breaks below $191, the trend up trend is expected to reverse and the next support level is at $180.
News and Developments
Demand for replacement tires in Europe is improving as distributors need to replenish stocks. Tire consumption is an important factor in determining demand for rubber. Globally, around 70% of the natural rubber and 48% of synthetic rubber produced is used to make tires, with close to 70% of demand for tires in the replacement sector. Japanese and South Korean auto makers have benefited from the "cash for clunkers" program in the U.S., and are now expected to ramp up production, for which they will need new tires.
Commodities
Equities Malaysia | Singapore | Vietnam Thailand | US | Relative Performance
The sideways correction with a slight upward slope, continues. Previous lows were not exceeded when the market printed a short term low at 1.4044 on August 17th. The market is in a relatively weak uptrend.
At this moment EURUSD is range bound between the August 17th low and the August 15th high of 1.4446. That high, marked R1 on the chart, is being tested right now.
Recent price action implies that resistance at R1 may be penetrated soon, but because resistance is strong, that cannot be predicted with absolute certainty.
What is expected, is that the market will eventually reach higher objectives as mentioned in last month’s commentary. Near term objectives are between 1.4490 – 1.4690.
Failure to exceed 1.4446 in the near future could send this currency pair down towards support around 1.4044.
TECHNICALS
SMA200 – virtually flat below current values, at 1.3543.
SMA20 – flat – immediately below current price action.
Li’s Sandwich – Although this indicator looks similar to
Bollinger Bands, it is quite different. On this chart it does a good job of defining levels of resistance and support that, for the most part, agree with advanced Fibonacci Analysis.
MACD – rising, in positive territory.
Stochastic – rising into Overbought level.
R1 – nearby resistance at 1.4405 R2 – 1.4490-1.4690.
S1 – 1.4218 S2 – 1.4044
Forex
Equities Malaysia | Singapore | Vietnam Thailand | US | Relative Performance
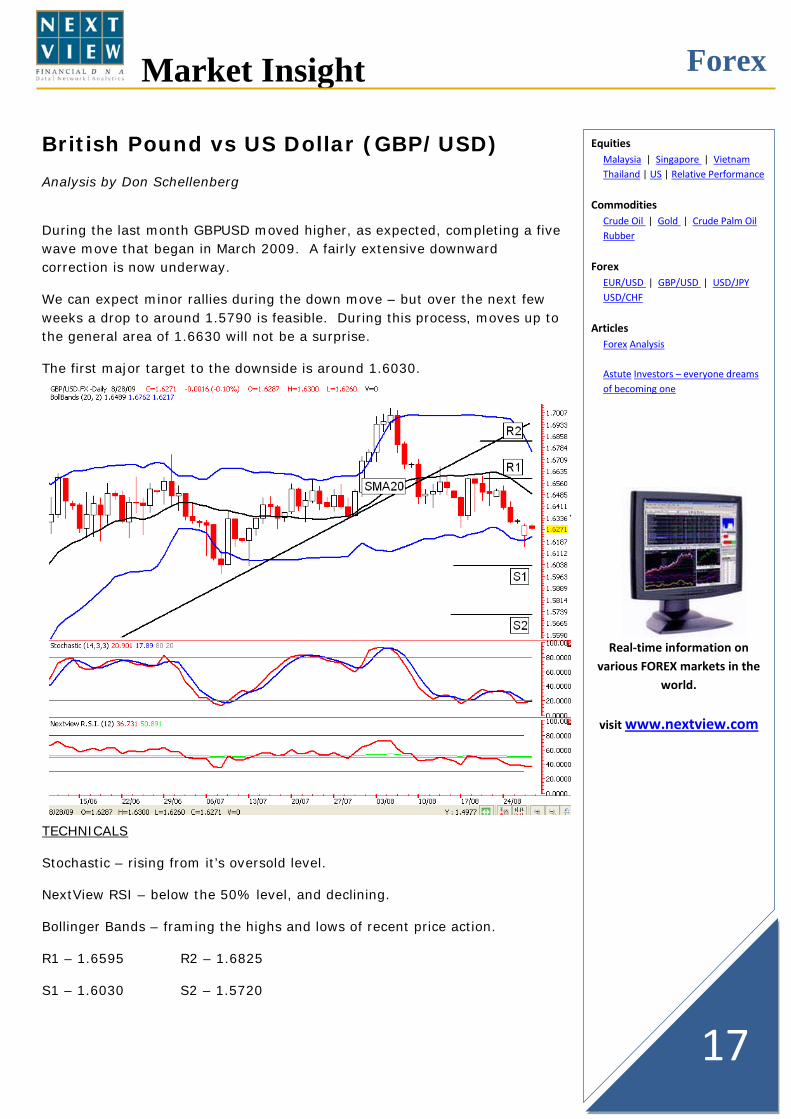
During the last month GBPUSD moved higher, as expected, completing a five wave move that began in March 2009. A fairly extensive downward correction is now underway.
We can expect minor rallies during the down move – but over the next few weeks a drop to around 1.5790 is feasible. During this process, moves up to the general area of 1.6630 will not be a surprise.
The first major target to the downside is around 1.6030.
TECHNICALS
Stochastic – rising from it’s oversold level.
NextView RSI – below the 50% level, and declining.
Bollinger Bands – framing the highs and lows of recent price action.
R1 – 1.6595 R2 – 1.6825
S1 – 1.6030 S2 – 1.5720
Real-time information on
various FOREX markets in the world.
visit www.nextview.com
Forex
Equities Malaysia | Singapore | Vietnam Thailand | US | Relative Performance
The trend is down. Small upward reactions should not be significant (assuming there is no major intervention), at least until support is reached, between 92.60 – 91.75.
An upward bounce will likely occur at support, marked S2 on the chart. This reactive bounce should create a continuation pattern, after which this market has a good chance of dropping to around 90. or even lower.
TECHNICALS
NextView RSI – declining – below it’s 50% level.
IchimokuKinkoHyo – the vertical lines on the chart are the ‘cloud’. When the cloud is above the price, as it is now, it indicates the level of resistance in the market.
R1 – resistance around 95.50
S1 – support at 93.60
S2 – zone of support between 92.50 – 91.75
Forex
Equities Malaysia | Singapore | Vietnam Thailand | US | Relative Performance
Articles Forex Analysis Astute Investors – everyone dreams of becoming one
Market Insight
19
US Dollar vs Swiss Franc (USD/CHF)
Analysis by Don Schellenberg
The June 24th high of 1.1021 has capped all price action since that date. The market is currently testing an important level of support around 1.0556. This level has been tested several times and is likely to be exceeded to the downside. A logical next target is between 1.0370 – 1.0200.
TECHNICALS
MACD – declining, in negative territory.
Stochastic – weak, around the 20 level.
SMA 200 – flat at 1.1160.
R1 – resistance at 1.1020
S1 – 1.0650
S2 – 1.0367
S3 – 1.0020
Forex
Equities Malaysia | Singapore | Vietnam Thailand | US | Relative Performance
Articles Forex Analysis Astute Investors – everyone dreams of becoming one
Market Insight
20
FOREX Analysis – by Market Experts
The US Dollar has always been the currency to benchmark against when it comes to determining the value of currencies as US being the world’s biggest economy. The recent improvements in the US economy, especially housing sales have raised investors’ confidence. Despite market experts saying that the economic recovery still has a long way to go, the equity market continues to make new highs. The benchmark index for the US market, the Dow Jones Industrial Average (DJI) is currently at a 9-month high. The DJI has so far climbed 64% from the low in March this year. Market around the globe has also rallied strongly. However, the US Dollar has weakened amid the US equity market rally. Is the US Dollar going to weaken further, or will it turn around if the US economy continues to improve? Let’s hear it from the experts on the US dollar against the three major currencies - Euro Dollar, British Pound and Japanese Yen. Euro Dollar There was a sharp rally in December last year when the EUR/USD surged from 1.26 to 1.44 in less than a month. The Euro Dollar against the US Dollar (EUR/USD) is currently 1.43, up 13.5% from the level in March. The highest level for almost a year is at 1.44 and was tested early this month. Market experts are generally bullish on the Euro Dollar. According to market expert Mr. Dar Wong (Dar), there is a high chance of this level being broken if it is supported well above 1.4000 in September, based on his proprietary PowerWave Trading ™ concept. Another market expert Mr. Don Schellenberg (Don) expects this resistance level to be broken soon with near term objectives between 1.4490 – 1.4690. He added however that if the currency pair fails to exceed 1.4446 in the near future, it may correct downwards towards the support level around 1.4044.
Dar added that by using his PowerWave concept, their first wave target price (WTP) would be around 1.4750. If the pair crosses above 1.5000 after a quick consolidation, the next WTP is unbelievably at around the region of 1.5500. Licensed futures trader Brent Penfold (Brent) remains bullish on the Euro and bearish on the USD if the pair maintains above 1.4088 Dar advises traders to be in the long mode. He said that EUR/USD has been gradually scaling up for past 6 months while waiting for a final explosive shoot-up. He added that as the cycle-pattern is going to complete in another 4-6 weeks, we will try every means to pick long positions from the target bottom around the region of 1.4100. However, he cautioned traders to abandon all long views if the market breaks below 1.4000!
Equities Malaysia | Singapore | Vietnam Thailand | US | Relative Performance
Articles Forex Analysis Astute Investors – everyone dreams of becoming one
Articles
Market Insight
21
Weekly EURO/USD chart since 2007 British Pound Like the Euro Dollar, the British Pound has also been bullish against the US Dollar. The British Pound against the US Dollar (GBP/USD) is currently 1.63, 18% higher than the level in March. Early August it went as high as 1.70, a 10-month high. This GBP was expected to strengthen further when the GBP/USD broke above the two months correction with trading range between 1.60 and 1.66. The currency pair is currently back at this range. The recent rally of GBP/USD was jeopardized by the weak U.K. economic data and failure in bond-purchase program by the central bank to increase its funds injection, Dar said. He expects the bullish trend to resume in the near future if the market stays within the consolidation levels between 1.6000 and 1.7000. Is the trend going to continue to be in a correction or move into a direction? Brent is bearish on the GBP and bullish on the USD until the currency pair can move above 1.6439. Don expects minor rallies in this current short term downward move and said that over the next few weeks a drop to around 1.5790 is feasible. He added that during this process, moves up to the general area of 1.6630 will not be a surprise. Dar looks at the fundamentals of this currency pair. He said that the direction of this pair depends on the recovery rate of U.K. economy as well as the further policy adopted by the central bank. Although moving in either directions is possible, EUR/USD may play a part in pulling it up if euro-assets rally in September. In his forecast, Dar said that if the market breaks below 1.6000, we are looking at the next bottom target at 1.5200 regions. Violating the topside resistance 1.7000 will stimulate another surge to complete the wave projection around the region of 1.7700. As for trading this GBP/USD currency pair, Dar advises new traders to stay out of GBP/USD as the swings are wild and unpredictable. Entering from the
Articles
Equities Malaysia | Singapore | Vietnam Thailand | US | Relative Performance
Articles Forex Analysis Astute Investors – everyone dreams of becoming one
Market Insight
22
extreme levels of support and resistance will be safer but a lot of patience needs to be practiced.
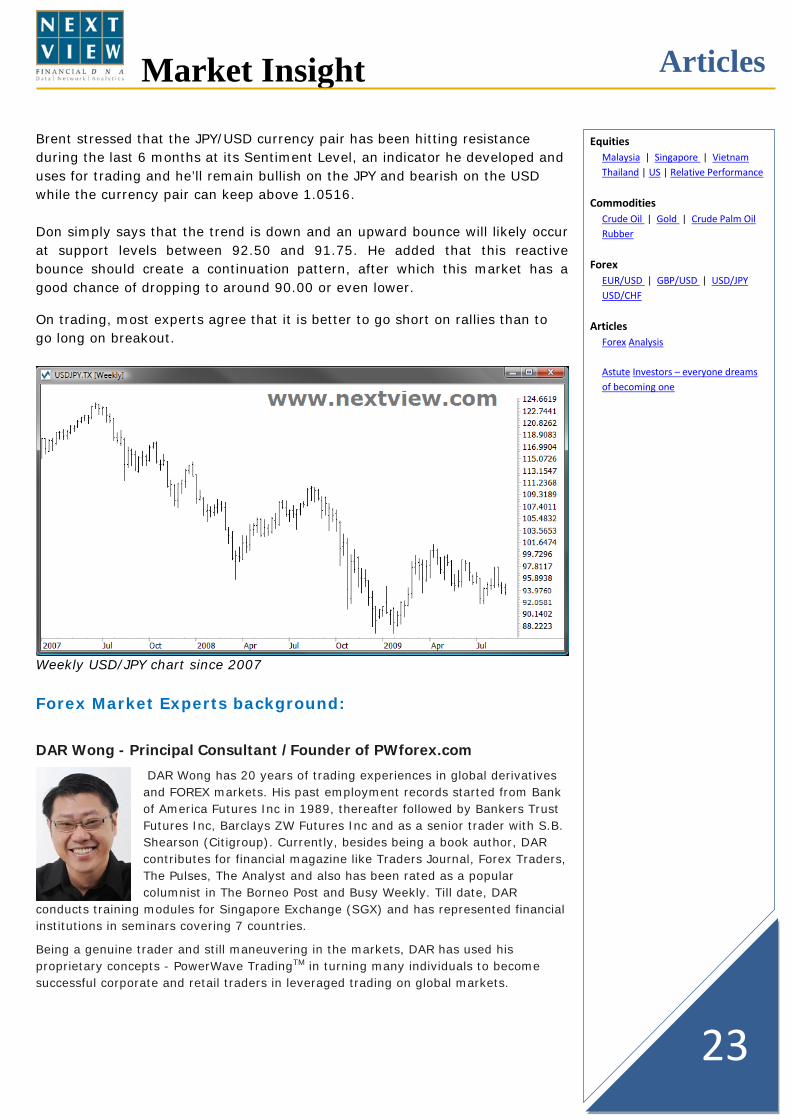
Weekly GBP/USD chart since 2007 Japanese Yen Currencies pairs (one currency against another) can be viewed both sides. The Euro Dollar for example can be viewed as Euro Dollar against the US Dollar (EUR/USD) or US Dollar against the Euro Dollar (US/EUR) and the former is the most commonly used pair for the Euro Dollar, and the same goes to the British Pound. The Japanese Yen is normally viewed using the USD/JPY pair or the US Dollar against the JPY. Although the Japanese Yen is strengthening against the US Dollar, the trend pattern is different from the trend pattern in the Euro Dollar and British Pound. The trend is clearly defined in the trend channel. The USD/JPY is currently at 94.0, 6.3% lower than the high in April this year. Is the US dollar going to continue to be weak against the Yen after declining sharply since early August or a rebound is expected soon? Most experts think that the Yen is likely going to continue to strengthen against the US dollar. Dar mentioned that the fact of dollar weakening is a reflection of burgeoning budget deficit and impact of recession. Putting back the dollar in the limelight takes time for long-road recovery and provided no other major currencies surpass the U.S. economy. Definitely, the U.S. dollar will poise but gradually losing its favor among the investors over years. He added that USD/JPY is in a big down trend correction. Dar is bearish on the US Dollar against the Yen. He said that emerging above 100.00 level by the end of this year seems to be very remote while the room of sliding remains at large. “Our proprietary method of technical study shows a high probability of making a triple bottom at 88.00 region, which is the 14-year low before the year-end” he confidently said.
Articles
Equities Malaysia | Singapore | Vietnam Thailand | US | Relative Performance
Articles Forex Analysis Astute Investors – everyone dreams of becoming one
Market Insight
23
Brent stressed that the JPY/USD currency pair has been hitting resistance during the last 6 months at its Sentiment Level, an indicator he developed and uses for trading and he’ll remain bullish on the JPY and bearish on the USD while the currency pair can keep above 1.0516. Don simply says that the trend is down and an upward bounce will likely occur at support levels between 92.50 and 91.75. He added that this reactive bounce should create a continuation pattern, after which this market has a good chance of dropping to around 90.00 or even lower.
On trading, most experts agree that it is better to go short on rallies than to go long on breakout.
Weekly USD/JPY chart since 2007
Forex Market Experts background:
DAR Wong - Principal Consultant /Founder of PWforex.com
DAR Wong has 20 years of trading experiences in global derivatives and FOREX markets. His past employment records started from Bank of America Futures Inc in 1989, thereafter followed by Bankers Trust Futures Inc, Barclays ZW Futures Inc and as a senior trader with S.B. Shearson (Citigroup). Currently, besides being a book author, DAR contributes for financial magazine like Traders Journal, Forex Traders, The Pulses, The Analyst and also has been rated as a popular columnist in The Borneo Post and Busy Weekly. Till date, DAR
conducts training modules for Singapore Exchange (SGX) and has represented financial institutions in seminars covering 7 countries.
Being a genuine trader and still maneuvering in the markets, DAR has used his proprietary concepts - PowerWave TradingTM in turning many individuals to become successful corporate and retail traders in leveraged trading on global markets.
Articles
Equities Malaysia | Singapore | Vietnam Thailand | US | Relative Performance
Brent Penfold is a full time futures trader. He began his career 1983 as an institutional bank dealer with Bank America and today specializes in trading global index and currency futures. Brent is the author of the best selling book Trading The SPI and Back to Basics Trading is his new book that even Larry Williams says is the "most comprehensive trading book" he has ever read!. Brent publishes the daily newsletter IndexALERT and is a popular and sought after
speaker. He has presented to the Australian Technical Analysts Association and the Traders Expos around Australia and throughout Asia. Brent is a licensed futures advisor and holds a Master of Commerce (Finance) degree.
Don Schellenberg - Founder, Master Money Traders
Don is a well-known international convention and seminar speaker from North America. As the founder of Master Money Traders Ltd in Canada, Mr Schellenberg accumulated over 10,000 hours of trading and training experience. As an experienced trader, he brings powerful trading concepts to traders and investors of all levels of expertise.
Trade Forex and Gold with 100% confidence By Don Schellenberg Date: 26 & 27 Sept 2009 (Sat & Sun) Time: 9:00am - 5:00pm Place: Kuala Lumpur
Visit www.nextview.com for more details
Articles
Equities Malaysia | Singapore | Vietnam Thailand | US | Relative Performance
ASTUTE INVESTORS – EVERYONE DREAMS OF BECOMING ONE Article contributed by Ameer Ali Mohamed Buy low sell high – a stock market adage easier said than done. In pursuit of putting this proverb into practice, sometimes an investor buying stocks at a low price ends up selling at much lower levels when the share price continues to slide and he must take steps to preserve his capital. Buy low sell high turns out to be buy low sell lower. Worse, if the price of that same stock moves higher within weeks or months after the sale!
There are also investors who are afraid to buy when prices are falling, lest they “catch a falling knife”. Indeed, catching falling knives can lead to financial disaster. However, if one knows how and when to “catch the falling knife” in a correct manner, the reward could be awesome compared with the bleeding suffered earlier. To be able to do that, the investor needs to be an “astute investor”, a term used by stock market guru, Charles H. Dow, to explain the three market phases in his basic tenets of a financial market. According to Dow, astute investors are those who sell their shares in the final phase of a bull market when everyone else seems busy recommending a buy and chasing to buy shares at higher levels, and they accumulate in the final phase of a bear market when everyone else seems busy recommending a sell and disposing stocks at lower levels. If we were to recall the first three months of this year, many investment experts were divided on whether the KLCI would continue to slide, had reached a significant bottom or was nearing an important floor.
Articles
Equities Malaysia | Singapore | Vietnam Thailand | US | Relative Performance
Articles Forex Analysis Astute Investors – everyone dreams of becoming one
Market Insight
26
Having attended many investment seminars during that time especially in March, there were pundits predicting the index would slide further to around the 650 levels and there were some who envisaged the market having reached the bottom so long as the index did not break below the 800 levels. There were also some who played safe by recommending a 50% exposure in equity due to the heightening global economic uncertainty then, notwithstanding the extremely attractive valuations of many blue chip companies. After hitting this year’s lowest closing level of 838.39 points on 12 March, the KLCI advanced by 237.38 points or 28.3% up to 29 June, with many fund managers’ darling stocks that had become penny stocks registering returns beyond 100%. The main question in the minds of many investors and traders would probably be whether an astute investor should use technical or fundamental analysis, or both. Indeed this issue is debatable and each of the fundamental and technical analysts would probably say that their approach is the best. In fundamental analysis, experts would look at the potential of a listed company in terms of earnings, cashflow and dividend payable during the current and following financial year, given the company’s business operations and the economic environment. The forecasts on earnings, cashflow and dividend would allow an investor determine the important market ratios of price earnings multiple, price cashflow multiple and dividend yield.
In technical analysis, experts would look for reversal patterns to determine the end of a bear or a bull market campaign. In a bear market campaign, they would analyse the major trendline resistance, price formation, indicators and volume action, and monitor if a breakout has occurred.
Articles
Equities Malaysia | Singapore | Vietnam Thailand | US | Relative Performance
Articles Forex Analysis Astute Investors – everyone dreams of becoming one
Market Insight
27
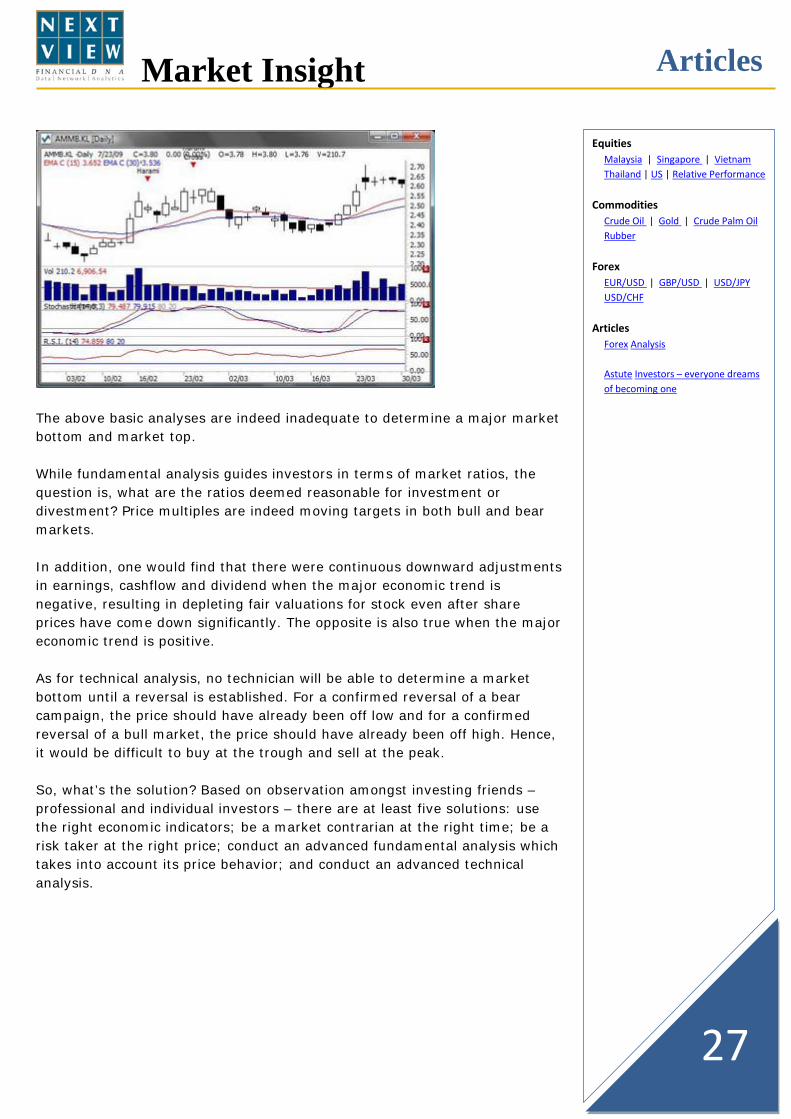
The above basic analyses are indeed inadequate to determine a major market bottom and market top. While fundamental analysis guides investors in terms of market ratios, the question is, what are the ratios deemed reasonable for investment or divestment? Price multiples are indeed moving targets in both bull and bear markets. In addition, one would find that there were continuous downward adjustments in earnings, cashflow and dividend when the major economic trend is negative, resulting in depleting fair valuations for stock even after share prices have come down significantly. The opposite is also true when the major economic trend is positive. As for technical analysis, no technician will be able to determine a market bottom until a reversal is established. For a confirmed reversal of a bear campaign, the price should have already been off low and for a confirmed reversal of a bull market, the price should have already been off high. Hence, it would be difficult to buy at the trough and sell at the peak. So, what’s the solution? Based on observation amongst investing friends – professional and individual investors – there are at least five solutions: use the right economic indicators; be a market contrarian at the right time; be a risk taker at the right price; conduct an advanced fundamental analysis which takes into account its price behavior; and conduct an advanced technical analysis.
Articles
Equities Malaysia | Singapore | Vietnam Thailand | US | Relative Performance
A private trader and very experienced and sought-after financial speaker/trainer in the Asian region. He has coached hundreds of professional (including those endorsed by the securities commission) and retail investors and traders in Malaysia, Singapore and 5 other countries for more than 9 years. His regular analysis and commentaries can be found in popular financial
publications like Pulses in Singapore, Smart investor, Shares investment, Busy Weekly and Palm Oil Fortune in Malaysia.
Don Schellenberg - Founder, Master Money Traders and trading coach
Don is a well-known international convention and seminar speaker from North America. As the founder of Master Money Traders Ltd in Canada, Mr Schellenberg accumulated over 10,000 hours of trading and training experience. As an experienced trader, he brings powerful trading concepts to traders and investors of all levels of expertise.
Ameer Ali Mohamed is a Private Trader and Director, Financial Research of NextVIEW.
He has a total of 20 years experience as a corporate journalist, investment analyst and fund manager, including as research head of two stockbroking firms and CEO/CIO of a funds management company.
Equities Malaysia | Singapore | Vietnam Thailand | US | Relative Performance