21
MARKET RESEARCH REPORT Maize | Rice Bran | Cottonseed Oil Cake May 2021

MARKET
RESEARCH REPORT
Maize | Rice Bran | Cottonseed Oil Cake
May 2021
Contents
Maize
Outlook and Review
Maize Trade Scenario
International Maize Market Summary
India Maize Balance Sheet
Consumption Break Up
Domestic Price Outlook
Maize Exports during April 2021
Maize Vessel Position
CBOT Maize Future Prices
Spot Price and Arrival Comparison
Rice Bran
Domestic Market Summary
Fundamental Outlook for Coming Month
State wise Paddy Sowing Coverage for Rabi 2020-21
Paddy & De-Oiled Rice Bran Production
Rice Bran Exports
De-Oiled Rice Bran Spot Prices Comparison
Price Trend & Outlook
Country wise Import& Export Data
Cottonseed Oil Cake
Domestic Market Summary
State-wise Cotton Sowing Coverage for Kharif 2020-21
Cottonseed & Cottonseed Oil Cake Production
Cottonseed Oil Cake Exports & Imports
Cottonseed Oil Cake Spot Prices Comparison
Price Outlook
NCDEX Cottonseed Oil Cake Futures
NCDFIeMarket.com 2
03
15
08
3AgriWatch.com
Maize

Domestic Maize Market Summary
Maize cash markets showed a steady to range bound
trend during the month of May 2021 compared to
previous month and Maize cash markets trend during the
month of May 2021 was almost similar to corresponding
period last year. For the month of June 2021, Agriwatch
expects that Maize would trade steady to range-bound
as expectation of an increase in new crop arrivals
containing high moisture percentage in coming weeks
would weigh on market sentiments. On the other hand,
continuous demand from domestic millers and global
feed makers would support the market at the lower level.
Maize Trade Scenario
Maize in Bihar markets is being traded at ₹ 1,500 per
quintal, Maize is being exported to Bangladesh at
₹ 1,525 per quintal sourced from West Bengal. Maize
from Bihar is being supplied to starch mills in Jamnagar,
Gujarat and Rudrapur, Uttarakhand at ₹ 1,750 per
quintal each. Maize in M.P, Mandsaur and nearby areas is
being traded at an average of ₹ 1,449 per quintal. Maize
in villages nearby Nizamabad is being traded at ₹ 1,550
per quintal.
International Maize Market Summary
Maize on CBOT rose by US$ 3.34 per MT to US$ 258.55
per MT for July 2021 contract compared to the previous
month due to decent demand of Maize crop in
international market, even though world Maize
production estimates were higher than expected
according to WASDE Maize report published during
second week of May 2021. Agriwatch expects that
weather related concerns in U.S. and Brazil, would
support CBOT Maize.
USDA increased its World Maize Ending Stock Estimate
by 8.77 MMT to 292.301 MMT for 2021-22, with
projected increase in Production Estimates, which would
weigh the global Maize market. USDA also revised the
Ending stock estimates for Argentina, at 2.62 MMT for
2021-22, Brazil at 8.93 MMT for 2021-22 and for U.S. at
38.27 MMT for 2021-22.
India Maize Balance Sheet
Outlook and Review
NCDFIeMarket.com 4
Maize Year (Oct-Sep)
Opening Stocks (MMT)
Production (MMT)
Imports (MMT)
Total Supply (MMT)
Export (MMT)
Domestic Consumption (MMT)
Total Demand (MMT)
Ending Stock (MMT)
Monthly Use
Stock to Use Ratio (%)
2019-20
01.42
25.38
00.34
27.14
01.11
22.62
23.73
03.41
01.98
14.38 %
2020-21F
3.41
24.51
0.02
27.94
2.78
22.52
25.30
2.65
5.13
10.46%
The 2020-21 season, beginning October 2020, started
with an opening stock of 3.41 MMT and is expected to
end in September 2021 with 2.65 MMT.
Total Maize production in India is estimated at around
24.51 MMT in 2020-21 against our total annual demand
including exports of 27.94 MMT.
As the Ending stocks are expected to be lower
than in 2019-20, Indian Maize prices would take
clue from that.
F=AW Forecast
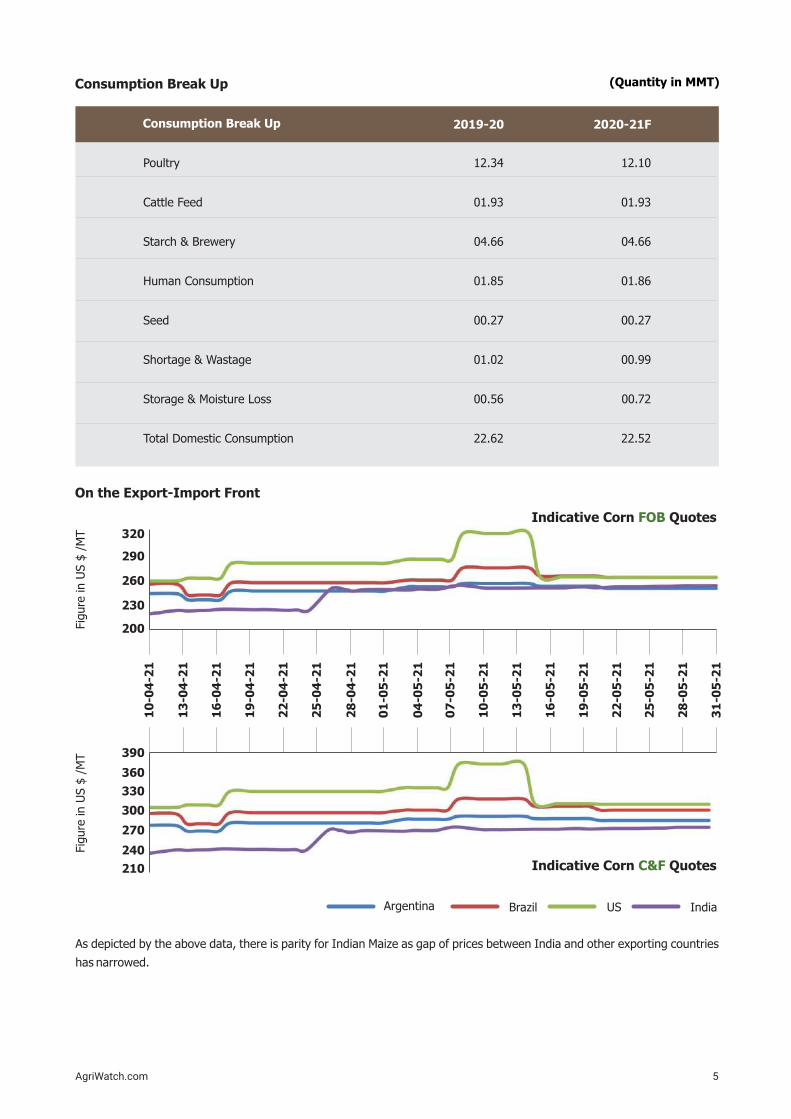
Consumption Break Up
On the Export-Import Front
Argentina Brazil US India
(Quantity in MMT)
16
-04
-21
19
-04
-21
10
-04
-21
22
-04
-21
13
-04
-21
25
-04
-21
28
-04
-21
01
-05
-21
04
-05
-21
07
-05
-21
10
-05
-21
13
-05
-21
16
-05
-21
19
-05
-21
22
-05
-21
25
-05
-21
28
-05
-21
31
-05
-21
AgriWatch.com 5
As depicted by the above data, there is parity for Indian Maize as gap of prices between India and other exporting countries
has narrowed.
Indicative Corn Quotes C&F
Consumption Break Up 2019-20 2020-21F
12.34
01.93
04.66
01.85
00.27
01.02
00.56
22.62
12.10
01.93
04.66
01.86
00.27
00.99
00.72
22.52
Poultry
Cattle Feed
Starch & Brewery
Human Consumption
Seed
Shortage & Wastage
Storage & Moisture Loss
Total Domestic Consumption
Fig
ure
in U
S $
/M
T 320
260
290
230
200
Indicative Corn Quotes FOB
Fig
ure
in U
S $
/M
T 390
360
330
300
270
240
210

NCDFIeMarket.com 6
Maize Exports
As per trade sources, India exported around 3,00,287
MT of Maize in April 2021 at an average FoB of US$
228.66 per MT, out of which, 2,03,921 MT was exported
to Vietnam at an average FoB of US$ 243.67 per MT and
around 31,452 MT was exported to Malaysia at an
average FoB of US$ 254.28 per MT. Around 36,518 MT
was exported to Bangladesh at an average FoB of US$
215.59 per MT. And, 19,996 MT was exported to Nepal at
an average FoB of US$ 212.47 per MT.
Maize Vessel Position
As per the sources, 31,000 MT of Maize Vessel, GOLDEN
BRIGHT has completed loading at KAKINADA port by
May 30, 2021. Also 22,860 MT of Maize Vessel, INLACO
ACCORD has completed loading at KRISHNAPATNAM
port by June 01, 2021 and 31,000 MT of Maize Vessel,
GOLDEN BRIDGE has completed loading at Tuticorin
port by May 26, 2021. 11,000 MT of Maize Vessel, TAN
BINH 127, is waiting to complete loading at Tuticorin
port. Whereas, 30,000 MT of Maize Vessel, OSPREY
BULKER has been lined up since May 29, 2021.
As per trade sources, around 3,39,500 MT of Maize has
been loaded till last week of May 2021, mainly through
Vizag port followed by Krishnapatnam port and Tuticorin
port.
Domestic Price Outlook
Agriwatch expects that Maize would trade steady to
range-bound during the month of June 2021 on the
expectation of new crop arrivals containing high
moisture percentage in the coming weeks. Agriwatch
expects that Maize in Nizamabad would trade in a range
of ₹ 1,450 - ₹1,650 per quintal during the month of May
2021.
International Market Scenario
U.S. Maize exports have reached 49.13 MMT in the 2020-
21 marketing year. At 1.92 MMT (for the period May 14-
20, 2021) U.S. Maize exports were down by 17 percent
from the previous week and 6 percent from the prior 4-
week average; mainly for the destinations like China
(8,47,000 MT), Mexico (3,79,000 MT, Japan (2,00,000
MT), Colombia (2,00,700 MT), and South Korea (61,500
MT). Agriwatch expects that weather related concerns in
U.S. and Brazil, would provide support to CBOT Maize.
FOB 248.00 264.00 264.00 252.11
C&F 298.00 315.00 324.00 286.18
(US$1= ₹72.37)
As on May 31, 2021
Indian C&F Rate to Thailand vs. other Countries
Argentina Brazil US India
CBOT (Chicago Board of Trade) Maize Future Prices
July-21
Sep-21
Dec-21
258.55
225.68
214.75
255.21
224.6
215.05
217.31
-
3.34
1.08
-0.30
0.10
-
Maize CBOT Monthly Futures Price Listing
Contract Month May 31, 2021 Apr 30, 2021 Change
Maize CBOT Prices
Mar-22
May-22
217.41
218.79
(Price in US$/MT)

7
1,503Gulabbagh
Gulabbagh
1,601Nizamabad
Nizamabad
1,650Davangere
Davangere
1,850Sangli
Sangli
1,212
Closed
1,355
1,418
4,15,000
Closed
61,000
1,10,000
1,820
2,152
2,252
2,263
10,30,000
8,150
24,500
70,000
1,163
1,343
1,240
NA
6,85,000
9,000
25,500
NA
(Price in /Quintal)₹
(Quantity in Quintal)
· Price: Monthly averages of Bilty Prices
Arrival: Total Monthly Arrivals
Spot Price Comparison
Market Arrival Comparison
May'21
May'21
Market
Market
May'20
May'20
May'19
May'19
May'18
May'18
3,05,000
Closed
9,171
18,500
AgriWatch.com
International Maize outlook
Maize on CBOT rose by US$ 3.34 per MT to US$ 258.55 per MT for July 2021 contract compared to the previous month
due to decent demand of Maize crop in international market, even though world Maize production estimates were
higher than expected according to WASDE Maize report published during second week of May. Agriwatch expects that
weather related concerns in U.S. and Brazil, would support CBOT Maize.

8
Rice Bran
NCDFIeMarket.com
9
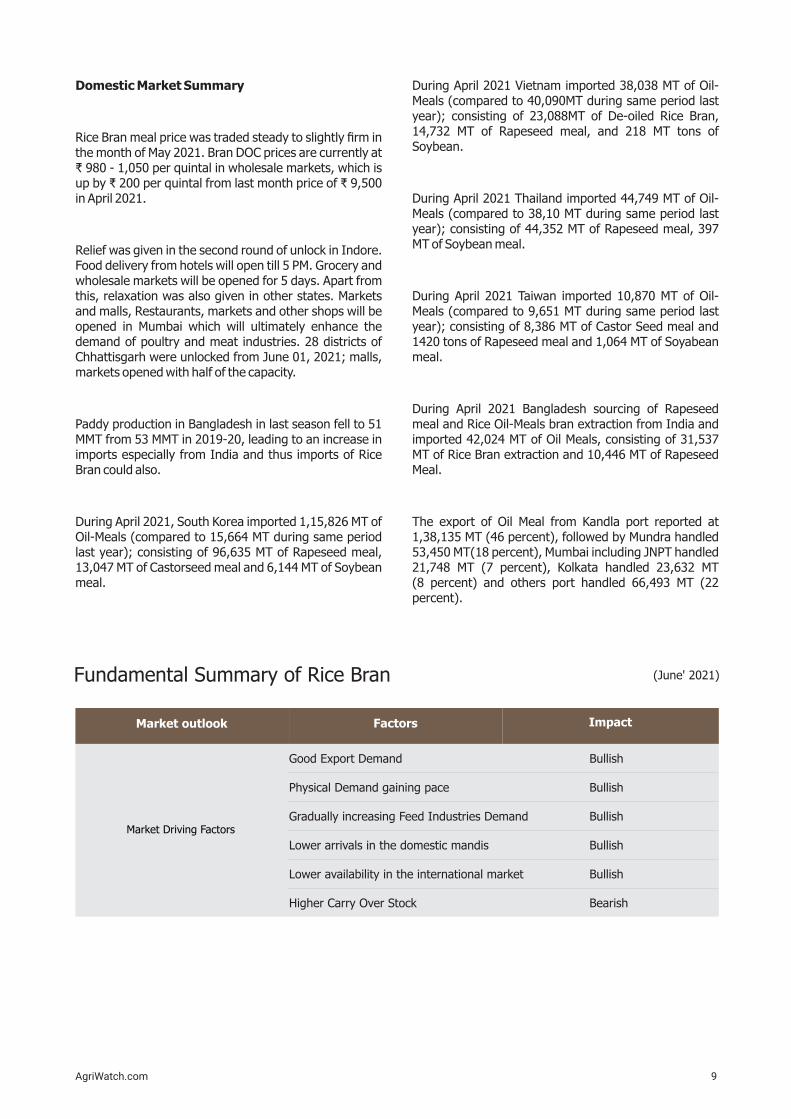
Domestic Market Summary
Rice Bran meal price was traded steady to slightly firm in the month of May 2021. Bran DOC prices are currently at ₹ 980 - 1,050 per quintal in wholesale markets, which is up by ₹ 200 per quintal from last month price of ₹ 9,500 in April 2021.
Relief was given in the second round of unlock in Indore. Food delivery from hotels will open till 5 PM. Grocery and wholesale markets will be opened for 5 days. Apart from this, relaxation was also given in other states. Markets and malls, Restaurants, markets and other shops will be opened in Mumbai which will ultimately enhance the demand of poultry and meat industries. 28 districts of Chhattisgarh were unlocked from June 01, 2021; malls, markets opened with half of the capacity.
Paddy production in Bangladesh in last season fell to 51 MMT from 53 MMT in 2019-20, leading to an increase in imports especially from India and thus imports of Rice Bran could also.
During April 2021, South Korea imported 1,15,826 MT of Oil-Meals (compared to 15,664 MT during same period last year); consisting of 96,635 MT of Rapeseed meal, 13,047 MT of Castorseed meal and 6,144 MT of Soybean meal.
During April 2021 Vietnam imported 38,038 MT of Oil-Meals (compared to 40,090MT during same period last year); consisting of 23,088MT of De-oiled Rice Bran, 14,732 MT of Rapeseed meal, and 218 MT tons of Soybean.
During April 2021 Thailand imported 44,749 MT of Oil-Meals (compared to 38,10 MT during same period last year); consisting of 44,352 MT of Rapeseed meal, 397 MT of Soybean meal.
During April 2021 Taiwan imported 10,870 MT of Oil-Meals (compared to 9,651 MT during same period last year); consisting of 8,386 MT of Castor Seed meal and 1420 tons of Rapeseed meal and 1,064 MT of Soyabean meal.
During April 2021 Bangladesh sourcing of Rapeseed meal and Rice Oil-Meals bran extraction from India and imported 42,024 MT of Oil Meals, consisting of 31,537 MT of Rice Bran extraction and 10,446 MT of Rapeseed Meal.
The export of Oil Meal from Kandla port reported at 1,38,135 MT (46 percent), followed by Mundra handled 53,450 MT(18 percent), Mumbai including JNPT handled 21,748 MT (7 percent), Kolkata handled 23,632 MT (8 percent) and others port handled 66,493 MT (22 percent).
AgriWatch.com
Market outlook
Fundamental Summary of Rice Bran (June' 2021)
Factors Impact
Market Driving Factors
Good Export Demand
Physical Demand gaining pace
Gradually increasing Feed Industries Demand
Lower arrivals in the domestic mandis
Lower availability in the international market
Higher Carry Over Stock
Bullish
Bullish
Bullish
Bullish
Bullish
Bearish
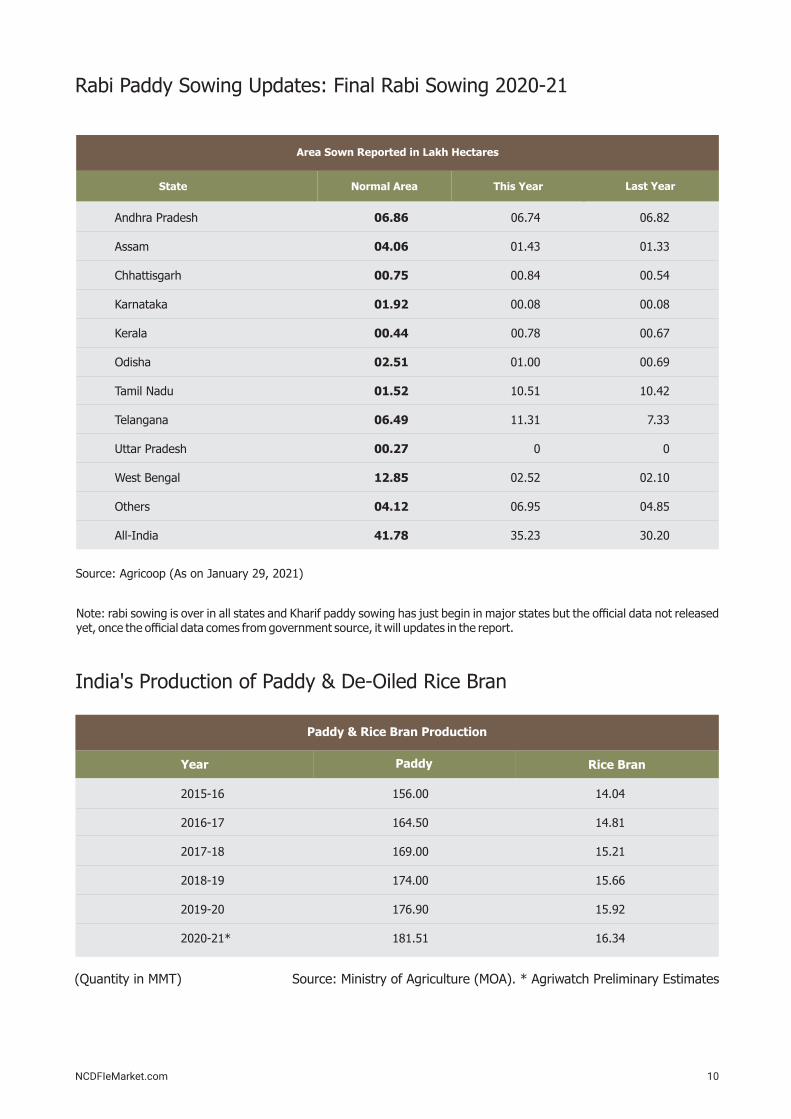
India's Production of Paddy & De-Oiled Rice Bran
Source: Ministry of Agriculture (MOA). * Agriwatch Preliminary Estimates(Quantity in MMT)
Paddy & Rice Bran Production
Year Paddy
Rice Bran
10NCDFIeMarket.com
Note: rabi sowing is over in all states and Kharif paddy sowing has just begin in major states but the official data not released yet, once the official data comes from government source, it will updates in the report.
Rabi Paddy Sowing Updates: Final Rabi Sowing 2020-21
Area Sown Reported in Lakh Hectares
Source: Agricoop (As on January 29, 2021)
2015-16
2016-17
2017-18
2018-19
2019-20
2020-21*
156.00
164.50
169.00
174.00
176.90
181.51
14.04
14.81
15.21
15.66
15.92
16.34
Normal Area This Year Last Year State
Andhra Pradesh
Assam
Chhattisgarh
Karnataka
Kerala
Odisha
Tamil Nadu
Telangana
Uttar Pradesh
West Bengal
Others
All-India
06.86
04.06
00.75
01.92
00.44
02.51
01.52
06.49
00.27
12.85
04.12
41.78
06.74
01.43
00.84
00.08
00.78
01.00
10.51
11.31
0
02.52
06.95
35.23
06.82
01.33
00.54
00.08
00.67
00.69
10.42
7.33
0
02.10
04.85
30.20
11AgriWatch.com
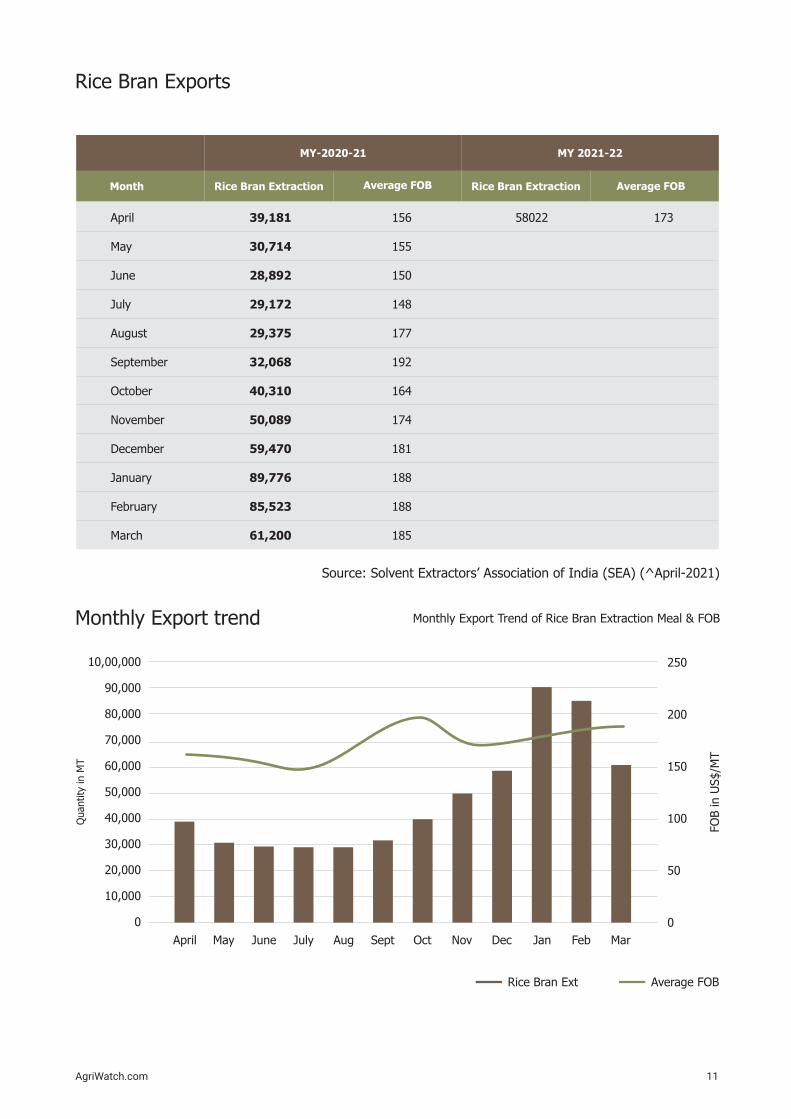
Rice Bran Exports
Monthly Export trend
Source: Solvent Extractors’ Association of India (SEA) (^April-2021)
Monthly Export Trend of Rice Bran Extraction Meal & FOB
10,00,000
90,000
80,000
70,000
60,000
50,000
40,000
30,000
20,000
10,000
0
250
200
150
100
50
0
Quantity
in M
T
FO
B in U
S$/M
T
Rice Bran Ext Average FOB
April May June July Aug Sept Oct Nov Dec Jan Feb Mar
Average FOB Rice Bran Extraction Average FOB
MY-2020-21 MY 2021-22
Month Rice Bran Extraction
April
May
June
July
August
September
October
November
December
January
February
March
39,181
30,714
28,892
29,172
29,375
32,068
40,310
50,089
59,470
89,776
85,523
61,200
156
155
150
148
177
192
164
174
181
188
188
185
58022 173

12NCDFIeMarket.com
Monthly Average Spot Prices Comparison
Price Trend
Source: Agriwatch(In ₹ per quintal)
Rice Bran Meal
Market
% Change
over a month
% Change over a year
Bhatinda (Punjab)
Raipur (Chhattisgarh)
1.96
5.65
-5.73
2.44
Fig
ure
in ₹
/MT
May'20May'21 Apr'21
936.5
942.6
882.8
965.6
865.8
914
Rice Bran Price Trend
Steady to firm sentiments witnessed in the domestic bran meal on persistent local millers and Feed industries demand. As per chart shown above, prices were hovering between ₹ 9,500 to ₹ 10,500 per MT in the month of May 2021 which is slightly up from last month. We expect price will move in the range bound to bullish trend in coming month as lockdown is open in some states and demand of chicken and eggs from feed industries is coming up.
Source: Agriwatch VijaywadaRaipurOdishaKolkata
The Solvent Extractors' Association of India has
compiled the export data for export of Oil-Meals for the
month of April 2021 and provisionally reported at
3,03,458 MT compared to 3,21,435 MT in March, 2021
and 3,93,309 MT in February 2021 showing the down
trend.
Year 2020-21 was revival of the export of Oil-Meals and
jumped to 36.8 lakh tons from 24.3 lakh tons in previous
year. In the current year, 2021-22 the performance
during first half is likely to lower as in case of Soya Meal
as Soya Meal price in India is quite higher than other
countries. Export of Rape Seed Meal likely to maintain
same level of last year, as India is competitive supplier to
South Korea, Vietnam, Thailand and other Far-East
countries. India Exported record quantity of 5.76 Lakh
tons of Rice Bran extraction during 2020-21, thanks to
the new demand from Bangladesh due to failure of their
Rice crop, while castor meal export likely to maintain at
same level of last year.

13AgriWatch.com
Sourc
e-A
griw
atc
h, Tr
ade S
ourc
e &
Min
istr
y of
Agricu
lture
, SEA o
f In
dia
, Tr
ade.c
om
Pa
rtic
ula
rs
Openin
g S
tock
of
Bra
n
Paddy
Pro
duct
ion
Bra
n P
roduct
ion
Import
s
Tota
l Supply
Exp
ort
s of
Ric
e B
ran
Dom
est
ic C
onsu
mption
Tota
l use
Endin
g S
tock
of
Bra
n
20
19
-20
*
5.8
2
176.9
0
15.9
2
0.0
70
21.8
1
00.2
4
10.5
5
10.7
9
11.0
2
20
20
-21
*
11.0
2
180.6
0
16.3
4
0.0
16
27.
38
00.5
0
12.0
7
12.5
7
14.8
1
20
-Oct
11.0
2
59.0
5
5.3
1
0.0
0085
16.3
4
00.0
4
3.2
0
03.2
4
13.1
0
20
-No
v
13.1
0
86.0
8
7.75
0.0
0100
20.8
5
00.0
5
4.6
5
04.7
0
16.1
5
20
-De
c
16.1
5
20.2
1
1.9
0
0.0
0027
18.0
5
00.0
6
2.2
2
02.2
8
15.7
7
21
-Ja
n
15.7
7
15.2
6
1.3
7
0.0
0030
17.
14
00.0
2
1.0
0
01.0
2
16.1
2
21
-Fe
b
16.1
2
0.0
0
0.0
0
0.0
0850
16.1
3
00.0
4
0.5
0
00.5
4
15.5
9
21
-Ma
r
15.5
9
0.0
0
0.0
0
0.0
0080
15.5
9
00.0
5
0.5
0
00.5
5
15.0
4
21
-Ap
r
15.0
4
0.0
0
0.0
0
0.0
0075
15.0
4
00.0
5
0.0
0
00.0
5
15.0
0
21
-Ma
y
15.0
0
0.0
0
0.0
0
0.0
0085
15.0
0
00.0
5
0.0
0
00.0
5
14.9
5
21
-Ju
n
14.9
5
0.0
0
0.0
0
0.0
0070
14.9
5
00.0
4
0.0
0
00.0
4
14.9
1
21
-Ju
l
14.9
1
0.0
0
0.0
0
0.0
0095
14.9
1
00.0
3
0.0
0
00.0
3
14.8
8
21
-Au
g
14.8
8
0.0
0
0.0
0
0.0
0070
14.8
8
00.0
3
0.0
0
00.0
3
14.8
5
21
-Se
p
114.8
5
0.0
0
0.0
0
0.0
0080
14.8
5
00.0
4
0.0
0
00.0
4
14.8
1
(Quantity
in M
MT)
Ric
e B
ran B
ala
nce
sheet
and O
utlook
14AgriWatch.com
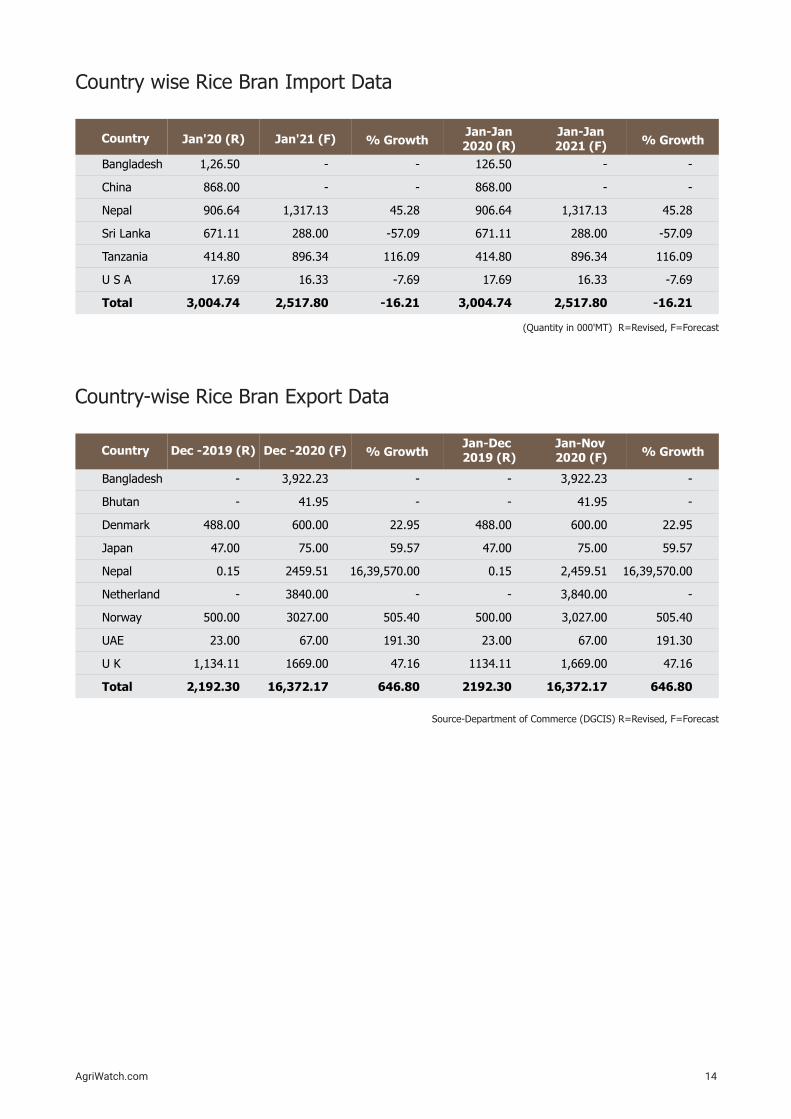
(Quantity in 000'MT) R=Revised, F=Forecast
Source-Department of Commerce (DGCIS) R=Revised, F=Forecast
Country wise Rice Bran Import Data
Country-wise Rice Bran Export Data
Country
Country
Jan'20 (R)
Dec -2019 (R)
% Growth
% Growth
Bangladesh
China
Nepal
Sri Lanka
Tanzania
U S A
Total
Bangladesh
Bhutan
Denmark
Japan
Nepal
Netherland
Norway
UAE
U K
Total
1,26.50
868.00
906.64
671.11
414.80
17.69
3,004.74
-
-
488.00
47.00
0.15
-
500.00
23.00
1,134.11
2,192.30
-
-
1,317.13
288.00
896.34
16.33
2,517.80
3,922.23
41.95
600.00
75.00
2459.51
3840.00
3027.00
67.00
1669.00
16,372.17
126.50
868.00
906.64
671.11
414.80
17.69
3,004.74
-
-
488.00
47.00
0.15
-
500.00
23.00
1134.11
2192.30
-
-
45.28
-57.09
116.09
-7.69
-16.21
-
-
22.95
59.57
16,39,570.00
-
505.40
191.30
47.16
646.80
-
-
1,317.13
288.00
896.34
16.33
2,517.80
3,922.23
41.95
600.00
75.00
2,459.51
3,840.00
3,027.00
67.00
1,669.00
16,372.17
-
-
45.28
-57.09
116.09
-7.69
-16.21
-
-
22.95
59.57
16,39,570.00
-
505.40
191.30
47.16
646.80
Jan'21 (F)
Dec -2020 (F)
Jan-Jan 2020 (R)
Jan-Dec2019 (R)
Jan-Jan 2021 (F)
Jan-Nov 2020 (F)
% Growth
% Growth

15
Cottonseed Oil Cake
NCDFIeMarket.com
16
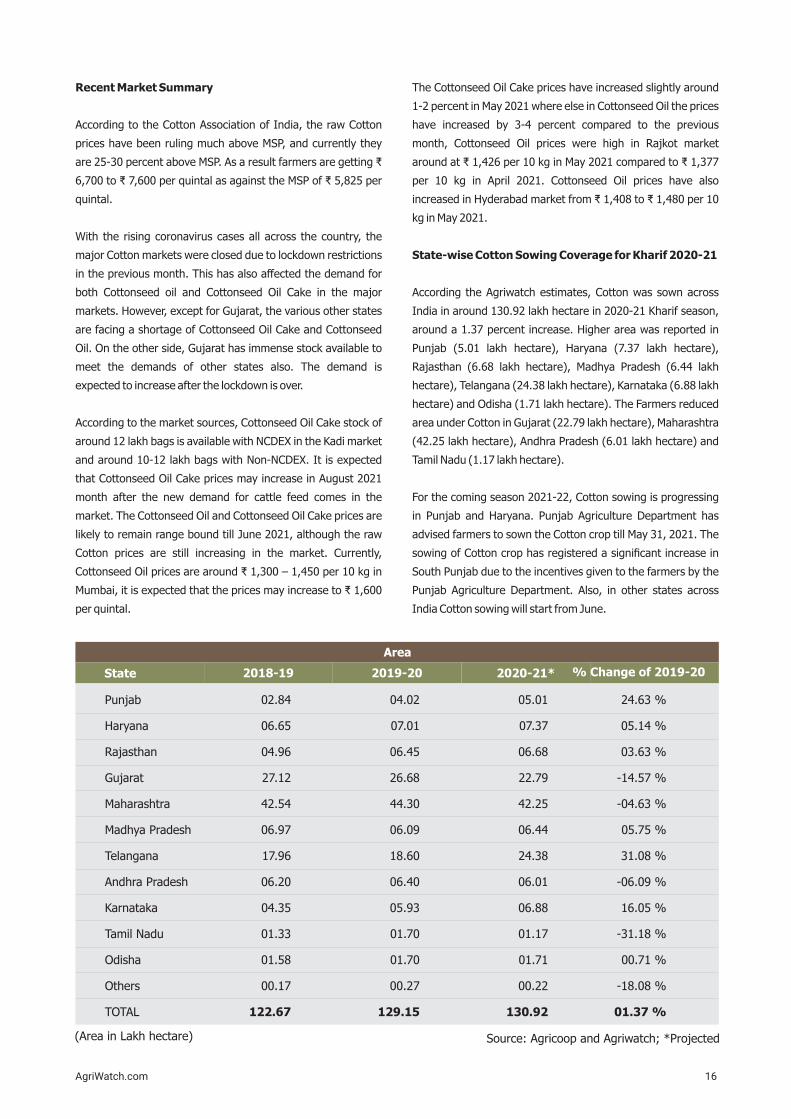
Recent Market Summary
According to the Cotton Association of India, the raw Cotton
prices have been ruling much above MSP, and currently they
are 25-30 percent above MSP. As a result farmers are getting ₹
6,700 to ₹ 7,600 per quintal as against the MSP of ₹ 5,825 per
quintal.
With the rising coronavirus cases all across the country, the
major Cotton markets were closed due to lockdown restrictions
in the previous month. This has also affected the demand for
both Cottonseed oil and Cottonseed Oil Cake in the major
markets. However, except for Gujarat, the various other states
are facing a shortage of Cottonseed Oil Cake and Cottonseed
Oil. On the other side, Gujarat has immense stock available to
meet the demands of other states also. The demand is
expected to increase after the lockdown is over.
According to the market sources, Cottonseed Oil Cake stock of
around 12 lakh bags is available with NCDEX in the Kadi market
and around 10-12 lakh bags with Non-NCDEX. It is expected
that Cottonseed Oil Cake prices may increase in August 2021
month after the new demand for cattle feed comes in the
market. The Cottonseed Oil and Cottonseed Oil Cake prices are
likely to remain range bound till June 2021, although the raw
Cotton prices are still increasing in the market. Currently,
Cottonseed Oil prices are around ₹ 1,300 – 1,450 per 10 kg in
Mumbai, it is expected that the prices may increase to ₹ 1,600
per quintal.
The Cottonseed Oil Cake prices have increased slightly around
1-2 percent in May 2021 where else in Cottonseed Oil the prices
have increased by 3-4 percent compared to the previous
month, Cottonseed Oil prices were high in Rajkot market
around at ₹ 1,426 per 10 kg in May 2021 compared to ₹ 1,377
per 10 kg in April 2021. Cottonseed Oil prices have also
increased in Hyderabad market from ₹ 1,408 to ₹ 1,480 per 10
kg in May 2021.
State-wise Cotton Sowing Coverage for Kharif 2020-21
According the Agriwatch estimates, Cotton was sown across
India in around 130.92 lakh hectare in 2020-21 Kharif season,
around a 1.37 percent increase. Higher area was reported in
Punjab (5.01 lakh hectare), Haryana (7.37 lakh hectare),
Rajasthan (6.68 lakh hectare), Madhya Pradesh (6.44 lakh
hectare), Telangana (24.38 lakh hectare), Karnataka (6.88 lakh
hectare) and Odisha (1.71 lakh hectare). The Farmers reduced
area under Cotton in Gujarat (22.79 lakh hectare), Maharashtra
(42.25 lakh hectare), Andhra Pradesh (6.01 lakh hectare) and
Tamil Nadu (1.17 lakh hectare).
For the coming season 2021-22, Cotton sowing is progressing
in Punjab and Haryana. Punjab Agriculture Department has
advised farmers to sown the Cotton crop till May 31, 2021. The
sowing of Cotton crop has registered a significant increase in
South Punjab due to the incentives given to the farmers by the
Punjab Agriculture Department. Also, in other states across
India Cotton sowing will start from June.
(Area in Lakh hectare) Source: Agricoop and Agriwatch; *Projected
State 2018-19 2019-20 2020-21* % Change of 2019-20
Area
AgriWatch.com
Punjab
Haryana
Rajasthan
Gujarat
Maharashtra
Madhya Pradesh
Telangana
Andhra Pradesh
Karnataka
Tamil Nadu
Odisha
Others
TOTAL
02.84
06.65
04.96
27.12
42.54
06.97
17.96
06.20
04.35
01.33
01.58
00.17
122.67
04.02
07.01
06.45
26.68
44.30
06.09
18.60
06.40
05.93
01.70
01.70
00.27
129.15
05.01
07.37
06.68
22.79
42.25
06.44
24.38
06.01
06.88
01.17
01.71
00.22
130.92
24.63 %
05.14 %
03.63 %
-14.57 %
-04.63 %
05.75 %
31.08 %
-06.09 %
16.05 %
-31.18 %
00.71 %
-18.08 %
01.37 %
17NCDFIeMarket.com
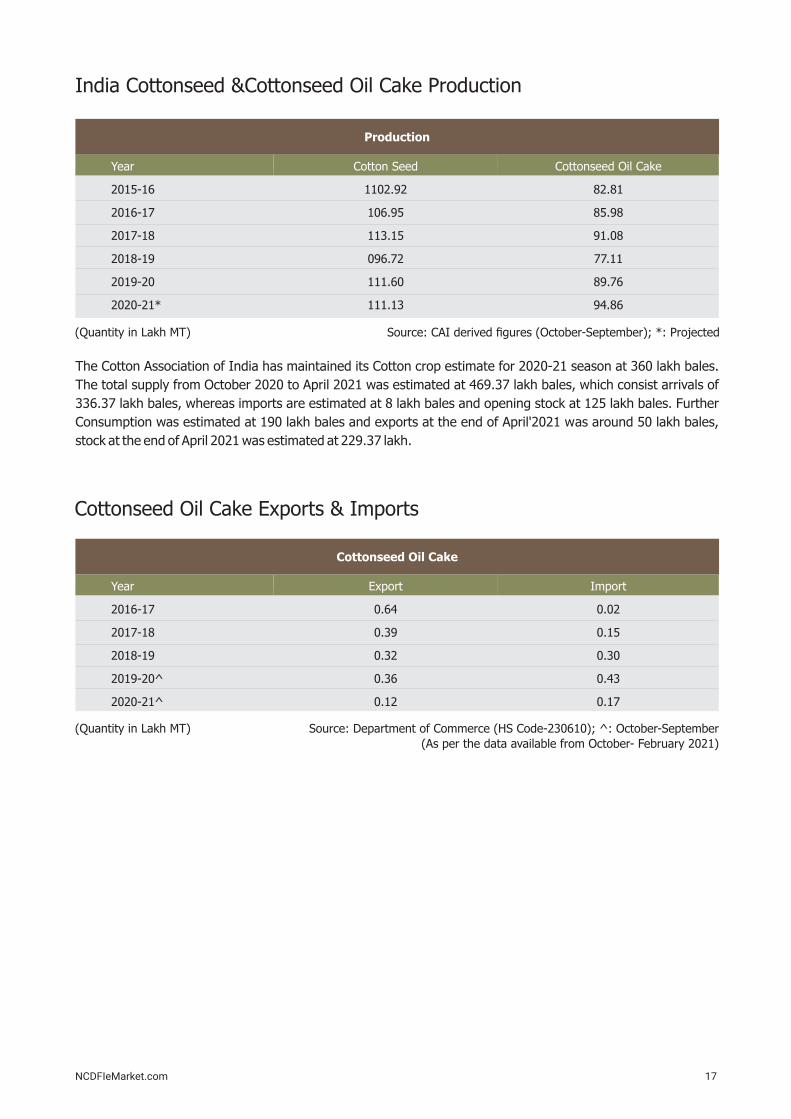
Source: CAI derived figures (October-September); *: Projected
Source: Department of Commerce (HS Code-230610); ^: October-September
(As per the data available from October- February 2021)
(Quantity in Lakh MT)
(Quantity in Lakh MT)
India Cottonseed &Cottonseed Oil Cake Production
Cottonseed Oil Cake Exports & Imports
Production
Cottonseed Oil Cake
Year
2015-16
2016-17
2017-18
2018-19
2019-20
2020-21*
Year
2016-17
2017-18
2018-19
2019-20^
2020-21^
Cotton Seed
1102.92
106.95
113.15
096.72
111.60
111.13
Export
0.64
0.39
0.32
0.36
0.12
Cottonseed Oil Cake
82.81
85.98
91.08
77.11
89.76
94.86
Import
0.02
0.15
0.30
0.43
0.17
The Cotton Association of India has maintained its Cotton crop estimate for 2020-21 season at 360 lakh bales.
The total supply from October 2020 to April 2021 was estimated at 469.37 lakh bales, which consist arrivals of
336.37 lakh bales, whereas imports are estimated at 8 lakh bales and opening stock at 125 lakh bales. Further
Consumption was estimated at 190 lakh bales and exports at the end of April'2021 was around 50 lakh bales,
stock at the end of April 2021 was estimated at 229.37 lakh.

18
Country wise Cottonseed Oil Cake Exports
Source: Department of Commerce (HS Code-230610); *: October-September(Quantity in Thousand MT)
Country
Bangladesh
China
Japan
Korea RP
Kuwait
Nepal
Oman
Saudi Arab
Taiwan
Thailand
UAE
Others
Total
2016-17
16.06
02.60
01.35
28.43
00.18
05.99
00.49
00.36
00.43
01.12
00.06
06.74
63.81
2017-18
04.79
02.16
01.36
18.55
00.15
04.76
02.67
00.00
00.62
00.85
00.04
03.16
39.11
2018-19
00.61
03.05
00.55
15.50
00.12
10.54
00.00
00.00
00.31
00.52
00.02
00.92
32.13
2019-20*
03.19
02.90
00.13
15.54
00.37
08.59
00.00
00.08
00.59
00.69
00.04
03.81
35.91
2020-21*
02.59
01.24
00.14
4.31
00.00
02.62
00.45
00.00
00.12
00.00
00.00
00.25
11.73
In 2019-20,India had mostly been exporting to Korea, Nepal, Bangladesh and China.
Most of the produced Cottonseed meal is consumed in India itself, limiting the global trade to just 0.30-0.60 lakh MT a
year.
The spot market traded low during May month, with the average price in Kadi was at ₹ 2,731per quintal and 1 percent
up around ₹ 2760 per quintal in Akola.
Source: NCDEX; Quality specifications: Moisture content: 9 percent, Oil Content: 6 percent,
Color: Greenish Yellow; Tax: 0 percent tax on Cottonseed Oil Cake
(Price in ₹/Quintal)
Cottonseed Oil Cake Spot Prices Comparison
Spot Price Comparison
Market May'21 Apr'21 May'20% Change
over a month
% Change over a year
Kadi 2244 - 22
Akola
2731
2760
2739
2728 2071 1 33
AgriWatch.com

19
According to the seasonality, the prices have remained range- bound but a slight decrease in prices was seen in May 2021, as demand was low due to look-down in various states. However, the huge carryover stock of the previous year and expectation of higher crop could keep the market range bound in 2020-21. The market may see an increase in price after August month.
Price Outlook
Price Trend Analysis of Cottonseed Oilcake (Kadi)
Cottonseed Oil Cake Price Trend at Kadi & Akola
NCDFIeMarket.com
Price
in ₹
/Qtl
Seasonality of 5 Years
Kadi (₹/Qtl) Akola (₹/Qtl)
Spot Price
Price
in ₹
/Qtl
Source: NCDEX
20
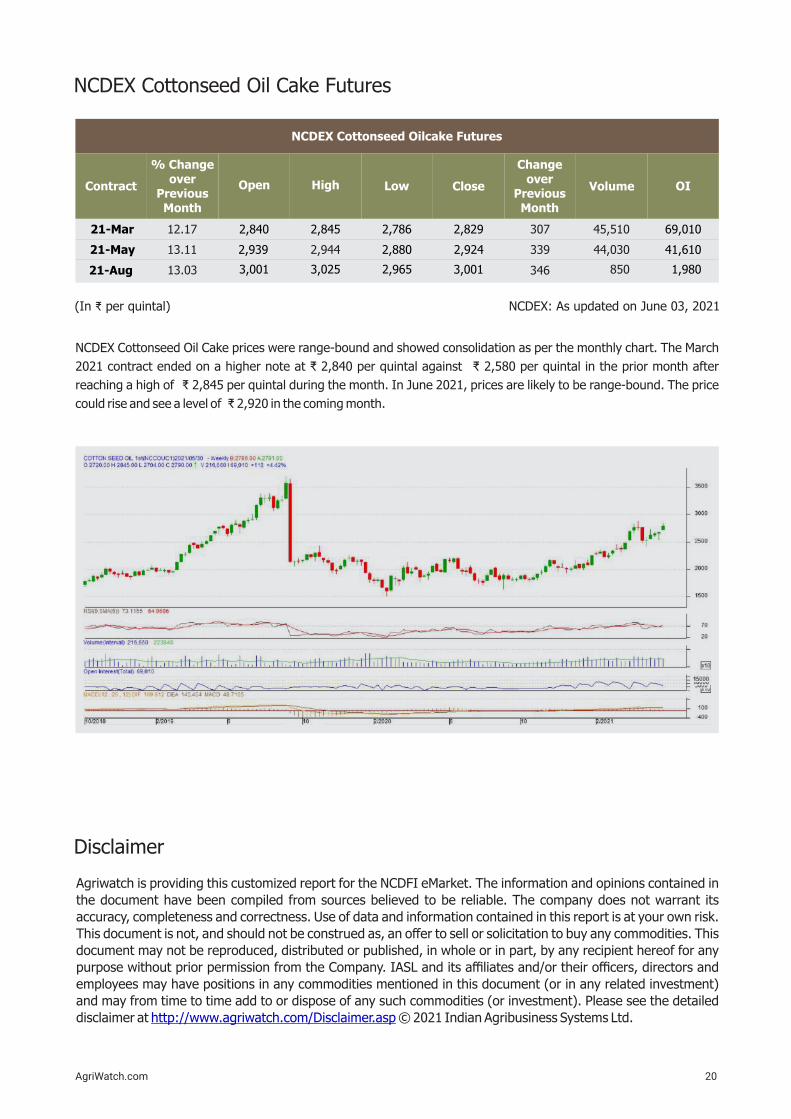
NCDEX Cottonseed Oil Cake prices were range-bound and showed consolidation as per the monthly chart. The March
2021 contract ended on a higher note at ₹ 2,840 per quintal against ₹ 2,580 per quintal in the prior month after
reaching a high of ₹ 2,845 per quintal during the month. In June 2021, prices are likely to be range-bound. The price
could rise and see a level of ₹ 2,920 in the coming month.
AgriWatch.com
NCDEX: As updated on June 03, 2021(In ₹ per quintal)
NCDEX Cottonseed Oil Cake Futures
NCDEX Cottonseed Oilcake Futures
Contract
% Change over
Previous Month
Open
High Low Close
Change over
Previous Month
Volume OI
21-Mar 2,845 2,786 2,829
21-May
21-Aug
12.17
13.11
13.03
307
339
346
2,840
2,939
3,001
2,944
3,025
2,880
2,965
2,924
3,001
45,510
44,030
850
69,010
41,610
1,980
Agriwatch is providing this customized report for the NCDFI eMarket. The information and opinions contained in
the document have been compiled from sources believed to be reliable. The company does not warrant its
accuracy, completeness and correctness. Use of data and information contained in this report is at your own risk.
This document is not, and should not be construed as, an offer to sell or solicitation to buy any commodities. This
document may not be reproduced, distributed or published, in whole or in part, by any recipient hereof for any
purpose without prior permission from the Company. IASL and its affiliates and/or their officers, directors and
employees may have positions in any commodities mentioned in this document (or in any related investment)
and may from time to time add to or dispose of any such commodities (or investment). Please see the detailed
disclaimer at © 2021 Indian Agribusiness Systems Ltd.http://www.agriwatch.com/Disclaimer.asp
Disclaimer
chitaara
.com
| +
91 9
924461171
chitaara
.com
| +
91 9
924461171
Products
DAIRY PRODUCTS CATTLE FEED
INGREDIENTSPACKAGING MATERIALS
SUGAR
CHEMICALS EDIBLE OILS
FODDER SEEDS TRANSPORT SCRAP
DRY FRUITS &
NUTSCHOCOLATES LABOUR
CONTRACTS


