Page 1
† Corresponding author
MARKET SELECTION OF REFINED PALM OIL BASED ON
BALANCING LOCAL DEMAND SATISFACTION AND EXPORTING
Chutchai Suksa-ard
School of Management Technology, Sirindhorn International Institute of Technology, Thammasat University,
Pathum Thani, 12000, THAILAND Email address: [email protected]
Morrakot Raweewan†
School of Management Technology, Sirindhorn International Institute of Technology, Thammasat University,
Pathum Thani, 12000, THAILAND +662-501-3505 ext 2115, Email: [email protected]
Abstract This research investigates the issue of market selection to maximize palm oils’ profit. When
fresh fruit brunches (FFB) are pressed at crushing mills, the fruitlets give crude oils CPO and
CPK that are sent to refineries to produce RPO, olein, and stearin. These oils are used in many
products such as cooking oil, margarine, food, soap, animal feed, biodiesel, export, etc. The
demand is increasing both worldwide and national because of biofuel initiative; however,
available plantation area in Thailand is limited and the majority of farmer body is independent
smallholders. Therefore, questions are left to be decided by policy makers. Given demands of
oils in the country, how much land should be allocated for plantation in which region (north,
northeast, central, or south); what is distribution network to transport from plantation to
crushing mills, from crushing mills to refineries; which market of commodity products should
be chosen; and how much oil to serve selected markets. A methodology is developed based on
optimization model that will allow policy makers to answer these questions. A numerical
experiment is conducted to illustrate the model and using IBM ILOG CPLEX to obtain the
optimal solution. We found the model works well to provide information and suggestions for
policy maker use in palm oil industry improvement.
Keywords: Palm oil supply chain management, Market selection, Demand satisfaction,
Optimization
1. INTRODUCTION
FAO ranks Indonesia, Malaysia and Thailand the top three palm oil producing countries in the
world. The increasing demand of palm oil has drawn large-scale plantation development to
these Southeast Asian countries (Sundaram et al., 2004). Many plantations have their own
mill (AOCS Lipid Library, 2013). However, unlike the major producing countries Malaysia
and Indonesia dominated by large estates, plantations in Thailand are managed by
independent smallholder farmers owning less than 50 ha. Fresh fruit brunches (FFB) are
harvested by these smallholder farmers or collectors then transported to crushing mills nearby
to minimize transportation cost. These farmers have no contracts or formal arrangement in
planting and selling FFB to the mills. They act independently from crushing mills. This brings
Proceedings of the 4th International Conference on Engineering, Project, and Production Management (EPPM 2013)
806
Page 2
challenges to palm oil supply chain management in Thailand. Chavananand (2011) talks about
future overview and challenges in Thai palm oil supply chain. Even though smallholder
farming helps distribute income to rural areas a question remain, how much land should be
allocated to what region in the country to satisfy demands of domestic uses (ingredient of
commodity product) and export, what distribution network should be assigned from
plantations to mills to refineries. Research related to Thai smallholder farming in palm oil
supply chain management is rear. Seegraf et al. (2011) studies smallholders plantation in
Thailand and proposes optimization model to specifically manage harvesting practices and
cooperation with mills and middlemen in order to increase the oil content of the fruits. Our
research proposes tools to assist policy makers to make decision regarding the remaining
questions mentioned previously.
2. PALM OIL PRODUCTION
Univanich Palm Oil PCL (2011) presents four factors driving growth of supply and
demand in Thailand as following: 1) Domestic biodiesel policy creating demand, 2) Energy
policies generating new investment opportunities, 3) Irrigation research increasing crop yields,
and 4) Oil palm breeding improving drought tolerance. The same article also mentions that, in
2010, Thailand produces 1,288,000 tons of crude palm oil (CPO) of which is served in several
industries: cooking oil 30%, margarine shortening 5%, biodiesel 35%, food products 17%,
soap products 2%, animal feeds 2%, and exported 9%. Based on a composition chart of the
palm fruit production processes in Muttamara et al. (1987), we present a supply chain of palm
oil production in Figure 1.
On a supply side, plantation area in upstream supply chain produces FFB then transport
to crushing mills and refinery in the midstream. A crushing mill produces crude palm oil
(CPO) and crude palm kernel oil (CPK), and fat acid as by-product.
Figure 1: Palm oil production process from upstream to downstream supply chain.
(Suksa-ard and Raweewan, in press)
Plantations
Collectors
Mills Fresh fruit
bunch - FFB
Crude palm kernel oil – PKO or CPK
Crude palm oil - CPO
Refineries
Refined Bleached Deodorized
Oil Palm – RBD PO
Fractionation
Refined Bleached Deodorized
Olein – RBD Olein
Refined Bleached Deodorized
Stearin – RBD stearin
Fat acid
Proceedings of the 4th International Conference on Engineering, Project, and Production Management (EPPM 2013)
807
Page 3
Figure 2: Distribution network from plantation to commodity product and export market.
(Suksa-ard and Raweewan, in press)
Table 1: Mixture of palm oil products to produced one unit of commodity products. (Suksa-ard and Raweewan, in press)
Commodity
Product
Mixture to produce one unit of
commodity product Description
Olein Stearin RPO CPO CPK
Cooking Oil 50% - - - - 50% of one unit of cooking oil is
palm olein
Margarine - 10% 60% - 30% 10%, 60%, and 30% of magarine is
stearin, RPO, and CPK, respectively
Food products - - 100% 100% 100% Purely or mixed use RPO, CPO, or
CPK
Soap products - 40% - 40% 10% 40%, 40%, and 10% of soap is
stearin, CPO, and CPK, respectively
Animal Feed - 10% - - - One unit of animal feed uses 10% of
stearin.
Biodiesel - - - 114% - 100% of biodiesel will use CPO
114% as raw material to produce
Export - - - 100% 100% Use either CPO or CPK
A refinery produces refined bleached deodorized oil palm (RBD PO or RPO) from CPO then
part of RPO will be used in fractionation to produce olein and stearin. These palm oil products,
as supply side, will be sold to prospective industry to produce commodity product and export
on the demand side. See Figure 2. These oils (CPO, CPK, RPO, palm olein, and palm stearin)
are ingredient of commodity product. To produce one unit of each commodity product, these
oils are used and mixed in different ratio presented in Table 1. The information is obtained
from Department of Agricultural Extension of Thailand (2013).
Proceedings of the 4th International Conference on Engineering, Project, and Production Management (EPPM 2013)
808
Page 4
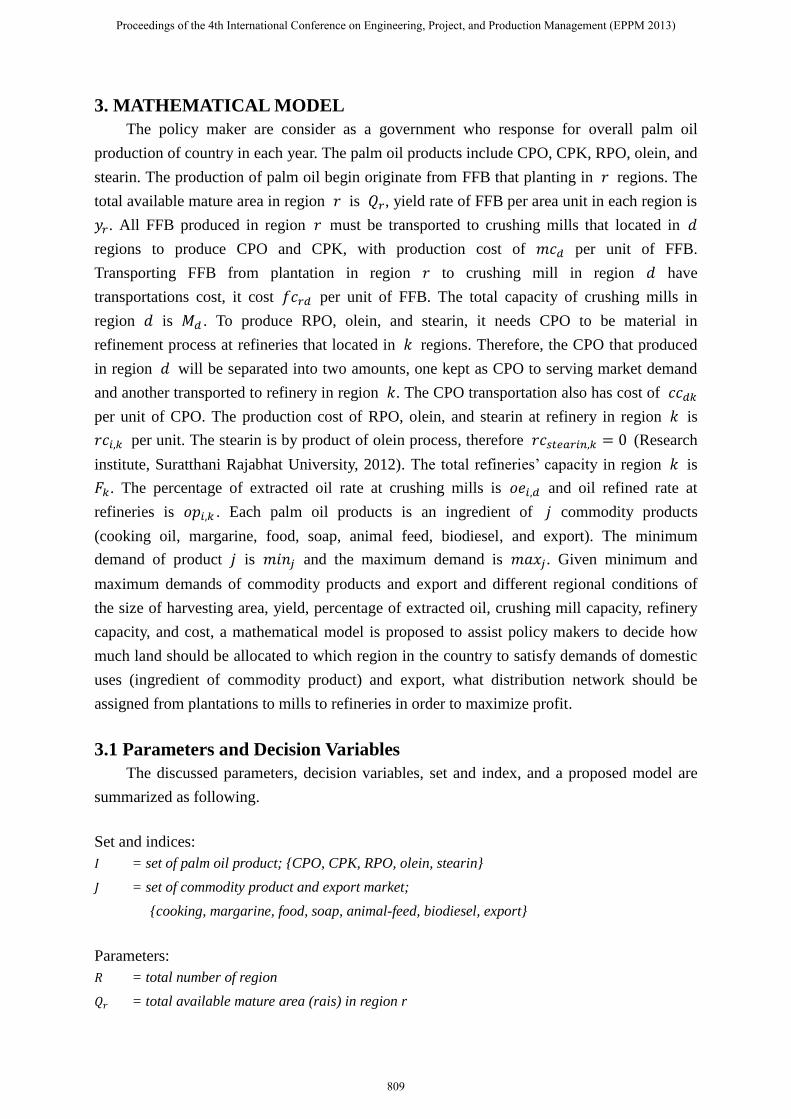
3. MATHEMATICAL MODEL
The policy maker are consider as a government who response for overall palm oil
production of country in each year. The palm oil products include CPO, CPK, RPO, olein, and
stearin. The production of palm oil begin originate from FFB that planting in regions. The
total available mature area in region is , yield rate of FFB per area unit in each region is
. All FFB produced in region must be transported to crushing mills that located in
regions to produce CPO and CPK, with production cost of per unit of FFB.
Transporting FFB from plantation in region to crushing mill in region have
transportations cost, it cost per unit of FFB. The total capacity of crushing mills in
region is . To produce RPO, olein, and stearin, it needs CPO to be material in
refinement process at refineries that located in regions. Therefore, the CPO that produced
in region will be separated into two amounts, one kept as CPO to serving market demand
and another transported to refinery in region . The CPO transportation also has cost of
per unit of CPO. The production cost of RPO, olein, and stearin at refinery in region is
per unit. The stearin is by product of olein process, therefore (Research
institute, Suratthani Rajabhat University, 2012). The total refineries’ capacity in region is
. The percentage of extracted oil rate at crushing mills is and oil refined rate at
refineries is . Each palm oil products is an ingredient of commodity products
(cooking oil, margarine, food, soap, animal feed, biodiesel, and export). The minimum
demand of product is and the maximum demand is . Given minimum and
maximum demands of commodity products and export and different regional conditions of
the size of harvesting area, yield, percentage of extracted oil, crushing mill capacity, refinery
capacity, and cost, a mathematical model is proposed to assist policy makers to decide how
much land should be allocated to which region in the country to satisfy demands of domestic
uses (ingredient of commodity product) and export, what distribution network should be
assigned from plantations to mills to refineries in order to maximize profit.
3.1 Parameters and Decision Variables
The discussed parameters, decision variables, set and index, and a proposed model are
summarized as following.
Set and indices:
= set of palm oil product; {CPO, CPK, RPO, olein, stearin}
= set of commodity product and export market;
{cooking, margarine, food, soap, animal-feed, biodiesel, export}
Parameters:
= total number of region
= total available mature area (rais) in region r
Proceedings of the 4th International Conference on Engineering, Project, and Production Management (EPPM 2013)
809
Page 5
= yield (tons) per area unit in region r
= mill’s capacity (tons) per year at mill in region d
= refinery’s capacity (tons) per year at refinery in region k
= minimum demand (tons) of commodity product j
= maximum demand (tons) of commodity product j
= oil extraction rate (%) of palm oil product i at mill in region d
= oil refined rate (%) of palm oil product i at refinery in region k
= FFB purchasing cost (baht) per unit in region r
= transportations cost (baht) per unit of FFB from plantation in region r to mill in region d
= transportations cost (baht) per unit of CPO from mill in region d to refinery in region k
= mill cost (baht) per unit of FFB for produce CPO & CPK from FFB in region d
= production cost (baht) of palm oil product i at refinery in region k
= proportion (%) of palm oil product i to produce one unit of commodity product j
= selling price (baht) per unit of palm oil product i
Decision variables:
= required land size (rais) for plantation in region r
= amount of FFB (tons) transported from plantation region r to mill in region d
= amount of CPO (tons) transported from mill in region d to refinery in region k
= supply of CPO (tons) in region d
= amount of CPO (tons) for produce RPO in region k
= amount of CPO (tons) for produce olein and stearin in region k
= amount of palm oil product i (tons) to supply production of commodity product j
= amount of commodity product j (tons) to supply the demand
3.2 Mathematical Programming Model
The mathematical model to make the optimal decision on land allocation, satisfying
demand, distribution network, and market selection to maximize profit is constructed as
follows.
(1)
Subject to;
(2)
(3)
Proceedings of the 4th International Conference on Engineering, Project, and Production Management (EPPM 2013)
810
Page 6
(4)
(5)
(6)
(7)
(8)
(9)
(10)
(11)
(12)
(13)
(14)
(15)
, , , , , , (16)
Equation (1) represents the objective function, which aim to maximize profit of selling palm
oil products to satisfy commodity products’ demand. The profit is the difference between total
revenue from selling palm oil products and total costs, including total FFB purchasing cost,
total transportation costs of FFB and CPO, total production cost of palm oil product (CPO,
CPK, RPO, olein, and stearin) at crushing mill and refinery cost. Constraint (2) limits the
required land size for plantation not to exceed the total available area in each region.
Constraint (3) states that the amount of FFB transported from region to crushing mills in
region will be less than or equal to amount of FFB produced in plantation in region ,
defined by the term . Constraint (4) states that the amount of FFB transported from
plantation in region to crushing mills in region would not be more than the mill’s
capacity. Constraint (5) explains that CPO produced from FFB at crushing mills in region
is separated into two amounts – one is kept as CPO and the other is transported to refineries in
region . Constraint (6) limits amount of CPO transported from mill in every regions to
Proceedings of the 4th International Conference on Engineering, Project, and Production Management (EPPM 2013)
811
Page 7
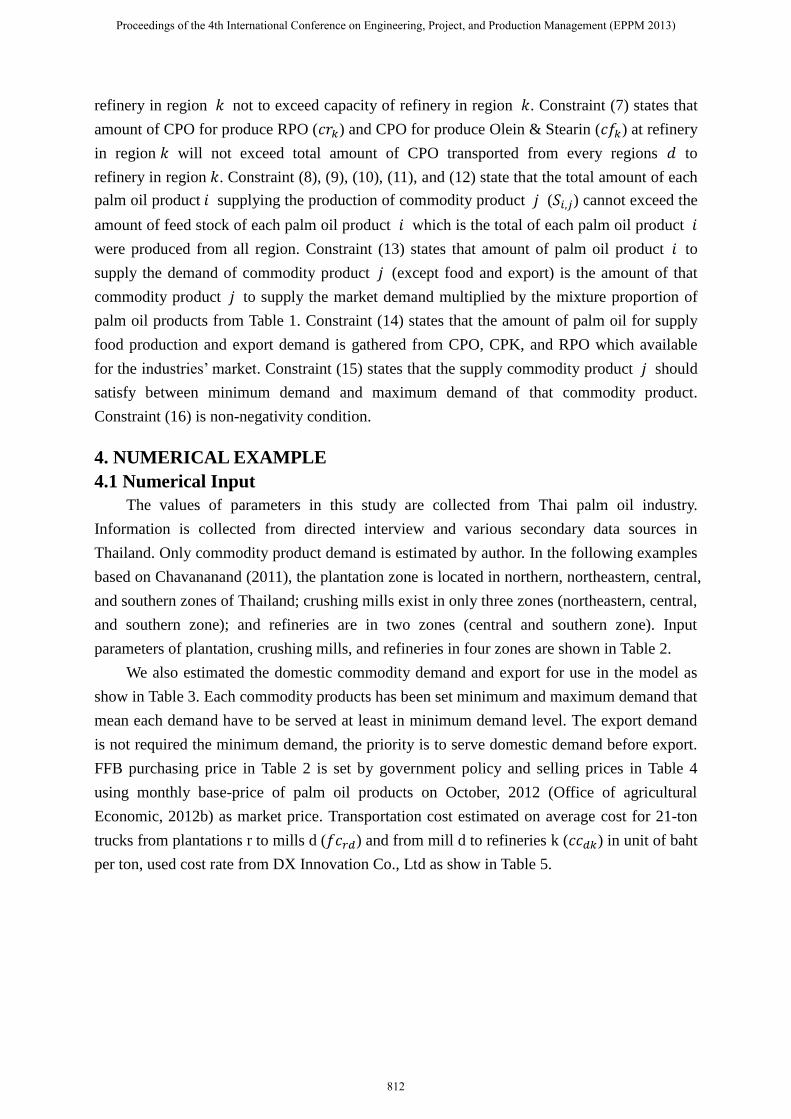
refinery in region not to exceed capacity of refinery in region . Constraint (7) states that
amount of CPO for produce RPO ( ) and CPO for produce Olein & Stearin ( ) at refinery
in region will not exceed total amount of CPO transported from every regions to
refinery in region . Constraint (8), (9), (10), (11), and (12) state that the total amount of each
palm oil product supplying the production of commodity product ( ) cannot exceed the
amount of feed stock of each palm oil product which is the total of each palm oil product
were produced from all region. Constraint (13) states that amount of palm oil product to
supply the demand of commodity product (except food and export) is the amount of that
commodity product to supply the market demand multiplied by the mixture proportion of
palm oil products from Table 1. Constraint (14) states that the amount of palm oil for supply
food production and export demand is gathered from CPO, CPK, and RPO which available
for the industries’ market. Constraint (15) states that the supply commodity product should
satisfy between minimum demand and maximum demand of that commodity product.
Constraint (16) is non-negativity condition.
4. NUMERICAL EXAMPLE
4.1 Numerical Input
The values of parameters in this study are collected from Thai palm oil industry.
Information is collected from directed interview and various secondary data sources in
Thailand. Only commodity product demand is estimated by author. In the following examples
based on Chavananand (2011), the plantation zone is located in northern, northeastern, central,
and southern zones of Thailand; crushing mills exist in only three zones (northeastern, central,
and southern zone); and refineries are in two zones (central and southern zone). Input
parameters of plantation, crushing mills, and refineries in four zones are shown in Table 2.
We also estimated the domestic commodity demand and export for use in the model as
show in Table 3. Each commodity products has been set minimum and maximum demand that
mean each demand have to be served at least in minimum demand level. The export demand
is not required the minimum demand, the priority is to serve domestic demand before export.
FFB purchasing price in Table 2 is set by government policy and selling prices in Table 4
using monthly base-price of palm oil products on October, 2012 (Office of agricultural
Economic, 2012b) as market price. Transportation cost estimated on average cost for 21-ton
trucks from plantations r to mills d ( ) and from mill d to refineries k ( ) in unit of baht
per ton, used cost rate from DX Innovation Co., Ltd as show in Table 5.
Proceedings of the 4th International Conference on Engineering, Project, and Production Management (EPPM 2013)
812
Page 8
Table 2: Numerical input.
Factors Unit North
(1)
Northeast
(2)
Central
(3)
South
(4)
Mature area1 rai 18,326 75,598 735,127 3,446,530
Yield1 ton/rai 0.576 1.334 1.557 2.922
FFB cost2 Baht/ton 4,100 4,100 4,100 4,100
Mills’ Cap.4 ton/year N/A 144,000 1,418,400 18,676,800
OER for CPO5 % of FFB N/A 17% 17% 17%
OER for CPK5 % of FFB N/A 5% 5% 5%
Mills’ cost3 Baht/ton N/A 500 500 500
Refineries’ Cap.4 ton CPO/year N/A N/A 1,975,500 90,000
Refined rate of RPO5 % of CPO N/A N/A 93% 93%
Refined rate of Olein5 % of CPO N/A N/A 66% 66%
Refined rate of Stearin5 % of CPO N/A N/A 29% 29%
Refineries’ cost5 Baht/ton CPO N/A N/A 1,500 1,500
Olein production cost5 Baht/ton olein N/A N/A 2,500 2,500
Stearin production cost5 Baht/ton stearin N/A N/A 0 0
N/A = no mills or refineries in the region, 6.25 rai = 1 ha.
1 Office of Agricultural Economics, 2012a.
2 Office of Agricultural Economics, 2012b.
3 Direct interview of crushing mill managers.
4 Chavananand , 2011
5 Research institute, Suratthani Rajabhat University, 2012
Table 3: Commodity demand (ton/year)
Demand Cooking
Oil Margarine
Food
Industry
Soap
Industry
Animal
Feed Biodiesel Export
Minimum1 500,000 100,000 100,000 400,000 50,000 500,000 0
Maximum1 1,000,000 300,000 200,000 800,000 100,000 1,650,000 820,000
1Estimated by author.
Table 4: Selling price of palm oil product (baht/ton)
CPO CPK RPO Olein Stearin
27,810 27,870 28,530 28,950 26,580
Proceedings of the 4th International Conference on Engineering, Project, and Production Management (EPPM 2013)
813
Page 9
Table 5: Transportation cost (baht/ton)
To
From
North
(1)
Northeast
(2)
Central
(3)
South
(4)
North (1) N/A 372 384 652
Northeast (2) N/A 182 391 712
Central (3) N/A 391 174 425
South (4) N/A 712 425 175
N/A = no mills in the region
4.2 Result
The optimization models were written in IBM ILOG CPLEX. Numerical result of
discussed in formation shows the optimal supply chain and following result. Table 6 shows
that the maximum profit is 12,354.460 million baht per year or gain profit 18%. The largest
cost is FFB purchasing cost that contributed 67.6%. Transportation cost, mills cost, and
refineries cost contributed 3.2%, 8.2%, and 3.0% respectively. Table 7 shows the demand of
cooking oil and biodiesel are satisfied in between minimum demand and maximum demand
while demand of margarine, soap, and animal feed are only met at the minimum level and
demand of food and export are met at the maximum level. The calculation of serving unit of
commodity products by using palm oil product is referred to the mixture rate in Table1. The
total supply of CPO, CPK, RPO, olein, and stearin are 1,257.584 kilotons, 566.337 kilotons,
60 kilotons, 398.276 kilotons, and 175 kilotons respectively. Table 8 shows production region
of each palm oil products and required plantation area. Plantation area in every region is fully
used to produce FFB to served palm oil production and all palm oil products is used to serve
the commodity product demand. This shows that current plantation area is not enough to
satisfy the increasing demand in the future.
Table 6: Maximum profit and percentage of profit and cost
Revenue & Cost Million Baht Percent
Total Revenue 68,650.640 100.0%
Total FFB purchasing cost 46,439.703 67.6%
Total FFB transportation cost 1,983.950 2.9%
Total CPO transportation cost 211.512 0.3%
Total Mills cost 5,663.378 8.2%
Total Refineries cost 1,997.637 3.0%
Total Profit (Maximum) 12,354.460 18.0%
Proceedings of the 4th International Conference on Engineering, Project, and Production Management (EPPM 2013)
814
Page 10
Table 7: Supply of palm oil product to commodity product and supply quantity of commodity
products (kton)
Commodity
Products
Supply of palm oil product to commodity product Supply quantity
(Min / Supply / Max) CPO CPK RPO Olein Stearin
Cooking Oil 0 0 0 398.276 0 500 / 796.552 / 1,000
Margarine 0 30.000 60.000 0 10.000 100 / 100 / 300
Food 200.000 0 0 0 0 100 / 200 /200
Soap 160.000 40.000 0 0 160.000 400 / 400 / 800
Animal Feed 0 0 0 0 5.000 50 / 50 /100
Biodiesel 573.922 0 0 0 0 500 / 503.440 / 1,650
Export 323.662 496.337 0 0 0 0 / 820 / 820
Total 1,257.584 566.337 60.000 398.276 175.000
Table 8: Required area and amount of palm oil production by region.
Regions Required
area(rais)
Amount of palm oil production (kton)
FFB CPO CPK RPO Olein Stearin
North (1) 18,326 10.556 N/A N/A N/A N/A N/A
Northeast (2) 75,598 100.848 0 5.042 N/A N/A N/A
Central (3) 735,127 1,144.593 0 57.757 0 381.457 167.610
South (4) 3,446,530 10,070.761 1,257.584 503.538 60.000 16.819 7.390
Total 4,275,581 11,326.758 1,257.584 566.337 60.000 398.276 175.000
Table 9: Amount of FFB and CPO distributed from plantations to crushing mills and
from crushing mills to refineries in each region.
To
From
Transportation of FFB Transportation of CPO
North
(1)
North-
east (2)
Central
(3)
South
(4)
North
(1)
North-
east(2)
Central
(3)
South
(4)
North (1) N/A 0 10.556 0 N/A N/A N/A N/A
Northeast (2) N/A 100.848 0 0 N/A N/A 17.144 0
Central (3) N/A 0 1,144.593 0 N/A N/A 196.375 0
South (4) N/A 0 0 10,070.761 N/A N/A 364.445 90.000
Total N/A 100.848 1,155.149 10,070.761 N/A N/A 577.964 90.000
Proceedings of the 4th International Conference on Engineering, Project, and Production Management (EPPM 2013)
815
Page 11
Table 9 show transportation networks and amount of FFB and CPO distributed form
plantation to crushing mills and from crushing mills to refinery. FFB 10.556 kilotons from
plantation in northern region and 1,144.593 kilotons in central region are transported to
crushing mills in the central regions. 100.848 kilotons of FFB harvested in the northeastern
region is sent to crushing mills in the same region. FFB in the southern zone 10,070.761
kilotons is transported to the same region. All FFB is use to for CPO and CPK production at
crushing mills. CPOs from three zones is sent to be refined in the next process. One amount
of CPO is kept to serve CPO demand; the rest is transported to refineries to produce refined
oils (RPO, olein, and stearin). The amount of 17.144 kilotons of CPO in the northern region,
196.375 kilotons of CPO in the central region, and 364.445 kilotons of CPO in southern
region are sent to refinery in central region while another 90 kilotons of CPO in southern
region is sent to refinery in the same region. This shows that the refinery in southern region
have not enough capacity to handle amount of CPO for produce refined oil in the same region
while refinery in southern region and crushing mills in every region have residual capacity to
handle palm oil production. The overall discussed result is summarized and illustrated in
Figure 3.
This numerical example shows that the current palm oil supply chain situation can
only handle the current commodity demand and export level. If these demand increased, there
is not enough plantation area to supply FFB. The current crushing mills’ utilization is only 56%
that mean we have enough crushing mills’ capacity to handle FFB in CPO and CPK
production process. The largest of CPO production is in southern region, but the refinery’s
capacity to handle the amount of CPO for refined oil production in the same region is not
enough. Therefore the CPO for refined oil production has to transport to refineries in central
region that increase the CPO transportation cost.
Figure 3: Numerical output; profit & distribution from plantation to mills to refineries to
commodity markets and export (kiloton).
Proceedings of the 4th International Conference on Engineering, Project, and Production Management (EPPM 2013)
816
Page 12
5. CONCLUSION AND FUTURE RESEARCH
A methodology has been proposed that policy makers need quantitative tools to assist in
making decision regarding plantation allocation, market allocation, and distribution network
planning. This research explores such tools determining how much land should be allocated to
what region in the country to satisfy demands of domestic uses (ingredient of commodity
product) and export, what distribution network should be assigned from plantations to mills to
refineries in order to maximize profit in the management. Our future work will explore when
stock is utilized in distribution network from mills to refineries and from refineries to
commodity market.
ACKNOWLEDGMENT
This work was supported by the National Research University Project of Thailand Office
of Higher Education Commission.
REFERENCES
AOCS Lipid Library (2013) Oils and Fats in the market place: Commodity oils and fats-Palm
oil. http://lipidlibrary.aocs.org/market/palmoil.htm
Chavananand, K. (2011) Future of the Thai Palm Oil Industry. Paper Presented at: Palmex
Thailand 2011 Conference, IMPACT, Bangkok.
Department of Agricultural Extension (2013) Palm oil downstream industries product.
http://k-center.doae.go.th/getKnowledge.jsp?id=234
Office of Agricultural Economics (2012a) Agricultural Statistics of Thailand 2102, The
Agricultural Cooperative Federation of Thailand, Thailand.
Office of agricultural Economic (2012b) Weekly production and marketing situation: Oct. 29,
2012-Nov. 4, 2012. http://www.oae.go.th/ewt_news.php?nid=13697
Research institute, Suratthani Rajabhat University (2012) Oil palm supply chain, Suratthani.
Publication report in Thailand Research Expo 2012, Bangkok
Seegräf, M., May, D., Breuer, T. and Schukat, P. (2010) Palm Oil – sustainability is possible!
Promotion and certification of smallholders helps sustainable palm oil production,
publication on behalf of GTZ and Federal Ministry for the Environment, Nature
Conservation and Nuclear Safety of the Federal Republic of Germany.
Suksa-ard, Chatchai and Morrakot Raweewan (In Press) Optimization of Supply and Demand
Balance in Palm Oil Supply Chain, Thammasat International Journal of Science and
Technology.
Sundaram, J. K., Chang, Y. T. and Khoo, K. J. (2004) Deforesting Malaysia: the political
economy and social ecology of agricultural expansion and commercial logging, Zed
Books in association with United Nations Research Institute for Social Development.
Proceedings of the 4th International Conference on Engineering, Project, and Production Management (EPPM 2013)
817
Page 13
Univanich Palm Oil PCL (2011) Palm Oil Practices in Thailand, Paper Presentated at: Thai
Philippines Congress, 24-25 August 2100.
Proceedings of the 4th International Conference on Engineering, Project, and Production Management (EPPM 2013)
818