Markets for Value added Tilapia Products Kevin Fitzsimmons, Ph.D. Professor, University of Arizona Vice President, American Tilapia Association President, World Aquaculture Society Honolulu March, 2004
Transcript
Markets for Value added Tilapia Products
Kevin Fitzsimmons, Ph.D.
Professor, University of Arizona
Vice President, American Tilapia Association
President, World Aquaculture Society
Honolulu
March, 2004
Introduction
Quick review of tilapiaExplosion in tilapia tradeThe US and International MarketsValue added productsOpportunities to expand markets
Tilapia productionCurrently second in volume to carpsPrediction: Tilapia will become most
important aquaculture crop in this centuryWidest demand, no religious/cultural
concerns, few environmental concernsMore genetic potentialGreatest variety of production systems
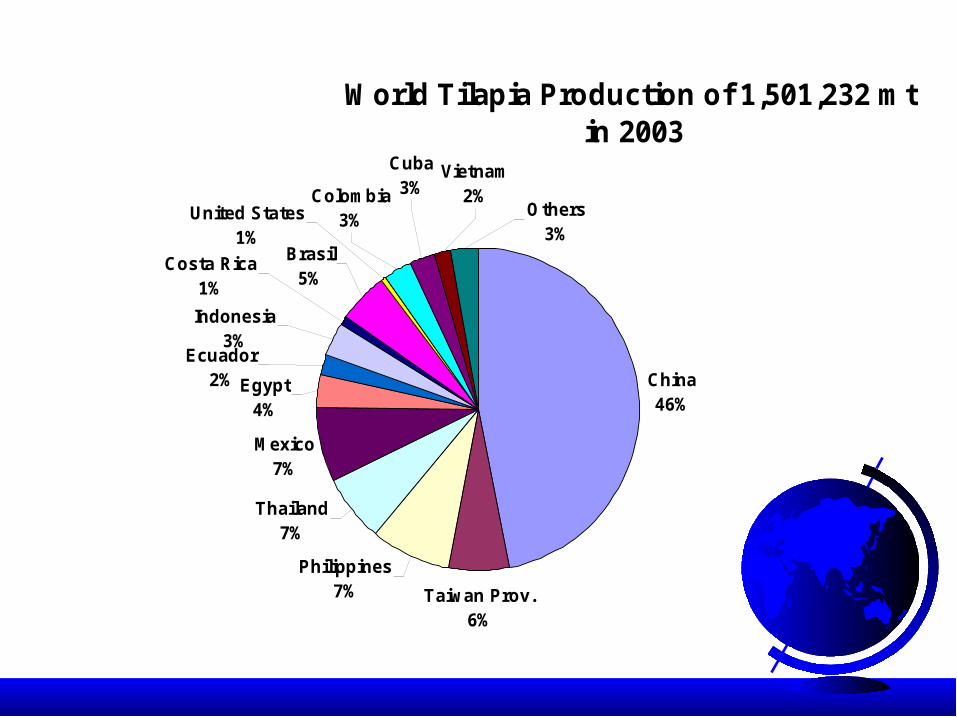
World Tilapia Production of 1,501,232 mt in 2003
China46%
Taiwan Prov.6%
Philippines7%
Thailand7%
Mexico7%
Others3%
Vietnam2%
Indonesia3%
Costa Rica1%
Colombia3%United States
1%Brasil
5%
Egypt4%
Cuba3%
Ecuador2%
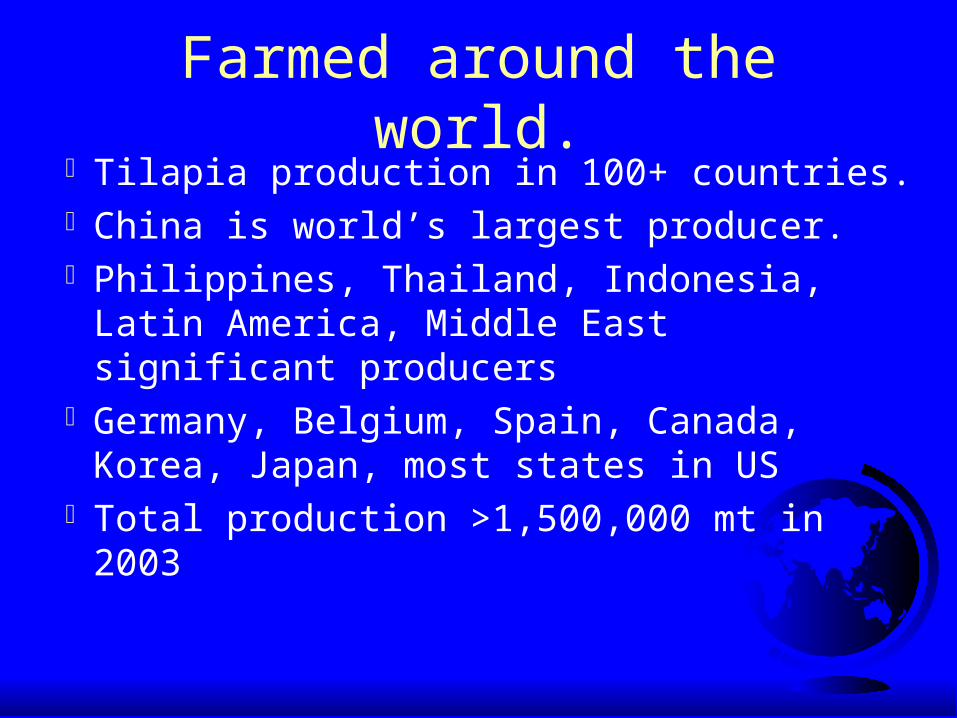
Farmed around the world.Tilapia production in 100+ countries.China is world’s largest producer.Philippines, Thailand, Indonesia, Latin
America, Middle East significant producersGermany, Belgium, Spain, Canada, Korea,
Japan, most states in USTotal production >1,500,000 mt in 2003
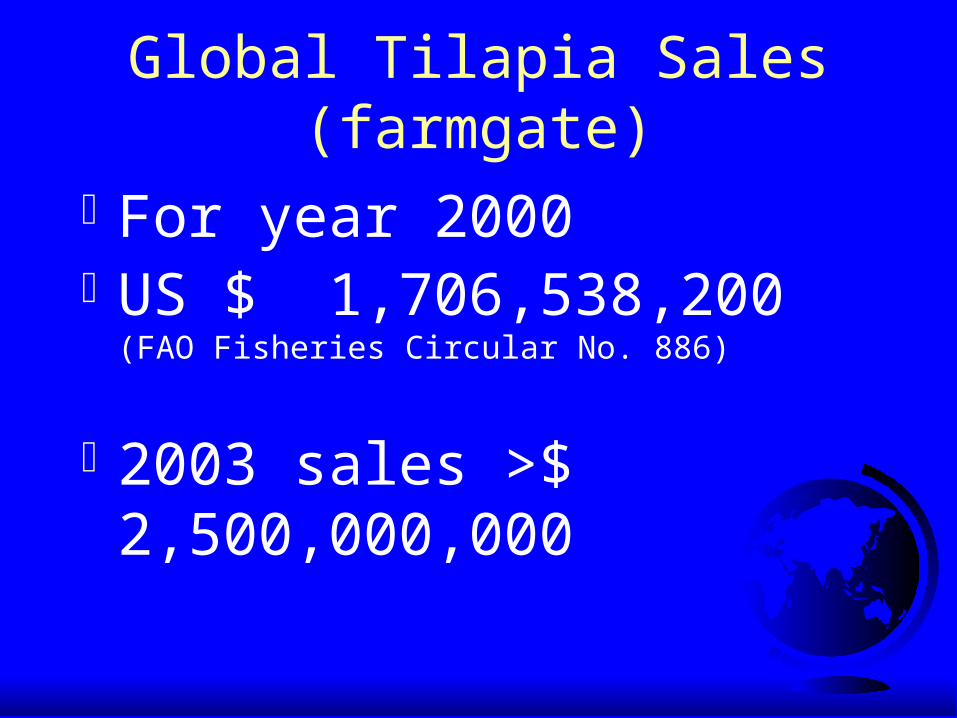
Global Tilapia Sales (farmgate)
For year 2000US $ 1,706,538,200
(FAO Fisheries Circular No. 886)
2003 sales >$ 2,500,000,000
Tilapia - the aquatic chicken
Grows in all kinds of farmsEats all kinds of foodLarge eggs and easy to rear youngLots of ways to prepare the fish
Ponds and cages
Intensive tank culture
Tanks in Arizona
Tanks in California
Raceway SystemsIntensive raceways
Extensive raceways
Intensive farms in buildings in cool climates
Intensive farms with recirculation in greenhouses
Integrated with crop irrigation
How did tilapia get so popular, so fast?
Tilapia - the Perfect Aquaculture Storm
Tilapia widely popular around the world and beyond.
Common names: Tilapia, boulti, mojara, chambo, lou fei, pla nil, St. Peters fish, freshwater and/or red snapper
Used in many cuisine, hundreds of recipes, often replaces over-fished local species
Eggs hatched and fry reared on International Space Station
Established market demandAccepted in many national dishesPopular in many forms (live,
whole, fillets, fresh and frozen, smoked, sashimi, fried skins)
Environmentally correct
Primarily vegetarianMost farm systems cause little pollutionTilapia were long ago established as
exotic species, common food fishGrown mostly in developing countriesFew diseases, essentially no chemicals
used
Research & Development ISTA 6
(Manila, Philippines, Sept 12 -16, 2004) International Symposia on Tilapia in Aquaculture
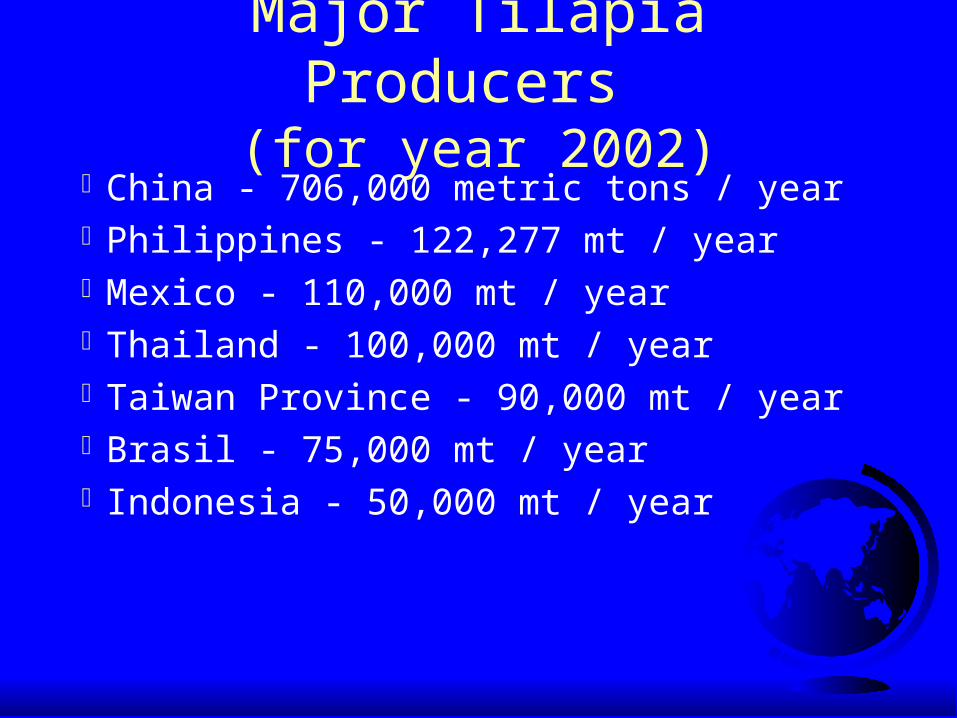
Major Tilapia Producers (for year 2002)
China - 706,000 metric tons / yearPhilippines - 122,277 mt / yearMexico - 110,000 mt / yearThailand - 100,000 mt / yearTaiwan Province - 90,000 mt / yearBrasil - 75,000 mt / year Indonesia - 50,000 mt / year
Mexico - 102,000 mtTilapia-shrimp farm in Sonora
Pond Tilapia farm in Tamaulipas
Brasil - 75,000 mt
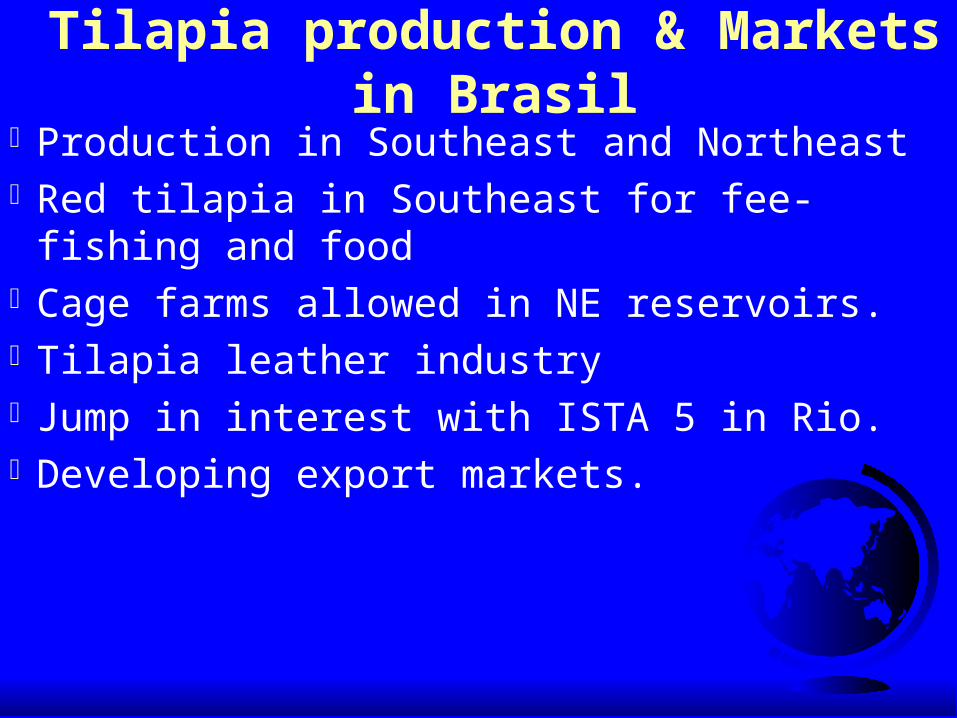
Tilapia production & Markets in Brasil
Production in Southeast and NortheastRed tilapia in Southeast for fee-fishing
and foodCage farms allowed in NE reservoirs.Tilapia leather industryJump in interest with ISTA 5 in Rio.Developing export markets.
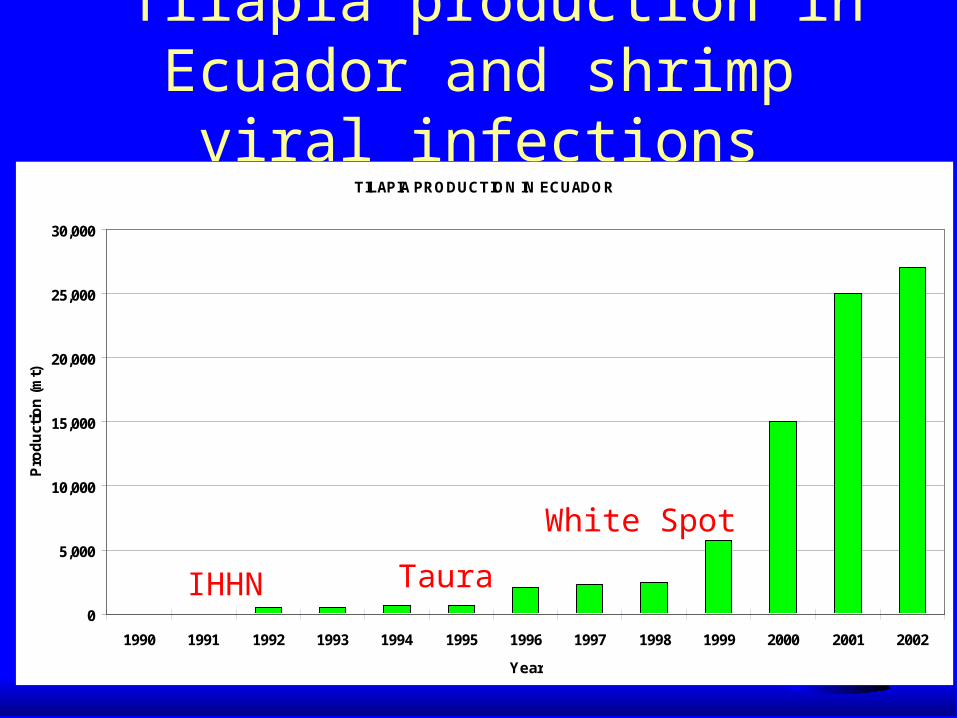
Tilapia production in Ecuador 27,000 mt
Replacing shrimp because of white spot and other shrimp diseases
Using shrimp infrastructureExporting to US and EUBenefits to shrimp culture with
polyculture
Tilapia production in Ecuador and shrimp viral infections
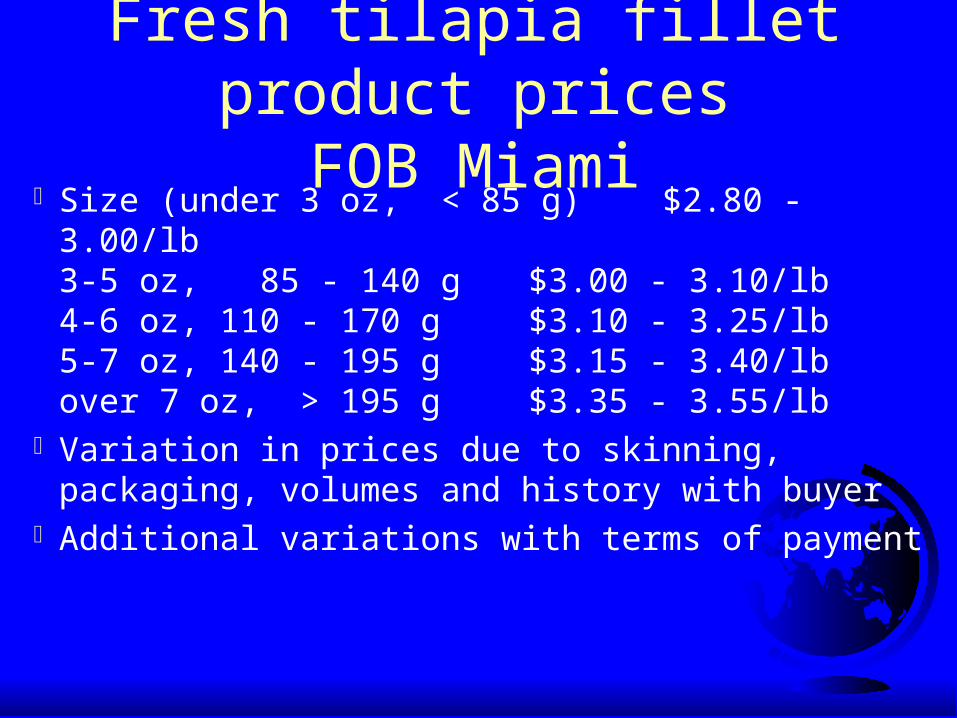
Variation in prices due to skinning, packaging, volumes and history with buyer
Additional variations with terms of payment
Expanding marketsQuality control and assuranceAdvertisingProduct placementEndorsementsNew recipesSubstitute for snapper, bass, flounderNew value added product forms
Quality control and assuranceNational standardsISO and HACCP (Hazard Analysis at
Critical Control Points)
Industry standardsBuyer standardsOther (NGO’s)
Advertising
Direct retail sales
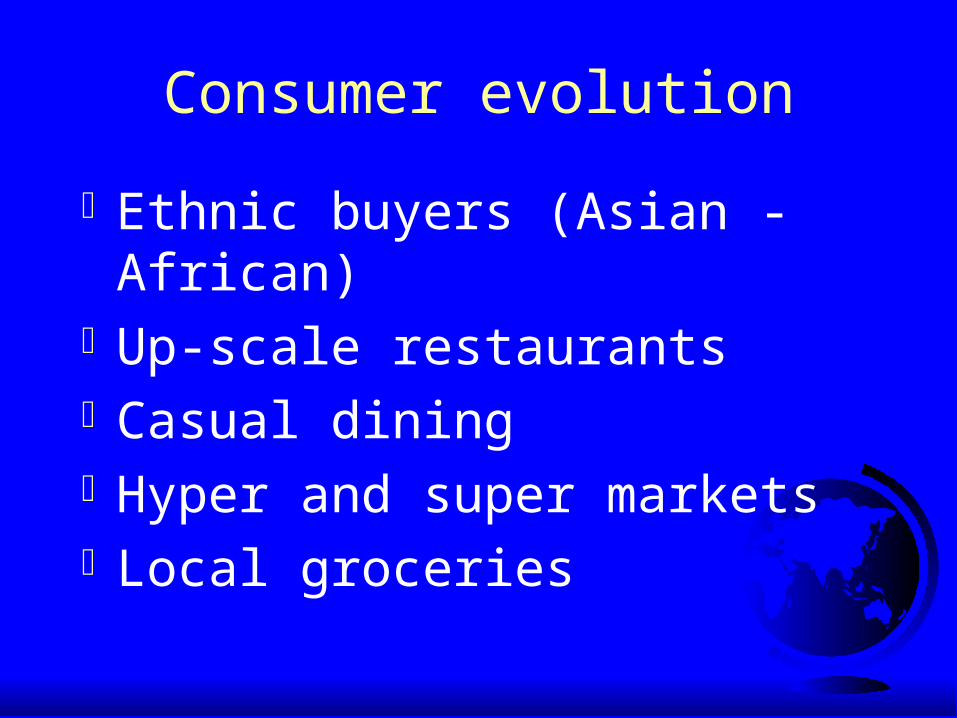
Consumer evolution
Ethnic buyers (Asian - African)Up-scale restaurantsCasual diningHyper and super marketsLocal groceries
Dear Kevin, I recently began using farm raised Tilapia fillets. I buy
these in individual vacuum sealed packages in one pound bags at Wal-Mart. My husband has diabetes and we both are very weight conscious. This fish is the perfect food item for us, I love the way it is packaged, just use what I need for one meal. It is reasonably priced, always available in the market and consistently high quality.
I LOVE THE PRODUCT!!!! Marian Birnie Aug. 12, 2001
Endorsements
New recipes
New recipes
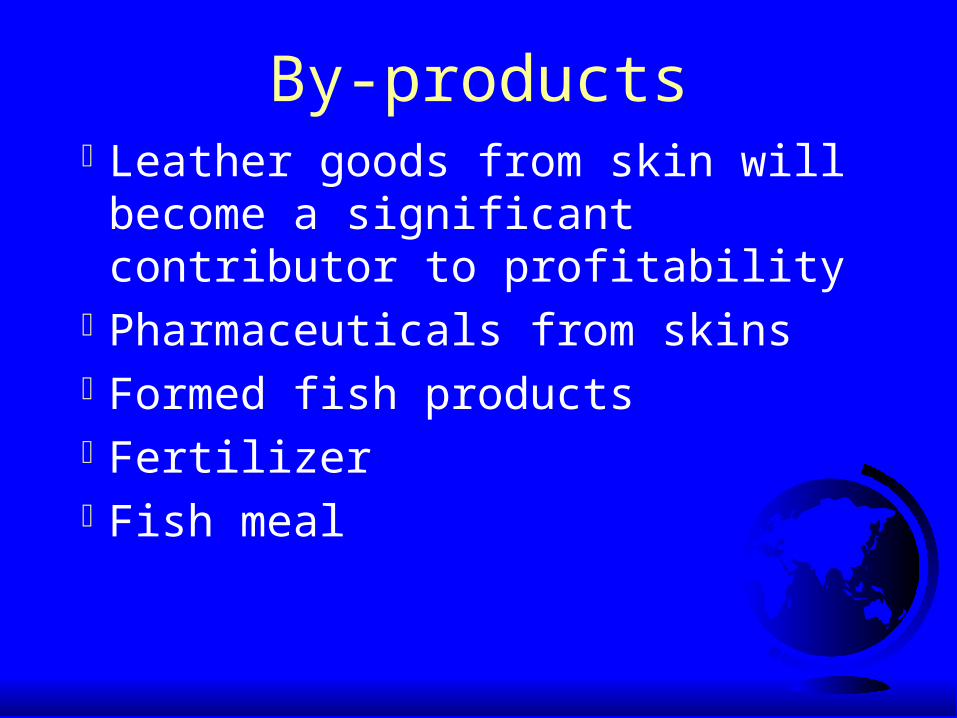
By-productsLeather goods from skin will become a
significant contributor to profitabilityPharmaceuticals from skinsFormed fish productsFertilizerFish meal
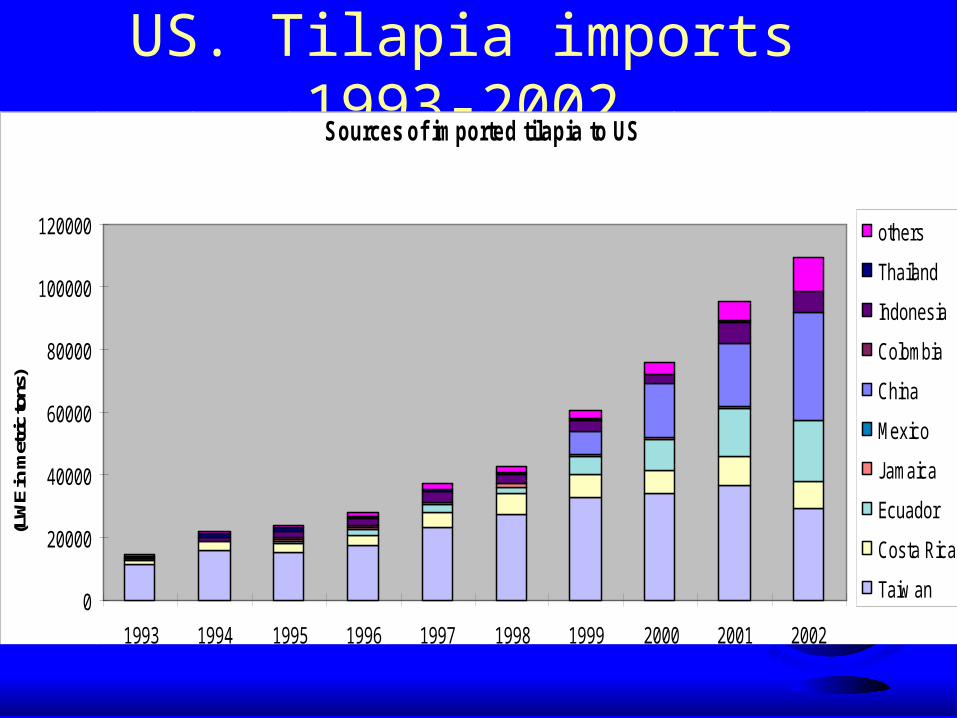
EU / US Supply and Demand TRENDS
Supply of fillets primarily from China, Southeast Asia, South and Central America.
Demand for live fish needs to expand beyond Asian markets
With rapid increases in supply, demand must increase at least as fast to support price.
Major Tilapia Producers in International Trade
China - whole frozen, IQF filletsEcuador - fresh filletsTaiwan - whole, IQF, sashimiSouth & Central America - fresh filletsZimbabwe - Fresh filletsIndonesia - IQF filletsThailand - IQF fillets
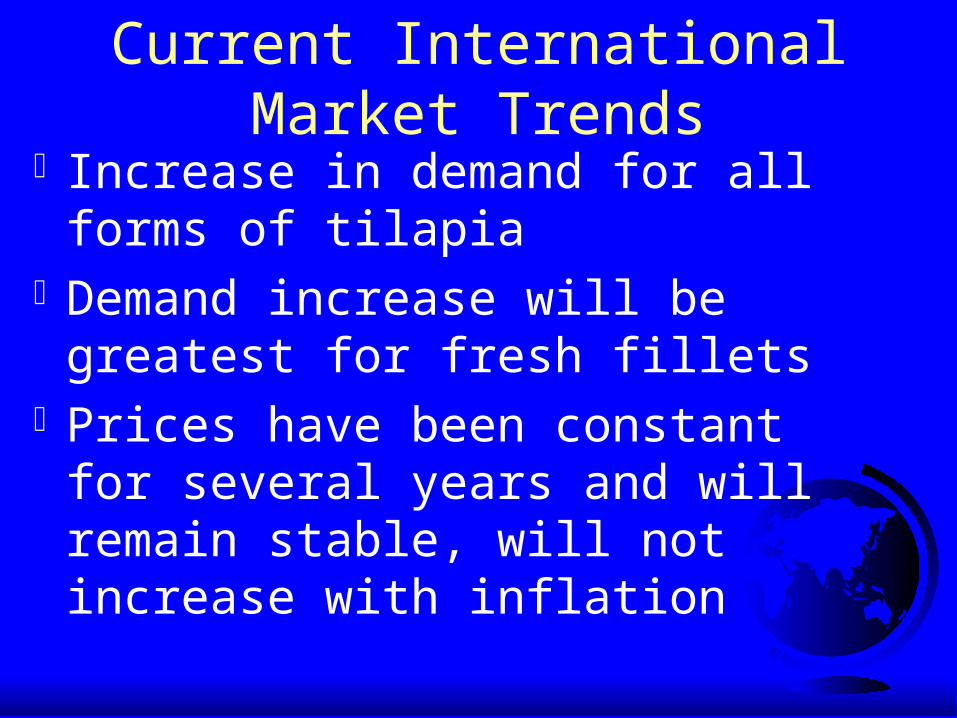
Current International Market Trends
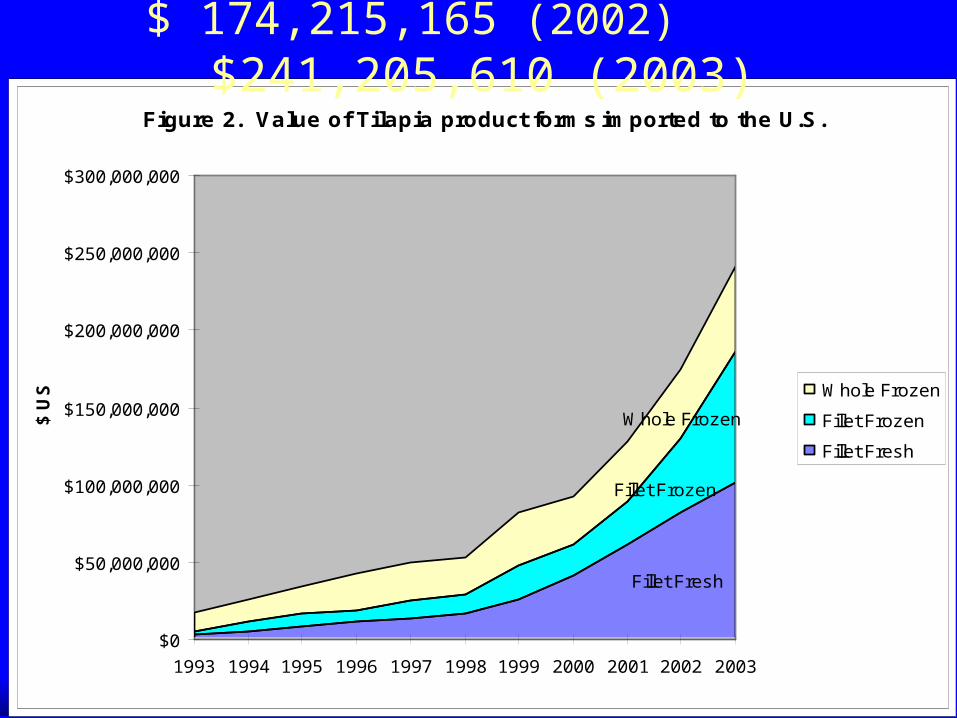
Increase in demand for all forms of tilapia
Demand increase will be greatest for fresh fillets
Prices have been constant for several years and will remain stable, will not increase with inflation
Changes and Predictions
Further intensification in virtually every country
Changes and Predictions
EU / US production will increase slowly, intensifying current production methods
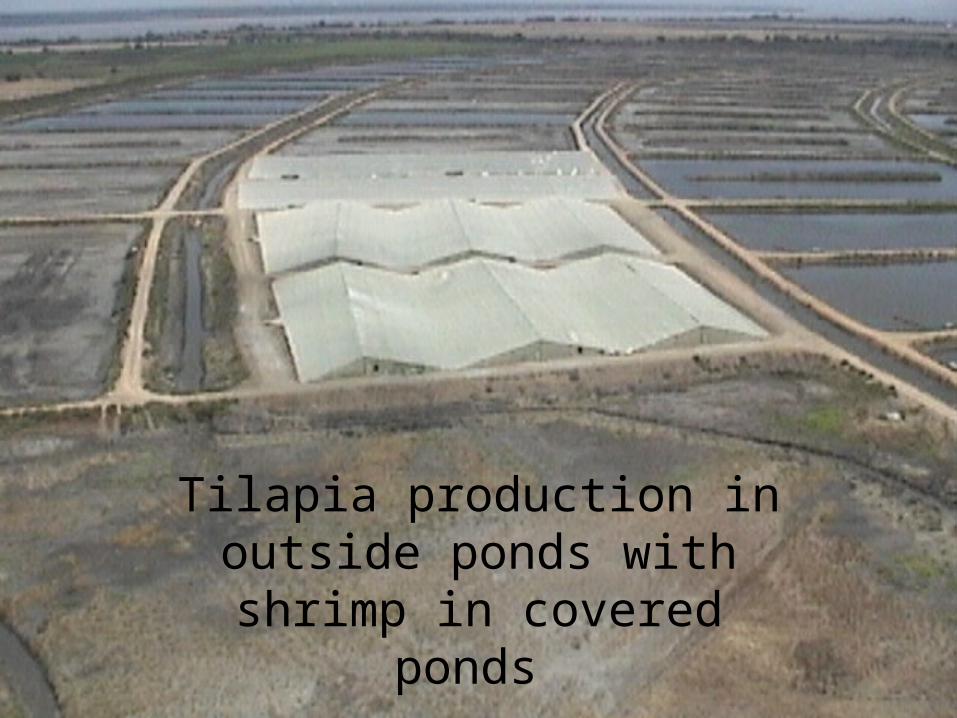
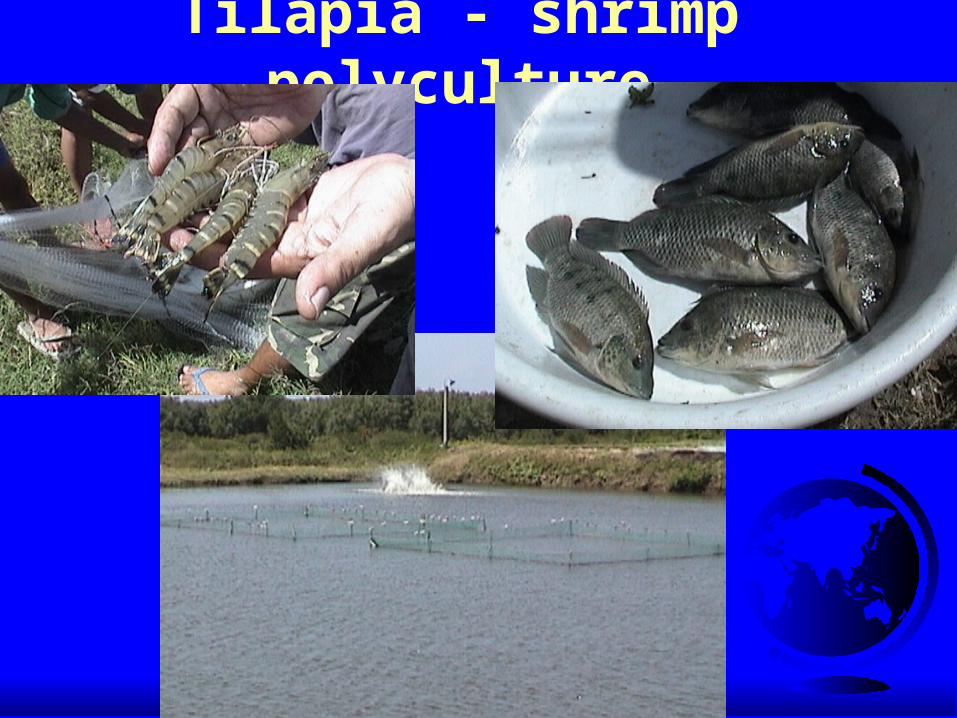
Changes and PredictionsPolyculture with shrimp will
become common in most shrimp farming areas (already practiced in Thailand, Philippines, Mexico, US, Ecuador, Peru, Eritrea)
Tilapia - shrimp polyculture
Changes and Predictions
Production will be 75% Oreochromis niloticus, 20% Red strains, O. aureus and O. mossambicus mostly for hybridization
Changes and Predictions
Production will be 50% intensive ponds, 30% cages, 10% intensive recirculating and tank systems, 10 % other
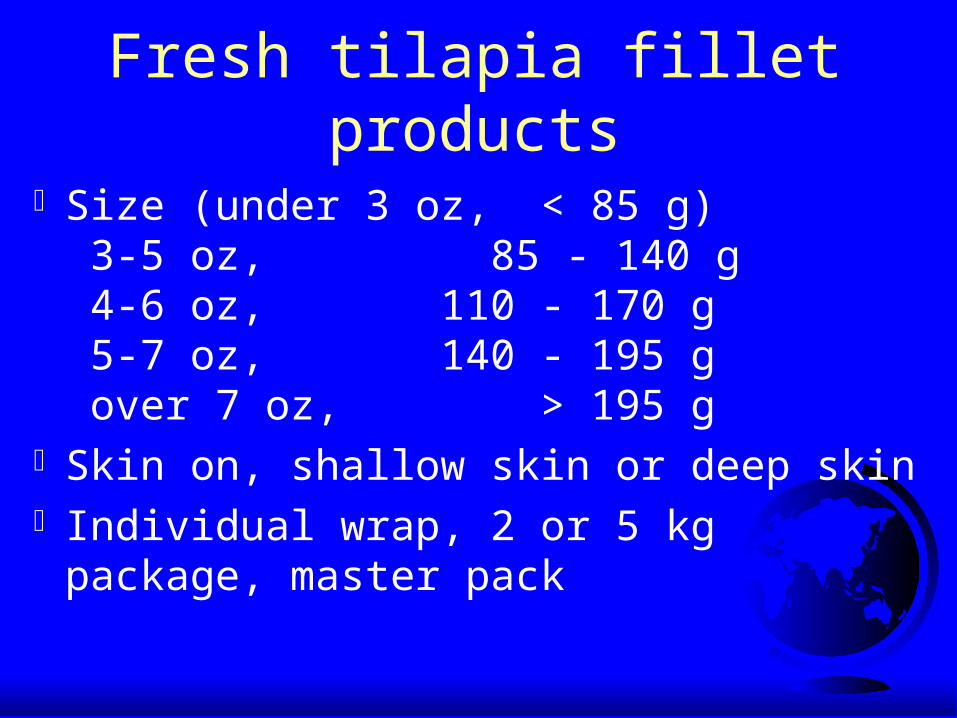
Predictions for Value-added products
Processing and "value-adding" will intensify in producing countries
Sashimi
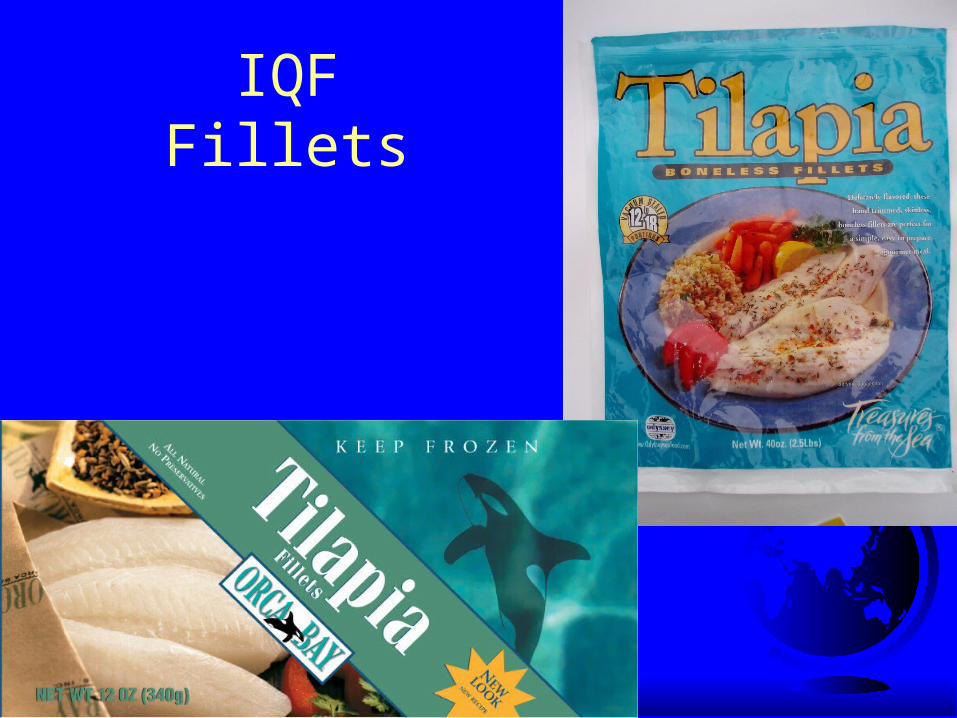
IQF Fillets
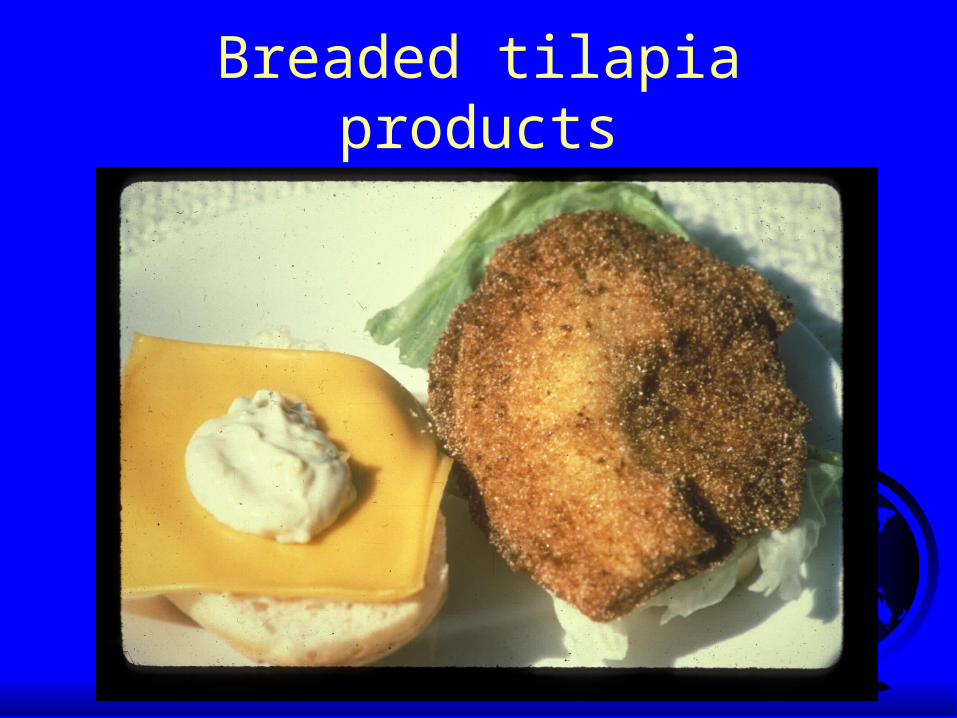
Breaded tilapia products
Fried tilapia skins
Smoked products
Changes and PredictionsMore “organic” forms
Reduction in MT for sex reversal
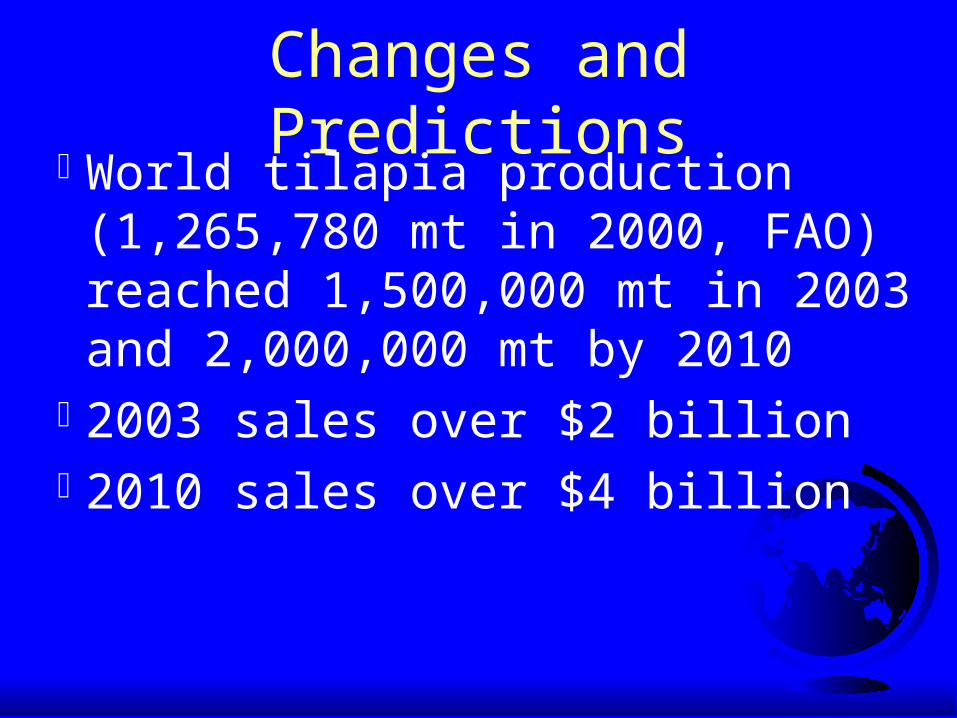
Changes and PredictionsWorld tilapia production (1,265,780
mt in 2000, FAO) reached 1,500,000 mt in 2003 and 2,000,000 mt by 2010
2003 sales over $2 billion 2010 sales over $4 billion
Thank-you ! Questions?
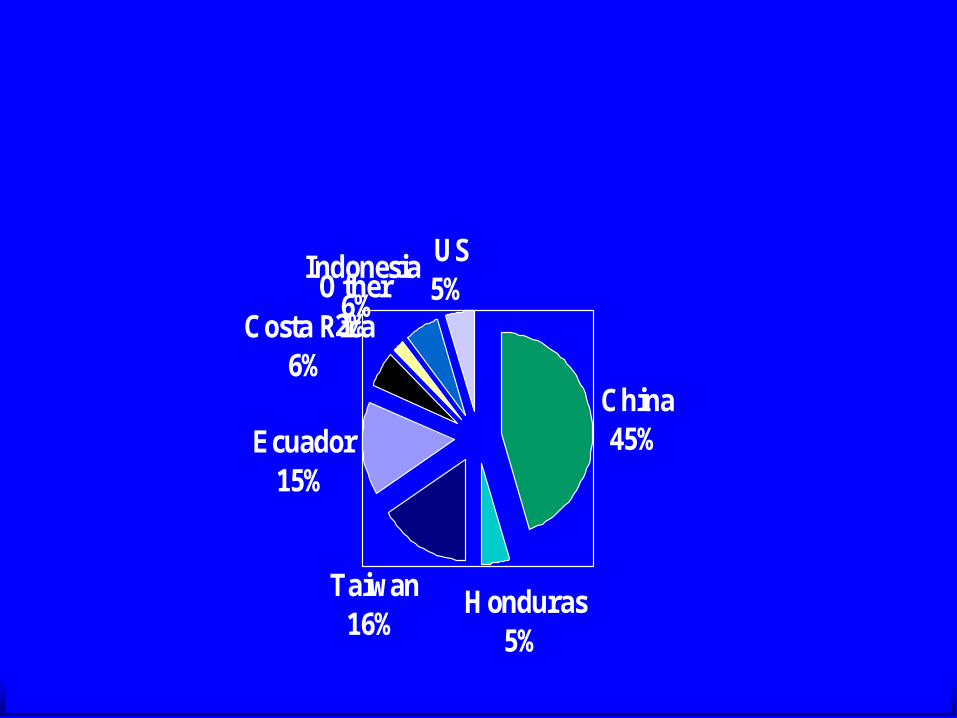
US Tilapia supply (2003)186,551 metric tons (live weight)
CHINA31%
ECUADOR16%
INDONESIA6%
TAIW AN Prov.24%
HONDURAS6% PANAMA
1%
COSTA RICA7%
BRAZIL0%
US7%OTHER
2%
China45%
Honduras5%
Taiwan16%
Ecuador15%
Costa Rica6%
Other2%
Indonesia6%
US5%
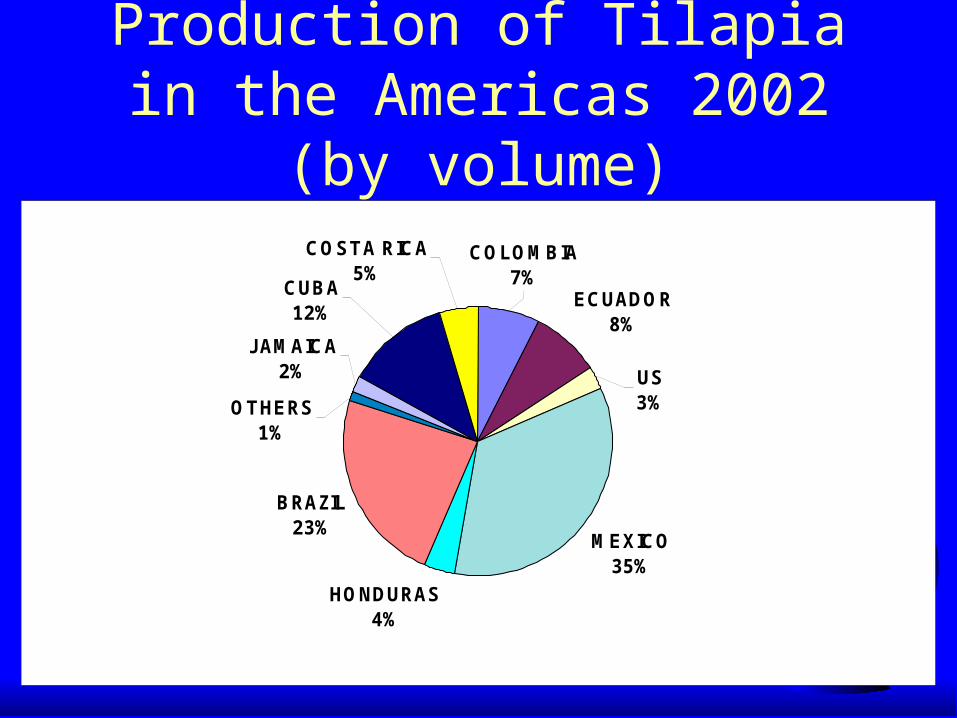
Production of Tilapia in the Americas 2002 (by volume)
ECUADOR8%
MEXICO35%
HONDURAS4%
BRAZIL23%
COSTA RICA5%
CUBA12%
US3%OTHERS
1%
JAMAICA2%
COLOMBIA7%
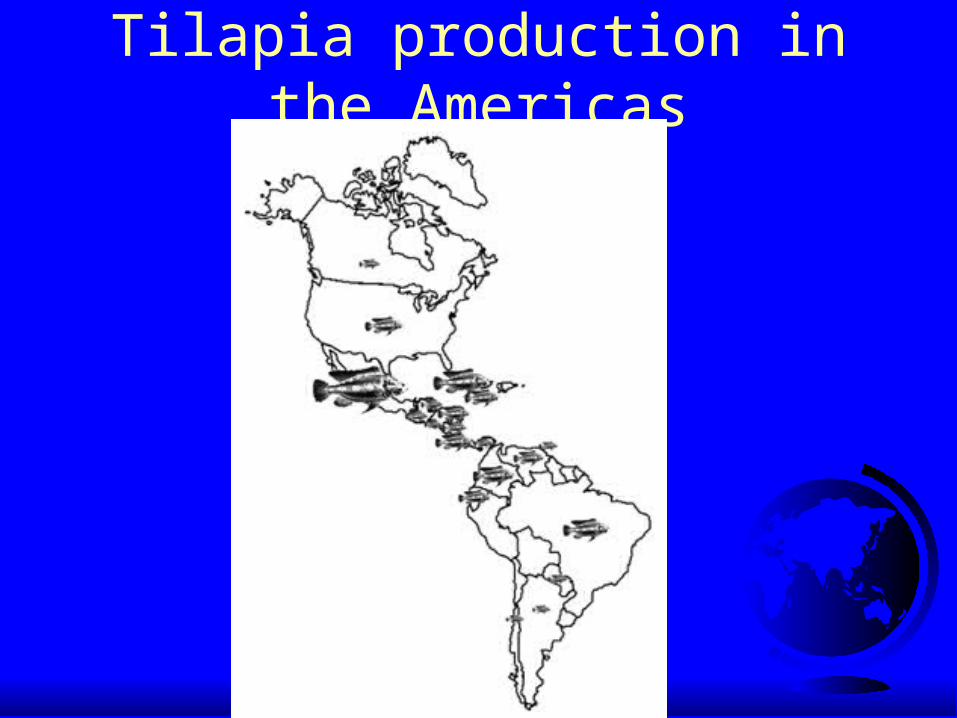
Tilapia production in the Americas
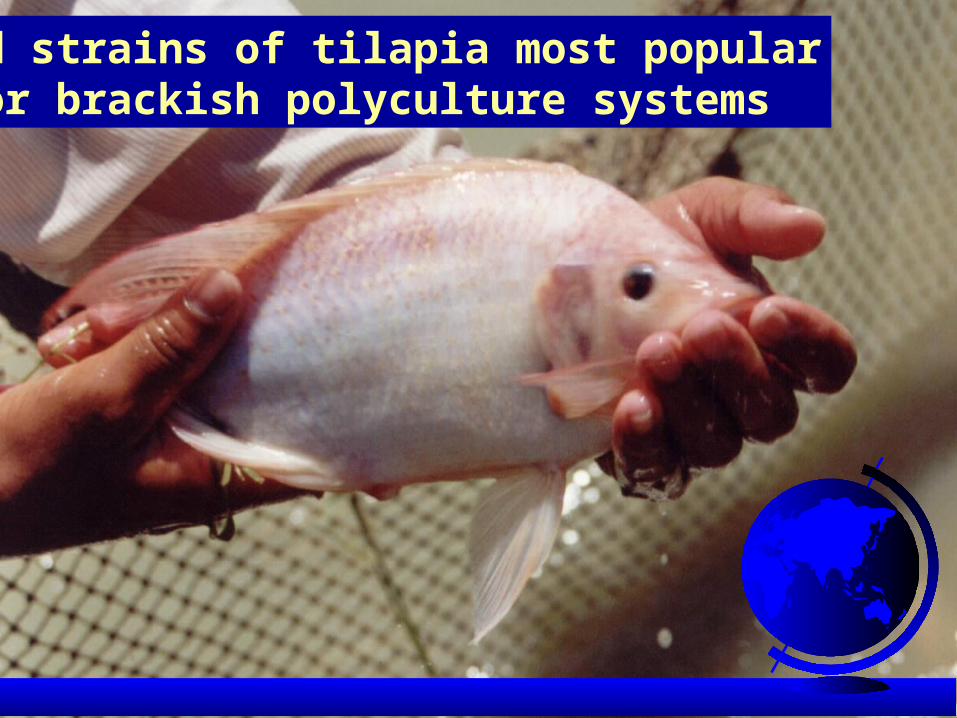
Strain evaluations For saline waters - Hybrid red strains are
preferred For cage and pond culture Chitralada strain of O.
niloticus originally from Thailand and further developed in Brasil.
The GIFT strain of O. niloticus, originally developed in Philippines is most common in Philippines and China
YY Super males - Genetically Male Tilapia
Estimated cost of productionChina - $0.70/kgPhilippines, Indonesia, Brasil - $0.80/kgThailand, Peru - $0.85/kgEcuador, Honduras, Costa Rica - $0.90/kgMexico - $1.00/kgTaiwan Province - $1.05/kgUS - $2.00/kgCanada - $2.10/kg