Marshall & Ilsley CorporationCredit QualityFourth Quarter 2010
2Marshall & Ilsley Corporation
Forward-looking statementsThis presentation contains forward-looking statements within the meaning of the safe harbor provisions of the
Private Securities Litigation Reform Act of 1995. Such forward-looking statements include, without limitation,
statements regarding expected financial and operating activities and results that are preceded by, followed by,
or that include words such as “may,” “expects,” “anticipates,” “estimates” or “believes.” Such statements are
subject to important factors that could cause M&I’s actual results to differ materially from those anticipated by
the forward-looking statements. These factors include (i) risks associated with M&I’s pending merger with BMO
Financial Group, including, without limitation, failure to receive regulatory or shareholder approval of the merger
or to complete the merger in a timely manner or at all, deposit or customer attrition, disruption of M&I’s
business, and unanticipated costs relating to the merger, (ii) federal and state agency regulation and
enforcement actions, which could limit M&I’s activities, increase its cost structures or have other negative
effects on M&I, (iii) general business and economic conditions, including credit risk and interest rate risk, (iv)
M&I’s exposure to increased credit risks associated with its real estate loans, (v) various factors, including
changes in economic conditions affecting borrowers, new information regarding existing loans and identification
of additional problem loans, which could require an increase in M&I’s allowance for loan and lease losses, (vi)
M&I’s ability to maintain required levels of capital, (vii) the impact of recent and future legislative initiatives on
the financial markets or on M&I, (viii) M&I’s exposure to the actions and potential failure of other financial
institutions, (ix) volatility in M&I’s stock price and in the capital and credit markets in general, and (x) those
factors referenced in Item 1A. Risk Factors in M&I’s Annual Report on Form 10-K for the year ended December
31, 2009 and as may be described from time to time in M&I’s subsequent SEC filings, which factors are
incorporated herein by reference. Readers are cautioned not to place undue reliance on these forward-looking
statements, which reflect only M&I’s belief as of the date of this presentation. Except as required by federal
securities law, M&I undertakes no obligation to update these forward-looking statements or reflect events or
circumstances after the date of this presentation.
3Marshall & Ilsley Corporation
Additional information for shareholders In connection with M&I’s pending merger with BMO Financial Group, BMO will file with the SEC a Registration
Statement on Form F-4 that will include a Proxy Statement of M&I and a Prospectus of BMO, as well as other
relevant documents concerning the proposed transaction. Shareholders are urged to read the Registration
Statement and the Proxy Statement/Prospectus regarding the merger when it becomes available and any other
relevant documents filed with the SEC, as well as any amendments or supplements to those documents,
because they will contain important information.
A free copy of the Proxy Statement/Prospectus, as well as other filings containing information about BMO and
M&I, may be obtained at the SEC’s Internet site (http://www.sec.gov). You will also be able to obtain these
documents, free of charge, from BMO at www.BMO.com under the tab “About BMO - Investor Relations,” from
M&I by accessing M&I’s website at www.MICorp.com under the tab “Investor Relations” and then under the
heading “SEC Filings”, or from M&I at (414) 765-7814.
BMO and M&I and certain of their directors and executive officers may be deemed to be participants in the
solicitation of proxies from the shareholders of M&I in connection with the merger. Information about the
directors and executive officers of BMO is set forth in the proxy statement for BMO’s 2010 annual meeting of
shareholders, as filed with the SEC on Form 6-K on February 26, 2010. Information about the directors and
executive officers of M&I is set forth in the proxy statement for M&I’s 2010 annual meeting of shareholders, as
filed with the SEC on a Schedule 14A on March 12, 2010. Additional information regarding the interests of
those participants and other persons who may be deemed participants in the transaction may be obtained by
reading the Proxy Statement/Prospectus regarding the merger when it becomes available. Free copies of this
document may be obtained as described in the preceding paragraph.
4
14%
12%
31%
34%
9% Commercial Real Estate
Construction & Develop.
ConsumerCommercial
Loans by asset class
Residential Real Estate
Commercial Real Estate
Construction & Develop.
ConsumerCommercial
Residential Real Estate
4%
6%
11%
7%
11%
40%
19%
2%Wisconsin
ArizonaMN
MOFL
IN
Other2
KS
Loans by geography1
Diversified loan portfolio
Marshall & Ilsley Corporation
Total loans at December 31, 2010: $37.0 billion
2Other geography includes Illinois (5%) and states < 2% (14%).
1 Geography based on property zip code.
5
Continued credit stabilization
1 NPLs exclude renegotiated loans .2 Excludes NPLs < 90 days past due.
Reserves / Period-end loans
Marshall & Ilsley Corporation
2.75 2.843.07
3.55 3.67 3.753.49
2.41
3.35
0.5
1.0
1.5
2.0
2.5
3.0
3.5
4.0
4.5
4Q08 1Q09 2Q09 3Q09 4Q09 1Q10 2Q10 3Q10 4Q10
%
0%
1%
2%
3%
4%
5%
6%
4Q09 1Q10 2Q10 3Q10 4Q10 4Q10
C&I CRE Residential RE Consumer C&D
NPLs1 / Period-end loans
2.6% 2
• Nonperforming loans $1.6 billion
• Proactively addressing credit
– Identifying and writing down troubled assets
– Selling problem loans ($2.7 billion since 1Q08)
– Reducing exposure to C&D loans (8.7% of total loans)
– Strengthened loan loss reserves (LLR up 155% since 1Q08)
• Continued encouraging signs credit quality is improving
$0
$500
$1,000
$1,500
$2,000
4Q08 1Q09 2Q09 3Q09 4Q09 1Q10 2Q10 3Q10 4Q10
$ M
illi
on
s
90+ Days
30-89 Days
Total loans delinquency trend
4.6% 4.6%4.0%
4.2%
30-89 days delinquent include accruing loans only.
4.4%
6
Stabilizing inflows of nonperforming loans
Marshall & Ilsley Corporation
($mil) 2010
4Q 1Q 2Q 3Q 4Q 1Q 2Q 3Q 4Q
Beginning $1,261 $1,527 $2,075 $2,416 $2,250 $2,045 $1,954 $1,801 $1,598
Increases:
Renegotiated 9 36 51 33 214 1 43 28 148 2 57
Accruing / Other 1,092 1,084 1,251 810 729 631 584 559 581
Total Increases 1,101 1,120 1,302 843 943 674 612 707 638
Decreases:
Charge-offs 438 202 474 383 486 372 343 484 3 347
ORE / Sold 182 188 208 325 344 195 212 242 147
Accrual / TDR 105 72 91 124 120 58 63 44 49
Paydowns / Other 110 110 188 177 198 140 147 140 125
Total Decreases 835 572 961 1,009 1,148 765 765 910 668
Ending $1,527 $2,075 $2,416 $2,250 $2,045 $1,954 $1,801 $1,598 $1,568
1 Includes $170 million transfer of related renegotiated commercial real estate loans discussed in 4Q09 earnings release conference call.2 Includes $83 million transfer of hospitality industry relationship and two other significant lending relationships.3 Includes $201 million hospitality industry relationship net charge-off.
20092008
7Marshall & Ilsley Corporation
$1,101 $1,120
$1,302
$843$943
$674$612
$707$638
$0
$250
$500
$750
$1,000
$1,250
$1,500
$1,750
4Q08 1Q09 2Q09 3Q09 4Q09 1Q10 2Q10 3Q10 4Q10
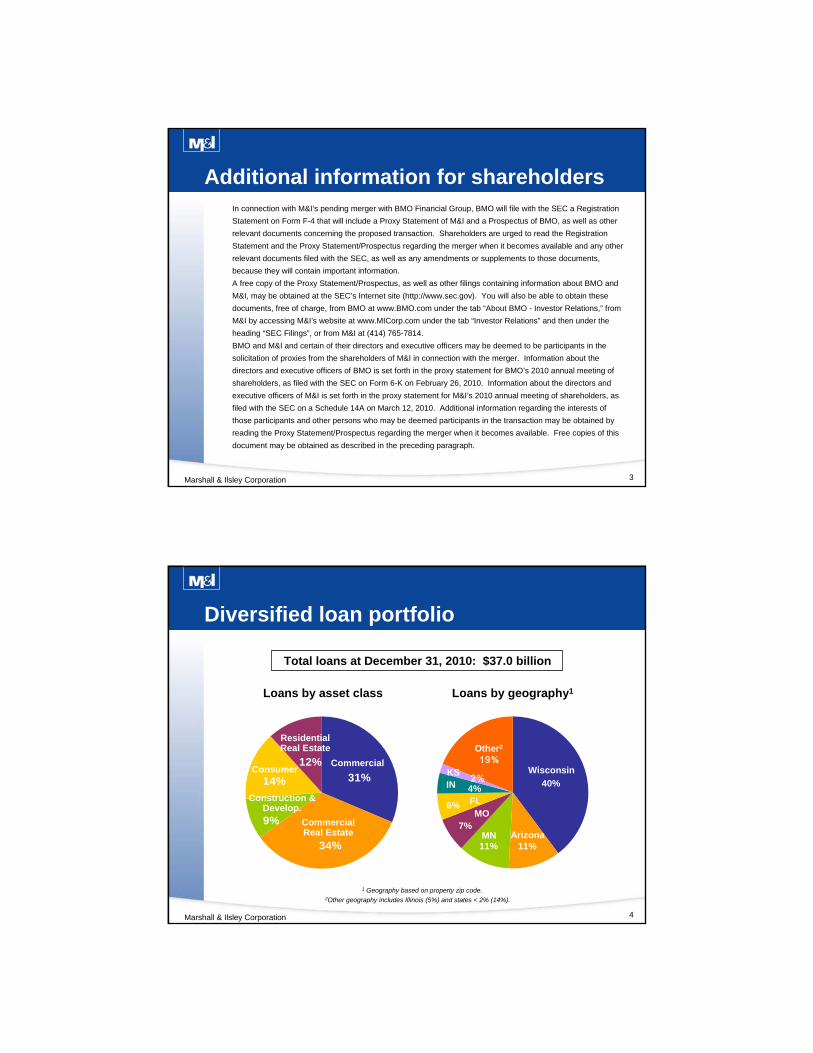
AZ WI MO KS FL MN Other
Nonperforming loan inflows
By property zip code ($ millions)
Indiana is included in other.
8
$0
$100
$200
$300
$400
$500
$600
4Q08 1Q09 2Q09 3Q09 4Q09 1Q10 2Q10 3Q10 4Q10
1 Based on unpaid principal balance.
Other
FL
AZ
Residential
Aggressively selling problem assets
Marshall & Ilsley Corporation
Loan sale history by quarter ($ Millions)1
• Disposition strategy initially focused on Florida and then Arizona
– Limited inventory remains for additional large loan sales in those geographies
9
Strong reserve coverage
Marshall & Ilsley Corporation
• Total nonperforming loans1
– Unpaid principal balance $2,444
– Lifetime charge-offs 876
– Ledger balance $1,568
• Total reserve for loan & lease losses $1,388
• Loan loss reserve coverage ratio 90%2
As of December 31, 2010($ millions)
1 Includes $24 million of nonperforming loans held for sale.
2 Loan loss coverage ratio excludes nonperforming loans held for sale.
3Excludes $75 million of loan loss reserve assigned to renegotiated loans.
Nonperforming loans subject to specific
impairment analysis (FAS 114)
• Total nonperforming loans
– Unpaid principal balance $1,729
– Lifetime charge-offs 690
– Ledger balance . . . . . . . . . . .$1,039
• Reserves based on specific
impairment analysis . . . . . . . . . . . . . $86
• Lifetime charge-offs result in 40% haircut
Nonperforming loans NOT subject to specific
impairment analysis
• Total nonperforming loans
– Unpaid principal balance $715
– Lifetime charge-offs 186
– Ledger balance . . . . . . . . . . . . . . $529
• Reserves net of specific allocation . . . $1,227 3
• Loan loss reserve coverage
ratio of loans not subject to
specific impairment analysis . . . . . . . . 232%Note: Nonperforming loans > $1 million are analyzed for impairment on a quarterly basis and written down to net realizable value.
10Marshall & Ilsley Corporation
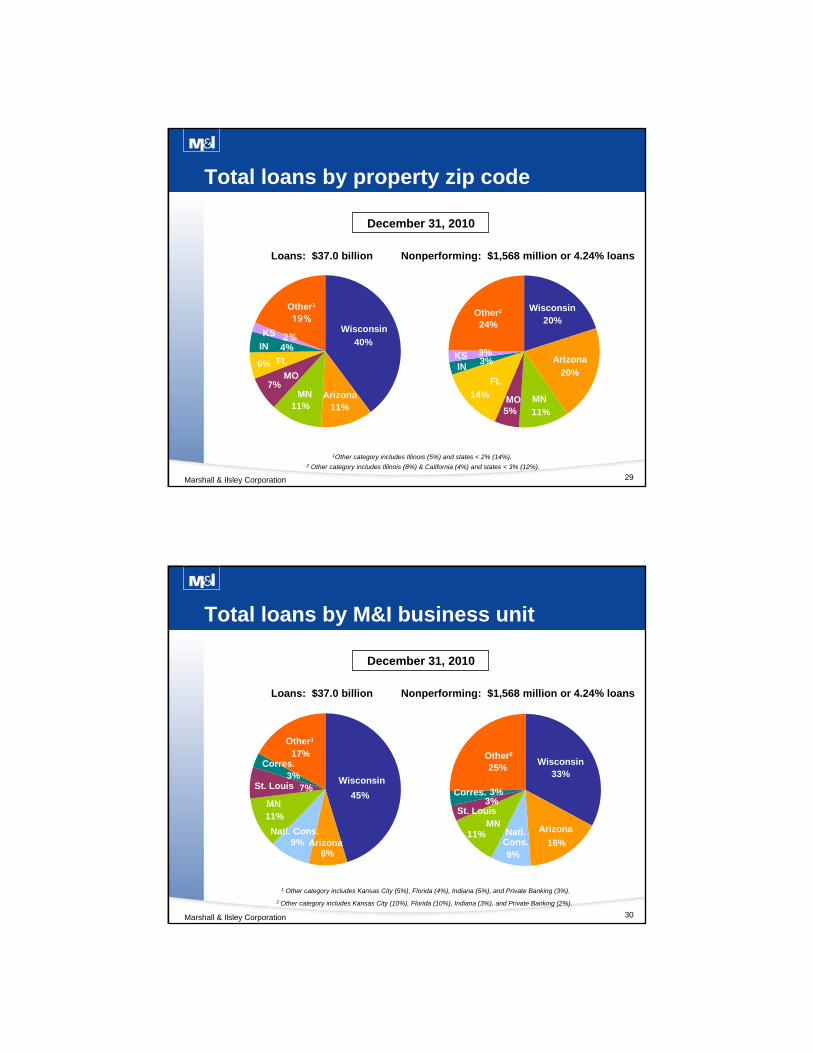
2%
6%
22%
33%
15%
22%
Nonperforming: $436 million or 13.6% loans
21%
2%
12%
29%
14%
22%
1 Includes commercial & industrial and agricultural real estate C&D loans.2 Includes land and residential property loans.
Some time periods excluded for illustrative purposes.
Comm. Con. (Housing)2
Comm. Land
Residential Land
Comm. Land
ResidentialLand
R.C.D.
R.C.I.
Commercial Construction (Non-Housing)1
Comm. Con. (Housing)2
Loans: $3.2 billion
Commercial Construction (Non-Housing)1
• C&D loans of $3.2 billion (8.7% of total loans)
• C&D nonperforming loans of $436 million (28% of total NPLs)
• Aggressively shrinking C&D portfolio
–Currently 9% of total loans vs. 23% in 3Q07
–C&D loans have decreased $7.2 billion or 69% vs. 1Q08
–Targeting below 10% of total loans
–Further contraction expected
$436$450
$882$808
$529
$0
$300
$600
$900
$1,200
$1,500
4Q07 4Q08 4Q09 3Q10 4Q10
Nonperforming loans ($ Millions)
Shrinking stressed C&D portfolio
Note: All figures as of December 31, 2010.
R.C.D.
R.C.I.
11Marshall & Ilsley Corporation
0%
5%
10%
15%
20%
25%
4Q07 1Q08 2Q08 3Q08 4Q08 1Q09 2Q09 3Q09 4Q09 1Q10 2Q10 3Q10 4Q10
2
4
6
8
10
12
Reducing exposure to C&D loans
Note: C&D are construction and development loans; figures based on period-end balances.
Corporate Goal: Below 10%
Peak Qtr. Peak Current
3Q07 22.6% 8.7%
1Q08 $10.4B $3.2B
% Total loans Total C&D ($Bil.)
12
$0
$200
$400
$600
$800
$1,000
4Q08 1Q09 2Q09 3Q09 4Q09 1Q10 2Q10 3Q10 4Q10
$ M
illi
on
s
Marshall & Ilsley Corporation
90+ Days
C&D delinquency trends
30-89 Days
Construction & development delinquent loans ($)
30-89 days delinquent include accruing loans only.
13
2%4%
10%
4%70%
10%
Marshall & Ilsley Corporation
Construction &
Development
Consumer
10%
15%
4%
6%
59%6%
Loans: $.8 billion
Nonperforming: $80 million or 9.8% loans
Residential Land
Resi. Con. DevelopersComm. Land
Comm. Con. (Non-Housing)1
Residential Land
Resi. Con. Developers
Comm. Con. (Non-Housing)1
Arizona total C&D loans down 79%
1 Includes commercial & industrial and agricultural real estate C&D loans.2 Includes land and residential property loans.
Note: Geography based on property zip code. Some time periods excluded for illustrative purposes.
December 31, 2010• Aggressively shrinking Arizona portfolio
– Total C&D loans have decreased by $3.0 billion or 79% since 4Q07
Resi. Con. Indiv.
Comm. Con. (Housing)2
Resi. Con. Indiv.
Comm. Con. (Housing)2
Comm. Land
$3.8
$2.9
$1.4
$0.9 $0.8
$0
$1
$2
$3
$4
$5
4Q07 4Q08 4Q09 3Q10 4Q10
$ B
illi
on
s
Arizona C&D loans
Residential Land
Resi. Con. Indiv.
Commercial Con.
Resi. Con. Dev.
Comm. Land
-79%
14Marshall & Ilsley Corporation
37%
15%
40%
8%
Construction &
Development
Consumer
12%
42%
17%
29%
Loans: $212 million
Nonperforming: $28 million or 13.3% loans
Resi. Con. Developers
Comm. LandComm. Con.
(Non-Housing)1
Arizona commercial C&D loans down 85%
1 Includes commercial & industrial and agricultural real estate C&D loans.2 Includes land and residential property loans.
Note: Geography based on property zip code.Some time periods excluded for illustrative purposes.
• Aggressively shrinking Arizona portfolio
– Commercial C&D loans have decreased by $1.2 billion or 85% since 4Q07
Comm. Con. (Housing)2
Comm. Land
$1.4
$0.9
$0.3$0.2 $0.2
$0.00
$0.25
$0.50
$0.75
$1.00
$1.25
$1.50
$1.75
4Q07 4Q08 4Q09 3Q10 4Q10
$ B
illi
on
s
Arizona Commercial C&D loans
Commercial Con.
Resi. Con. Dev.
Comm. Land
-85%
Comm. Con. (Non-Housing)1
Resi. Con. Developers
December 31, 2010
15Marshall & Ilsley Corporation
Arizona consumer C&D loans down 75%
Note: Geography based on property zip code.
• Aggressively shrinking Arizona portfolio
– Consumer C&D loans have decreased by $1.8 billion or 75% since 4Q07
– Nonperforming: $52M or 8.6% loans
$2.4
$1.9
$1.1
$0.7 $0.6
$0.0
$0.5
$1.0
$1.5
$2.0
$2.5
$3.0
4Q07 4Q08 4Q09 3Q10 4Q10
$ B
illi
on
sArizona Consumer C&D loans
Resi. Con. Indiv.Residential Land
-75%
16
Multi-Family
Farm
BusinessReal Estate
BusinessReal Estate
Marshall & Ilsley Corporation
Commercial real estate1 portfolio
Marshall & Ilsley Corporation
1 CRE does not include commercial land & construction loans.2 Other category includes Hospitality (5%), Medical Facilities (4%), & other < 3% (11%).
3 Other category includes other <4% (10%).4 Over 90% are multi-family loans and business purpose loans backed by a 1-4 family residence.
• CRE loans of $12 billion (34% of total loans)
• 40% of business real estate loans are owner occupied
• CRE nonperforming loans of $573 million (37% of total NPLs)
– Approx. 4.6% of total CRE loans
• 52% of NPL’s are less than 90 days past due
Resi. R.E.
Construction &
Development
Consumer
Commercial
Comm. R.E.
Construction & Development
0%6%
15%
15%
20%
16%
28%
Industrial
Other 2
Office
Retail
Office
Residential 4
Loans: $12 billion
Nonperforming: $573 million
Agri.
Land
10%
4%0%
13%
11%
14%
9%
39%
Indus.
Other 3
Office
Retail
Agri.Land
Residential 4
0%
1%
2%
3%
4%
5%
4Q08 1Q09 2Q09 3Q09 4Q09 1Q10 2Q10 3Q10 4Q10
90+ Days
30-89 Days
CRE delinquency trends
Hospitality
Note: All figures as of December 31, 2010.30-89 days delinquent include accruing loans only.
17Marshall & Ilsley Corporation
Business real estate loans
Loans outstanding at December 31, 2010: $8.3 billion
13%
3%
16%68%
M&I Footprint Excl. AZ & FL
Other 2
AZ & FL
1 Geography based on property zip code.
2 Other includes IL (5%) and other states <2% (8%).
3 Includes OH, MI, CA, GA, NV & NY.
Totals may not foot due to rounding.
Stressed States
By state1
$ MillionsBusiness Real Estate Loans
Total Loans NPL's NPL %Wisconsin $3,106 $76 2.4 %Minnesota 1,217 43 3.6Missouri 782 29 3.7Kansas 184 4 2.4Indiana 395 10 2.6 Total M&I Footprint States Excl. AZ & FL 5,683 163 2.9
Arizona 718 30 4.2Florida 613 50 8.2 Total AZ & FL 1,331 81 6.1
Economically Stressed States 238 22 9.1
Remaining States 1,085 80 7.4 Total Business Real Estate $8,337 $345 4.1 %
3
18Marshall & Ilsley Corporation
Multifamily loans
Loans outstanding at December 31, 2010: $3.3 billion
7%
4%11%
78%M&I Footprint Excl. AZ & FL
Other 2
AZ & FL
1 Geography based on property zip code.
2 Other includes IL (4%) and other states <2% (3%).
3 Includes OH, MI, CA, GA, NV & NY.
Totals may not foot due to rounding.
Stressed States
By state1
$ MillionsMulti-family Loans
Total Loans NPL's NPL %Wisconsin $1,906 $48 2.5 %Minnesota 307 19 6.1Missouri 187 10 5.5Kansas 44 12 26.8Indiana 144 2 1.6 Total M&I Footprint States Excl. AZ & FL 2,589 92 3.5
Arizona 152 12 7.8Florida 203 23 11.3 Total AZ & FL 354 35 9.8
Economically Stressed States 130 58 44.9
Remaining States 253 23 9.0 Total Multi-Family Loans $3,326 $208 6.2 %
3
19Marshall & Ilsley Corporation
Commercial & industrial loans
8%10%
15%
31%24%
7%
5%
Constr.
Other1
WholesaleTrade
Fin. & Ins.
Loans: $12 billion
R.E. RetailTrade
9%
9%6%
27%
22%
6%
21%
Constr.
Other2
Whole. Trade
Manufac.
Fin. & Ins.R.E. Retail Trade
1 Other category includes Professional (5%), Ag. Forestry Fishing Hunting (5%), Transportation & Warehousing (4%), Management Companies (3%), Health Care (3%) and other < 3% (11%).
2 Other category includes Professional (7%), Management Companies (4%), Hospitality (4%) and other <3% (12%).3 Based on end of period loan balance.
4 $50M of 1Q10 bank holding company NCO’s had been fully reserved since 1Q09.
• C&I loans of $12 billion (31% of total loans)
• C&I nonperforming loans of $190 million (12% of total NPLs)
0.7%
2.7%
1.7%
1.8% 1.3%
2.6%
1.3%
1.9% 2.3%
0%
2%
4%
6%
4Q08 1Q09 2Q09 3Q09 4Q09 1Q10 2Q10 3Q10 4Q10
Net charge-offs (annualized)3
Franklin NCOs
Manufac.
Nonperforming: $190 million or 1.6% loans
6.0%
Bank Holding Company NCOs
4.4% 4
1.6%2.4%
Note: All figures as of December 31, 2010.
1.6%
2.4%
20Marshall & Ilsley Corporation
6%
15%
10%
9%
6%
20%
34%
2007
<=20042008
20062005
2009
5%6% 7%
8%
38% 36%
Wisconsin
AZMN
IN
Other2
OH
1 Geography based on property zip code.2 Other geography includes Missouri (5%), Florida (4%), Illinois (4%), and states < 3% (25%).
3 Based on end of period loan balance.
By geography 1
(Low Arizona exposure)
By vintage(Sold majority of 2005 & 2006 originations)• Home equity lines / loans of $4.2 billion (11% of total loans)
– 60% lines and 40% loans
– 45% secured by first mortgage
– 61% HELOC drawn
• Home equity nonperforming lines / loans of $88 million
(6% of total NPLs)
• 2.1% in nonperforming status
Home equity lines / loans
3.4%2.5%2.7%
1.6% 1.6% 2.4%2.4%
2.9%3.0%
0%
2%
4%
6%
4Q08 1Q09 2Q09 3Q09 4Q09 1Q10 2Q10 3Q10 4Q10
Net charge-offs (annualized)3
NCOs recorded due to 2Q09 charge-off acceleration.
2010
Note: All figures as of December 31, 2010.
21
Residential real estate loans
Marshall & Ilsley Corporation
9%3%
7%
7%
34%
3%
37%
LoansLines
6%
2%
25%
21% 15%
14%
17%
2007
<=2004
2008
2006
2005
2009
MN
By vintage
Wisconsin
ArizonaMN
IN
Other
FL
MO
1 Includes WI, MN, MO, IN & KS.2 Based on end of period loan balance.
3 Geography based on property zip code.
By geography3
• RRE loans of $4 billion (12% of total loans)
– Predominantly prime with no option ARMS or subprime
• RRE nonperforming loans of $274 million (17% of total NPLs)
• 6.3% NPL ratio
• 3.2% NPL ratio for M&I footprint states excluding AZ & FL1
• Arizona has realized the most deterioration
– 10.6% in nonperforming status
Net charge-offs (annualized)2
4.3%4.3%3.4%1.3% 2.0% 3.0%
3.7% 3.2% 2.7%
0%
4%
8%
12%
16%
4Q08 1Q09 2Q09 3Q09 4Q09 1Q10 2Q10 3Q10 4Q10
NCOs recorded due to 2Q09 charge-off acceleration and impact of loan sales completed on 7/31/09 and in 4Q09.
2010
Note: All figures as of December 31, 2010.
Appendix A
Business Overview
23
2.50%
2.75%
3.00%
3.25%
3.50%
4Q07 1Q08 2Q08 3Q08 4Q08 1Q09 2Q09 3Q09 4Q09 1Q10 2Q10 3Q10 4Q10
Marshall & Ilsley Corporation
Net interest margin
Net interest margin (FTE) / average earning assets shown.
24Marshall & Ilsley Corporation
51%
28%
10%
-12%-18%
-24%-32%
-40%
-10% -8%
3%
16%
24% 23%
12% 13%
-2%
-60%
-40%
-20%
0%
20%
40%
60%
4Q08 1Q09 2Q09 3Q09 4Q09 1Q10 2Q10 3Q10 4Q10
Total Time Deposits Bank Issued Transaction Deposits
Deposit trends
Growth versus prior year
Time deposits include bank issued time and wholesale time deposits.
Growth based on quarter to date averages.
-1%
25
28% 26%
25%21%
Reduced reliance on CDs
Marshall & Ilsley Corporation
CDsNon Int. Bearing
21% 26%
37%
16%Other Int. Bearing Activity
CDsNon Int. Bearing
Note: Based on quarter to date averages.
NOW & Savings
NOW & Savings
Other Int. Bearing Activity
Bank-issued Deposits
4Q09: $30.7 billion 4Q10: $31.6 billion
CDs peaked at 35% of bank-issued deposits in 1Q09
26Marshall & Ilsley Corporation
$0
$4
$8
$12
$16
$20
4Q07 1Q08 2Q08 3Q08 4Q08 1Q09 2Q09 3Q09 4Q09 1Q10 2Q10 3Q10 4Q10
90%
100%
110%
120%
130%
140%
Lower borrowings
Peak Qtr. Peak Current
3Q07 $19B $6B
4Q07 132% 97%
Wholesale funding $B 1 Loan to deposit ratio
1Borrowings & other liabilities.
All data based on period end balances.
Appendix B
Loan portfolio summary
28
Total loans by asset class
Marshall & Ilsley Corporation
12%
14%
9%
34%
31%
Commercial Real Estate
Construction & Develop.
ConsumerCommercial
Loans: $37.0 billion
Residential Real Estate
December 31, 2010
Nonperforming: $1,568 million or 4.24% loans
17%
6%
28%
37%
12%
Resi. R.E.
Construction & Development
Consumer
Comm.
Comm. R.E.
29
4%
6%
11%
7%
11%
40%
19%
2%
Total loans by property zip code
Marshall & Ilsley Corporation
Wisconsin
ArizonaMN
MO
FL
IN
Other1
KS
1Other category includes Illinois (5%) and states < 2% (14%).2 Other category includes Illinois (8%) & California (4%) and states < 3% (12%).
Wisconsin
Arizona
MNMO
FLIN
Other2
KS
14%
5% 11%
24%
3%3%
20%
20%Wisconsin
MNMO
FL
KS
Other2
ArizonaIN
Loans: $37.0 billion
December 31, 2010
Nonperforming: $1,568 million or 4.24% loans
30Marshall & Ilsley Corporation
17%
3%7%
11%
9%8%
45%
Total loans by M&I business unit
Arizona
Corres.
Other1
WisconsinSt. Louis
Natl. Cons.
MN
2 Other category includes Kansas City (10%), Florida (10%), Indiana (3%), and Private Banking (2%).
1 Other category includes Kansas City (5%), Florida (4%), Indiana (5%), and Private Banking (3%).
9%
11%16%
33%25%
3%3%
Arizona
Corres.
Wisconsin
St. Louis
Natl. Cons.
MN
Other2
Loans: $37.0 billion
December 31, 2010
Nonperforming: $1,568 million or 4.24% loans
31
Total nonperforming loans
Correspondent
Marshall & Ilsley Corporation
Nonperforming loans at December 31, 2010: $1,568 million
37%
28%
12%
17%
6%
Resi. R.E.
Construction & Development
Consumer
Commercial
20%
20%
5%
11%
3%3%
24%
14%
By state1
Wisconsin
MN
MO FL
KS
Other2Arizona
Comm. R.E.
IN
By loan category
Correspondent1 Geography based on property zip code.2 Other category includes Illinois (8%) & California (4%) and states < 3% (12%).
32
56%
10%
7%
7%
15%
5%
4%
10%
18%
20%
48%
Marshall & Ilsley Corporation
Renegotiated loans at December 31, 2010: $548 million
By state1
WI
MN
FL
Other2
Arizona
1 Geography based on property zip code.
Total renegotiated loans
2 Other category includes Texas (5%) & states < 2% (10%).
Resi. R.E.
Construction & Development
Comm. R.E.
By loan category
Consumer
Commercial
MO
33
Based on period end balances.
Marshall & Ilsley Corporation
$270
$446
$819 $793$732 $715
$548 $548
$935
0
250
500
750
1,000
4Q08 1Q09 2Q09 3Q09 4Q09 1Q10 2Q10 3Q10 4Q10
Resi R.E. C&D Commercial R.E. Consumer Commercial
Total renegotiated loans
By loan category ($ millions)
34
14%9%
8%
8%
17%1%
3%
15%
25%
Correspondent
Marshall & Ilsley Corporation
11%
11%16%
33%
29%
Resi. R.E.
Construction & Development
ConsumerCommercial
FL
Arizona
Comm. R.E.
Total net charge-offs
Net charge-offs for 2010 fourth quarter: $430 million
By loan category
WIMN
By state1
Other2
1 Geography based on property zip code.2 Other category includes California 6% & states < 3% (11%).
IL
MO
KSIN
Appendix C
Construction & development loans (C&D)
36
20%
2%6%
12%
7%
6%
22%
25%
Correspondent
Marshall & Ilsley Corporation
30%
7%
2%2%21%
18%
18%
2%
Wisconsin
Arizona
FloridaMN
Other2
2 Other category includes Illinois (12%) Arkansas (8%), and states < 4% (10%).
C&D loans by property zip code
Wisconsin
Arizona
Florida
MN
MO
IN
Other1
KS
1 Other category includes Illinois (5%) and states < 4% (15%).
MO
December 31, 2010
Loans: $3.2 billion (peak $10.4 billion 1Q08)
Nonperforming: $436 million or 13.6% loans
KS
IN
37
Correspondent
Marshall & Ilsley Corporation
12%6%
7%
8%
8%
8%
32%
19%
9%
18% 5%
25%
4%
7%
16%
16%
C&D loans by M&I business unit
ArizonaCorres.
Other1
Arizona
Corres.
Other2
Wisconsin
Kansas City
Natl. Cons.
MN
FL
Natl. Cons.
MN
FL
2 Other category includes Indiana (6%), St. Louis (1%) and Private Banking (2%).
1 Other category includes Indiana (7%), St. Louis (4%) and Private Banking (1%).
Wisconsin
KansasCity
Nonperforming: $436 million or 13.6% loans
December 31, 2010
Loans: $3.2 billion (peak $10.4 billion 1Q08)
38Marshall & Ilsley Corporation
By loan property type
1 Other category includes Hospitality (3%), Medical (3%), and other < 2% (3%).Totals may not foot due to rounding.
Total commercial real estate loansLoans outstanding at December 31, 2010: $1.9 billion
Commercial land & construction loans
3%9%
12%
15%
43%
18%
Land
Residential Property
Retail
Office
Other 1Industrial
Comm. Land & Construction LoansProperty Type $ Millions % Total NPL %
Commercial & Industrial
Industrial $56 3 6.2 %Retail 283 15 25.0Office 221 12 5.1
Other1 164 9 7.2
Total C&I $724 39 13.4
Land 799 43 15.7
Residential Property 347 18 6.4
Agricultural Real Estate 1 0 0.0
Other 0 0 N/A
Total $1,871 100 13.1 %
39Marshall & Ilsley Corporation
0%
6%
12%
18%
24%
30%
36%
4Q07 1Q08 2Q08 3Q08 4Q08 1Q09 2Q09 3Q09 4Q09 1Q10 2Q10 3Q10 4Q10
Total C&D
Resi. Land
C&D nonperforming loansNonperforming loans / Period-end loans
by selected loan categories
Resi. Construction Indiv.
40
Total residential land loans
Correspondent
Marshall & Ilsley Corporation
6%
29%65%
Individuals
Business Purpose2
Commercial 5%
13%
8%
53%
21%
By state1
Arizona
Other3
Loans outstanding at December 31, 2010: $1.1 billion
By customer type
Correspondent
Wisconsin
FL
MN
3 Other category includes Missouri (2%), Kansas (2%) & other states (9%).
1 Geography based on property zip code.2 Loans to mid-sized local and regional builders to acquire and develop land for 1-4 family homes.
41
11%
6%
8%
11%64%
3%
10%
87%
Arizona residential land loans
Marshall & Ilsley Corporation
Key Statistics at December 31, 2010
• Total loans outstanding: $568 million
• Total nonperforming loans: $48 million or 8.4%
• Loans to individuals– Loans outstanding: $492 million– Updated FICO on performing loans: 726– Average loan size: $156 thousand– Nonperforming loans: $36 million or 7.4%
• Loans to individuals (Maricopa County)– Loans outstanding: $312 million– Average loan size: $195 thousand– Nonperforming loans: $26 million or 8.3%
By customer type
By county2
Maricopa
Other
Individuals
Business Purpose1
Commercial
Pinal
Yavapai
Pima
Some time periods excluded for illustrative purposes.1 Loans to mid-sized local and regional builders to acquire and develop land for 1-4 family homes.
2 Geography based on property zip code.
$1.7
$1.3
$0.9
$0.6 $0.6
$0.0
$0.5
$1.0
$1.5
$2.0
$2.5
4Q07 4Q08 4Q09 3Q10 4Q10
$ B
illi
on
s
Arizona residential land loans
-67%
42
3%
10%8%
30%
49%
By state1 C&D nonperforming: $23 million or 8.7% loans
Marshall & Ilsley Corporation
Correspondent
Commercial
Correspondent banking loans
8%
28%
23%
41%
36%
4%9% 7%
20%
24%
Total loans: $1.1 billion
By loan category
Comm. R.E.
Construction & Develop.
Consumer
Commercial
Wisconsin
FL
Illinois
MONE
Other2
1 Geography based on property zip code.2 Other category includes Texas (5%), Utah (5%) and states < 5% (26%).3 Includes commercial & industrial and agricultural real estate C&D loans.
4 Includes land and residential property loans.
C&D loans: $265 million
Resi. Land
Comm. Land
Resi. Con. Developers
Comm. Constr. (Non-Housing)3
Commercial Construction
(Housing)4
49%
21%
30%Resi. Land
Resi. Con. Developers
Comm. Constr. (Non-Housing)3
December 31, 2010
43Marshall & Ilsley Corporation
1%10%
37% 3%
22%
27%
Construction &
Development
Consumer
1%
5%
49% 2%
26%
17%
Loans: $368 million
Nonperforming: $93 million or 25.3% loans
Residential Land
Resi. Con. Developers
Comm. Land
Comm. Con. (Non-Housing)1
Residential Land
Resi. Con. Developers
Comm. Con. (Non-Housing)1
Florida C&D loans down 72%
1 Includes commercial & industrial and agricultural real estate C&D loans.2 Includes land and residential property loans.
Note: Geography based on property zip code.Some time periods excluded for illustrative purposes.
December 31, 2010• Aggressively shrinking Florida portfolio
– Total C&D loans have decreased by $0.9 billion or 72% since 4Q07
Resi. Con. Indiv.
Comm. Con. (Housing)2
Resi. Con. Indiv.
Comm. Con. (Housing)2
Comm. Land
$1.0
$0.6
$0.4 $0.4
$1.3
$0.0
$0.2
$0.4
$0.6
$0.8
$1.0
$1.2
$1.4
$1.6
4Q07 4Q08 4Q09 3Q10 4Q10
$ B
illi
on
s
Total C&D loans (Florida)
Residential Land
Resi. Con. Indiv.
Commercial Con.
Resi. Con. Dev.
Comm. Land
-72%
44
• Commercial construction – Loans primarily to mid-sized local and regional companies to construct a variety of commercial projects, including farmland, industrial, multi-family, office, retail, single-family and condominiums.
• Commercial land – Loans primarily to mid-sized local and regional companies to acquire and develop land for a variety of commercial projects, including farmland, industrial, multi-family, office, retail, single-family, and condominiums.
• Residential construction by individuals – Loans to individuals to construct 1-4 family homes.
• Residential land – Loans primarily to individuals and mid-sized local and regional builders to acquire and develop land for 1-4 family homes.
• Residential construction by developers – Loans primarily to mid-sized local and regional builders to construct 1-4 family homes in residential subdivisions.
Marshall & Ilsley Corporation
C&D loans – definitions
Appendix D
Commercial real estate loans (CRE)
46
Correspondent
Marshall & Ilsley Corporation
Total commercial real estate loans
By loan category
1 Other category includes Hospitality (5%), Medical (4%), and other < 3% (11%).2 Geographic distribution is Wisconsin (37%), Minnesota (15%), Missouri (10%), Arizona (9%), Florida (7%), Illinois (5%), Indiana (5%)
Kansas (2%), and other states <2% (10%).Totals may not foot due to rounding.
Loans outstanding at December 31, 2010: $12.4 billion
Commercial & Industrial
Land
Residential Property
Ag & Other
6%
27%
67%
Farm
Business Real Estate
Multi-Family
Total Commercial Real Estate LoansProperty Type $ Millions % Total NPL %
Commercial & Industrial
Industrial $2,029 16 2.6 %Retail 1,873 15 3.9Office 1,814 15 3.5
Other1 2,480 20 5.6
Total C&I2 $8,197 66 4.0
Land 14 0 9.6
Residential Property 3,419 28 6.5
Agricultural Real Estate 749 6 2.7
Other 23 0 N/A
Total $12,401 100 4.6 %
47Marshall & Ilsley Corporation
Business real estate loans
Correspondent
By loan category
Commercial & Industrial
Land
Residential Property
Ag & Other
67%
27%
6%Farm
Business Real Estate
Multi-Family
1 Other category includes Hospitality (7%), Medical (6%), Vehicle Dealership (4%), Gas Station (3%), Restaurant (3%), and other < 2% (6%).Totals may not foot due to rounding.
Loans outstanding at December 31, 2010: $8.3 billion
Business Real Estate LoansProperty Type $ Millions % Total NPL %
Commercial & Industrial
Industrial $2,027 24 2.6 %Retail 1,872 22 3.9Office 1,795 22 3.6
Other1 2,446 29 5.7
Total C&I $8,140 98 4.0
Land 10 0 5.3
Residential Property 135 2 11.0
Agricultural Real Estate 44 1 1.3
Other 9 0 N/A
Total $8,337 100 4.1 %
Appendix E
Supplemental financial information
49
Loan portfolio statistics
Marshall & Ilsley Corporation
Total Loans 4Q08 1Q09 2Q09 3Q09 4Q09 1Q10 2Q10 3Q10 4Q10
Period-end loans ($ millions) 49,984.5 49,244.7 48,183.1 46,106.3 44,217.6 42,648.8 41,317.5 39,723.1 36,999.4
% Total loans 100.0% 100.0% 100.0% 100.0% 100.0% 100.0% 100.0% 100.0% 100.0%
30-89 day delinquency ($ millions) 1 891.2 1,477.0 890.3 666.1 539.1 533.6 457.3 507.2 431.4
30-89 day delinquency % 1.78% 3.00% 1.85% 1.44% 1.22% 1.25% 1.11% 1.28% 1.17%
Nonaccrual loans ($ millions) 1,527.0 2,074.6 2,416.1 2,250.1 2,044.8 1,953.8 1,801.4 1,597.6 1,567.7
Nonaccrual loans % 3.05% 4.21% 5.01% 4.88% 4.62% 4.58% 4.36% 4.02% 4.24%
Net charge-offs ($ millions) 679.8 328.0 603.3 532.7 572.3 423.4 438.3 560.3 429.7
Net charge-offs % (qtr annualized) 5.38% 2.67% 4.95% 4.48% 5.01% 3.94% 4.17% 5.47% 4.40%
Commercial Loans & Leases 4Q08 1Q09 2Q09 3Q09 4Q09 1Q10 2Q10 3Q10 4Q10
Period-end loans ($ millions) 15,441.7 15,107.8 14,792.4 13,532.9 12,949.9 12,315.5 12,246.9 11,953.6 11,623.4
% Total loans 30.9% 30.7% 30.7% 29.4% 29.3% 28.9% 29.6% 30.1% 31.4%
30-89 day delinquency ($ millions) 1 51.4 68.4 79.4 53.8 30.5 43.3 33.8 25.7 30.6
30-89 day delinquency % 0.33% 0.45% 0.54% 0.40% 0.24% 0.35% 0.28% 0.21% 0.26%
Nonaccrual loans ($ millions) 168.5 336.4 431.7 411.1 350.5 252.7 246.0 232.0 190.3
Nonaccrual loans % 1.09% 2.23% 2.92% 3.04% 2.71% 2.05% 2.01% 1.94% 1.64%
Net charge-offs ($ millions) 93.9 60.7 66.8 205.5 86.0 134.1 49.3 56.3 70.9
Net charge-offs % (qtr annualized) 2 2.42% 1.63% 1.81% 6.02% 2.64% 4.42% 1.61% 1.87% 2.42%
1 Includes accruing loans only.
2 Ratio based on period-end loans.
50
Loan portfolio statistics
Marshall & Ilsley Corporation
Total Commercial Real Estate Loans 1 4Q08 1Q09 2Q09 3Q09 4Q09 1Q10 2Q10 3Q10 4Q10
Period-end loans ($ millions) 12,541.5 12,998.9 13,938.3 13,884.3 13,645.9 13,532.0 13,310.5 13,057.2 12,401.3
% Total loans 25.1% 26.4% 28.9% 30.1% 30.9% 31.7% 32.2% 32.9% 33.5%
30-89 day delinquency ($ millions) 3 104.7 482.2 231.2 111.4 94.0 116.2 76.8 99.1 70.0
30-89 day delinquency % 0.83% 3.71% 1.66% 0.80% 0.69% 0.86% 0.58% 0.76% 0.56%
Nonaccrual loans ($ millions) 178.3 286.6 559.2 509.6 584.9 657.1 655.7 482.9 572.8
Nonaccrual loans % 1.42% 2.20% 4.01% 3.67% 4.29% 4.86% 4.93% 3.70% 4.62%
Net charge-offs ($ millions) 72.1 34.0 55.3 69.6 78.4 53.4 98.8 284.8 141.2
Net charge-offs % (qtr annualized) 4 2.29% 1.06% 1.59% 1.99% 2.28% 1.60% 2.98% 8.65% 4.52%
Residential Real Estate Loans 2 4Q08 1Q09 2Q09 3Q09 4Q09 1Q10 2Q10 3Q10 4Q10
Period-end loans ($ millions) 5,733.9 5,711.0 5,464.6 5,135.2 4,968.9 4,823.8 4,625.0 4,578.8 4,341.3
% Total loans 11.5% 11.6% 11.3% 11.1% 11.2% 11.3% 11.2% 11.5% 11.7%
30-89 day delinquency ($ millions) 3 229.7 250.9 194.6 178.2 188.0 159.9 172.0 191.6 164.1
30-89 day delinquency % 4.01% 4.39% 3.56% 3.47% 3.78% 3.31% 3.72% 4.19% 3.78%
Nonaccrual loans ($ millions) 221.8 291.9 285.7 236.8 206.1 269.6 252.3 261.1 273.8
Nonaccrual loans % 3.87% 5.11% 5.23% 4.61% 4.15% 5.59% 5.45% 5.70% 6.31%
Net charge-offs ($ millions) 18.9 27.8 204.5 47.2 75.3 32.4 39.0 49.8 46.5
Net charge-offs % (qtr annualized) 4 1.31% 1.97% 15.01% 3.65% 6.01% 2.73% 3.38% 4.32% 4.25%
1 Does not include commercial land & construction loans. 3 Includes accruing loans only.
2 Does not include residential land & residential construction loans. 4 Ratio based on period-end loans.
51
Loan portfolio statistics
Marshall & Ilsley Corporation
Total Construction andDevelopment Loans 1 4Q08 1Q09 2Q09 3Q09 4Q09 1Q10 2Q10 3Q10 4Q10
Period-end loans ($ millions) 9,043.3 8,251.4 6,829.3 6,314.2 5,538.9 5,105.6 4,418.5 3,616.9 3,201.7
% Total loans 18.1% 16.8% 14.2% 13.7% 12.5% 12.0% 10.7% 9.1% 8.7%
30-89 day delinquency ($ millions) 2 402.9 578.1 289.8 222.1 136.7 135.0 81.6 95.4 83.3
30-89 day delinquency % 4.46% 7.01% 4.24% 3.52% 2.47% 2.64% 1.85% 2.64% 2.60%
Nonaccrual loans ($ millions) 882.0 1,070.6 1,043.4 984.5 807.5 681.5 561.0 528.6 435.8
Nonaccrual loans % 9.75% 12.97% 15.28% 15.59% 14.58% 13.35% 12.70% 14.61% 13.61%
Net charge-offs ($ millions) 461.7 176.4 235.3 171.5 270.3 159.7 207.5 132.6 123.7
Net charge-offs % (qtr annualized) 3 20.31% 8.67% 13.82% 10.77% 19.36% 12.68% 18.84% 14.54% 15.33%
Home Equity Loans & Lines 4Q08 1Q09 2Q09 3Q09 4Q09 1Q10 2Q10 3Q10 4Q10
Period-end loans ($ millions) 5,082.0 5,025.1 4,911.5 4,812.6 4,714.6 4,590.1 4,487.4 4,366.7 4,212.8
% Total loans 10.2% 10.2% 10.2% 10.4% 10.7% 10.8% 10.9% 11.0% 11.4%
30-89 day delinquency ($ millions) 2 92.0 81.9 86.3 85.3 70.5 67.3 83.1 84.9 76.7
30-89 day delinquency % 1.81% 1.63% 1.76% 1.77% 1.50% 1.47% 1.85% 1.94% 1.82%
Nonaccrual loans ($ millions) 67.3 83.5 86.4 94.5 84.9 80.0 77.0 84.5 88.2
Nonaccrual loans % 1.32% 1.66% 1.76% 1.96% 1.80% 1.74% 1.72% 1.93% 2.09%
Net charge-offs ($ millions) 20.4 19.4 33.4 29.2 34.6 34.1 30.3 27.9 36.4
Net charge-offs % (qtr annualized) 3 1.59% 1.56% 2.73% 2.40% 2.91% 3.02% 2.71% 2.54% 3.43%
1 Includes commercial land & construction loans. 3 Ratio based on period-end loans.
2 Includes accruing loans only.
52
Adjusted reserve coverage calculation
Marshall & Ilsley Corporation
Reconciliation of Actual Loan Loss Reserve Coverage Ratio of Nonperforming Loans & Leases
To Adjusted Loan Loss Reserve Coverage Ratio of Nonperforming Loans & Leases
2010 2009
Coverage Ratio Components 4th Qtr % Total 3rd Qtr % Total 2nd Qtr % Total 1st Qtr % Total 4th Qtr % Total
Reserve for Loans & Lease Losses $1,388 100% $1,388 100% $1,517 100% $1,515 100% $1,481 100%
Less Reserve for Specifically Analyzed Nonperforming Loans 86 6% 155 11% 234 15% 228 15% 262 18%
Less Reserve for Renegotiated Loans 75 5% 90 6% 133 9% 132 9% 121 8%
Adjusted Reserve for Loans & Lease Losses $1,227 88% $1,143 82% $1,150 76% $1,155 76% $1,098 74%
Total Nonperforming Loans & Leases $1,568 100% $1,598 100% $1,801 100% $1,954 100% $2,045 100%
Less Specifically Analyzed Nonperforming Loans 1,039 66% 1,064 67% 1,235 69% 1,321 68% 1,417 69%
Adjusted Total Nonperforming Loans & Leases $529 34% $534 33% $566 31% $633 32% $628 31%
Coverage Ratio
Reserve for Loans & Lease Losses /
Total Nonperforming Loans & Leases (Excluding Held for Sale) 90% 89% 88% 80% 75%
Adjusted Reserve for Loans & Lease Losses / Adjusted Total
Nonperforming Loans & Leases (Including Held for Sale) 232% 214% 203% 182% 175%
(1) In addition, partial charge-offs have been taken against the specifically analyzed loans.
Totals may not foot due to rounding.
Reconciliation - Period End Balances Millions $
(1)
53
Adjusted earnings calculation
Marshall & Ilsley Corporation
3 Months 3 Months 3 Months 3 Months 3 Months Ended Ended Ended Ended Ended Full Year
12/31/10 09/30/10 06/30/10 03/31/10 12/31/09 2010 2009 2008 2007 2006
Adjusted Pre-Tax Pre-ProvisionIncome from Continuing Operations $225.9 $185.0 $187.9 $259.1 $234.7 $858.0 $918.8 $1,069.8 $1,030.4 $1,005.7 Goodwill Impairment - - - - - (1,535.1) - - Pre-Tax Provision for Loan & Lease Losses (429.1) (431.7) (439.9) (458.1) (639.0) (1,758.9) (2,314.6) (2,037.7) (319.8) (50.6) Total Adjustments (429.1) (431.7) (439.9) (458.1) (639.0) (1,758.9) (2,314.6) (3,572.8) (319.8) (50.6) Pre-Tax Income (Loss) (203.2) (246.7) (252.0) (199.0) (404.3) (900.9) (1,395.8) (2,503.0) 710.6 955.1
Provision (Benefit) for Income Taxes (95.1) (102.8) (103.4) (83.6) (170.0) (385.0) (637.2) (459.5) 213.7 307.4 Income (Loss) from Continuing Operations (108.1) (143.9) (148.6) (115.4) (234.3) (515.9) (758.6) (2,043.5) 496.9 647.7
Discontinued Operations, net of tax: Separation Transaction Costs - - - - - - - - (25.3) - Gain on Sale of Metavante - - - - - - - - 525.6 - Metavante Net Income - - - - - - - - 153.7 160.1 Net Income (Loss) Attributable to M&I (108.1) (143.9) (148.6) (115.4) (234.3) (515.9) (758.6) (2,043.5) 1,150.9 807.8Preferred Dividends (25.3) (25.3) (25.2) (25.1) (25.2) (101.0) (100.2) (12.7) - - Net Income (Loss) Avail. to Common Shareholders ($133.4) ($169.2) ($173.8) ($140.5) ($259.5) ($616.9) ($858.8) ($2,056.2) $1,150.9 $807.8
Reconciliation - Millions $
Marshall & Ilsley Corporation
Reconciliation of Adjusted Pre-Tax Pre-Provision Income from Continuing Operations to
Net Income (Loss) Available to Common Shareholders